Generational Growth AI, data centers and the coming US power demand surge
 AI Summary
Key Insights
- Global data center power demand is projected to more than double by 2030, driven by AI, broader demand, and decelerating energy efficiency gains.
- This growth is expected to accelerate US electricity demand CAGR to 2.4% through 2030, requiring Utilities to invest $50 billion in new power generation capacity.
- Supporting this data center driven load growth will require a split between gas and renewables, and is expected to drive incremental natural gas demand.
- The report believes downstream investment opportunities in utilities, renewable generation, and industrials are currently underappreciated, especially those supporting transmission, generation and distribution.
![EQUITY RESEARCH | April 28, 2024 | 10:34PM EDT
Goldman Sachs does and seeks to do business with companies covered in its research reports. As a
result, investors should be aware that the firm may have a conflict of interest that could affect the
objectivity of this report. Investors should consider this report as only a single factor in making their
investment decision. For Reg AC certification and other important disclosures, see the Disclosure
Appendix, or go to www.gs.com/research/hedge.html. Analysts employed by non-US affiliates are not
registered/qualified as research analysts with FINRA in the U.S.
The Goldman Sachs Group, Inc.
Carly Davenport
+1(212)357-1914
carly.davenport@gs.com
Goldman Sachs & Co. LLC
AI, data centers and the coming US power demand surge
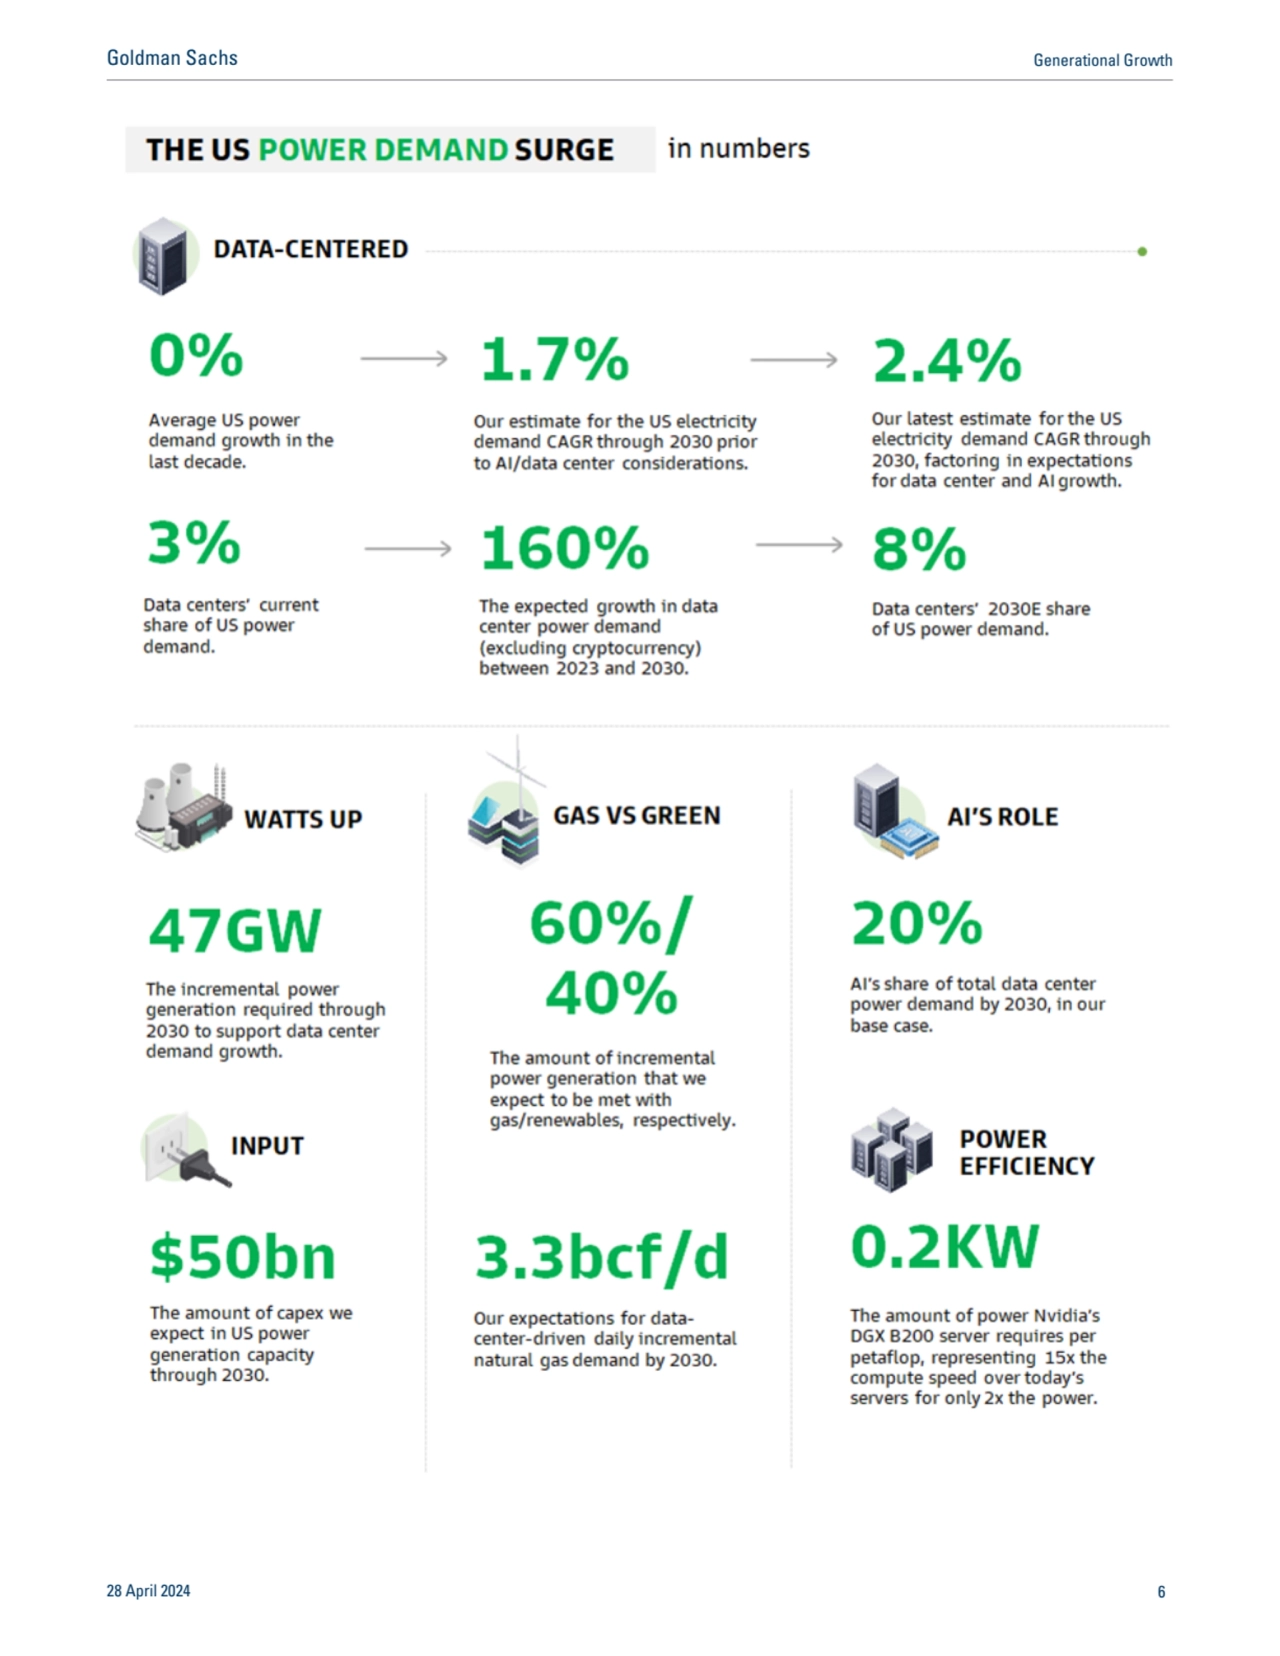
Driven by AI, broader demand and a deceleration in the pace of energy efficiency gains, global data center power demand is poised
to more than double by 2030 after being flattish in 2015-20. This growth is the primary catalyst alongside increasing
manufacturing/industrial production and broader electrification trends, to an acceleration in US electricity demand CAGR to 2.4%
through the end of the decade from 0% in the last decade. We believe supporting data center driven load growth will require
investment by Utilities of $50 bn in new power generation capacity. We assume a 60/40 split between gas and renewables, which
we expect to drive ~3.3 bcf/d incremental natural gas demand by 2030. While investor interest in the AI revolution theme is not
new, we believe downstream investment opportunities in utilities, renewable generation and industrials whose investment and
products will be needed to support this growth are underappreciated.
Brian Singer, CFA
+1(212)902-8259
brian.singer@gs.com
Goldman Sachs & Co. LLC
Neil Mehta
+1(212)357-4042
neil.mehta@gs.com
Goldman Sachs & Co. LLC
Brian Lee, CFA
+1(917)343-3110
brian.k.lee@gs.com
Goldman Sachs & Co. LLC
John Mackay
+1(212)357-5379
john.mackay@gs.com
Goldman Sachs & Co. LLC
See full list of authors inside
Note: The following is a redacted version of the original report published April 28, 2024 [43 pages].](https://d2z384uprhdr6y.cloudfront.net/aiKTXffie1lp7awfEoRVs3L3ixOpKVeZujNK0qtTIJk/rt:fill/q:100/w:1280/h:0/gravity:sm/czM6Ly9qYXVudC1wcm9kdWN0aW9uLXVwbG9hZHMvMjAyNC8xMi8xNy81YWU1ZjEwYi04Zjk1LTQxNmEtYmM4Yy1kM2E4YjIzZDNjNWYvc2xpZGVfMS1sLndlYnA=.webp)

Generational Growth AI, data centers and the coming US power demand surge
- 1. EQUITY RESEARCH | April 28, 2024 | 10:34PM EDT Goldman Sachs does and seeks to do business with companies covered in its research reports. As a result, investors should be aware that the firm may have a conflict of interest that could affect the objectivity of this report. Investors should consider this report as only a single factor in making their investment decision. For Reg AC certification and other important disclosures, see the Disclosure Appendix, or go to www.gs.com/research/hedge.html. Analysts employed by non-US affiliates are not registered/qualified as research analysts with FINRA in the U.S. The Goldman Sachs Group, Inc. Carly Davenport +1(212)357-1914 carly.davenport@gs.com Goldman Sachs & Co. LLC AI, data centers and the coming US power demand surge Driven by AI, broader demand and a deceleration in the pace of energy efficiency gains, global data center power demand is poised to more than double by 2030 after being flattish in 2015-20. This growth is the primary catalyst alongside increasing manufacturing/industrial production and broader electrification trends, to an acceleration in US electricity demand CAGR to 2.4% through the end of the decade from 0% in the last decade. We believe supporting data center driven load growth will require investment by Utilities of $50 bn in new power generation capacity. We assume a 60/40 split between gas and renewables, which we expect to drive ~3.3 bcf/d incremental natural gas demand by 2030. While investor interest in the AI revolution theme is not new, we believe downstream investment opportunities in utilities, renewable generation and industrials whose investment and products will be needed to support this growth are underappreciated. Brian Singer, CFA +1(212)902-8259 brian.singer@gs.com Goldman Sachs & Co. LLC Neil Mehta +1(212)357-4042 neil.mehta@gs.com Goldman Sachs & Co. LLC Brian Lee, CFA +1(917)343-3110 brian.k.lee@gs.com Goldman Sachs & Co. LLC John Mackay +1(212)357-5379 john.mackay@gs.com Goldman Sachs & Co. LLC See full list of authors inside Note: The following is a redacted version of the original report published April 28, 2024 [43 pages].
- 2. Authors Carly Davenport +1 212 357-1914 carly.davenport@gs.com Goldman Sachs & Co. LLC Brian Lee, CFA +1 917 343-3110 brian.k.lee@gs.com Goldman Sachs & Co. LLC Brendan Corbett +1 415 249-7440 brendan.corbett@gs.com Goldman Sachs & Co. LLC Joe Ritchie +1 212 357-8914 joseph.ritchie@gs.com Goldman Sachs & Co. LLC Jaskaran Jaiya +1 332 245-7709 jaskaran.jaiya@gs.com Goldman Sachs India SPL Varsha Venugopal +1 415 393-7554 varsha.venugopal@gs.com Goldman Sachs & Co. LLC Nick Cash +1 212 357-6372 nick.cash@gs.com Goldman Sachs & Co. LLC Olivia Halferty +1 801 212-7314 olivia.halferty@gs.com Goldman Sachs & Co. LLC Brian Singer, CFA +1 212 902-8259 brian.singer@gs.com Goldman Sachs & Co. LLC John Mackay +1 212 357-5379 john.mackay@gs.com Goldman Sachs & Co. LLC John Miller +1 646 446-0292 john.y.miller@gs.com Goldman Sachs & Co. LLC Mark Delaney, CFA +1 212 357-0535 mark.delaney@gs.com Goldman Sachs & Co. LLC Neil Mehta +1 212 357-4042 neil.mehta@gs.com Goldman Sachs & Co. LLC Ati Modak +1 212 902-9365 ati.modak@gs.com Goldman Sachs & Co. LLC Toshiya Hari +1 646 446-1759 toshiya.hari@gs.com Goldman Sachs & Co. LLC Jerry Revich, CFA +1 212 902-4116 jerry.revich@gs.com Goldman Sachs & Co. LLC
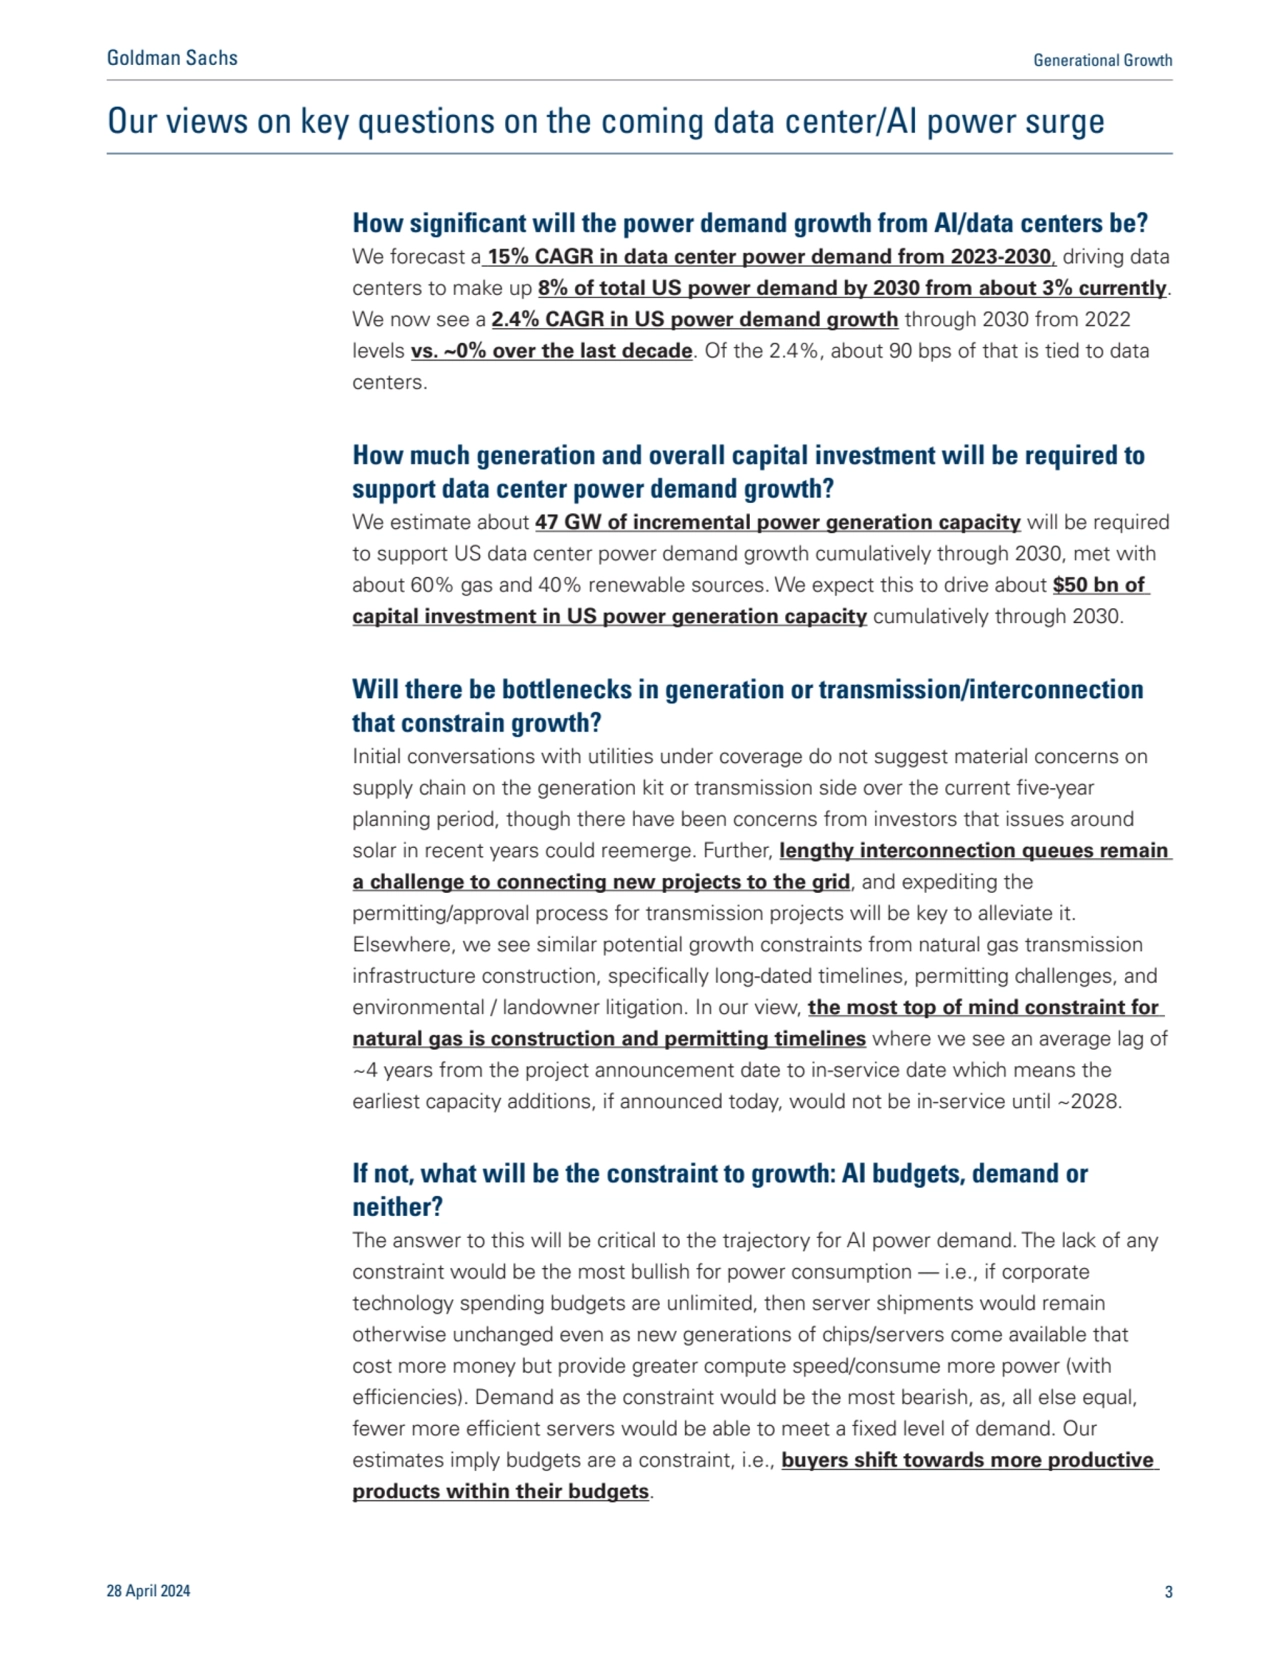
- 3. Our views on key questions on the coming data center/AI power surge How significant will the power demand growth from AI/data centers be? We forecast a 15% CAGR in data center power demand from 2023-2030, driving data centers to make up 8% of total US power demand by 2030 from about 3% currently. We now see a 2.4% CAGR in US power demand growth through 2030 from 2022 levels vs. ~0% over the last decade. Of the 2.4%, about 90 bps of that is tied to data centers. How much generation and overall capital investment will be required to support data center power demand growth? We estimate about 47 GW of incremental power generation capacity will be required to support US data center power demand growth cumulatively through 2030, met with about 60% gas and 40% renewable sources. We expect this to drive about $50 bn of capital investment in US power generation capacity cumulatively through 2030. Will there be bottlenecks in generation or transmission/interconnection that constrain growth? Initial conversations with utilities under coverage do not suggest material concerns on supply chain on the generation kit or transmission side over the current five-year planning period, though there have been concerns from investors that issues around solar in recent years could reemerge. Further, lengthy interconnection queues remain a challenge to connecting new projects to the grid, and expediting the permitting/approval process for transmission projects will be key to alleviate it. Elsewhere, we see similar potential growth constraints from natural gas transmission infrastructure construction, specifically long-dated timelines, permitting challenges, and environmental / landowner litigation. In our view, the most top of mind constraint for natural gas is construction and permitting timelines where we see an average lag of ~4 years from the project announcement date to in-service date which means the earliest capacity additions, if announced today, would not be in-service until ~2028. If not, what will be the constraint to growth: AI budgets, demand or neither? The answer to this will be critical to the trajectory for AI power demand. The lack of any constraint would be the most bullish for power consumption — i.e., if corporate technology spending budgets are unlimited, then server shipments would remain otherwise unchanged even as new generations of chips/servers come available that cost more money but provide greater compute speed/consume more power (with efficiencies). Demand as the constraint would be the most bearish, as, all else equal, fewer more efficient servers would be able to meet a fixed level of demand. Our estimates imply budgets are a constraint, i.e., buyers shift towards more productive products within their budgets. 28 April 2024 3 Goldman Sachs Generational Growth
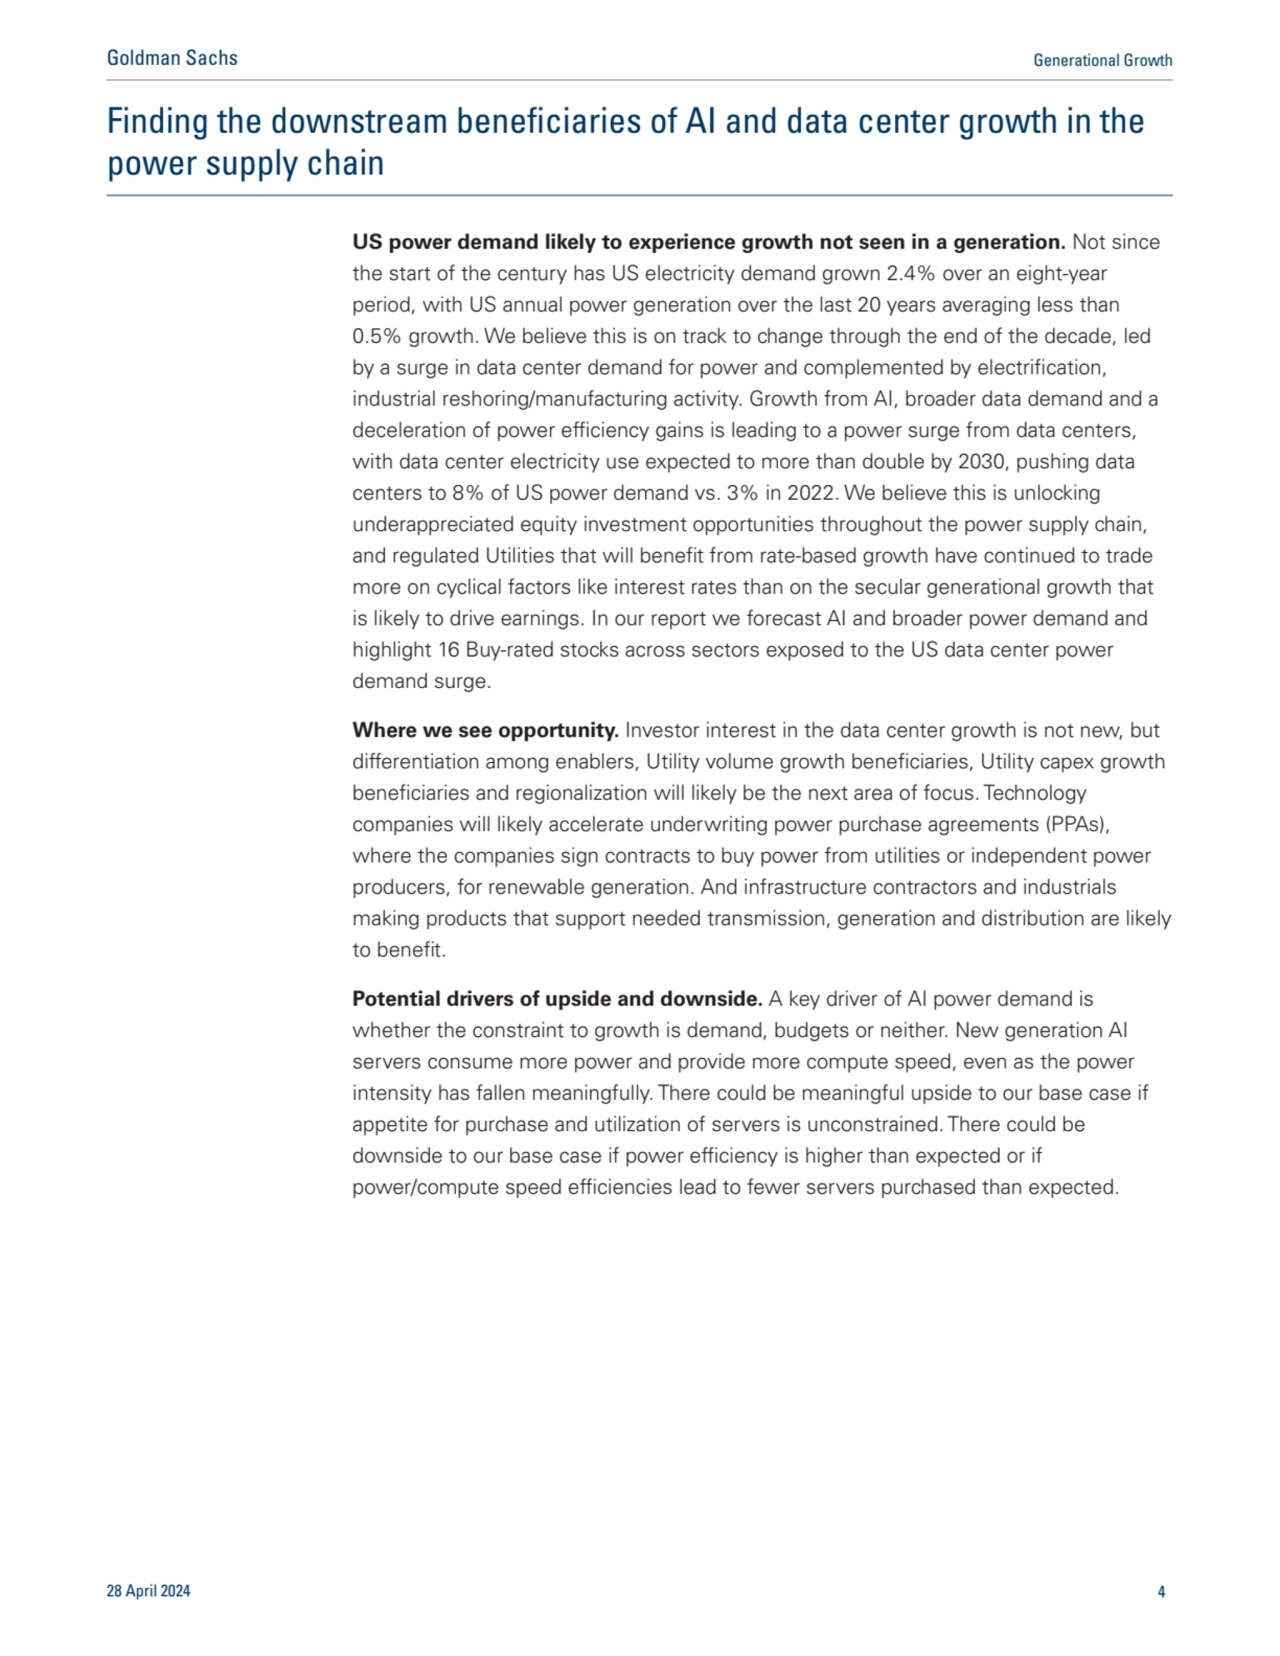
- 4. Finding the downstream beneficiaries of AI and data center growth in the power supply chain US power demand likely to experience growth not seen in a generation. Not since the start of the century has US electricity demand grown 2.4% over an eight-year period, with US annual power generation over the last 20 years averaging less than 0.5% growth. We believe this is on track to change through the end of the decade, led by a surge in data center demand for power and complemented by electrification, industrial reshoring/manufacturing activity. Growth from AI, broader data demand and a deceleration of power efficiency gains is leading to a power surge from data centers, with data center electricity use expected to more than double by 2030, pushing data centers to 8% of US power demand vs. 3% in 2022. We believe this is unlocking underappreciated equity investment opportunities throughout the power supply chain, and regulated Utilities that will benefit from rate-based growth have continued to trade more on cyclical factors like interest rates than on the secular generational growth that is likely to drive earnings. In our report we forecast AI and broader power demand and highlight 16 Buy-rated stocks across sectors exposed to the US data center power demand surge. Where we see opportunity. Investor interest in the data center growth is not new, but differentiation among enablers, Utility volume growth beneficiaries, Utility capex growth beneficiaries and regionalization will likely be the next area of focus. Technology companies will likely accelerate underwriting power purchase agreements (PPAs), where the companies sign contracts to buy power from utilities or independent power producers, for renewable generation. And infrastructure contractors and industrials making products that support needed transmission, generation and distribution are likely to benefit. Potential drivers of upside and downside. A key driver of AI power demand is whether the constraint to growth is demand, budgets or neither. New generation AI servers consume more power and provide more compute speed, even as the power intensity has fallen meaningfully. There could be meaningful upside to our base case if appetite for purchase and utilization of servers is unconstrained. There could be downside to our base case if power efficiency is higher than expected or if power/compute speed efficiencies lead to fewer servers purchased than expected. 28 April 2024 4 Goldman Sachs Generational Growth
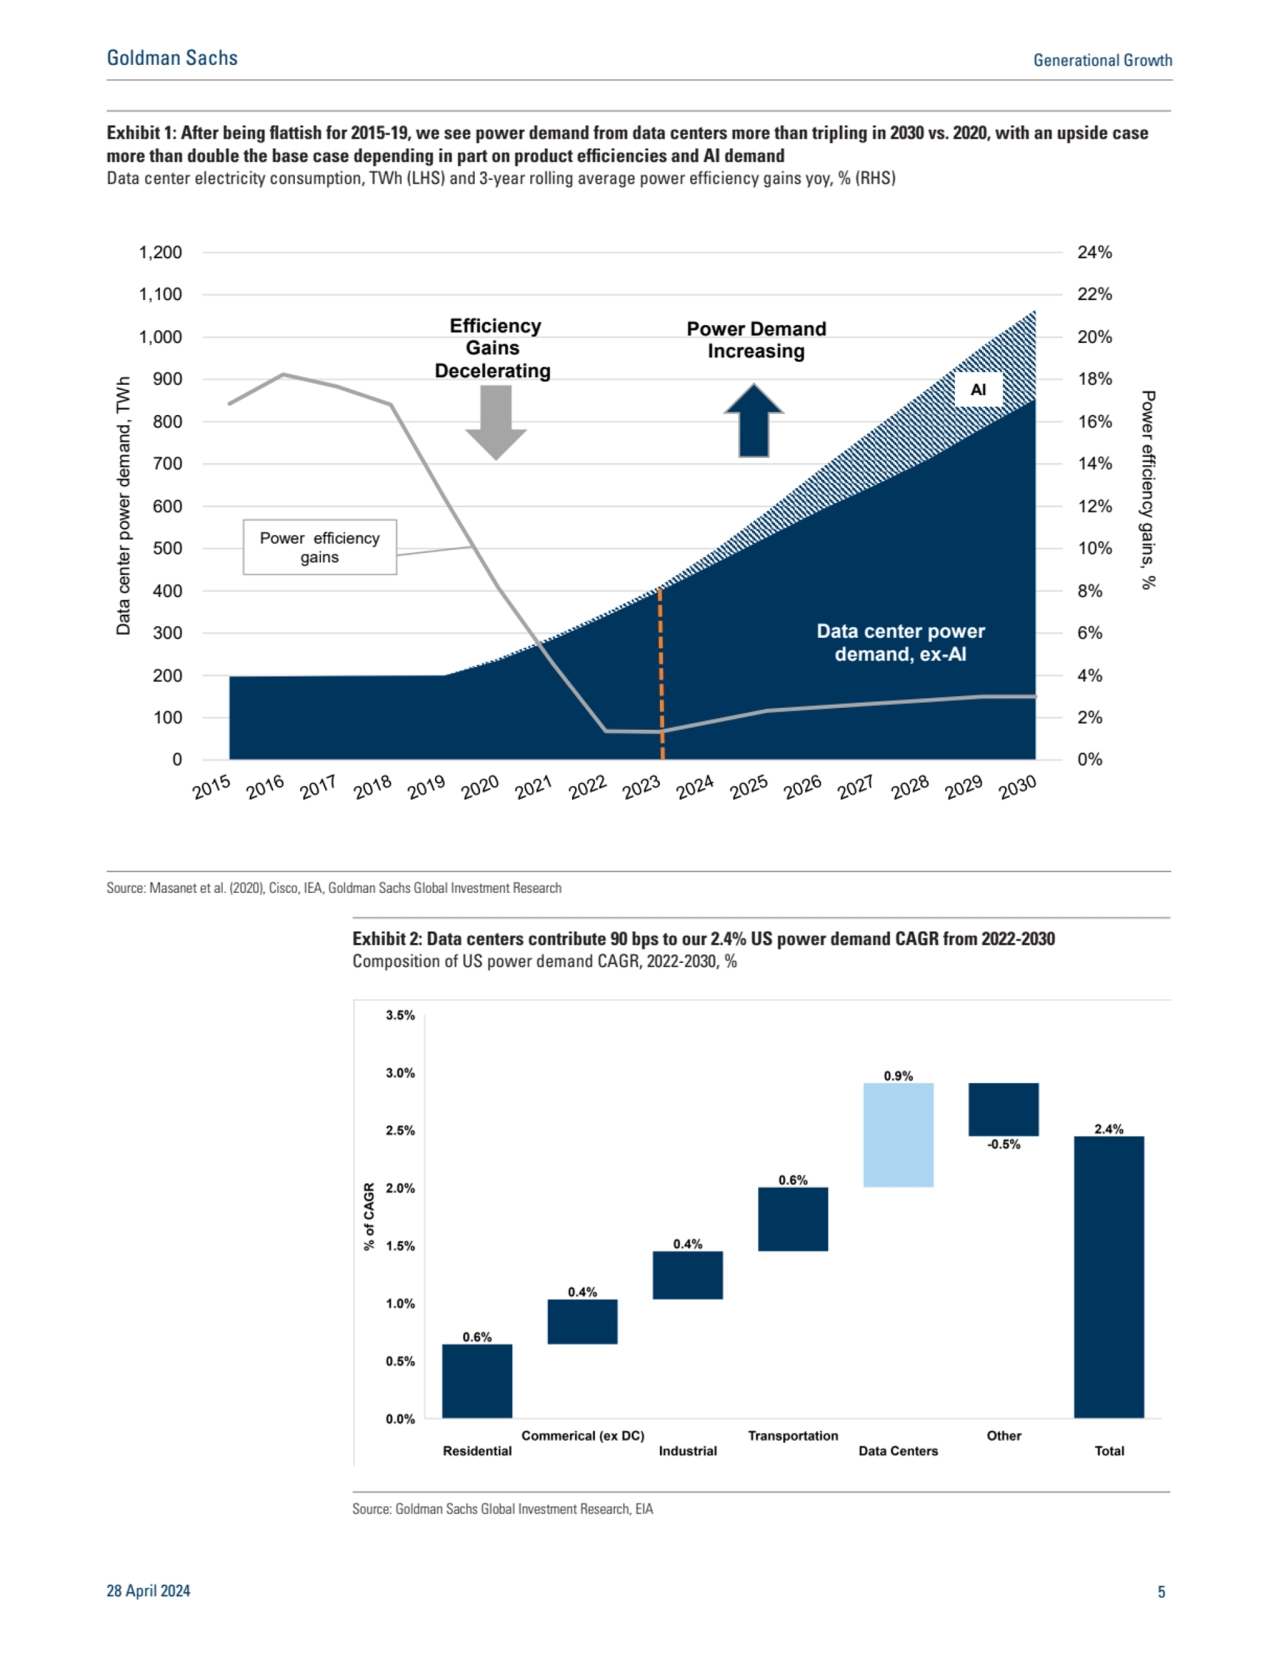
- 5. Exhibit 1: After being flattish for 2015-19, we see power demand from data centers more than tripling in 2030 vs. 2020, with an upside case more than double the base case depending in part on product efficiencies and AI demand Data center electricity consumption, TWh (LHS) and 3-year rolling average power efficiency gains yoy, % (RHS) 0% 2% 4% 6% 8% 10% 12% 14% 16% 18% 20% 22% 24% 0 100 200 300 400 500 600 700 800 900 1,000 1,100 1,200 Power efficiency gains, % Data center power demand, TWh Data center power demand, ex-AI AI Efficiency Gains Decelerating Power efficiency gains Power Demand Increasing Source: Masanet et al. (2020), Cisco, IEA, Goldman Sachs Global Investment Research Exhibit 2: Data centers contribute 90 bps to our 2.4% US power demand CAGR from 2022-2030 Composition of US power demand CAGR, 2022-2030, % Source: Goldman Sachs Global Investment Research, EIA 28 April 2024 5 Goldman Sachs Generational Growth
- 6. 28 April 2024 6 Goldman Sachs Generational Growth
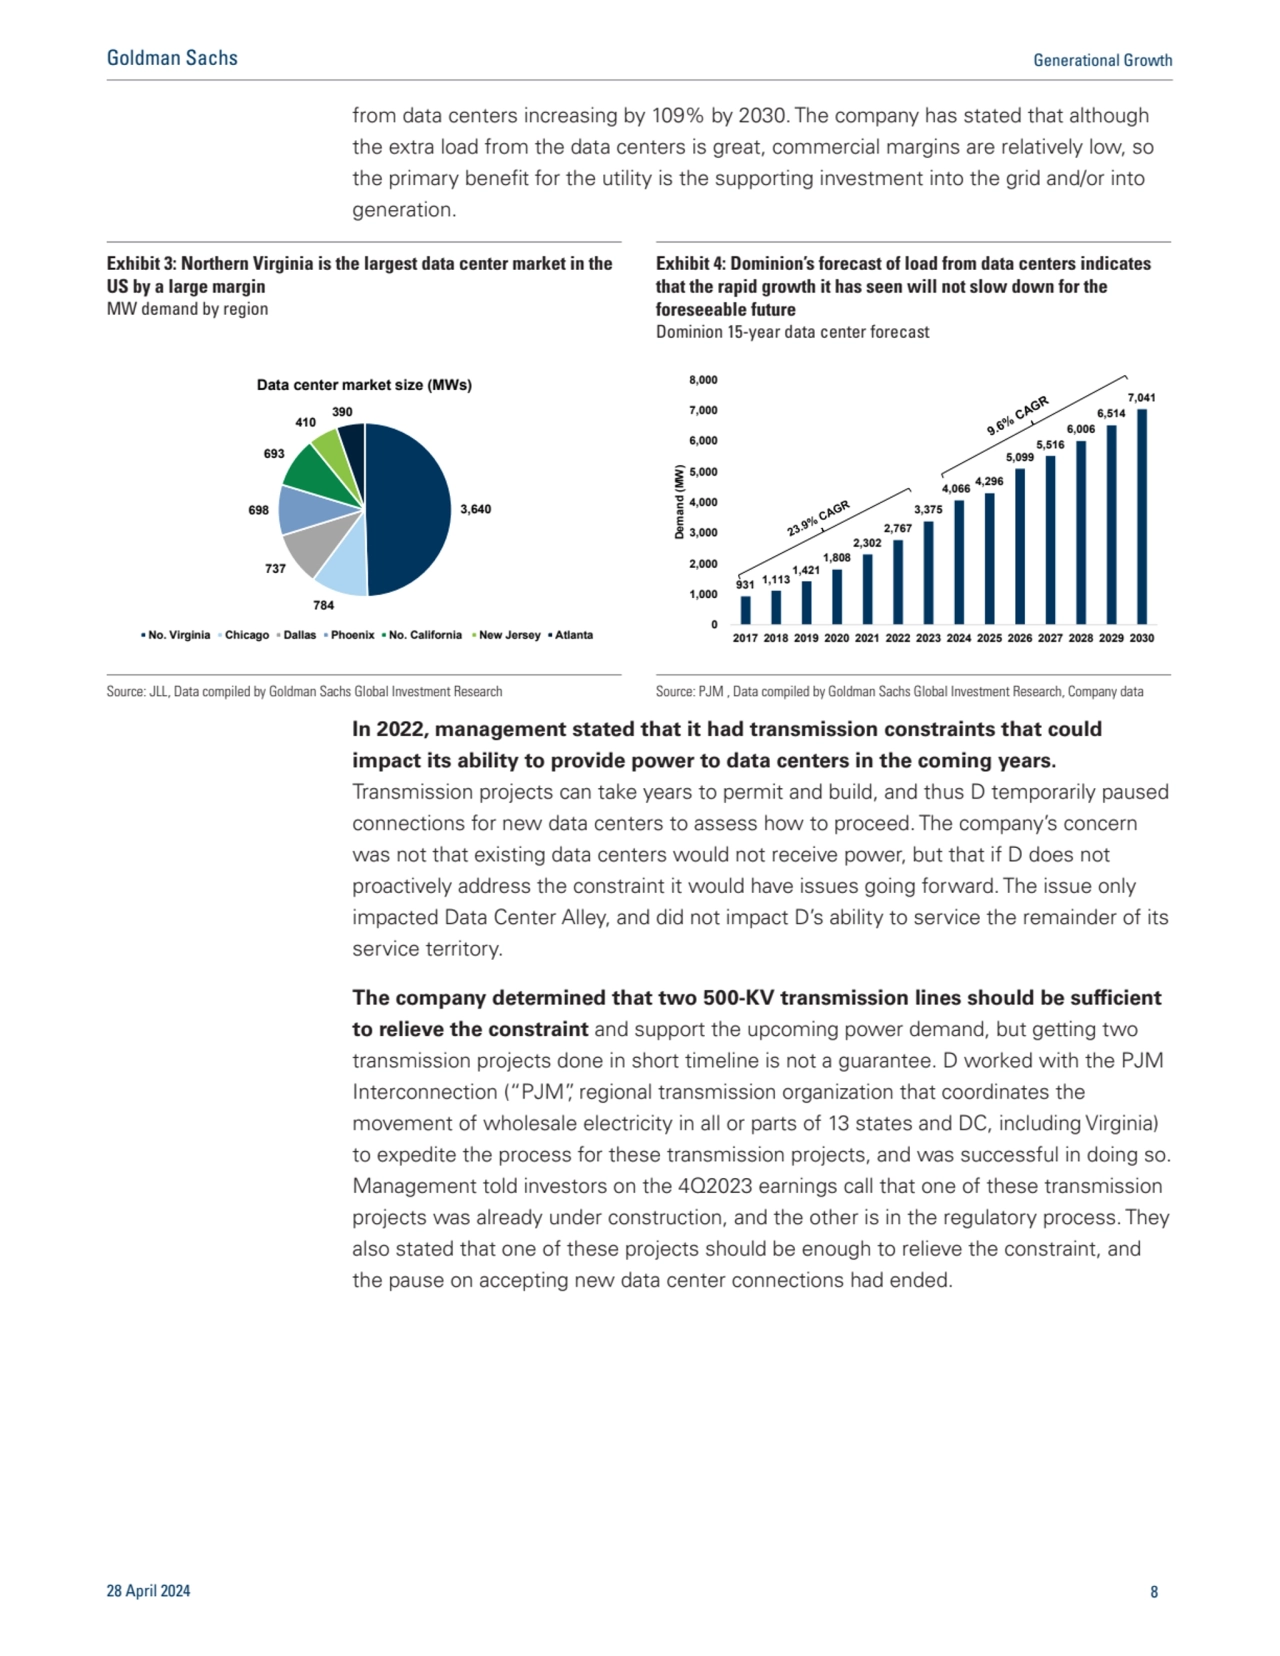
- 7. Case study: How Dominion is handling power demand growth from data centers in Northern Virginia Northern Virginia has been the data center capital in the US by a fairly significant margin. Northern Virginia currently has more data centers than the next five biggest markets in the US combined. The explosive growth of data centers in this region over the last decade or so was due to a number of factors including low cost of energy on a relative basis, and state tax incentives for data centers. Although these data centers are a positive for the local and state economy, they present a significant challenge and opportunity for the local utility Dominion Energy (D, Not Rated). These data centers are primarily located within Eastern Loudoun County, which is known as “data center alley”, and having so many energy intensive buildings in one small area can create issues for the local utility. D presented PJM with a 15-year forecast for data centers in 2023, which highlighted the extreme growth that it has seen in data center alley over the last 7 years. The data center power demand in D’s service territory grew at a nearly 24% CAGR from 2017-2023, and the forecast it presented implies just under a 10% CAGR going forward. The lower CAGR is largely due to the larger base, as the average MWs added each year are higher in 2024-2030 than is previous years. The rise of AI is expected to accelerate the growth of data centers, and some of D’s latest forecasts have the power demand 28 April 2024 7 Goldman Sachs Generational Growth
- 8. from data centers increasing by 109% by 2030. The company has stated that although the extra load from the data centers is great, commercial margins are relatively low, so the primary benefit for the utility is the supporting investment into the grid and/or into generation. In 2022, management stated that it had transmission constraints that could impact its ability to provide power to data centers in the coming years. Transmission projects can take years to permit and build, and thus D temporarily paused connections for new data centers to assess how to proceed. The company’s concern was not that existing data centers would not receive power, but that if D does not proactively address the constraint it would have issues going forward. The issue only impacted Data Center Alley, and did not impact D’s ability to service the remainder of its service territory. The company determined that two 500-KV transmission lines should be sufficient to relieve the constraint and support the upcoming power demand, but getting two transmission projects done in short timeline is not a guarantee. D worked with the PJM Interconnection (“PJM”, regional transmission organization that coordinates the movement of wholesale electricity in all or parts of 13 states and DC, including Virginia) to expedite the process for these transmission projects, and was successful in doing so. Management told investors on the 4Q2023 earnings call that one of these transmission projects was already under construction, and the other is in the regulatory process. They also stated that one of these projects should be enough to relieve the constraint, and the pause on accepting new data center connections had ended. Exhibit 3: Northern Virginia is the largest data center market in the US by a large margin MW demand by region Exhibit 4: Dominion’s forecast of load from data centers indicates that the rapid growth it has seen will not slow down for the foreseeable future Dominion 15-year data center forecast 3,640 784 737 698 693 410 390 Data center market size (MWs) No. Virginia Chicago Dallas Phoenix No. California New Jersey Atlanta 931 1,113 1,421 1,808 2,302 2,767 3,375 4,066 4,296 5,099 5,516 6,006 6,514 7,041 0 1,000 2,000 3,000 4,000 5,000 6,000 7,000 8,000 2017 2018 2019 2020 2021 2022 2023 2024 2025 2026 2027 2028 2029 2030 Demand (MW) Source: JLL, Data compiled by Goldman Sachs Global Investment Research Source: PJM , Data compiled by Goldman Sachs Global Investment Research, Company data 28 April 2024 8 Goldman Sachs Generational Growth
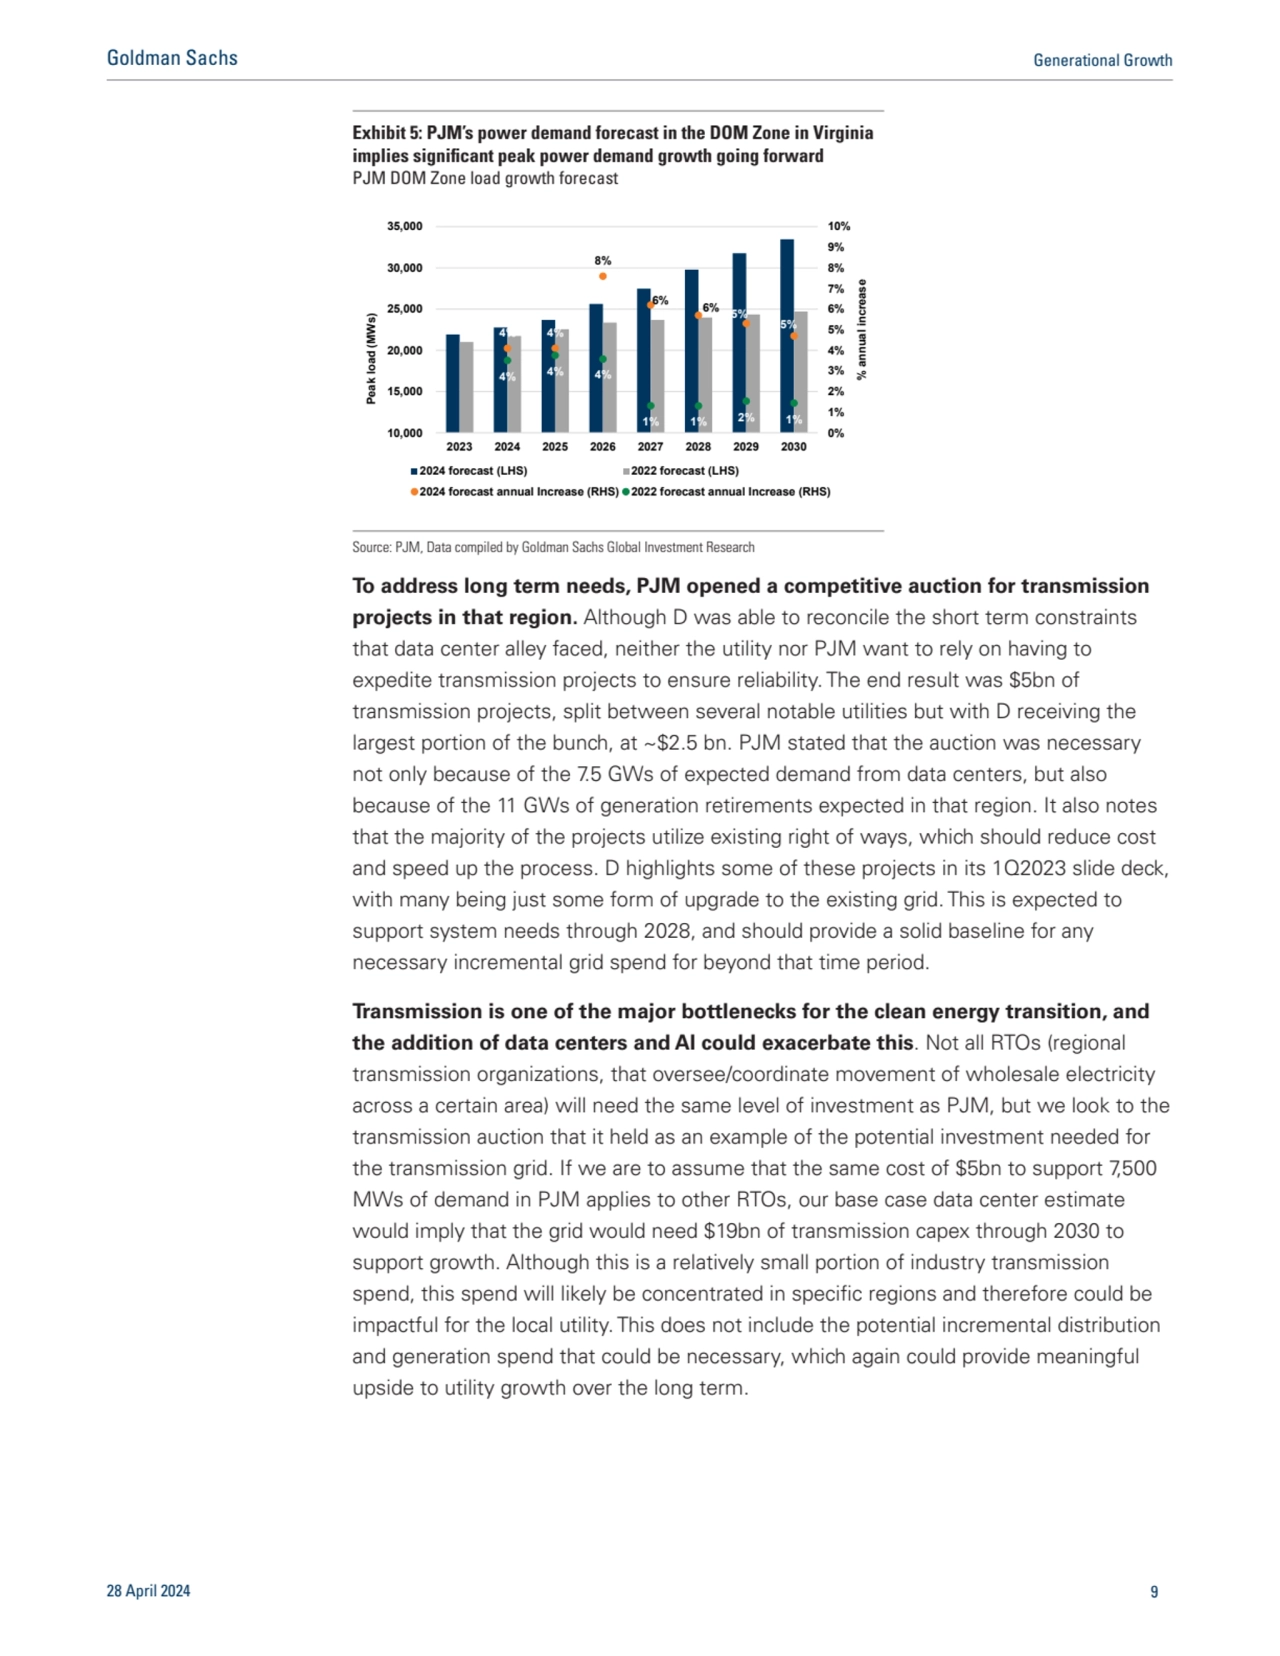
- 9. To address long term needs, PJM opened a competitive auction for transmission projects in that region. Although D was able to reconcile the short term constraints that data center alley faced, neither the utility nor PJM want to rely on having to expedite transmission projects to ensure reliability. The end result was $5bn of transmission projects, split between several notable utilities but with D receiving the largest portion of the bunch, at ~$2.5 bn. PJM stated that the auction was necessary not only because of the 7.5 GWs of expected demand from data centers, but also because of the 11 GWs of generation retirements expected in that region. It also notes that the majority of the projects utilize existing right of ways, which should reduce cost and speed up the process. D highlights some of these projects in its 1Q2023 slide deck, with many being just some form of upgrade to the existing grid. This is expected to support system needs through 2028, and should provide a solid baseline for any necessary incremental grid spend for beyond that time period. Transmission is one of the major bottlenecks for the clean energy transition, and the addition of data centers and AI could exacerbate this. Not all RTOs (regional transmission organizations, that oversee/coordinate movement of wholesale electricity across a certain area) will need the same level of investment as PJM, but we look to the transmission auction that it held as an example of the potential investment needed for the transmission grid. If we are to assume that the same cost of $5bn to support 7,500 MWs of demand in PJM applies to other RTOs, our base case data center estimate would imply that the grid would need $19bn of transmission capex through 2030 to support growth. Although this is a relatively small portion of industry transmission spend, this spend will likely be concentrated in specific regions and therefore could be impactful for the local utility. This does not include the potential incremental distribution and generation spend that could be necessary, which again could provide meaningful upside to utility growth over the long term. Exhibit 5: PJM’s power demand forecast in the DOM Zone in Virginia implies significant peak power demand growth going forward PJM DOM Zone load growth forecast 4% 4% 8% 6% 6% 5% 5% 4% 4% 4% 1% 1% 2% 1% 0% 1% 2% 3% 4% 5% 6% 7% 8% 9% 10% 10,000 15,000 20,000 25,000 30,000 35,000 2023 2024 2025 2026 2027 2028 2029 2030 % annual increase Peak load (MWs) 2024 forecast (LHS) 2022 forecast (LHS) 2024 forecast annual Increase (RHS) 2022 forecast annual Increase (RHS) Source: PJM, Data compiled by Goldman Sachs Global Investment Research 28 April 2024 9 Goldman Sachs Generational Growth
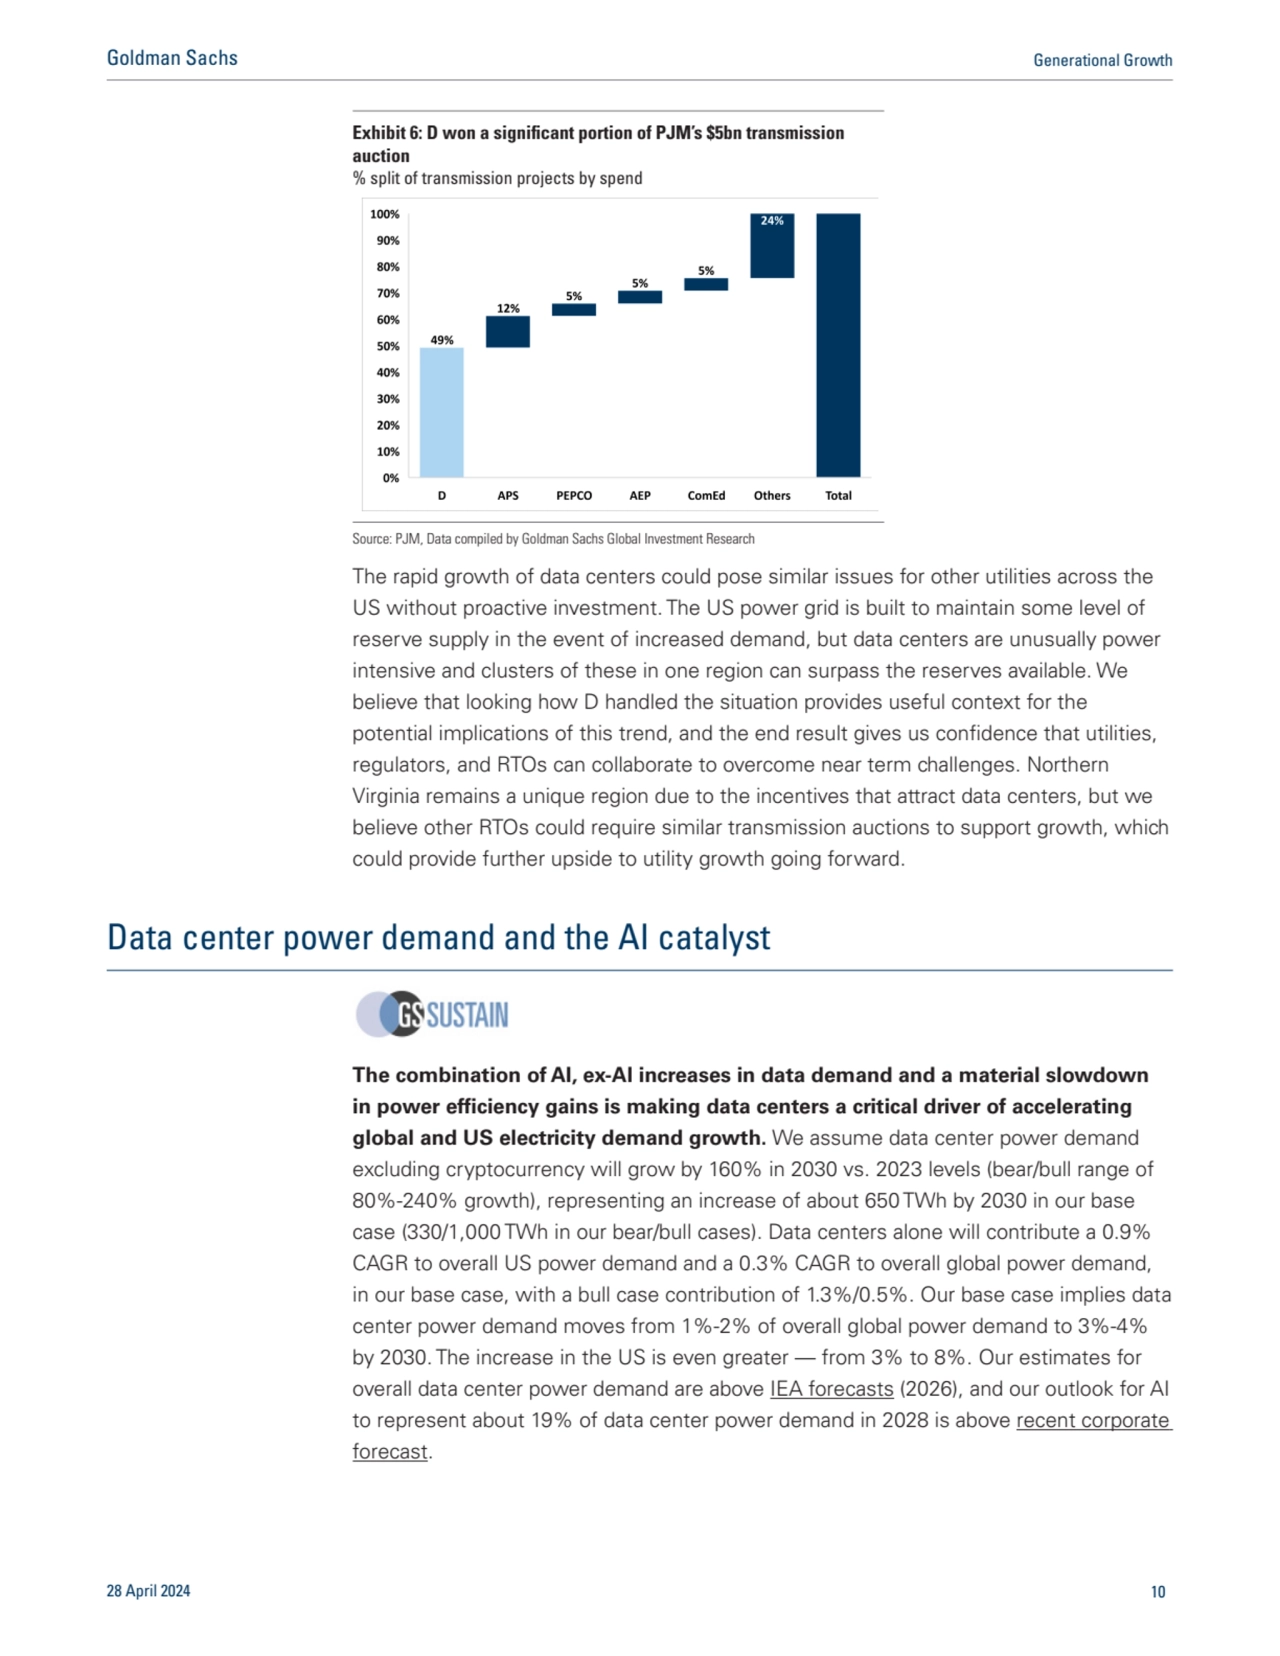
- 10. The rapid growth of data centers could pose similar issues for other utilities across the US without proactive investment. The US power grid is built to maintain some level of reserve supply in the event of increased demand, but data centers are unusually power intensive and clusters of these in one region can surpass the reserves available. We believe that looking how D handled the situation provides useful context for the potential implications of this trend, and the end result gives us confidence that utilities, regulators, and RTOs can collaborate to overcome near term challenges. Northern Virginia remains a unique region due to the incentives that attract data centers, but we believe other RTOs could require similar transmission auctions to support growth, which could provide further upside to utility growth going forward. Data center power demand and the AI catalyst The combination of AI, ex-AI increases in data demand and a material slowdown in power efficiency gains is making data centers a critical driver of accelerating global and US electricity demand growth. We assume data center power demand excluding cryptocurrency will grow by 160% in 2030 vs. 2023 levels (bear/bull range of 80%-240% growth), representing an increase of about 650 TWh by 2030 in our base case (330/1,000 TWh in our bear/bull cases). Data centers alone will contribute a 0.9% CAGR to overall US power demand and a 0.3% CAGR to overall global power demand, in our base case, with a bull case contribution of 1.3%/0.5%. Our base case implies data center power demand moves from 1%-2% of overall global power demand to 3%-4% by 2030. The increase in the US is even greater — from 3% to 8%. Our estimates for overall data center power demand are above IEA forecasts (2026), and our outlook for AI to represent about 19% of data center power demand in 2028 is above recent corporate forecast. Exhibit 6: D won a significant portion of PJM’s $5bn transmission auction % split of transmission projects by spend Source: PJM, Data compiled by Goldman Sachs Global Investment Research 28 April 2024 10 Goldman Sachs Generational Growth
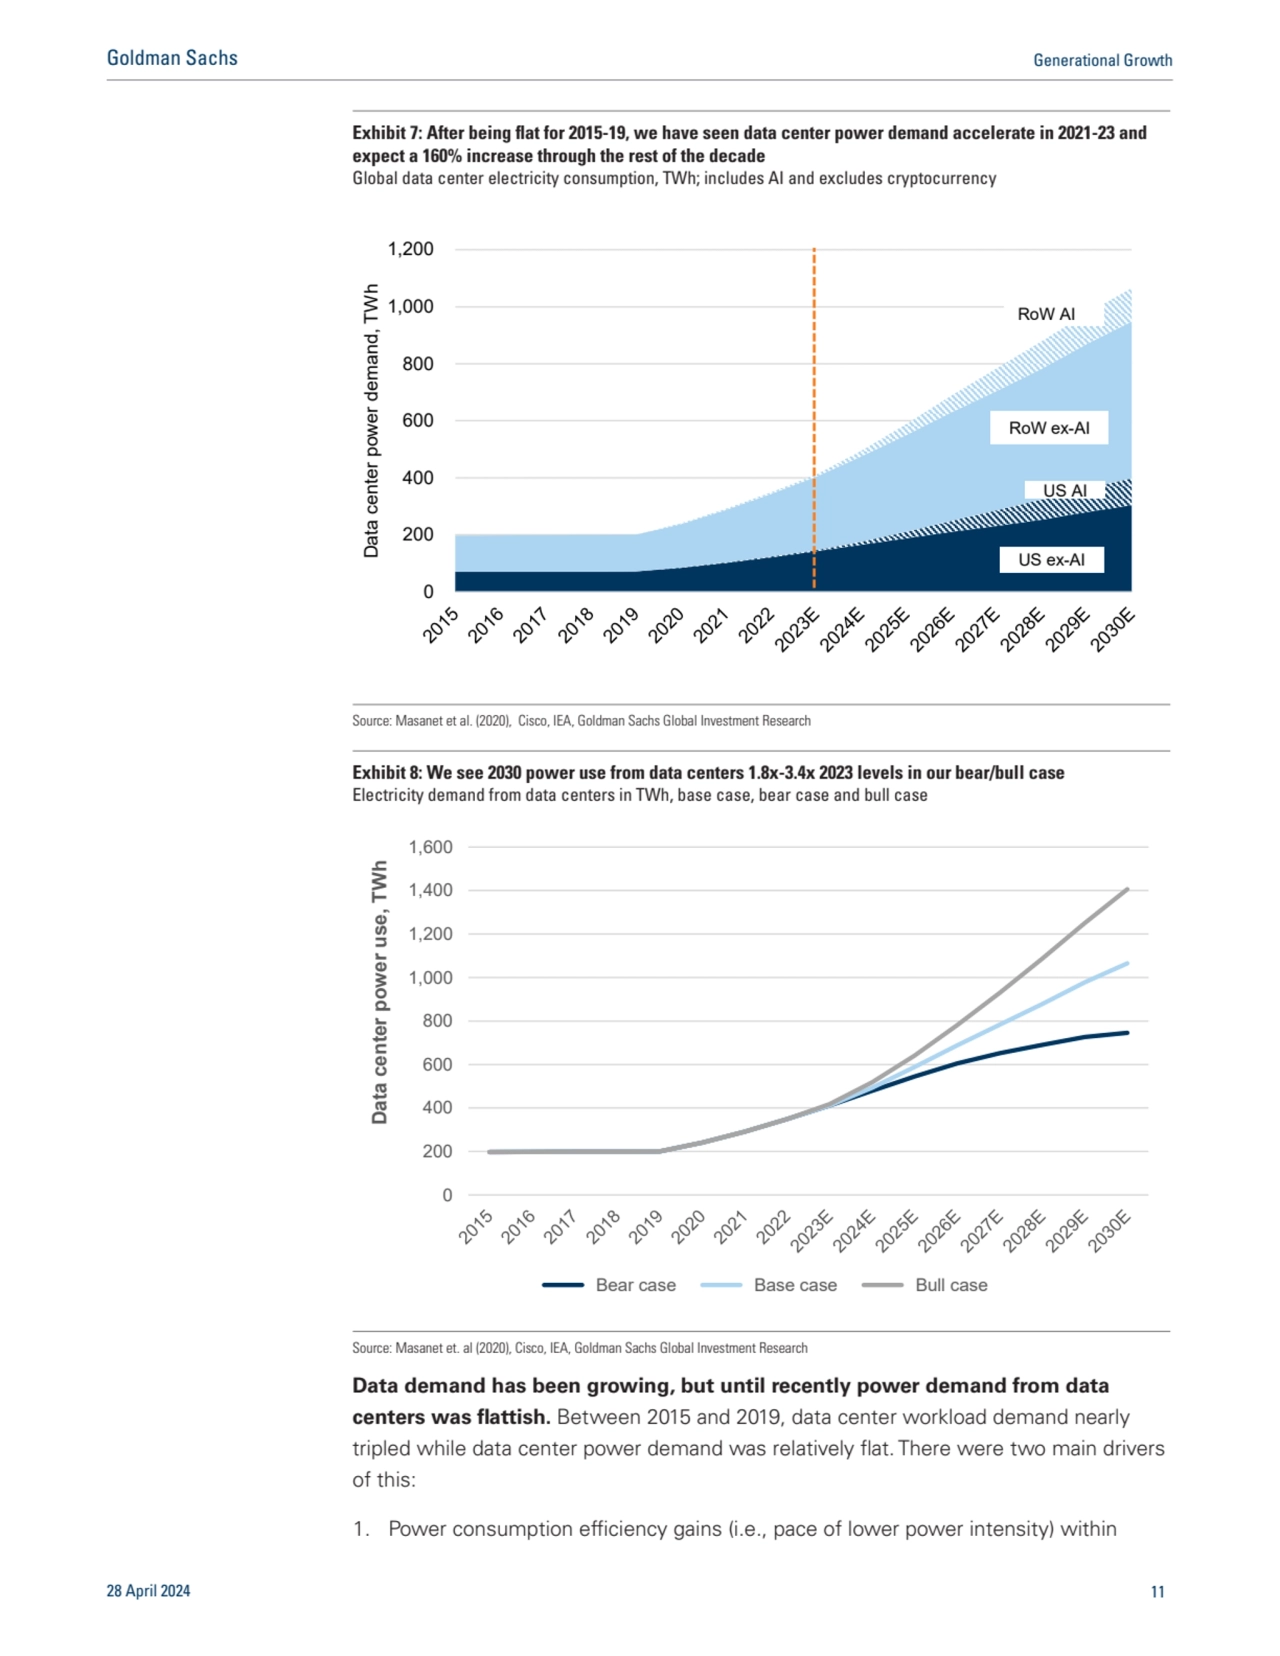
- 11. Data demand has been growing, but until recently power demand from data centers was flattish. Between 2015 and 2019, data center workload demand nearly tripled while data center power demand was relatively flat. There were two main drivers of this: 1. Power consumption efficiency gains (i.e., pace of lower power intensity) within Exhibit 7: After being flat for 2015-19, we have seen data center power demand accelerate in 2021-23 and expect a 160% increase through the rest of the decade Global data center electricity consumption, TWh; includes AI and excludes cryptocurrency 0 200 400 600 800 1,000 1,200 Data center power demand, TWh US ex-AI RoW ex-AI RoW AI US AI Source: Masanet et al. (2020), Cisco, IEA, Goldman Sachs Global Investment Research Exhibit 8: We see 2030 power use from data centers 1.8x-3.4x 2023 levels in our bear/bull case Electricity demand from data centers in TWh, base case, bear case and bull case 0 200 400 600 800 1,000 1,200 1,400 1,600 Data center power use, TWh Bear case Base case Bull case Source: Masanet et. al (2020), Cisco, IEA, Goldman Sachs Global Investment Research 28 April 2024 11 Goldman Sachs Generational Growth
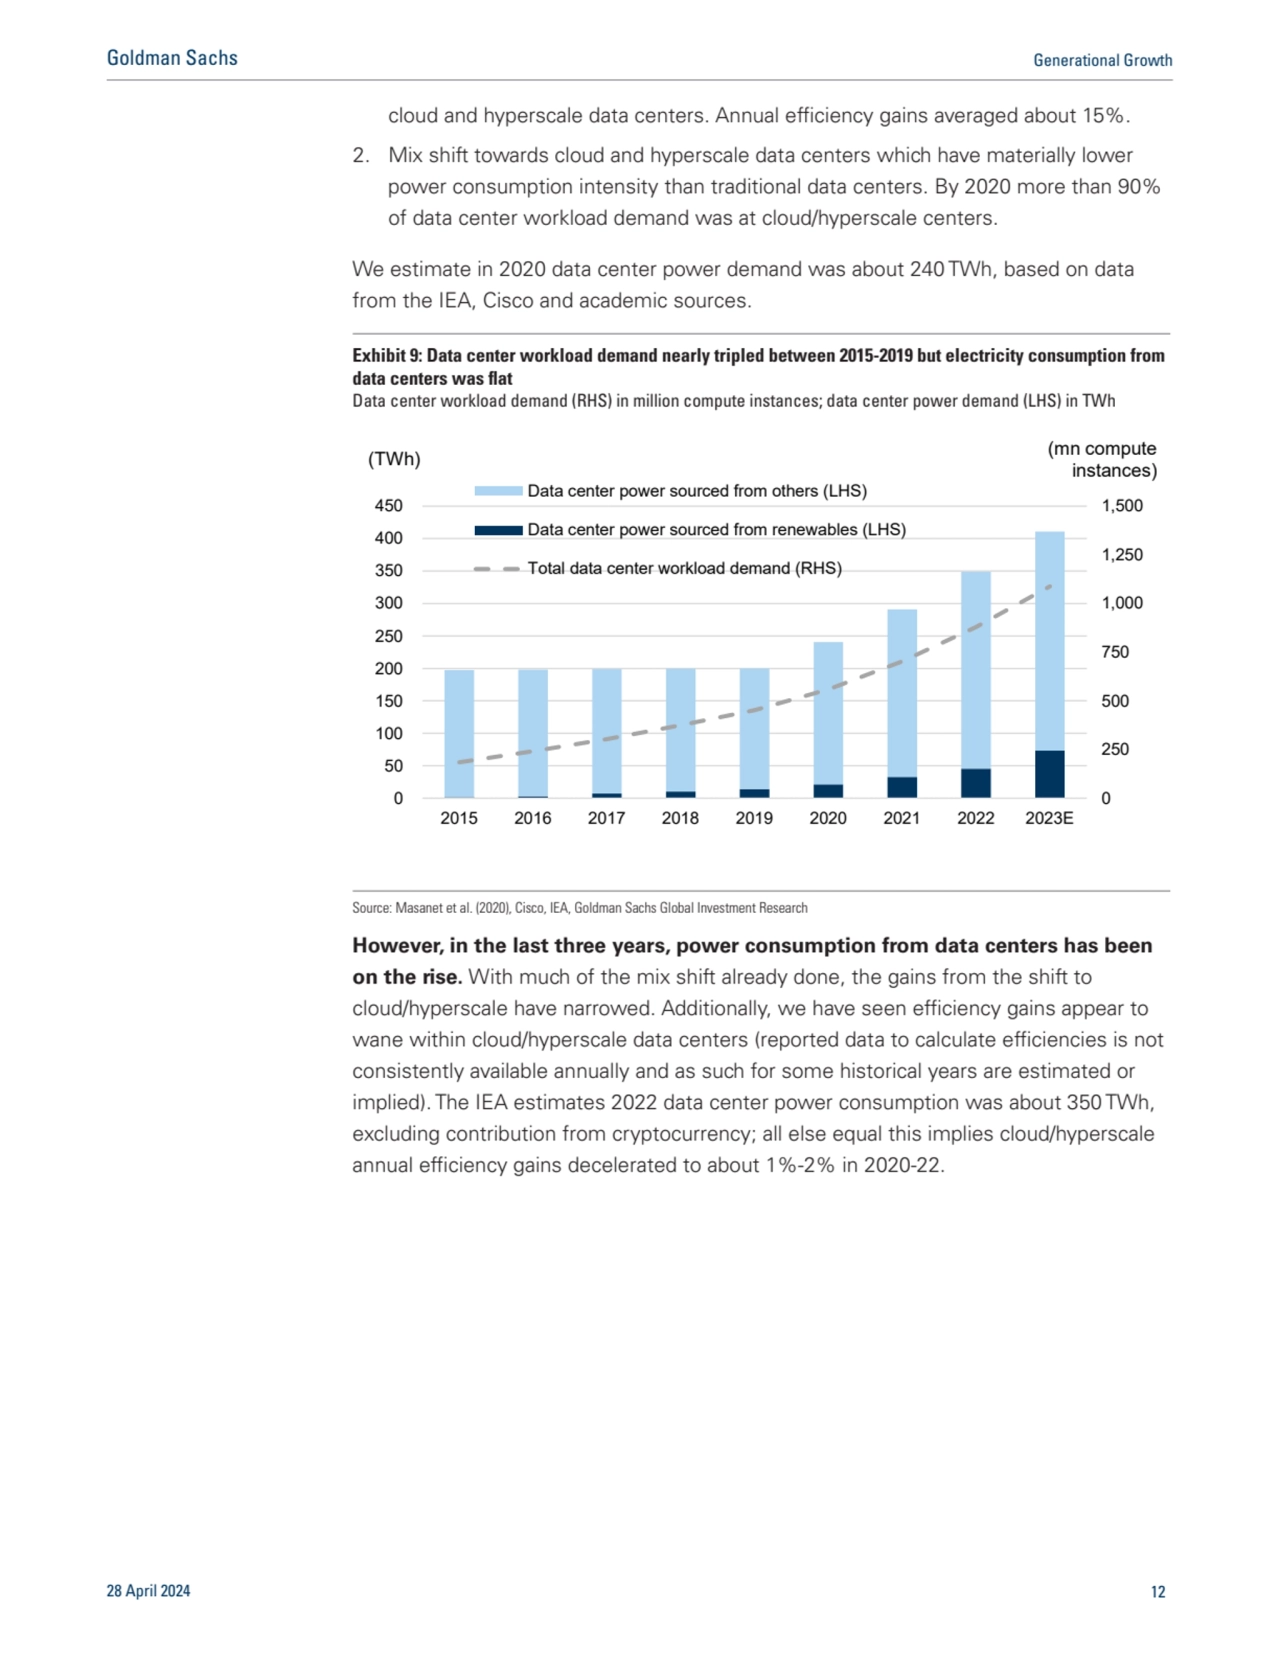
- 12. cloud and hyperscale data centers. Annual efficiency gains averaged about 15%. 2. Mix shift towards cloud and hyperscale data centers which have materially lower power consumption intensity than traditional data centers. By 2020 more than 90% of data center workload demand was at cloud/hyperscale centers. We estimate in 2020 data center power demand was about 240 TWh, based on data from the IEA, Cisco and academic sources. However, in the last three years, power consumption from data centers has been on the rise. With much of the mix shift already done, the gains from the shift to cloud/hyperscale have narrowed. Additionally, we have seen efficiency gains appear to wane within cloud/hyperscale data centers (reported data to calculate efficiencies is not consistently available annually and as such for some historical years are estimated or implied). The IEA estimates 2022 data center power consumption was about 350 TWh, excluding contribution from cryptocurrency; all else equal this implies cloud/hyperscale annual efficiency gains decelerated to about 1%-2% in 2020-22. Exhibit 9: Data center workload demand nearly tripled between 2015-2019 but electricity consumption from data centers was flat Data center workload demand (RHS) in million compute instances; data center power demand (LHS) in TWh 0 250 500 750 1,000 1,250 1,500 0 50 100 150 200 250 300 350 400 450 2015 2016 2017 2018 2019 2020 2021 2022 2023E Data center power sourced from others (LHS) Data center power sourced from renewables (LHS) Total data center workload demand (RHS) (TWh) (mn compute instances) Source: Masanet et al. (2020), Cisco, IEA, Goldman Sachs Global Investment Research 28 April 2024 12 Goldman Sachs Generational Growth
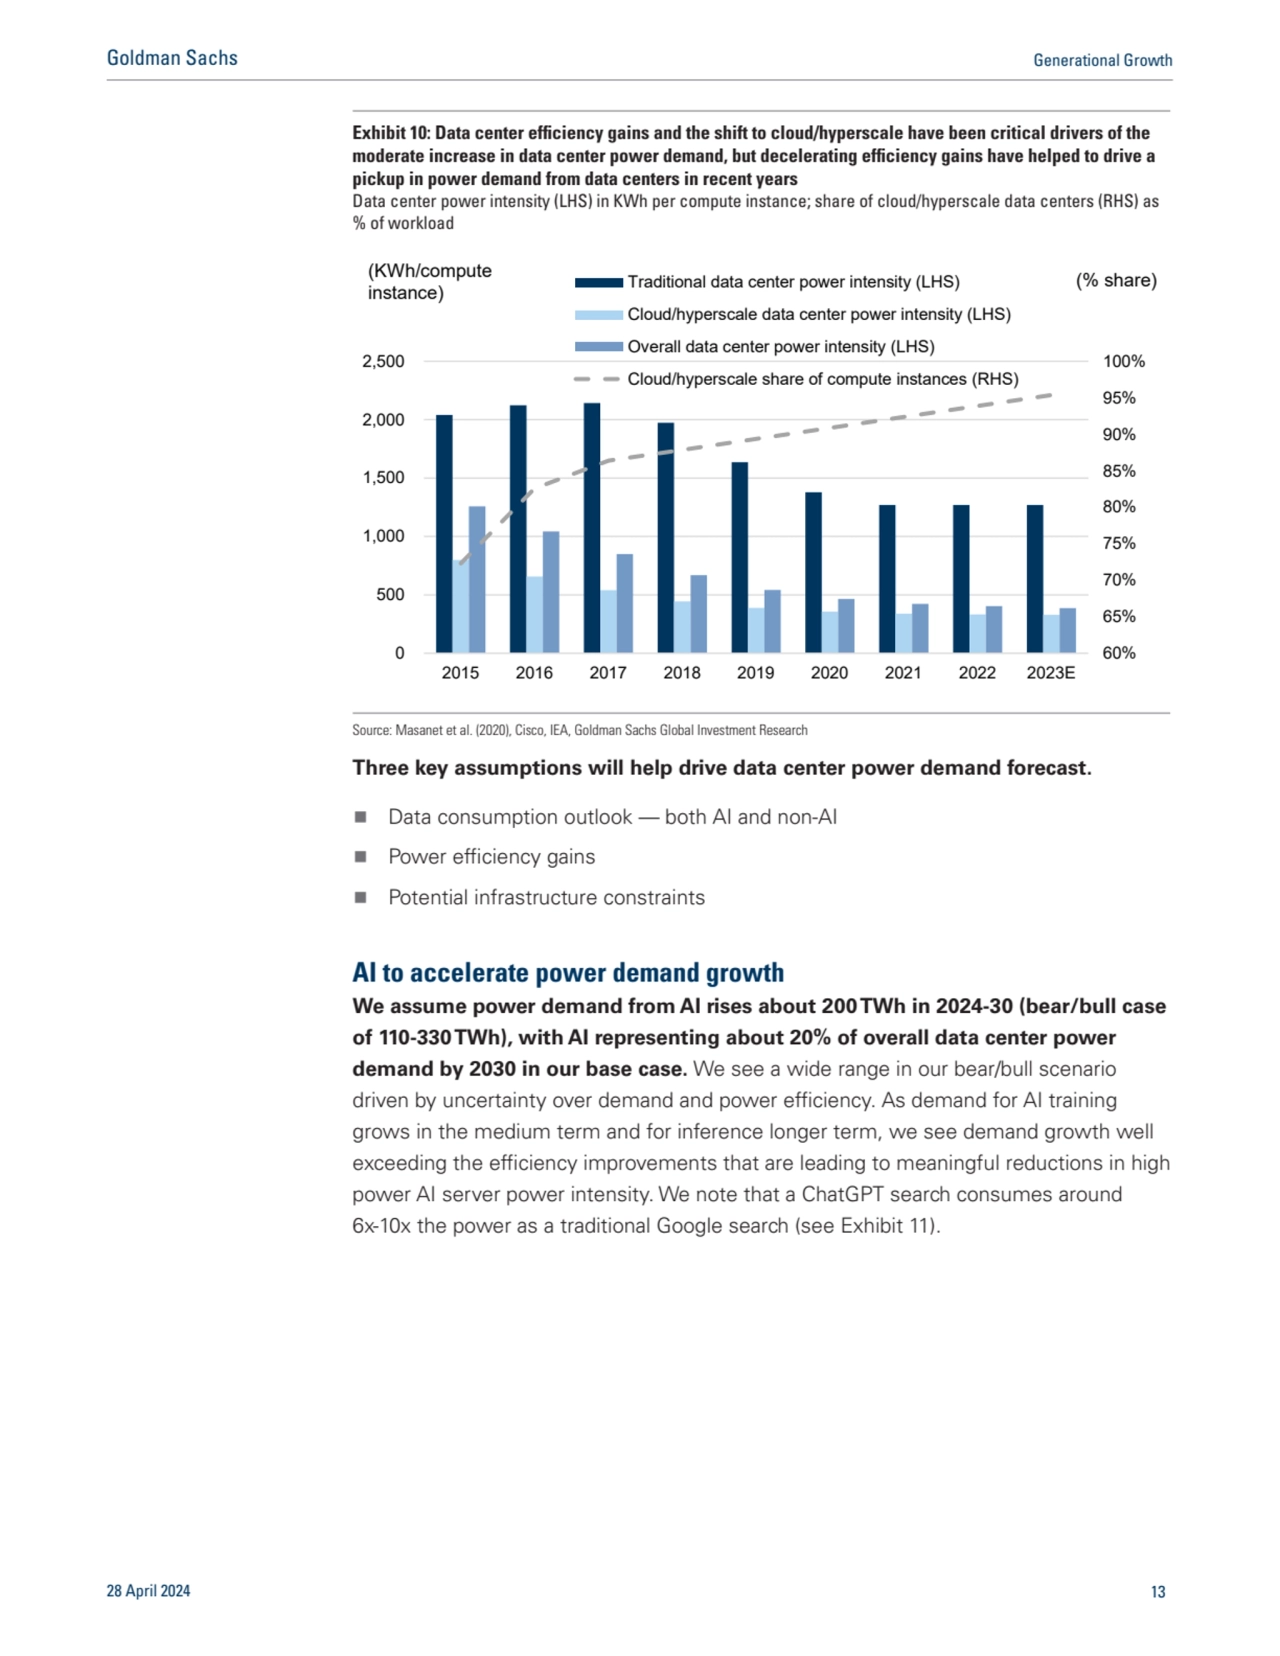
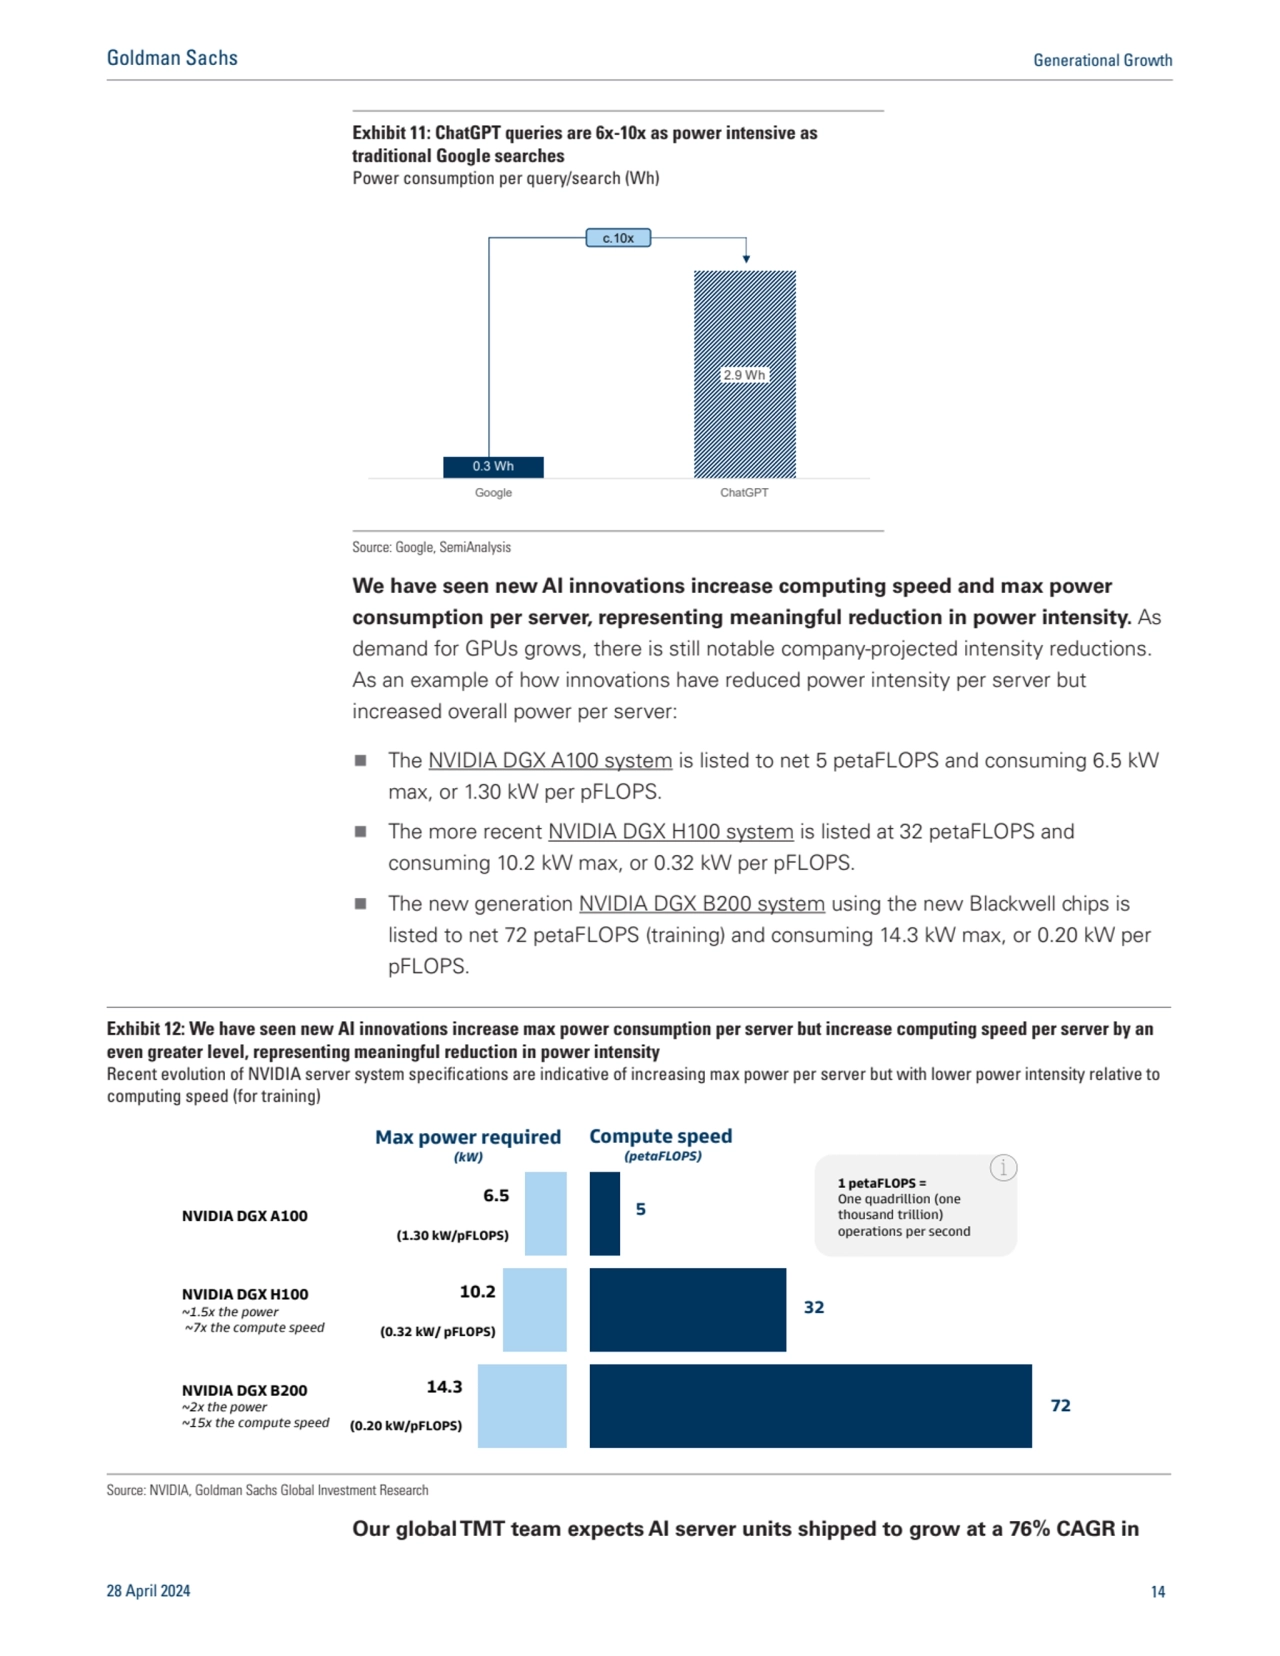
- 13. Three key assumptions will help drive data center power demand forecast. n Data consumption outlook — both AI and non-AI n Power efficiency gains n Potential infrastructure constraints AI to accelerate power demand growth We assume power demand from AI rises about 200 TWh in 2024-30 (bear/bull case of 110-330 TWh), with AI representing about 20% of overall data center power demand by 2030 in our base case. We see a wide range in our bear/bull scenario driven by uncertainty over demand and power efficiency. As demand for AI training grows in the medium term and for inference longer term, we see demand growth well exceeding the efficiency improvements that are leading to meaningful reductions in high power AI server power intensity. We note that a ChatGPT search consumes around 6x-10x the power as a traditional Google search (see Exhibit 11). Exhibit 10: Data center efficiency gains and the shift to cloud/hyperscale have been critical drivers of the moderate increase in data center power demand, but decelerating efficiency gains have helped to drive a pickup in power demand from data centers in recent years Data center power intensity (LHS) in KWh per compute instance; share of cloud/hyperscale data centers (RHS) as % of workload 60% 65% 70% 75% 80% 85% 90% 95% 100% 0 500 1,000 1,500 2,000 2,500 2015 2016 2017 2018 2019 2020 2021 2022 2023E Traditional data center power intensity (LHS) Cloud/hyperscale data center power intensity (LHS) Overall data center power intensity (LHS) Cloud/hyperscale share of compute instances (RHS) (KWh/compute instance) (% share) Source: Masanet et al. (2020), Cisco, IEA, Goldman Sachs Global Investment Research 28 April 2024 13 Goldman Sachs Generational Growth
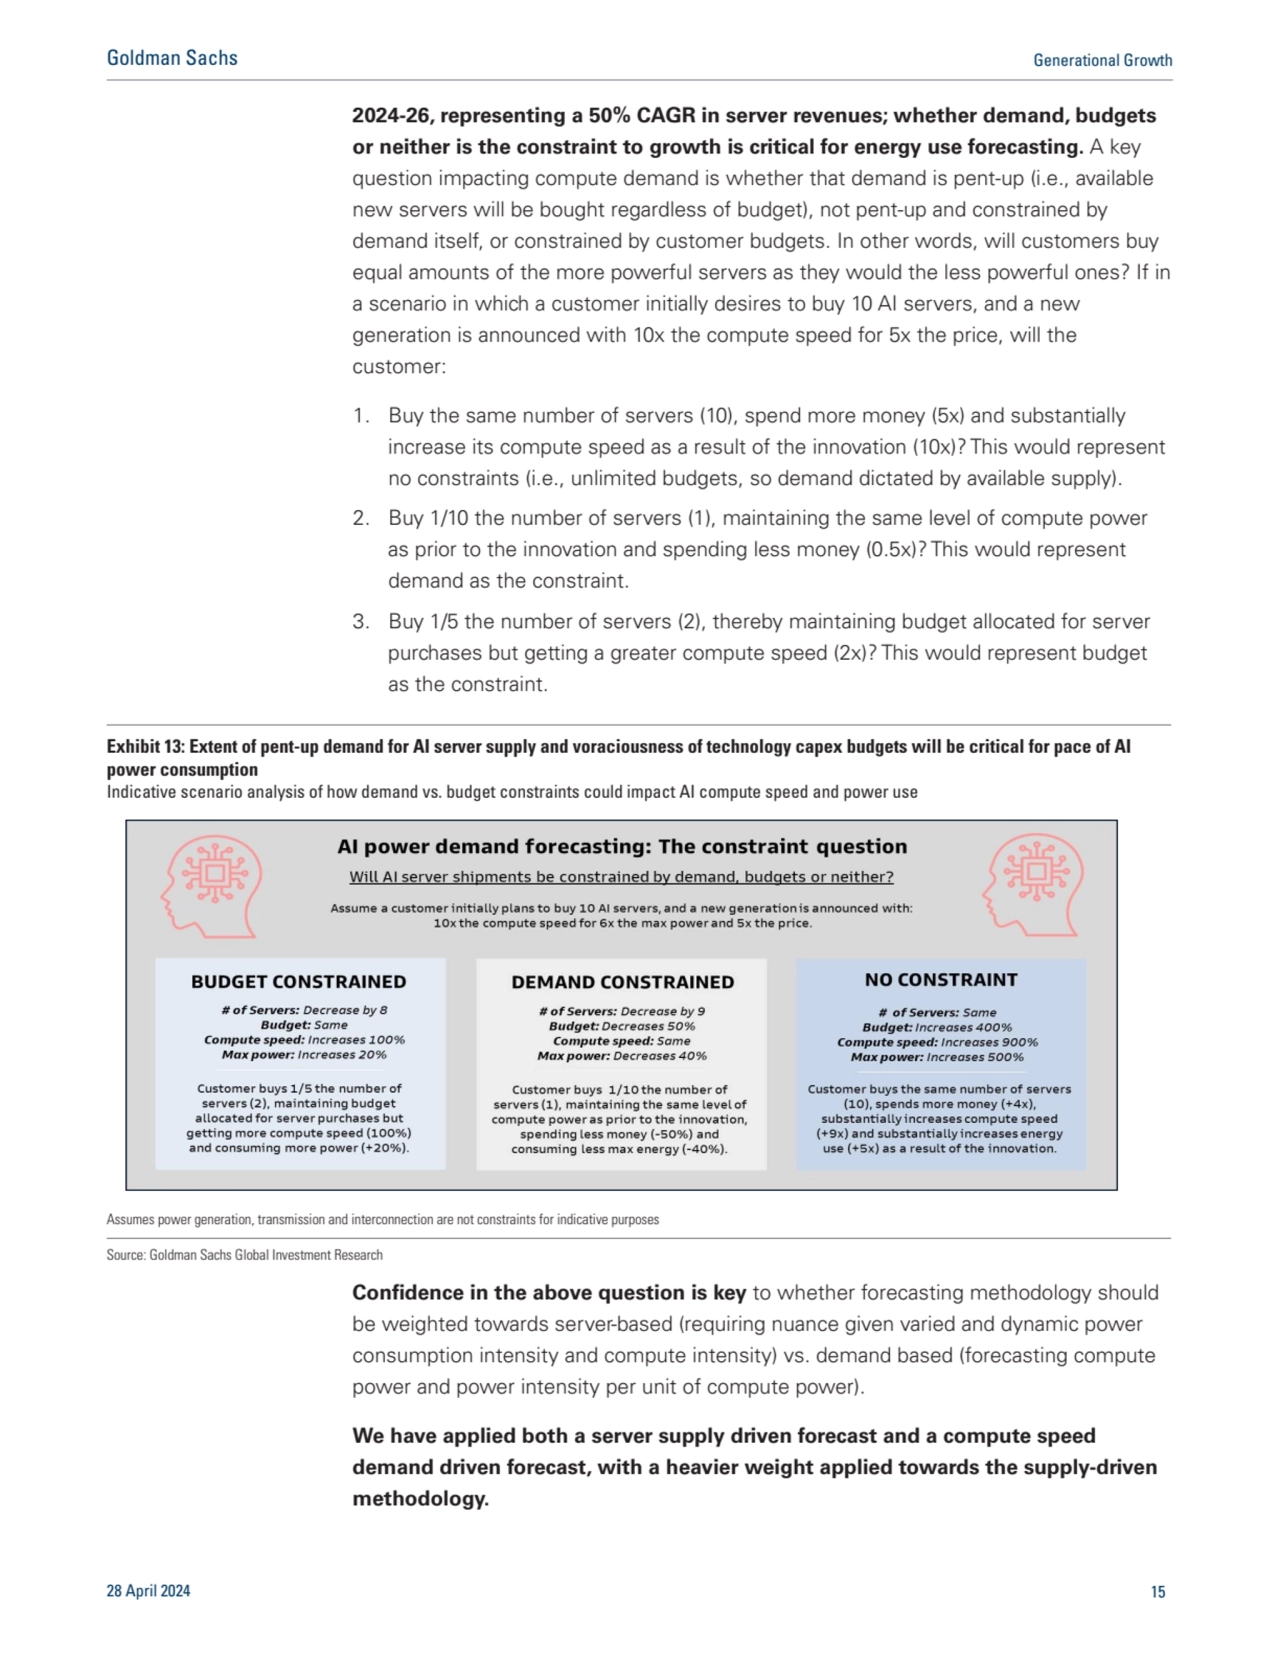
- 14. We have seen new AI innovations increase computing speed and max power consumption per server, representing meaningful reduction in power intensity. As demand for GPUs grows, there is still notable company-projected intensity reductions. As an example of how innovations have reduced power intensity per server but increased overall power per server: n The NVIDIA DGX A100 system is listed to net 5 petaFLOPS and consuming 6.5 kW max, or 1.30 kW per pFLOPS. n The more recent NVIDIA DGX H100 system is listed at 32 petaFLOPS and consuming 10.2 kW max, or 0.32 kW per pFLOPS. n The new generation NVIDIA DGX B200 system using the new Blackwell chips is listed to net 72 petaFLOPS (training) and consuming 14.3 kW max, or 0.20 kW per pFLOPS. Our global TMT team expects AI server units shipped to grow at a 76% CAGR in Exhibit 11: ChatGPT queries are 6x-10x as power intensive as traditional Google searches Power consumption per query/search (Wh) 0.3 Wh 2.9 Wh Google ChatGPT c.10x Source: Google, SemiAnalysis Exhibit 12: We have seen new AI innovations increase max power consumption per server but increase computing speed per server by an even greater level, representing meaningful reduction in power intensity Recent evolution of NVIDIA server system specifications are indicative of increasing max power per server but with lower power intensity relative to computing speed (for training) Max power required (kW) Compute speed (petaFLOPS) 5 6.5 (1.30 kW/pFLOPS) 10.2 (0.32 kW/ pFLOPS) 32 14.3 (0.20 kW/pFLOPS) 72 NVIDIA DGX B200 ~2x the power ~15x the compute speed NVIDIA DGX H100 ~1.5x the power ~7x the compute speed NVIDIA DGX A100 1 petaFLOPS = One quadrillion (one thousand trillion) operations per second Source: NVIDIA, Goldman Sachs Global Investment Research 28 April 2024 14 Goldman Sachs Generational Growth
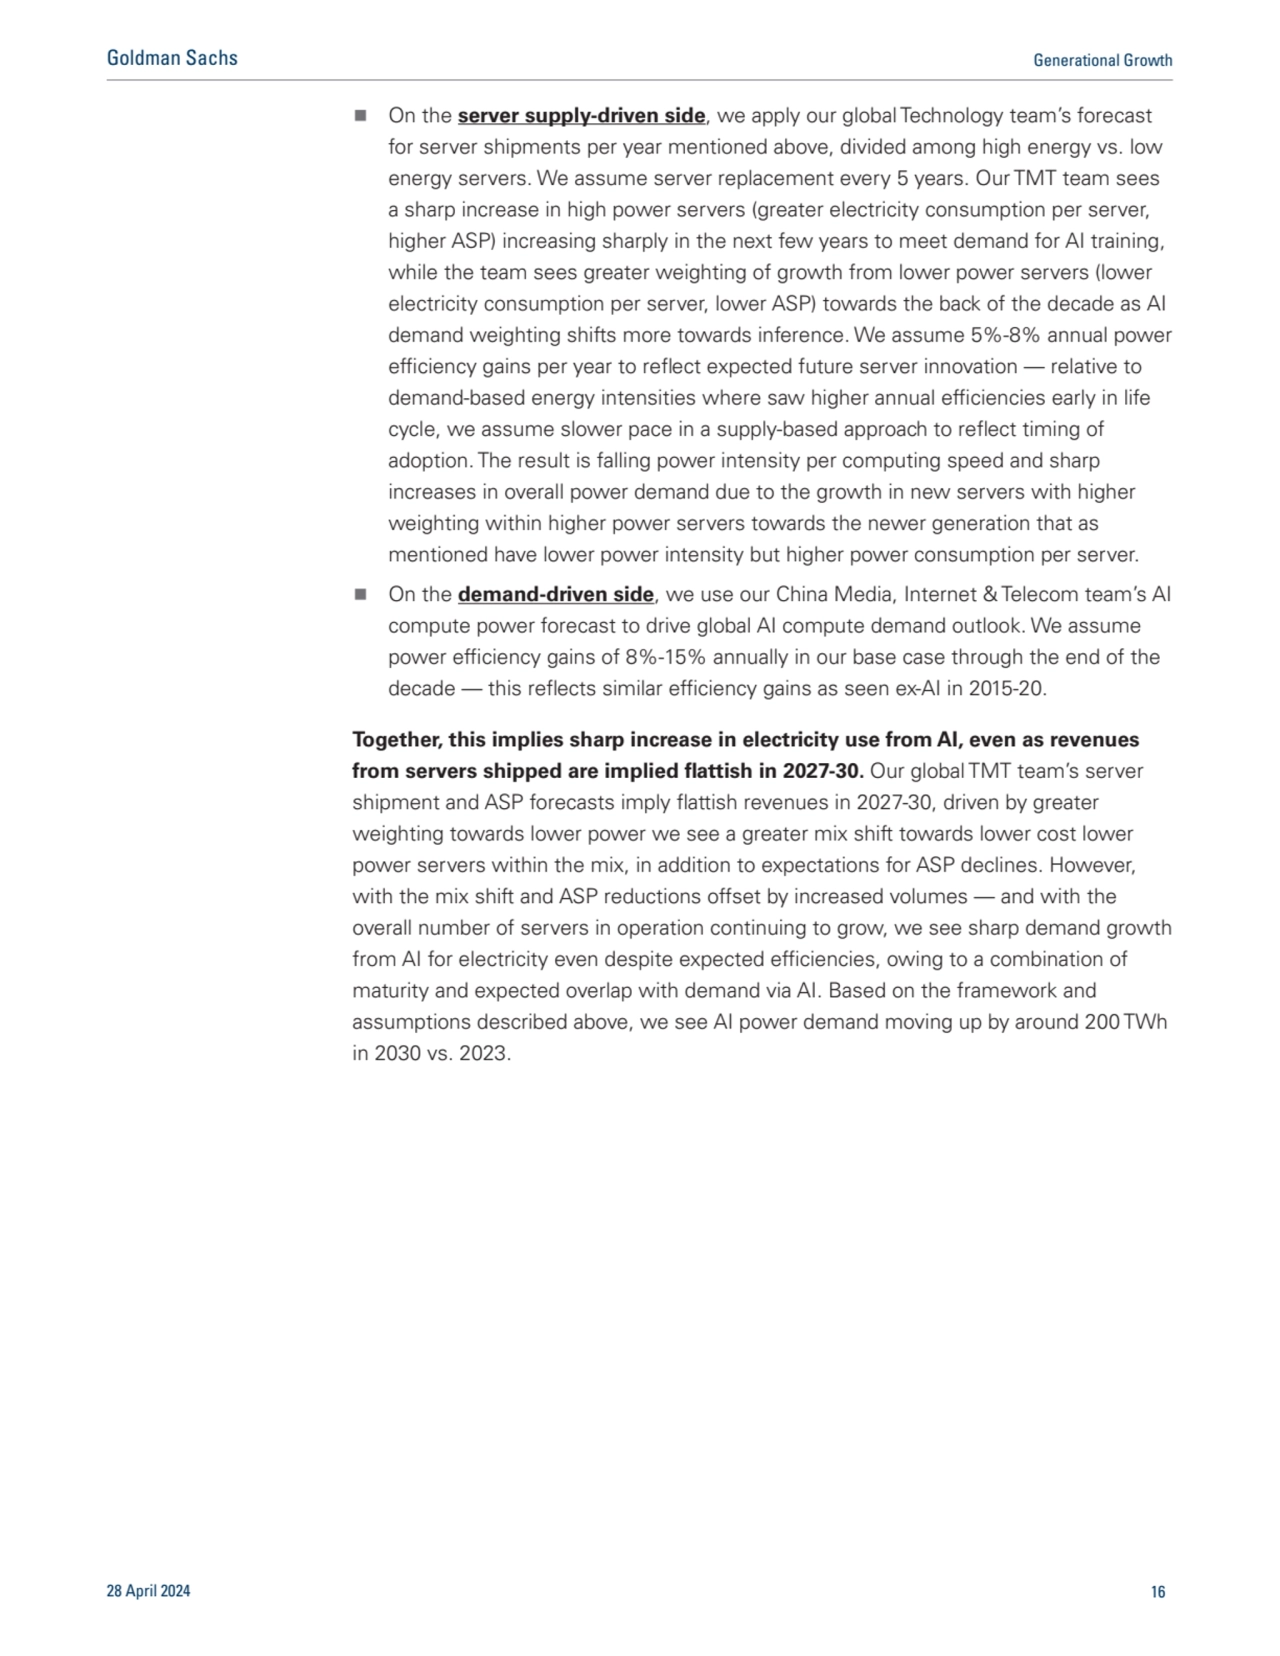
- 15. 2024-26, representing a 50% CAGR in server revenues; whether demand, budgets or neither is the constraint to growth is critical for energy use forecasting. A key question impacting compute demand is whether that demand is pent-up (i.e., available new servers will be bought regardless of budget), not pent-up and constrained by demand itself, or constrained by customer budgets. In other words, will customers buy equal amounts of the more powerful servers as they would the less powerful ones? If in a scenario in which a customer initially desires to buy 10 AI servers, and a new generation is announced with 10x the compute speed for 5x the price, will the customer: 1. Buy the same number of servers (10), spend more money (5x) and substantially increase its compute speed as a result of the innovation (10x)? This would represent no constraints (i.e., unlimited budgets, so demand dictated by available supply). 2. Buy 1/10 the number of servers (1), maintaining the same level of compute power as prior to the innovation and spending less money (0.5x)? This would represent demand as the constraint. 3. Buy 1/5 the number of servers (2), thereby maintaining budget allocated for server purchases but getting a greater compute speed (2x)? This would represent budget as the constraint. Confidence in the above question is key to whether forecasting methodology should be weighted towards server-based (requiring nuance given varied and dynamic power consumption intensity and compute intensity) vs. demand based (forecasting compute power and power intensity per unit of compute power). We have applied both a server supply driven forecast and a compute speed demand driven forecast, with a heavier weight applied towards the supply-driven methodology. Exhibit 13: Extent of pent-up demand for AI server supply and voraciousness of technology capex budgets will be critical for pace of AI power consumption Indicative scenario analysis of how demand vs. budget constraints could impact AI compute speed and power use Assumes power generation, transmission and interconnection are not constraints for indicative purposes Source: Goldman Sachs Global Investment Research 28 April 2024 15 Goldman Sachs Generational Growth
- 16. n On the server supply-driven side, we apply our global Technology team’s forecast for server shipments per year mentioned above, divided among high energy vs. low energy servers. We assume server replacement every 5 years. Our TMT team sees a sharp increase in high power servers (greater electricity consumption per server, higher ASP) increasing sharply in the next few years to meet demand for AI training, while the team sees greater weighting of growth from lower power servers (lower electricity consumption per server, lower ASP) towards the back of the decade as AI demand weighting shifts more towards inference. We assume 5%-8% annual power efficiency gains per year to reflect expected future server innovation — relative to demand-based energy intensities where saw higher annual efficiencies early in life cycle, we assume slower pace in a supply-based approach to reflect timing of adoption. The result is falling power intensity per computing speed and sharp increases in overall power demand due to the growth in new servers with higher weighting within higher power servers towards the newer generation that as mentioned have lower power intensity but higher power consumption per server. n On the demand-driven side, we use our China Media, Internet & Telecom team’s AI compute power forecast to drive global AI compute demand outlook. We assume power efficiency gains of 8%-15% annually in our base case through the end of the decade — this reflects similar efficiency gains as seen ex-AI in 2015-20. Together, this implies sharp increase in electricity use from AI, even as revenues from servers shipped are implied flattish in 2027-30. Our global TMT team’s server shipment and ASP forecasts imply flattish revenues in 2027-30, driven by greater weighting towards lower power we see a greater mix shift towards lower cost lower power servers within the mix, in addition to expectations for ASP declines. However, with the mix shift and ASP reductions offset by increased volumes — and with the overall number of servers in operation continuing to grow, we see sharp demand growth from AI for electricity even despite expected efficiencies, owing to a combination of maturity and expected overlap with demand via AI. Based on the framework and assumptions described above, we see AI power demand moving up by around 200 TWh in 2030 vs. 2023. 28 April 2024 16 Goldman Sachs Generational Growth
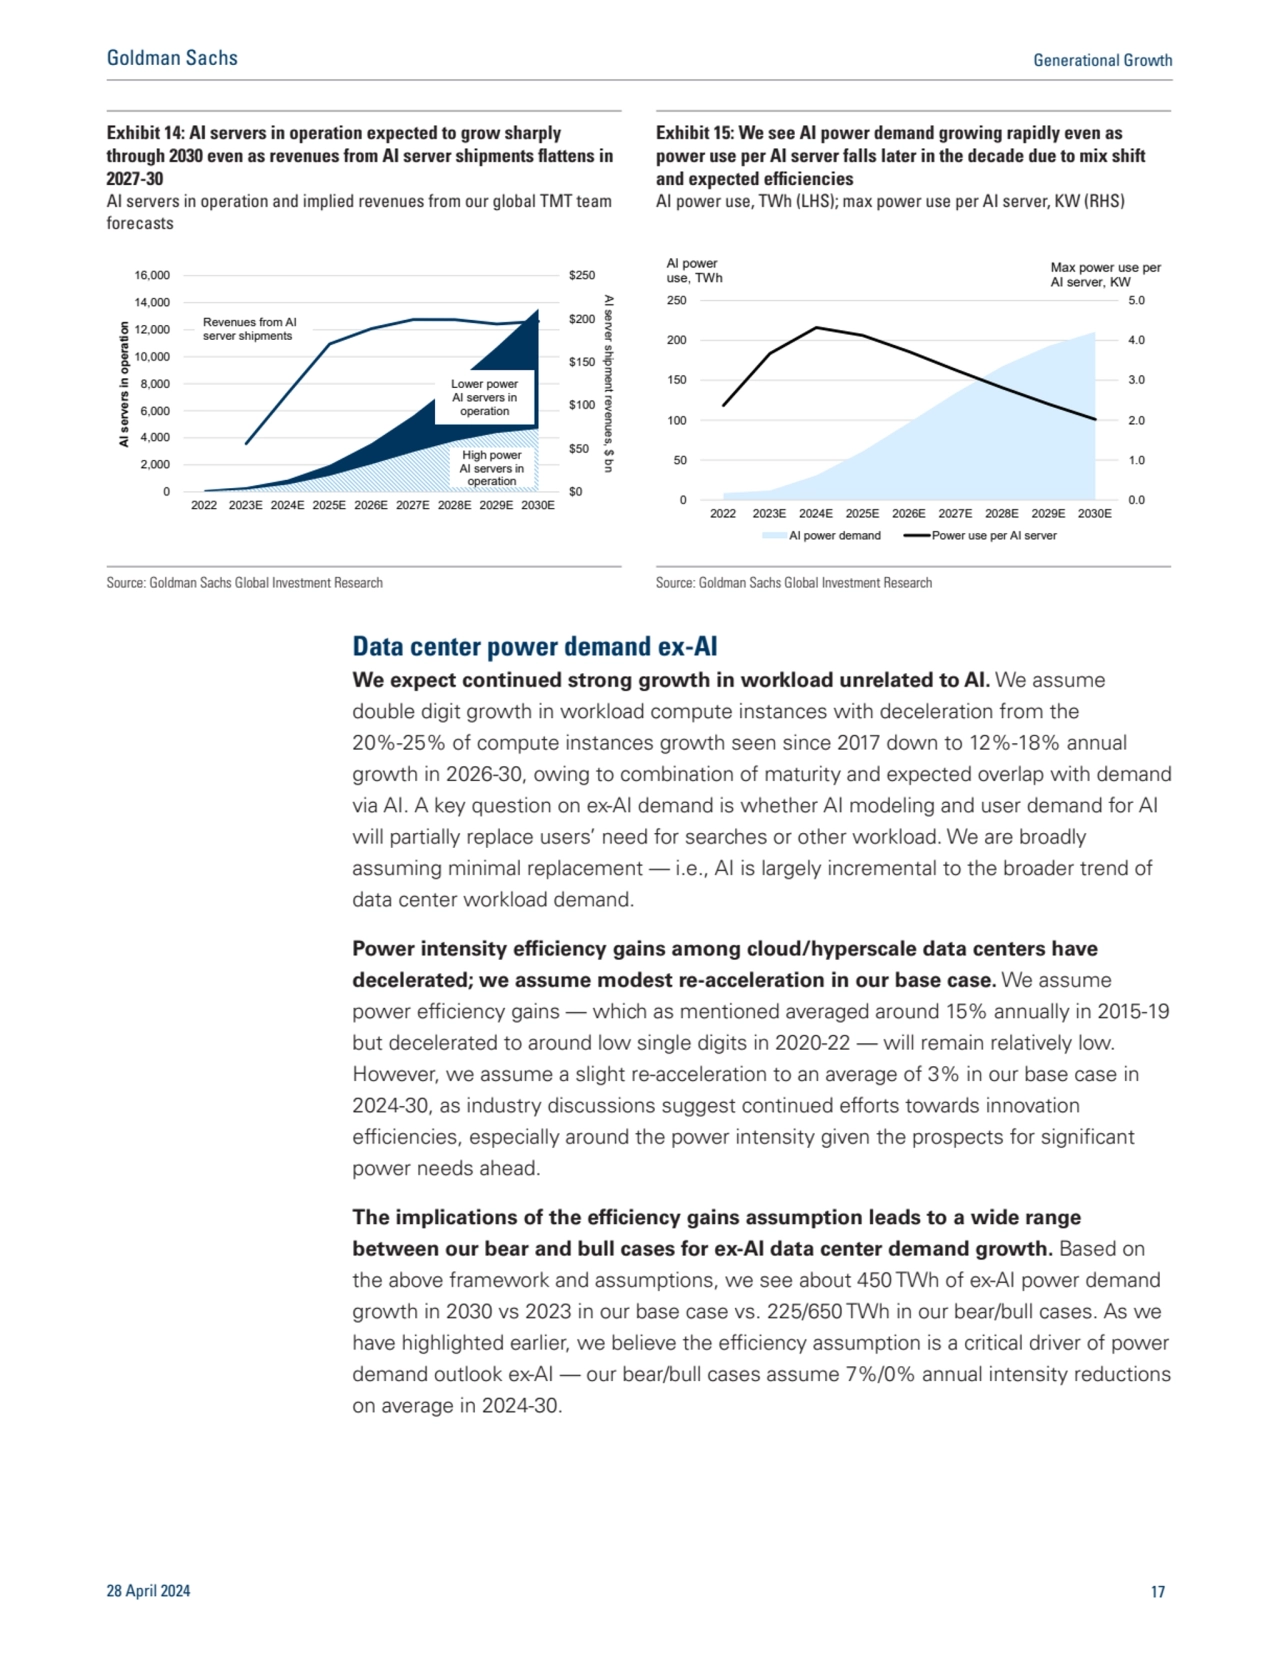
- 17. Data center power demand ex-AI We expect continued strong growth in workload unrelated to AI. We assume double digit growth in workload compute instances with deceleration from the 20%-25% of compute instances growth seen since 2017 down to 12%-18% annual growth in 2026-30, owing to combination of maturity and expected overlap with demand via AI. A key question on ex-AI demand is whether AI modeling and user demand for AI will partially replace users’ need for searches or other workload. We are broadly assuming minimal replacement — i.e., AI is largely incremental to the broader trend of data center workload demand. Power intensity efficiency gains among cloud/hyperscale data centers have decelerated; we assume modest re-acceleration in our base case. We assume power efficiency gains — which as mentioned averaged around 15% annually in 2015-19 but decelerated to around low single digits in 2020-22 — will remain relatively low. However, we assume a slight re-acceleration to an average of 3% in our base case in 2024-30, as industry discussions suggest continued efforts towards innovation efficiencies, especially around the power intensity given the prospects for significant power needs ahead. The implications of the efficiency gains assumption leads to a wide range between our bear and bull cases for ex-AI data center demand growth. Based on the above framework and assumptions, we see about 450 TWh of ex-AI power demand growth in 2030 vs 2023 in our base case vs. 225/650 TWh in our bear/bull cases. As we have highlighted earlier, we believe the efficiency assumption is a critical driver of power demand outlook ex-AI — our bear/bull cases assume 7%/0% annual intensity reductions on average in 2024-30. Exhibit 14: AI servers in operation expected to grow sharply through 2030 even as revenues from AI server shipments flattens in 2027-30 AI servers in operation and implied revenues from our global TMT team forecasts Exhibit 15: We see AI power demand growing rapidly even as power use per AI server falls later in the decade due to mix shift and expected efficiencies AI power use, TWh (LHS); max power use per AI server, KW (RHS) $0 $50 $100 $150 $200 $250 0 2,000 4,000 6,000 8,000 10,000 12,000 14,000 16,000 2022 2023E 2024E 2025E 2026E 2027E 2028E 2029E 2030E AI server shipment revenues, $ bn AI servers in operation Lower power AI servers in operation High power AI servers in operation Revenues from AI server shipments 0.0 1.0 2.0 3.0 4.0 5.0 0 50 100 150 200 250 2022 2023E 2024E 2025E 2026E 2027E 2028E 2029E 2030E AI power demand Power use per AI server AI power use, TWh Max power use per AI server, KW Source: Goldman Sachs Global Investment Research Source: Goldman Sachs Global Investment Research 28 April 2024 17 Goldman Sachs Generational Growth
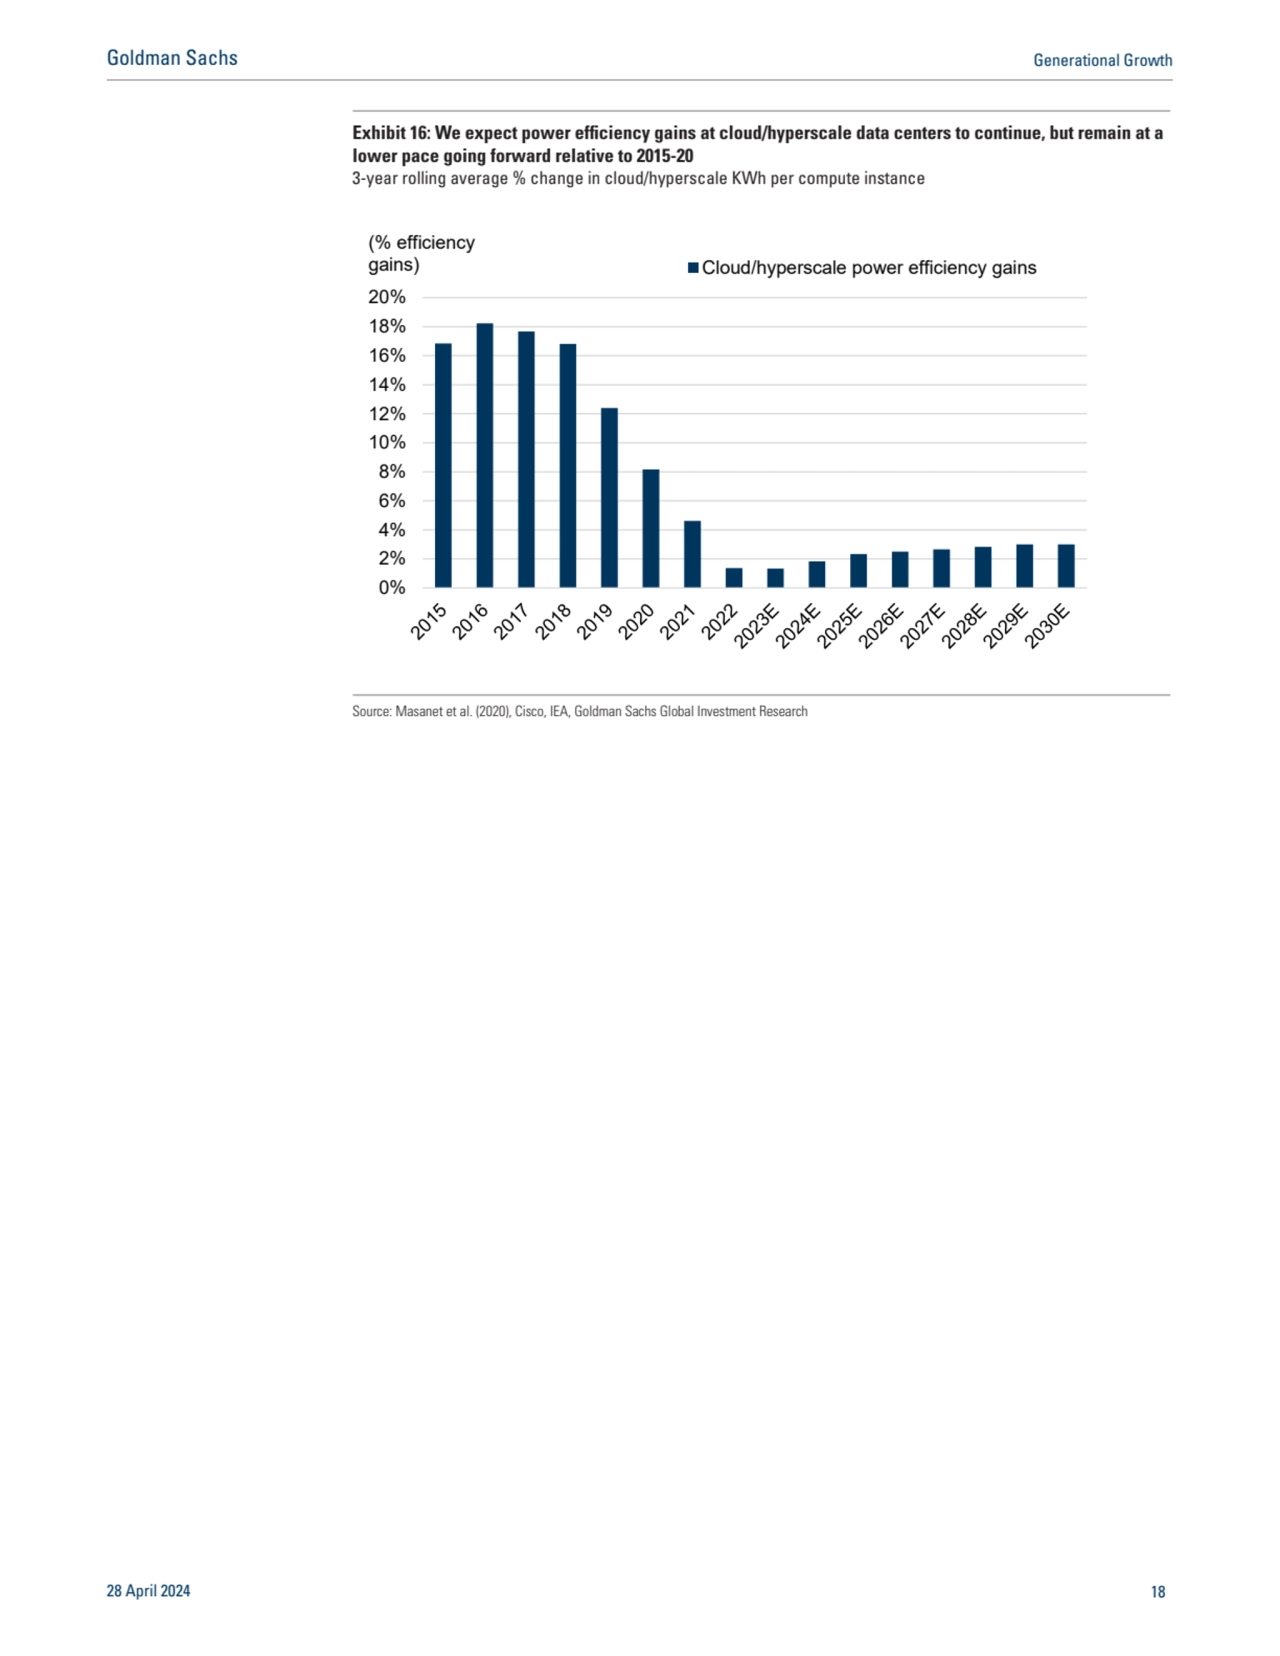
- 18. Exhibit 16: We expect power efficiency gains at cloud/hyperscale data centers to continue, but remain at a lower pace going forward relative to 2015-20 3-year rolling average % change in cloud/hyperscale KWh per compute instance 0% 2% 4% 6% 8% 10% 12% 14% 16% 18% 20% Cloud/hyperscale power efficiency gains (% efficiency gains) Source: Masanet et al. (2020), Cisco, IEA, Goldman Sachs Global Investment Research 28 April 2024 18 Goldman Sachs Generational Growth
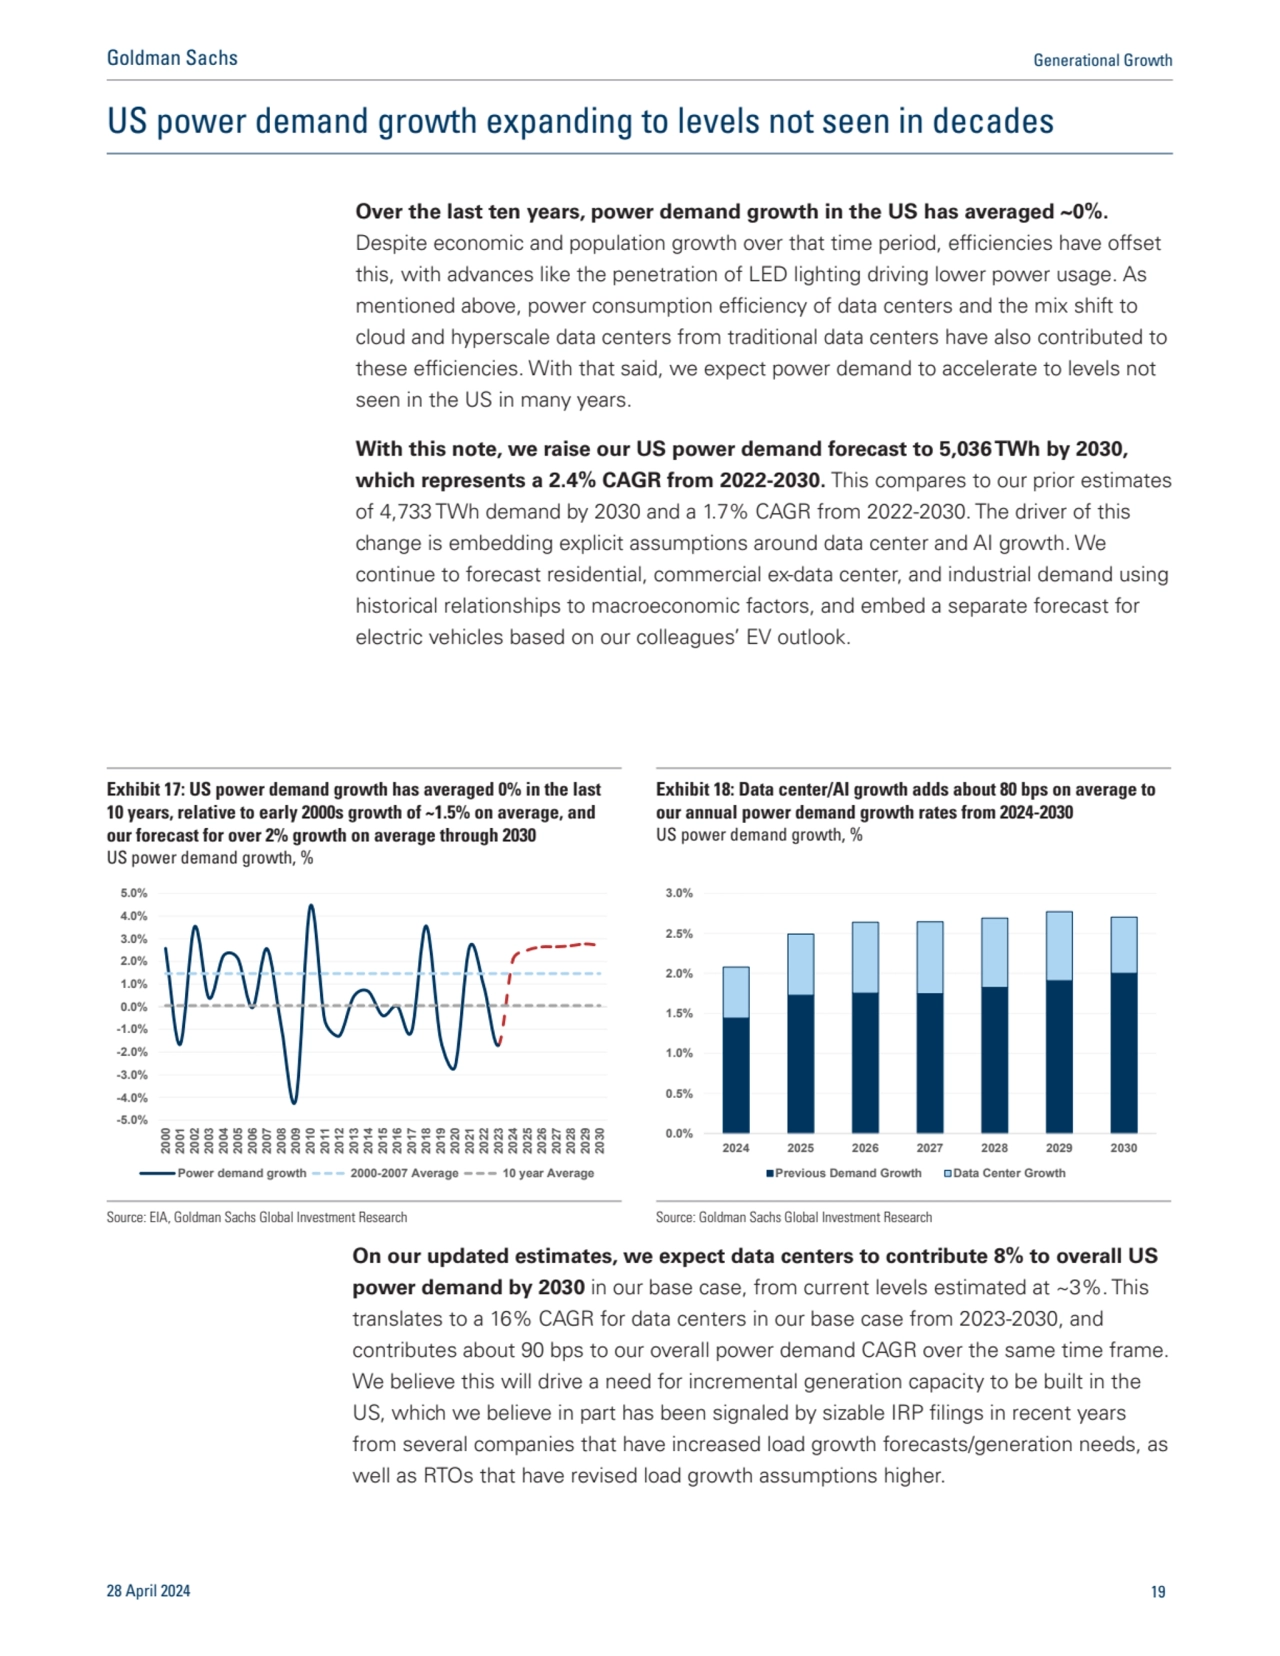
- 19. US power demand growth expanding to levels not seen in decades Over the last ten years, power demand growth in the US has averaged ~0%. Despite economic and population growth over that time period, efficiencies have offset this, with advances like the penetration of LED lighting driving lower power usage. As mentioned above, power consumption efficiency of data centers and the mix shift to cloud and hyperscale data centers from traditional data centers have also contributed to these efficiencies. With that said, we expect power demand to accelerate to levels not seen in the US in many years. With this note, we raise our US power demand forecast to 5,036 TWh by 2030, which represents a 2.4% CAGR from 2022-2030. This compares to our prior estimates of 4,733 TWh demand by 2030 and a 1.7% CAGR from 2022-2030. The driver of this change is embedding explicit assumptions around data center and AI growth. We continue to forecast residential, commercial ex-data center, and industrial demand using historical relationships to macroeconomic factors, and embed a separate forecast for electric vehicles based on our colleagues’ EV outlook. On our updated estimates, we expect data centers to contribute 8% to overall US power demand by 2030 in our base case, from current levels estimated at ~3%. This translates to a 16% CAGR for data centers in our base case from 2023-2030, and contributes about 90 bps to our overall power demand CAGR over the same time frame. We believe this will drive a need for incremental generation capacity to be built in the US, which we believe in part has been signaled by sizable IRP filings in recent years from several companies that have increased load growth forecasts/generation needs, as well as RTOs that have revised load growth assumptions higher. Exhibit 17: US power demand growth has averaged 0% in the last 10 years, relative to early 2000s growth of ~1.5% on average, and our forecast for over 2% growth on average through 2030 US power demand growth, % Exhibit 18: Data center/AI growth adds about 80 bps on average to our annual power demand growth rates from 2024-2030 US power demand growth, % -5.0% -4.0% -3.0% -2.0% -1.0% 0.0% 1.0% 2.0% 3.0% 4.0% 5.0% 2000200120022003200420052006200720082009201020112012201320142015201620172018201920202021202220232024202520262027202820292030 Power demand growth 2000-2007 Average 10 year Average 0.0% 0.5% 1.0% 1.5% 2.0% 2.5% 3.0% 2024 2025 2026 2027 2028 2029 2030 Previous Demand Growth Data Center Growth Source: EIA, Goldman Sachs Global Investment Research Source: Goldman Sachs Global Investment Research 28 April 2024 19 Goldman Sachs Generational Growth
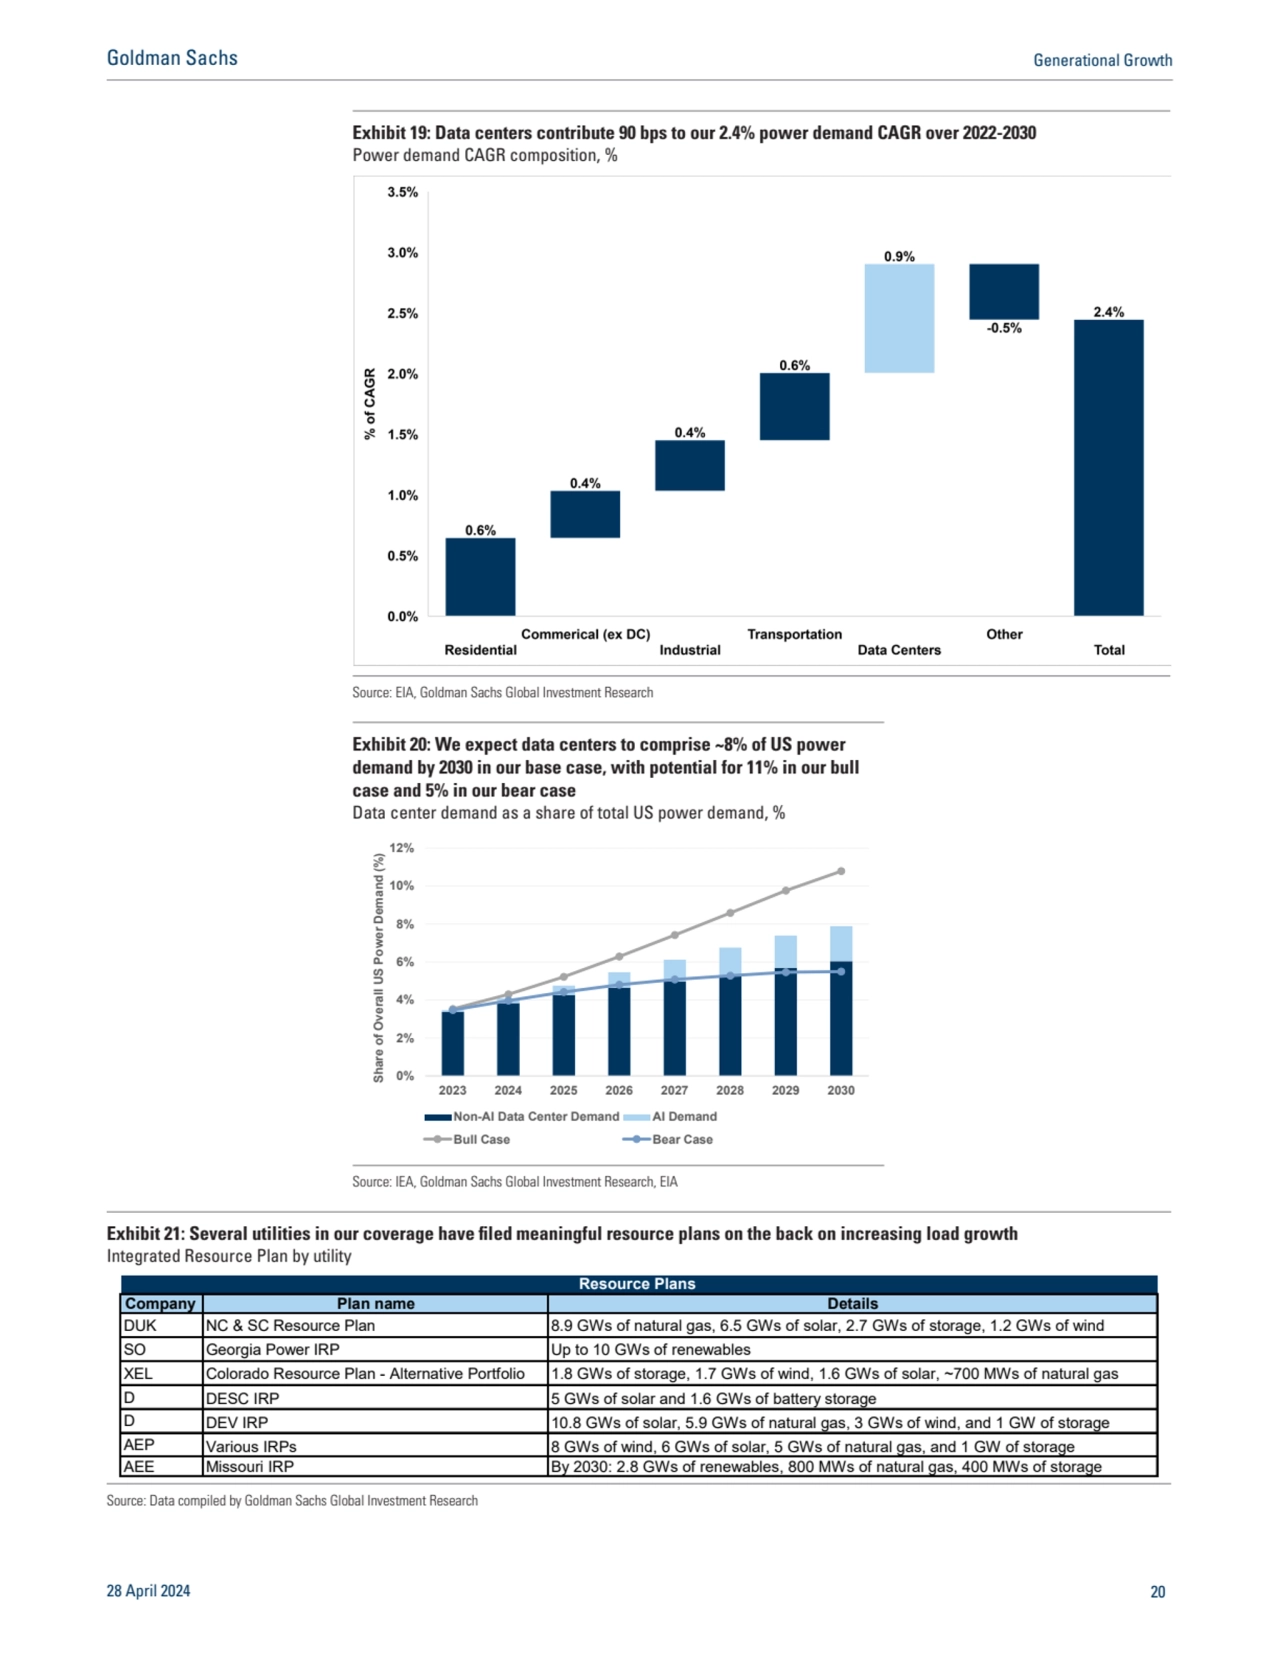
- 20. Exhibit 19: Data centers contribute 90 bps to our 2.4% power demand CAGR over 2022-2030 Power demand CAGR composition, % Source: EIA, Goldman Sachs Global Investment Research Exhibit 20: We expect data centers to comprise ~8% of US power demand by 2030 in our base case, with potential for 11% in our bull case and 5% in our bear case Data center demand as a share of total US power demand, % 0% 2% 4% 6% 8% 10% 12% 2023 2024 2025 2026 2027 2028 2029 2030 Share of Overall US Power Demand (%) Non-AI Data Center Demand AI Demand Bull Case Bear Case Source: IEA, Goldman Sachs Global Investment Research, EIA Exhibit 21: Several utilities in our coverage have filed meaningful resource plans on the back on increasing load growth Integrated Resource Plan by utility Company Plan name Details DUK NC & SC Resource Plan 8.9 GWs of natural gas, 6.5 GWs of solar, 2.7 GWs of storage, 1.2 GWs of wind SO Georgia Power IRP Up to 10 GWs of renewables XEL Colorado Resource Plan - Alternative Portfolio 1.8 GWs of storage, 1.7 GWs of wind, 1.6 GWs of solar, ~700 MWs of natural gas D DESC IRP 5 GWs of solar and 1.6 GWs of battery storage D DEV IRP 10.8 GWs of solar, 5.9 GWs of natural gas, 3 GWs of wind, and 1 GW of storage AEP Various IRPs 8 GWs of wind, 6 GWs of solar, 5 GWs of natural gas, and 1 GW of storage AEE Missouri IRP By 2030: 2.8 GWs of renewables, 800 MWs of natural gas, 400 MWs of storage Resource Plans Source: Data compiled by Goldman Sachs Global Investment Research 28 April 2024 20 Goldman Sachs Generational Growth
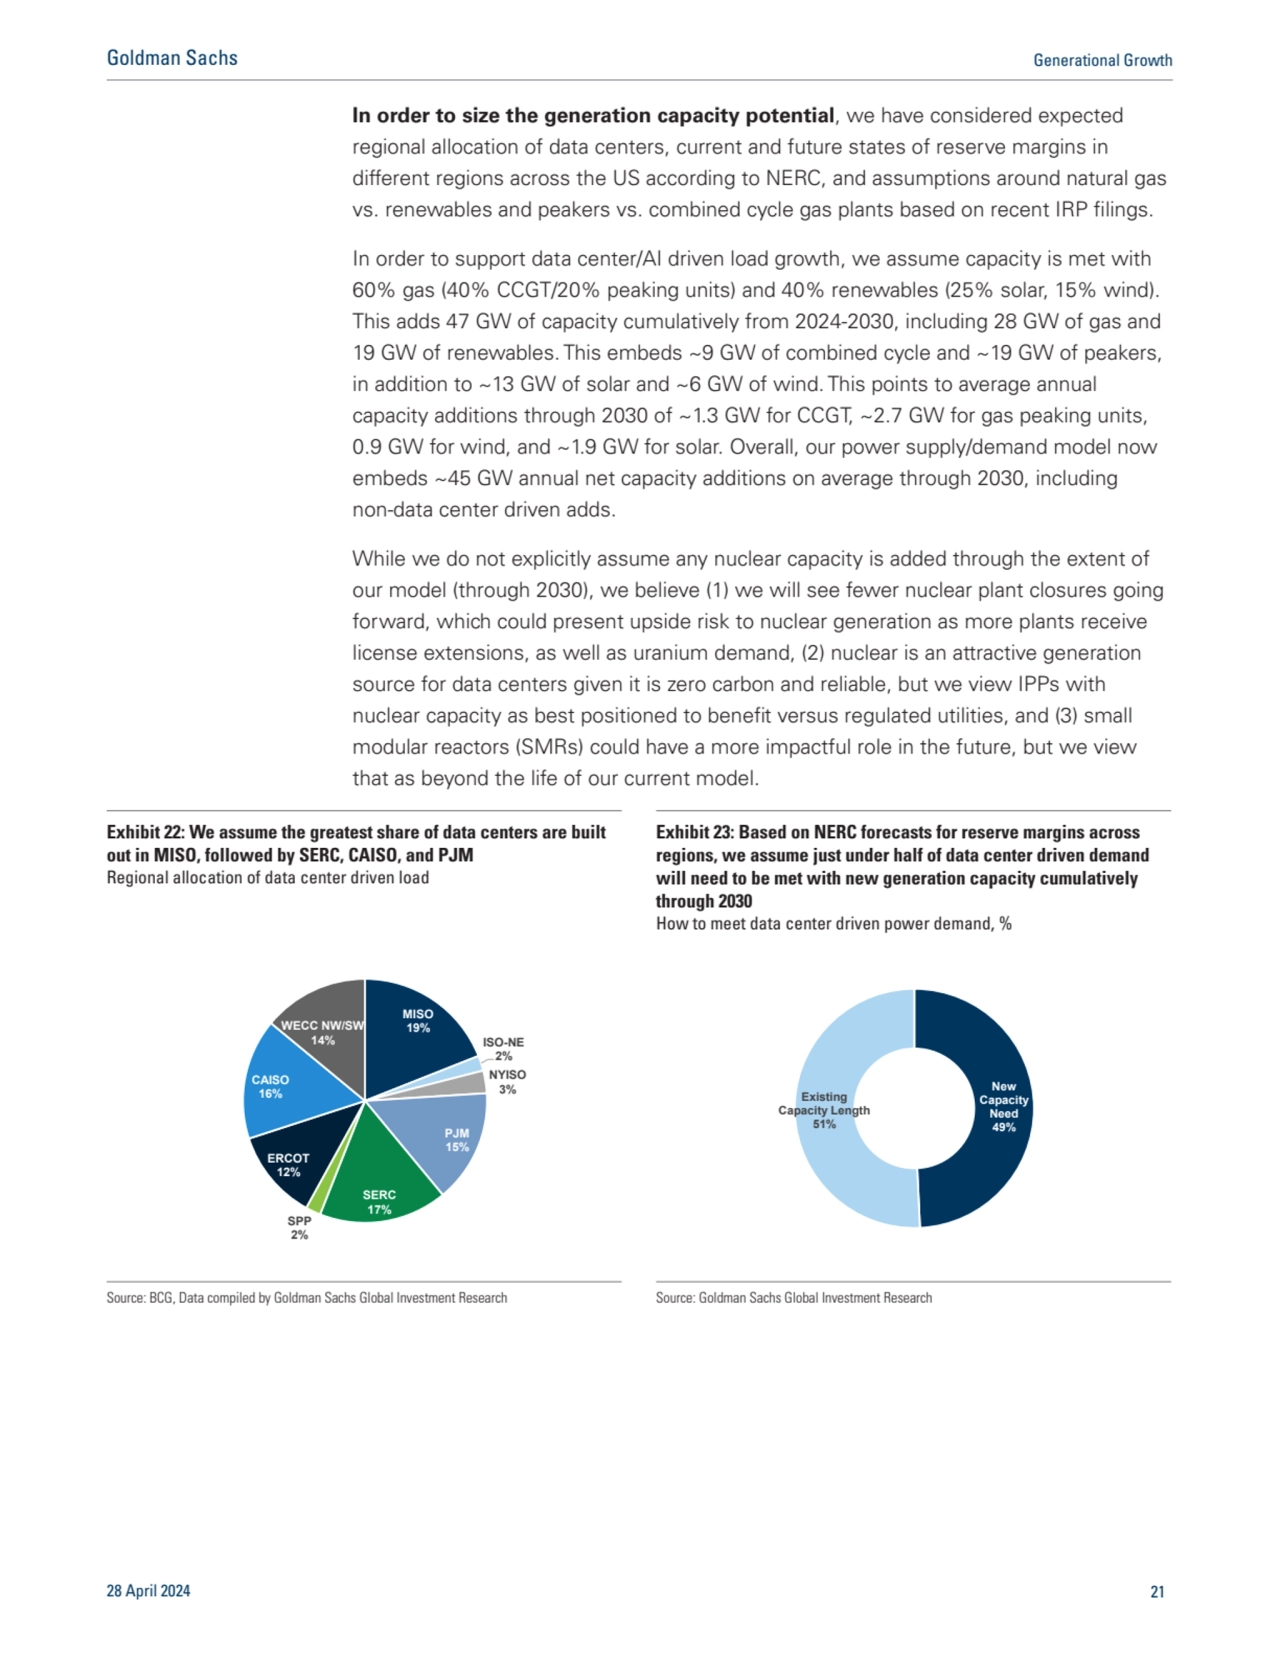
- 21. In order to size the generation capacity potential, we have considered expected regional allocation of data centers, current and future states of reserve margins in different regions across the US according to NERC, and assumptions around natural gas vs. renewables and peakers vs. combined cycle gas plants based on recent IRP filings. In order to support data center/AI driven load growth, we assume capacity is met with 60% gas (40% CCGT/20% peaking units) and 40% renewables (25% solar, 15% wind). This adds 47 GW of capacity cumulatively from 2024-2030, including 28 GW of gas and 19 GW of renewables. This embeds ~9 GW of combined cycle and ~19 GW of peakers, in addition to ~13 GW of solar and ~6 GW of wind. This points to average annual capacity additions through 2030 of ~1.3 GW for CCGT, ~2.7 GW for gas peaking units, 0.9 GW for wind, and ~1.9 GW for solar. Overall, our power supply/demand model now embeds ~45 GW annual net capacity additions on average through 2030, including non-data center driven adds. While we do not explicitly assume any nuclear capacity is added through the extent of our model (through 2030), we believe (1) we will see fewer nuclear plant closures going forward, which could present upside risk to nuclear generation as more plants receive license extensions, as well as uranium demand, (2) nuclear is an attractive generation source for data centers given it is zero carbon and reliable, but we view IPPs with nuclear capacity as best positioned to benefit versus regulated utilities, and (3) small modular reactors (SMRs) could have a more impactful role in the future, but we view that as beyond the life of our current model. Exhibit 22: We assume the greatest share of data centers are built out in MISO, followed by SERC, CAISO, and PJM Regional allocation of data center driven load Exhibit 23: Based on NERC forecasts for reserve margins across regions, we assume just under half of data center driven demand will need to be met with new generation capacity cumulatively through 2030 How to meet data center driven power demand, % MISO 19% ISO-NE 2% NYISO 3% PJM 15% SERC 17% SPP 2% ERCOT 12% CAISO 16% WECC NW/SW 14% New Capacity Need 49% Existing Capacity Length 51% Source: BCG, Data compiled by Goldman Sachs Global Investment Research Source: Goldman Sachs Global Investment Research 28 April 2024 21 Goldman Sachs Generational Growth
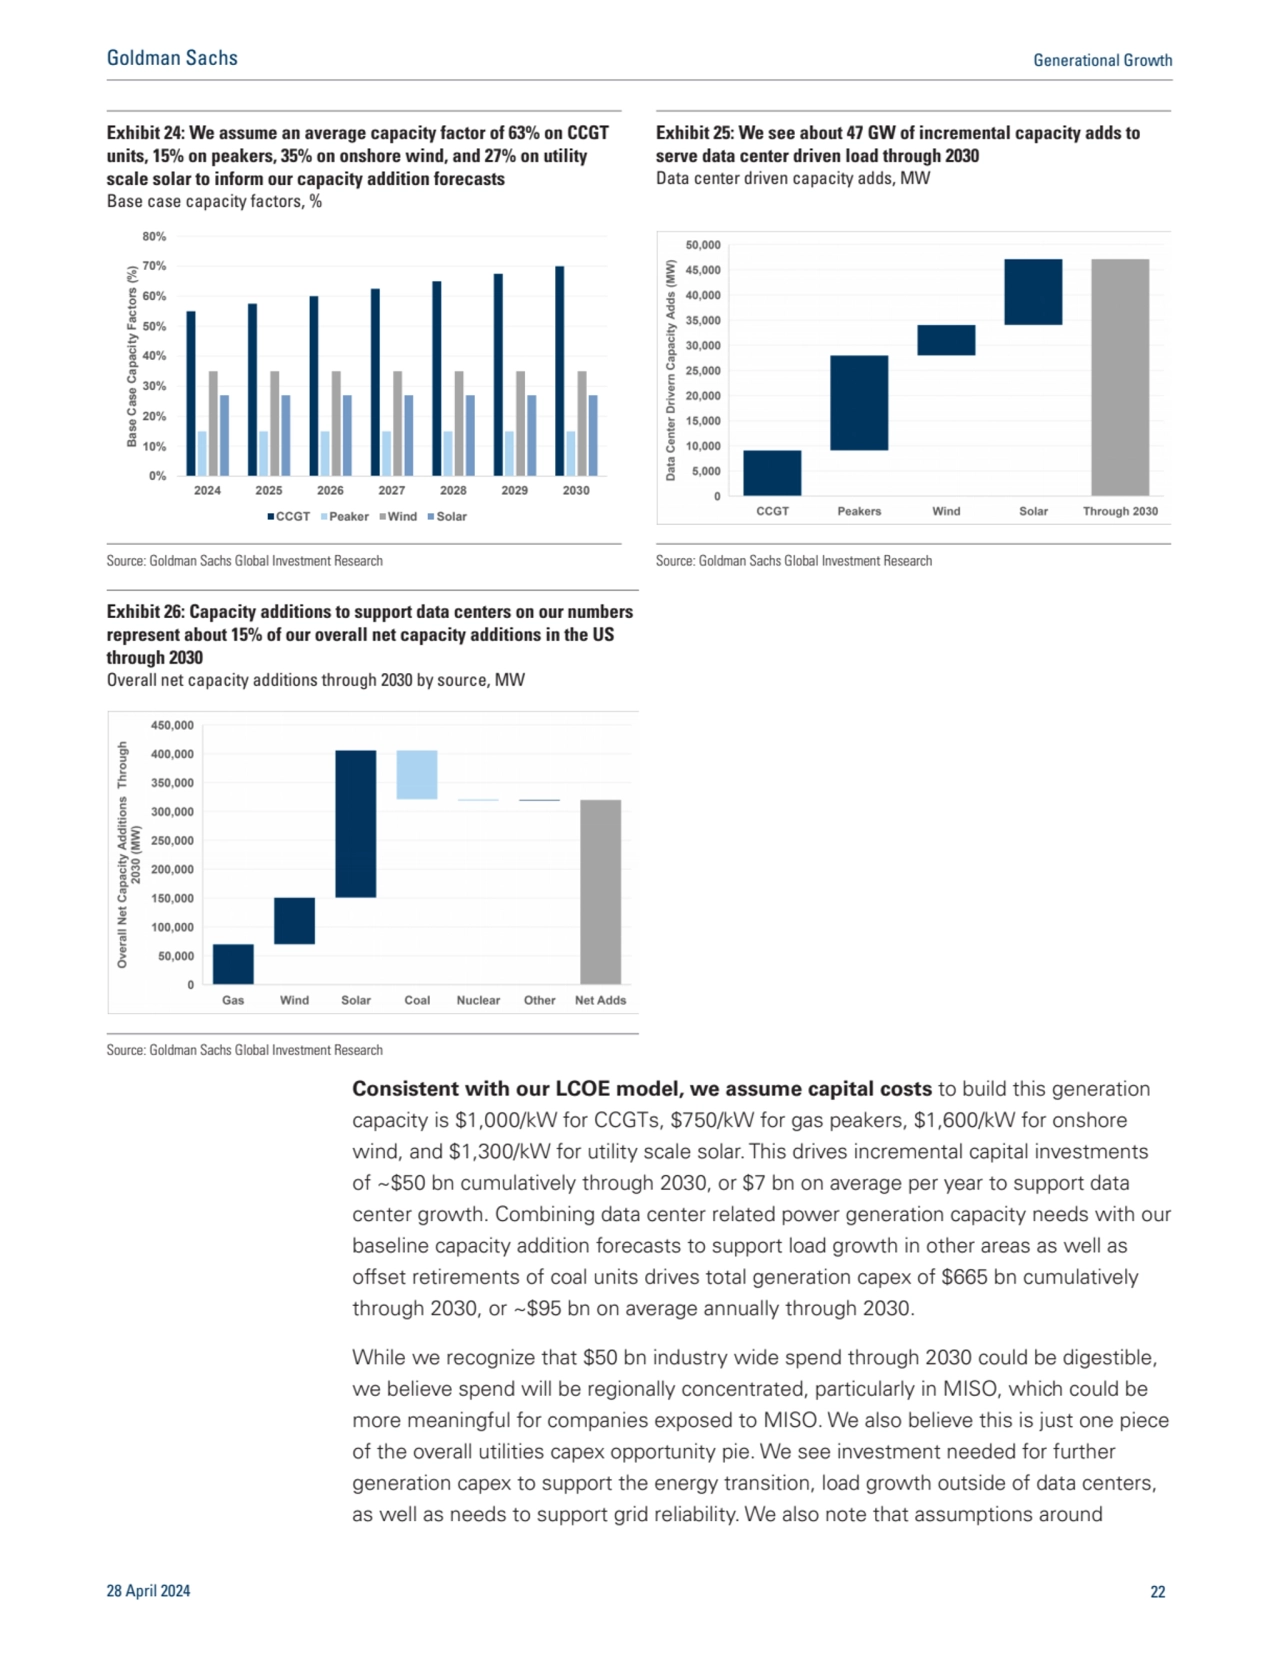
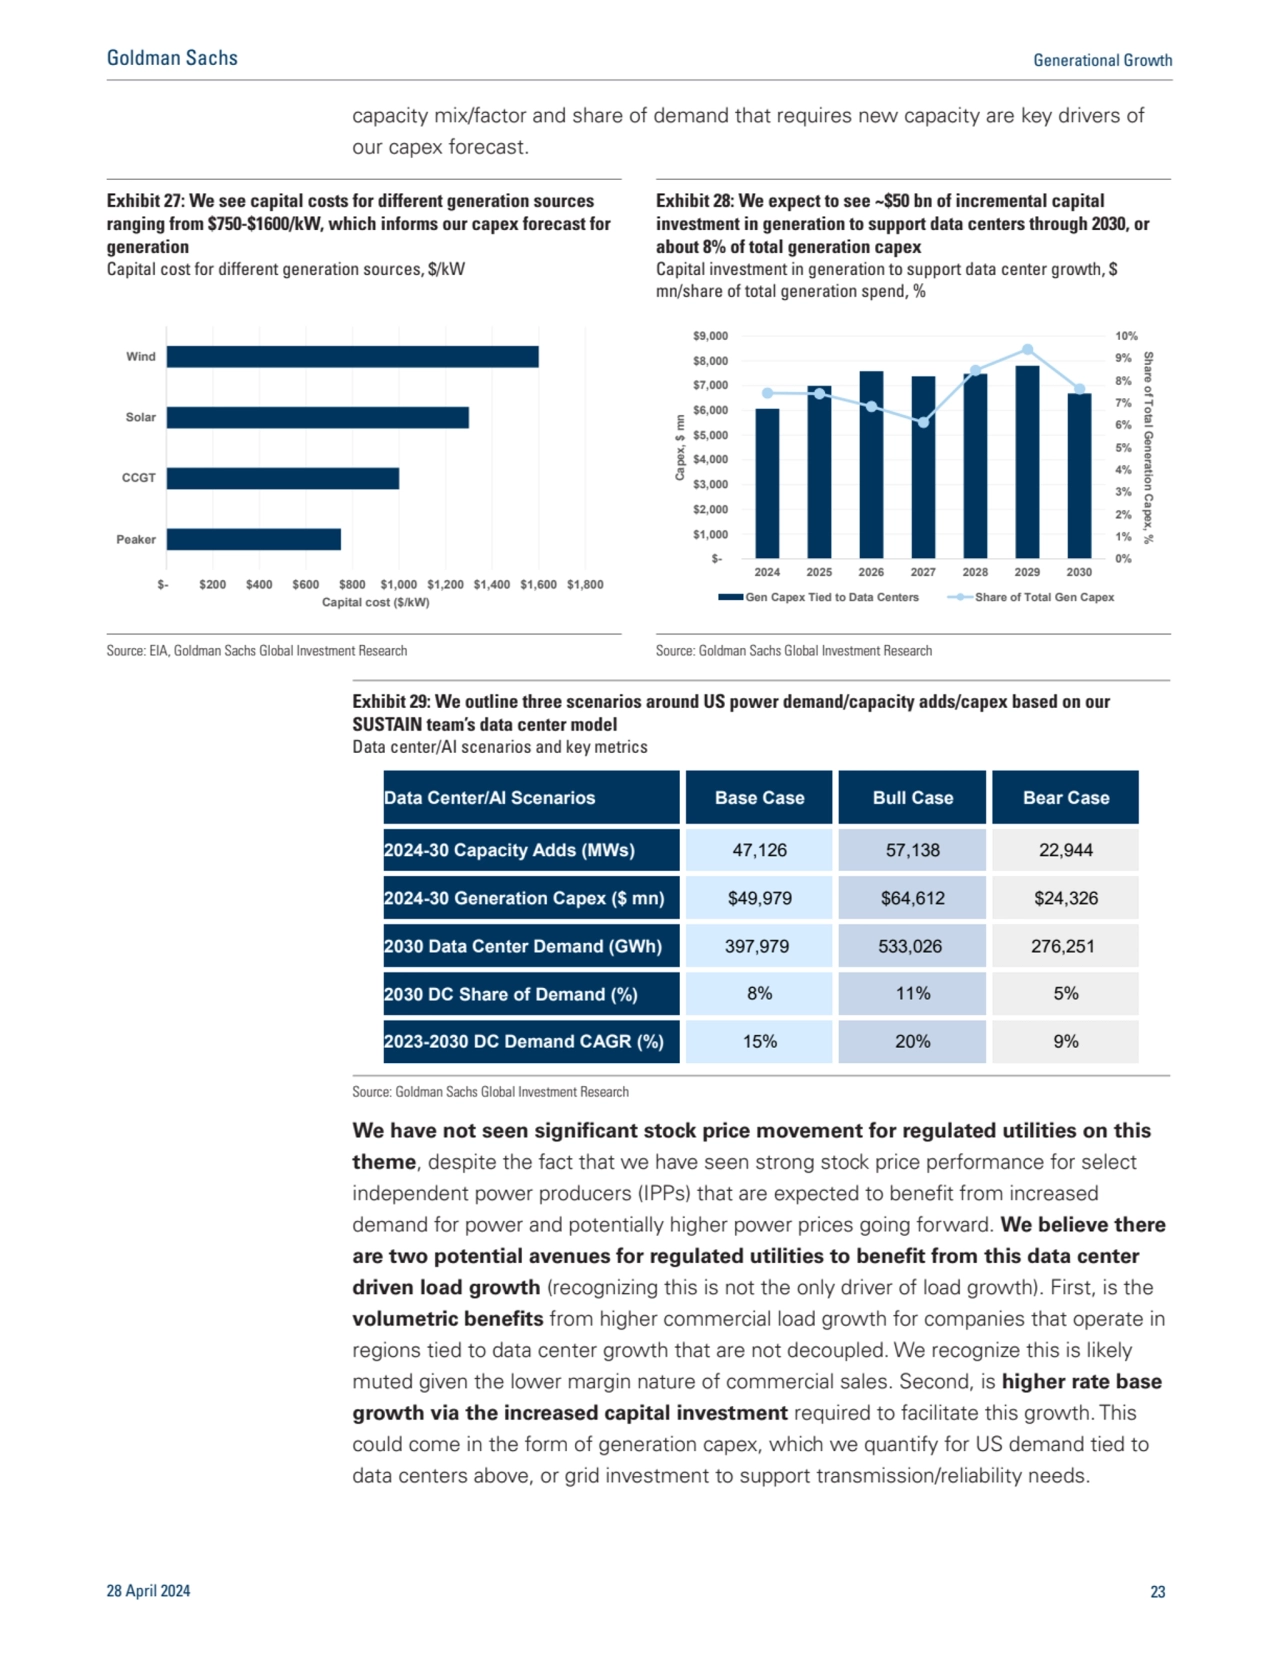
- 22. Consistent with our LCOE model, we assume capital costs to build this generation capacity is $1,000/kW for CCGTs, $750/kW for gas peakers, $1,600/kW for onshore wind, and $1,300/kW for utility scale solar. This drives incremental capital investments of ~$50 bn cumulatively through 2030, or $7 bn on average per year to support data center growth. Combining data center related power generation capacity needs with our baseline capacity addition forecasts to support load growth in other areas as well as offset retirements of coal units drives total generation capex of $665 bn cumulatively through 2030, or ~$95 bn on average annually through 2030. While we recognize that $50 bn industry wide spend through 2030 could be digestible, we believe spend will be regionally concentrated, particularly in MISO, which could be more meaningful for companies exposed to MISO. We also believe this is just one piece of the overall utilities capex opportunity pie. We see investment needed for further generation capex to support the energy transition, load growth outside of data centers, as well as needs to support grid reliability. We also note that assumptions around Exhibit 24: We assume an average capacity factor of 63% on CCGT units, 15% on peakers, 35% on onshore wind, and 27% on utility scale solar to inform our capacity addition forecasts Base case capacity factors, % Exhibit 25: We see about 47 GW of incremental capacity adds to serve data center driven load through 2030 Data center driven capacity adds, MW 2027202820292030 Average 0% 10% 20% 30% 40% 50% 60% 70% 80% 2024 2025 2026 2027 2028 2029 2030 Base Case Capacity Factors (%) CCGT Peaker Wind Solar Source: Goldman Sachs Global Investment Research Source: Goldman Sachs Global Investment Research Exhibit 26: Capacity additions to support data centers on our numbers represent about 15% of our overall net capacity additions in the US through 2030 Overall net capacity additions through 2030 by source, MW Source: Goldman Sachs Global Investment Research 28 April 2024 22 Goldman Sachs Generational Growth
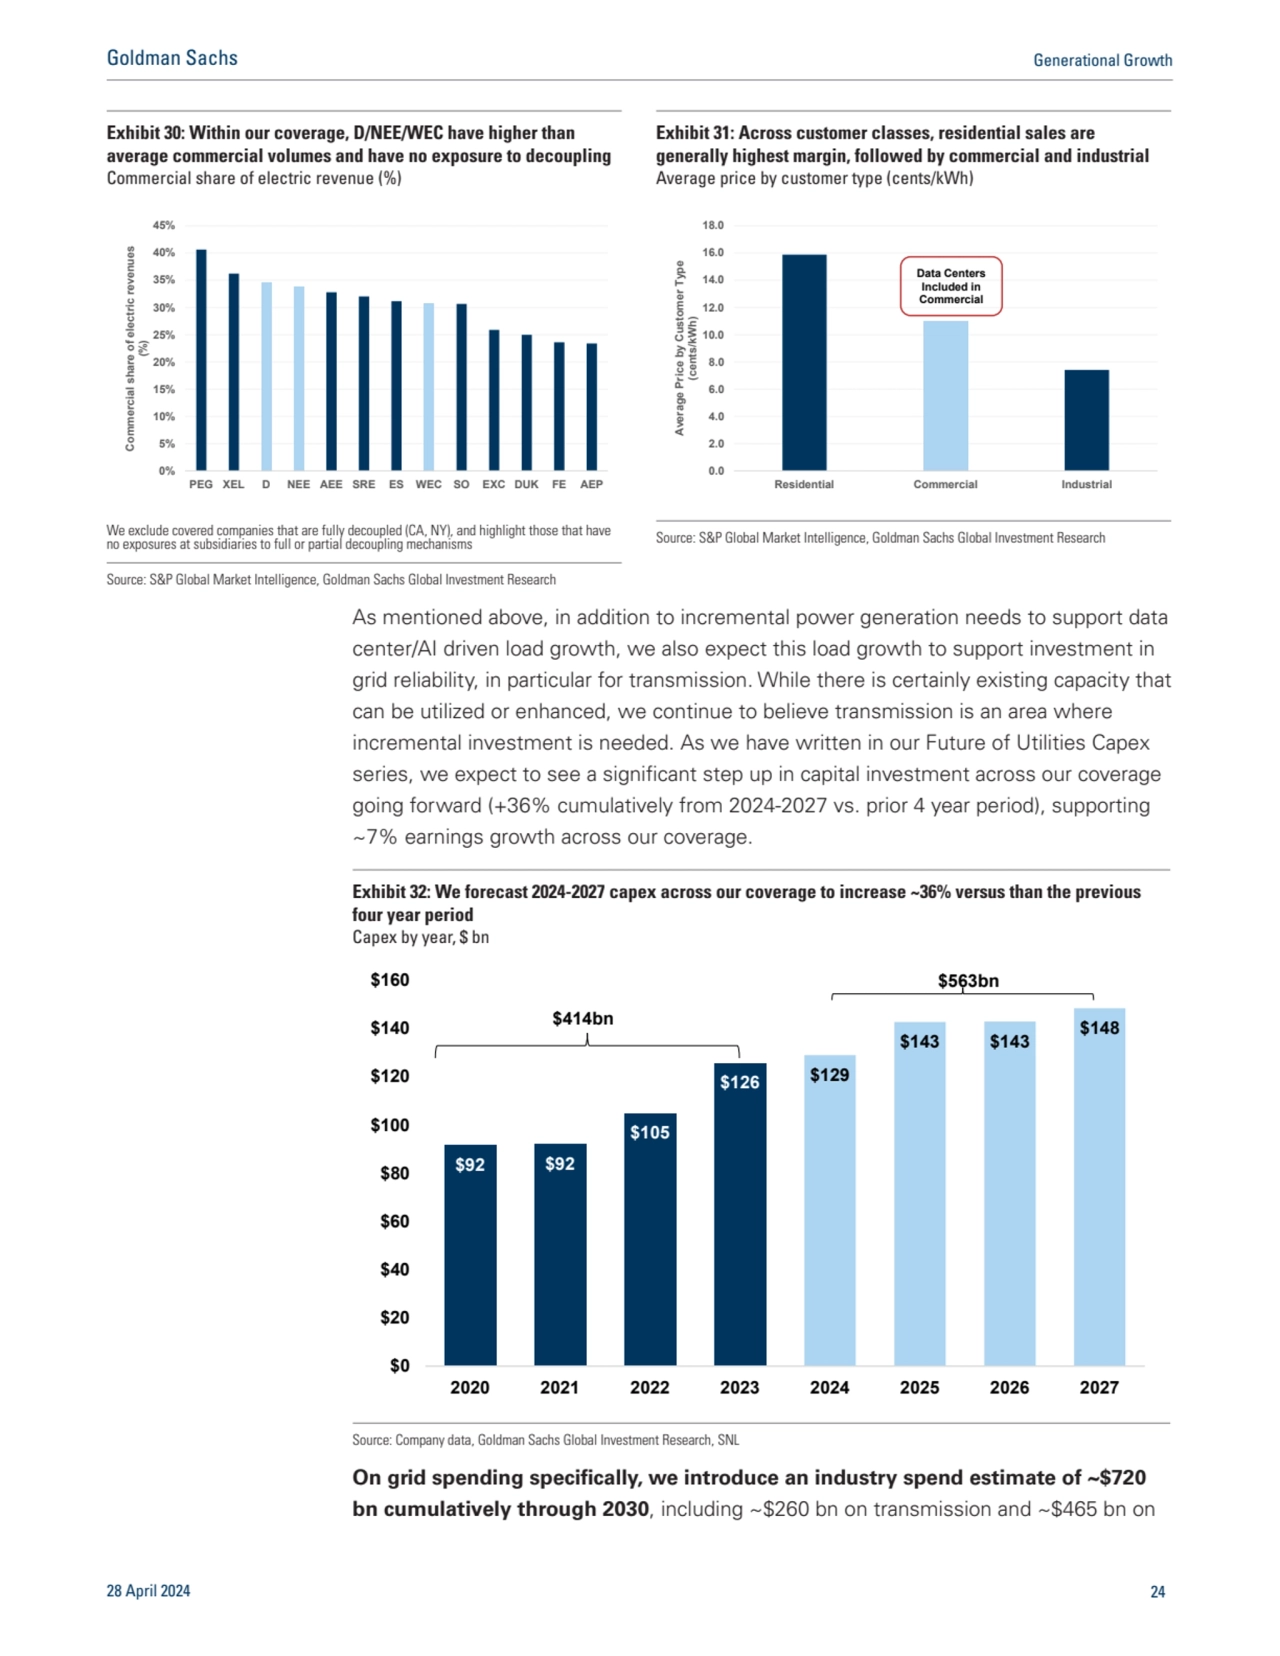
- 23. capacity mix/factor and share of demand that requires new capacity are key drivers of our capex forecast. We have not seen significant stock price movement for regulated utilities on this theme, despite the fact that we have seen strong stock price performance for select independent power producers (IPPs) that are expected to benefit from increased demand for power and potentially higher power prices going forward. We believe there are two potential avenues for regulated utilities to benefit from this data center driven load growth (recognizing this is not the only driver of load growth). First, is the volumetric benefits from higher commercial load growth for companies that operate in regions tied to data center growth that are not decoupled. We recognize this is likely muted given the lower margin nature of commercial sales. Second, is higher rate base growth via the increased capital investment required to facilitate this growth. This could come in the form of generation capex, which we quantify for US demand tied to data centers above, or grid investment to support transmission/reliability needs. Exhibit 27: We see capital costs for different generation sources ranging from $750-$1600/kW, which informs our capex forecast for generation Capital cost for different generation sources, $/kW Exhibit 28: We expect to see ~$50 bn of incremental capital investment in generation to support data centers through 2030, or about 8% of total generation capex Capital investment in generation to support data center growth, $ mn/share of total generation spend, % $- $200 $400 $600 $800 $1,000 $1,200 $1,400 $1,600 $1,800 Peaker CCGT Solar Wind Capital cost ($/kW) 0% 1% 2% 3% 4% 5% 6% 7% 8% 9% 10% $- $1,000 $2,000 $3,000 $4,000 $5,000 $6,000 $7,000 $8,000 $9,000 2024 2025 2026 2027 2028 2029 2030 Share of Total Generation Capex, % Capex, $ mn Gen Capex Tied to Data Centers Share of Total Gen Capex Source: EIA, Goldman Sachs Global Investment Research Source: Goldman Sachs Global Investment Research Exhibit 29: We outline three scenarios around US power demand/capacity adds/capex based on our SUSTAIN team’s data center model Data center/AI scenarios and key metrics Data Center/AI Scenarios Base Case Bull Case Bear Case 2024-30 Capacity Adds (MWs) 47,126 57,138 22,944 2024-30 Generation Capex ($ mn) $49,979 $64,612 $24,326 2030 Data Center Demand (GWh) 397,979 533,026 276,251 2030 DC Share of Demand (%) 8% 11% 5% 2023-2030 DC Demand CAGR (%) 15% 20% 9% Source: Goldman Sachs Global Investment Research 28 April 2024 23 Goldman Sachs Generational Growth
- 24. As mentioned above, in addition to incremental power generation needs to support data center/AI driven load growth, we also expect this load growth to support investment in grid reliability, in particular for transmission. While there is certainly existing capacity that can be utilized or enhanced, we continue to believe transmission is an area where incremental investment is needed. As we have written in our Future of Utilities Capex series, we expect to see a significant step up in capital investment across our coverage going forward (+36% cumulatively from 2024-2027 vs. prior 4 year period), supporting ~7% earnings growth across our coverage. On grid spending specifically, we introduce an industry spend estimate of ~$720 bn cumulatively through 2030, including ~$260 bn on transmission and ~$465 bn on Exhibit 30: Within our coverage, D/NEE/WEC have higher than average commercial volumes and have no exposure to decoupling Commercial share of electric revenue (%) Exhibit 31: Across customer classes, residential sales are generally highest margin, followed by commercial and industrial Average price by customer type (cents/kWh) 0% 5% 10% 15% 20% 25% 30% 35% 40% 45% PEG XEL D NEE AEE SRE ES WEC SO EXC DUK FE AEP Commercial share of electric revenues (%) 0.0 2.0 4.0 6.0 8.0 10.0 12.0 14.0 16.0 18.0 Residential Commercial Industrial Average Price by Customer Type (cents/kWh) Data Centers Included in Commercial We exclude covered companies that are fully decoupled (CA, NY), and highlight those that have no exposures at subsidiaries to full or partial decoupling mechanisms Source: S&P Global Market Intelligence, Goldman Sachs Global Investment Research Source: S&P Global Market Intelligence, Goldman Sachs Global Investment Research Exhibit 32: We forecast 2024-2027 capex across our coverage to increase ~36% versus than the previous four year period Capex by year, $ bn $92 $92 $105 $126 $129 $143 $143 $148 $0 $20 $40 $60 $80 $100 $120 $140 $160 2020 2021 2022 2023 2024 2025 2026 2027 $414bn $563bn Source: Company data, Goldman Sachs Global Investment Research, SNL 28 April 2024 24 Goldman Sachs Generational Growth
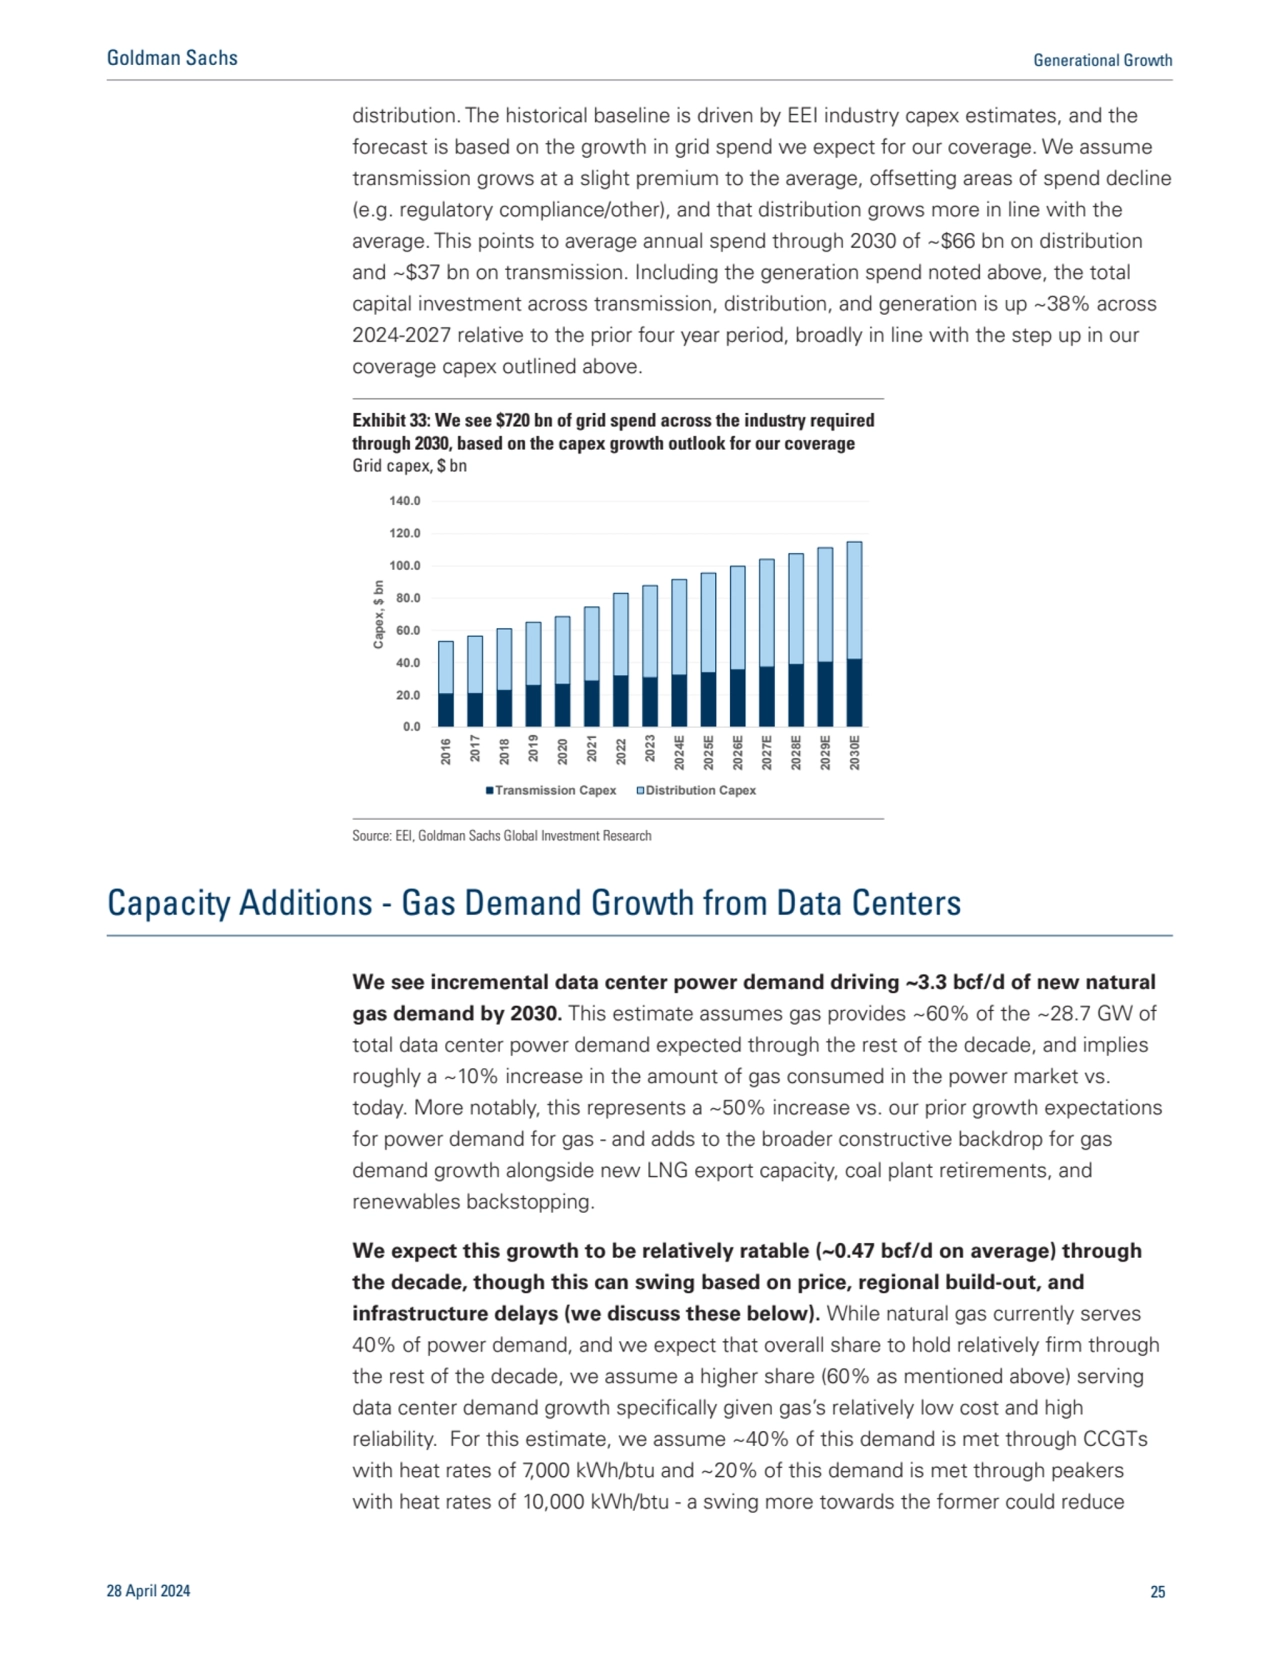
- 25. distribution. The historical baseline is driven by EEI industry capex estimates, and the forecast is based on the growth in grid spend we expect for our coverage. We assume transmission grows at a slight premium to the average, offsetting areas of spend decline (e.g. regulatory compliance/other), and that distribution grows more in line with the average. This points to average annual spend through 2030 of ~$66 bn on distribution and ~$37 bn on transmission. Including the generation spend noted above, the total capital investment across transmission, distribution, and generation is up ~38% across 2024-2027 relative to the prior four year period, broadly in line with the step up in our coverage capex outlined above. Capacity Additions - Gas Demand Growth from Data Centers We see incremental data center power demand driving ~3.3 bcf/d of new natural gas demand by 2030. This estimate assumes gas provides ~60% of the ~28.7 GW of total data center power demand expected through the rest of the decade, and implies roughly a ~10% increase in the amount of gas consumed in the power market vs. today. More notably, this represents a ~50% increase vs. our prior growth expectations for power demand for gas - and adds to the broader constructive backdrop for gas demand growth alongside new LNG export capacity, coal plant retirements, and renewables backstopping. We expect this growth to be relatively ratable (~0.47 bcf/d on average) through the decade, though this can swing based on price, regional build-out, and infrastructure delays (we discuss these below). While natural gas currently serves 40% of power demand, and we expect that overall share to hold relatively firm through the rest of the decade, we assume a higher share (60% as mentioned above) serving data center demand growth specifically given gas’s relatively low cost and high reliability. For this estimate, we assume ~40% of this demand is met through CCGTs with heat rates of 7,000 kWh/btu and ~20% of this demand is met through peakers with heat rates of 10,000 kWh/btu - a swing more towards the former could reduce Exhibit 33: We see $720 bn of grid spend across the industry required through 2030, based on the capex growth outlook for our coverage Grid capex, $ bn 0.0 20.0 40.0 60.0 80.0 100.0 120.0 140.0 2016 2017 2018 2019 2020 2021 2022 2023 2024E2025E2026E2027E2028E2029E2030E Capex, $ bn Transmission Capex Distribution Capex Source: EEI, Goldman Sachs Global Investment Research 28 April 2024 25 Goldman Sachs Generational Growth
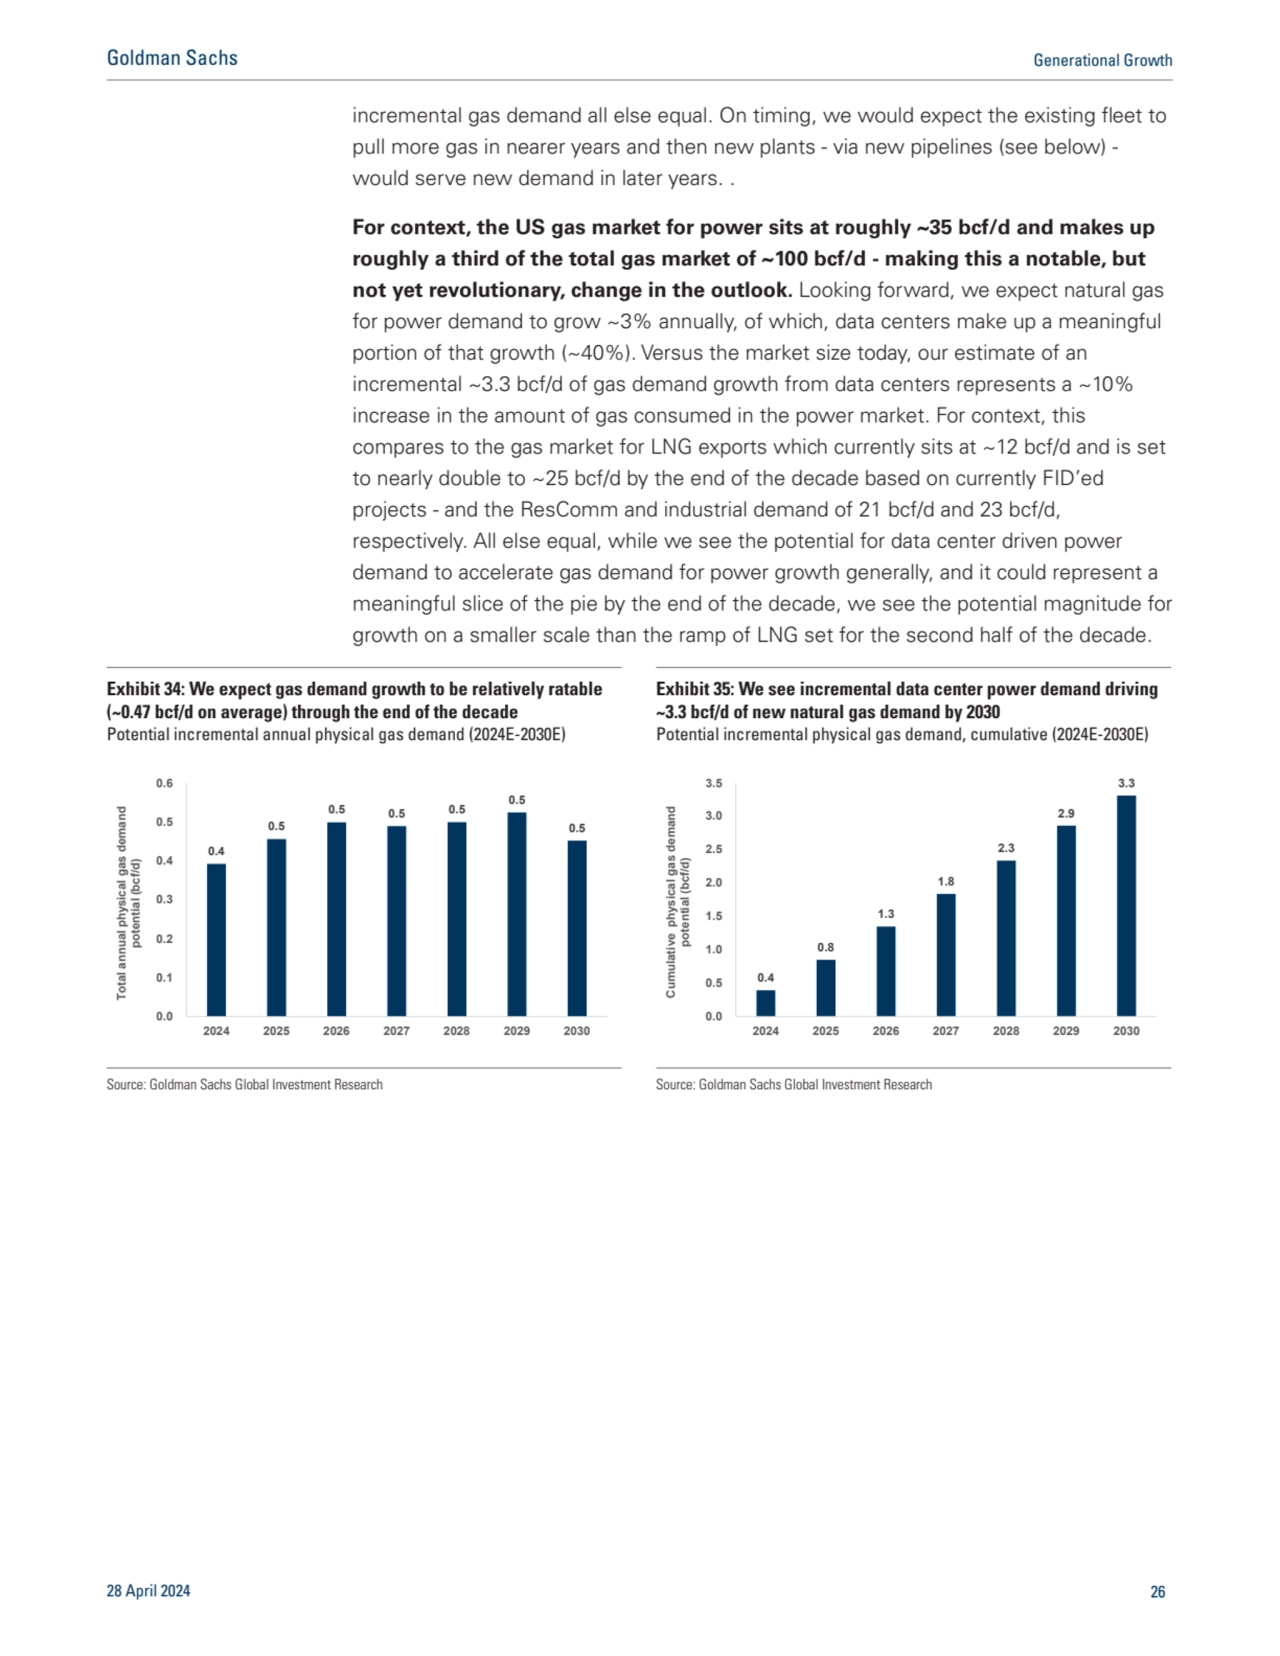
- 26. incremental gas demand all else equal. On timing, we would expect the existing fleet to pull more gas in nearer years and then new plants - via new pipelines (see below) - would serve new demand in later years. . For context, the US gas market for power sits at roughly ~35 bcf/d and makes up roughly a third of the total gas market of ~100 bcf/d - making this a notable, but not yet revolutionary, change in the outlook. Looking forward, we expect natural gas for power demand to grow ~3% annually, of which, data centers make up a meaningful portion of that growth (~40%). Versus the market size today, our estimate of an incremental ~3.3 bcf/d of gas demand growth from data centers represents a ~10% increase in the amount of gas consumed in the power market. For context, this compares to the gas market for LNG exports which currently sits at ~12 bcf/d and is set to nearly double to ~25 bcf/d by the end of the decade based on currently FID’ed projects - and the ResComm and industrial demand of 21 bcf/d and 23 bcf/d, respectively. All else equal, while we see the potential for data center driven power demand to accelerate gas demand for power growth generally, and it could represent a meaningful slice of the pie by the end of the decade, we see the potential magnitude for growth on a smaller scale than the ramp of LNG set for the second half of the decade. Exhibit 34: We expect gas demand growth to be relatively ratable (~0.47 bcf/d on average) through the end of the decade Potential incremental annual physical gas demand (2024E-2030E) Exhibit 35: We see incremental data center power demand driving ~3.3 bcf/d of new natural gas demand by 2030 Potential incremental physical gas demand, cumulative (2024E-2030E) 0.4 0.5 0.5 0.5 0.5 0.5 0.5 0.0 0.1 0.2 0.3 0.4 0.5 0.6 2024 2025 2026 2027 2028 2029 2030 Total annual physical gas demand potential (bcf/d) 0.4 0.8 1.3 1.8 2.3 2.9 3.3 0.0 0.5 1.0 1.5 2.0 2.5 3.0 3.5 2024 2025 2026 2027 2028 2029 2030 Cumulative physical gas demand potential (bcf/d) Source: Goldman Sachs Global Investment Research Source: Goldman Sachs Global Investment Research 28 April 2024 26 Goldman Sachs Generational Growth
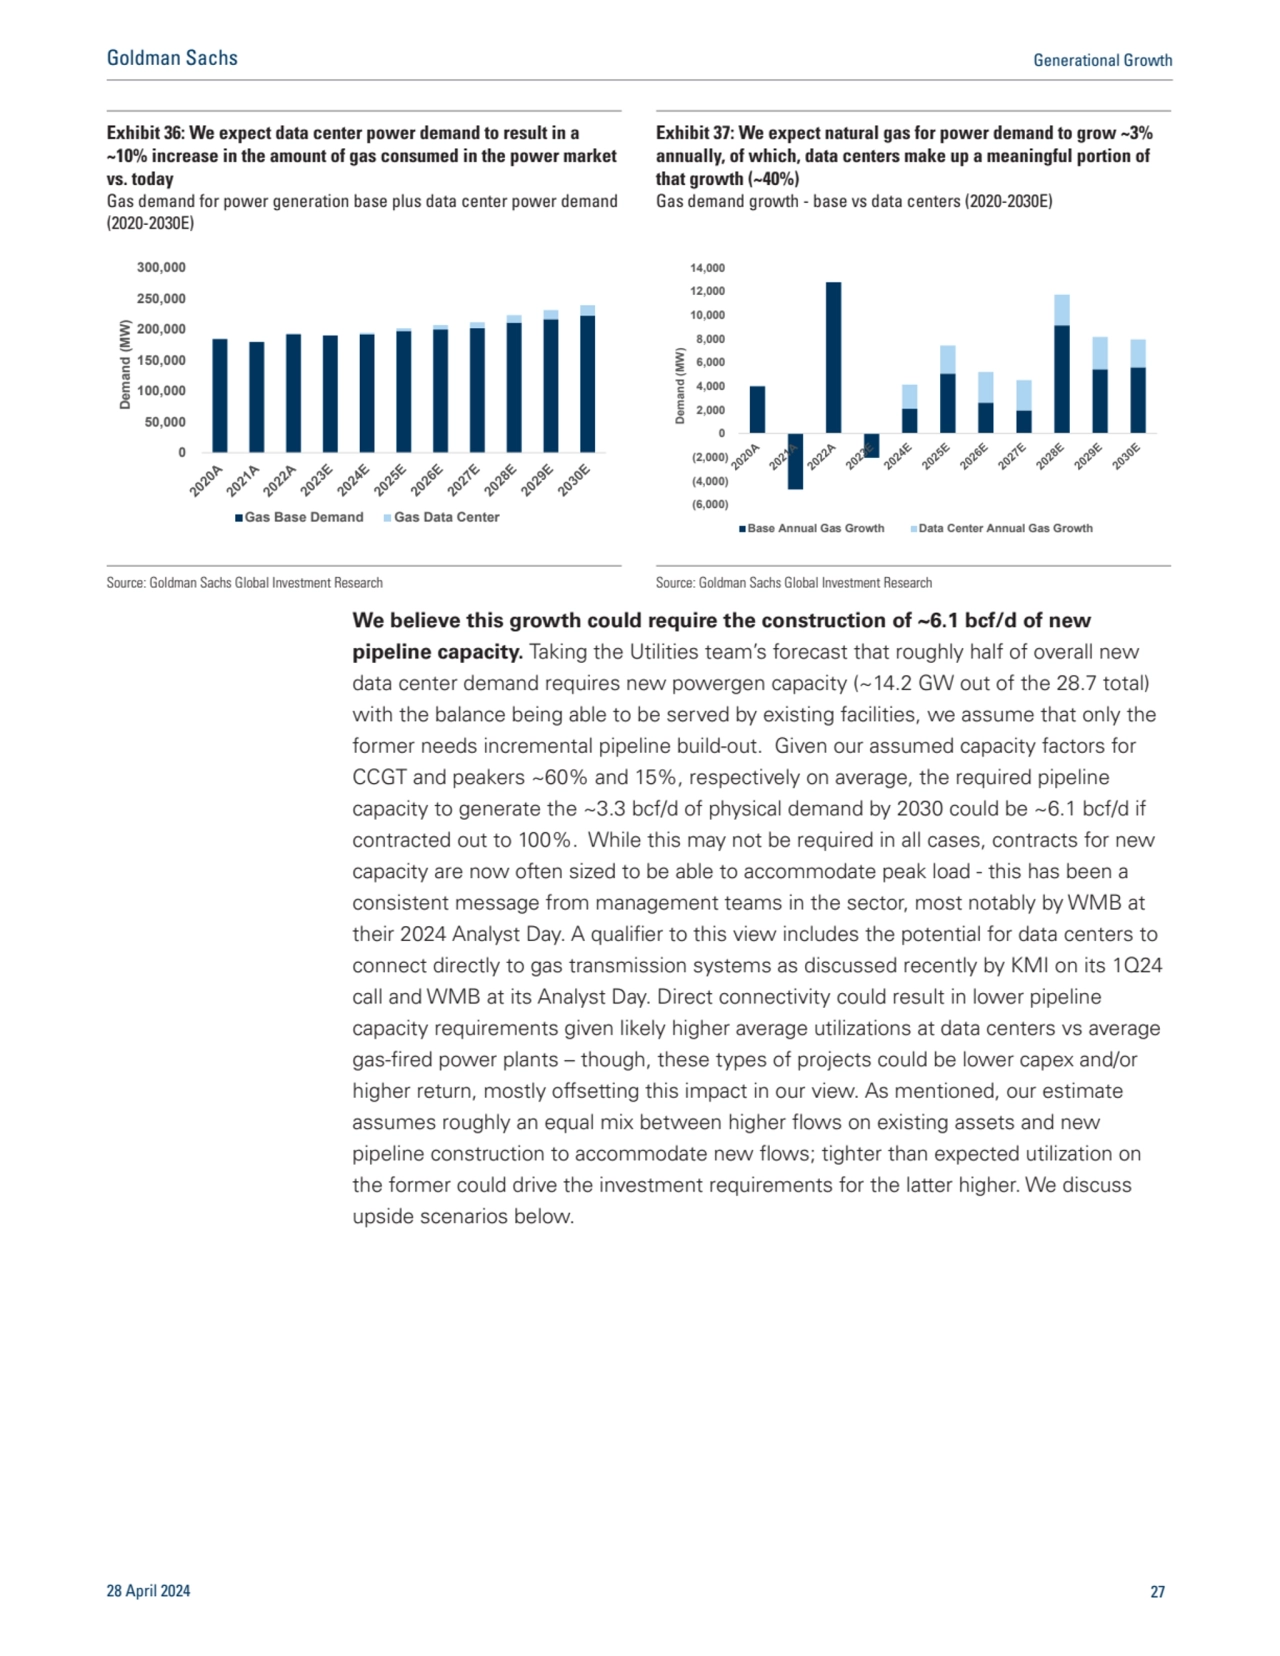
- 27. We believe this growth could require the construction of ~6.1 bcf/d of new pipeline capacity. Taking the Utilities team’s forecast that roughly half of overall new data center demand requires new powergen capacity (~14.2 GW out of the 28.7 total) with the balance being able to be served by existing facilities, we assume that only the former needs incremental pipeline build-out. Given our assumed capacity factors for CCGT and peakers ~60% and 15%, respectively on average, the required pipeline capacity to generate the ~3.3 bcf/d of physical demand by 2030 could be ~6.1 bcf/d if contracted out to 100%. While this may not be required in all cases, contracts for new capacity are now often sized to be able to accommodate peak load - this has been a consistent message from management teams in the sector, most notably by WMB at their 2024 Analyst Day. A qualifier to this view includes the potential for data centers to connect directly to gas transmission systems as discussed recently by KMI on its 1Q24 call and WMB at its Analyst Day. Direct connectivity could result in lower pipeline capacity requirements given likely higher average utilizations at data centers vs average gas-fired power plants – though, these types of projects could be lower capex and/or higher return, mostly offsetting this impact in our view. As mentioned, our estimate assumes roughly an equal mix between higher flows on existing assets and new pipeline construction to accommodate new flows; tighter than expected utilization on the former could drive the investment requirements for the latter higher. We discuss upside scenarios below. Exhibit 36: We expect data center power demand to result in a ~10% increase in the amount of gas consumed in the power market vs. today Gas demand for power generation base plus data center power demand (2020-2030E) Exhibit 37: We expect natural gas for power demand to grow ~3% annually, of which, data centers make up a meaningful portion of that growth (~40%) Gas demand growth - base vs data centers (2020-2030E) 0 50,000 100,000 150,000 200,000 250,000 300,000 Demand (MW) Gas Base Demand Gas Data Center (6,000) (4,000) (2,000) 0 2,000 4,000 6,000 8,000 10,000 12,000 14,000 Demand (MW) Base Annual Gas Growth Data Center Annual Gas Growth Source: Goldman Sachs Global Investment Research Source: Goldman Sachs Global Investment Research 28 April 2024 27 Goldman Sachs Generational Growth
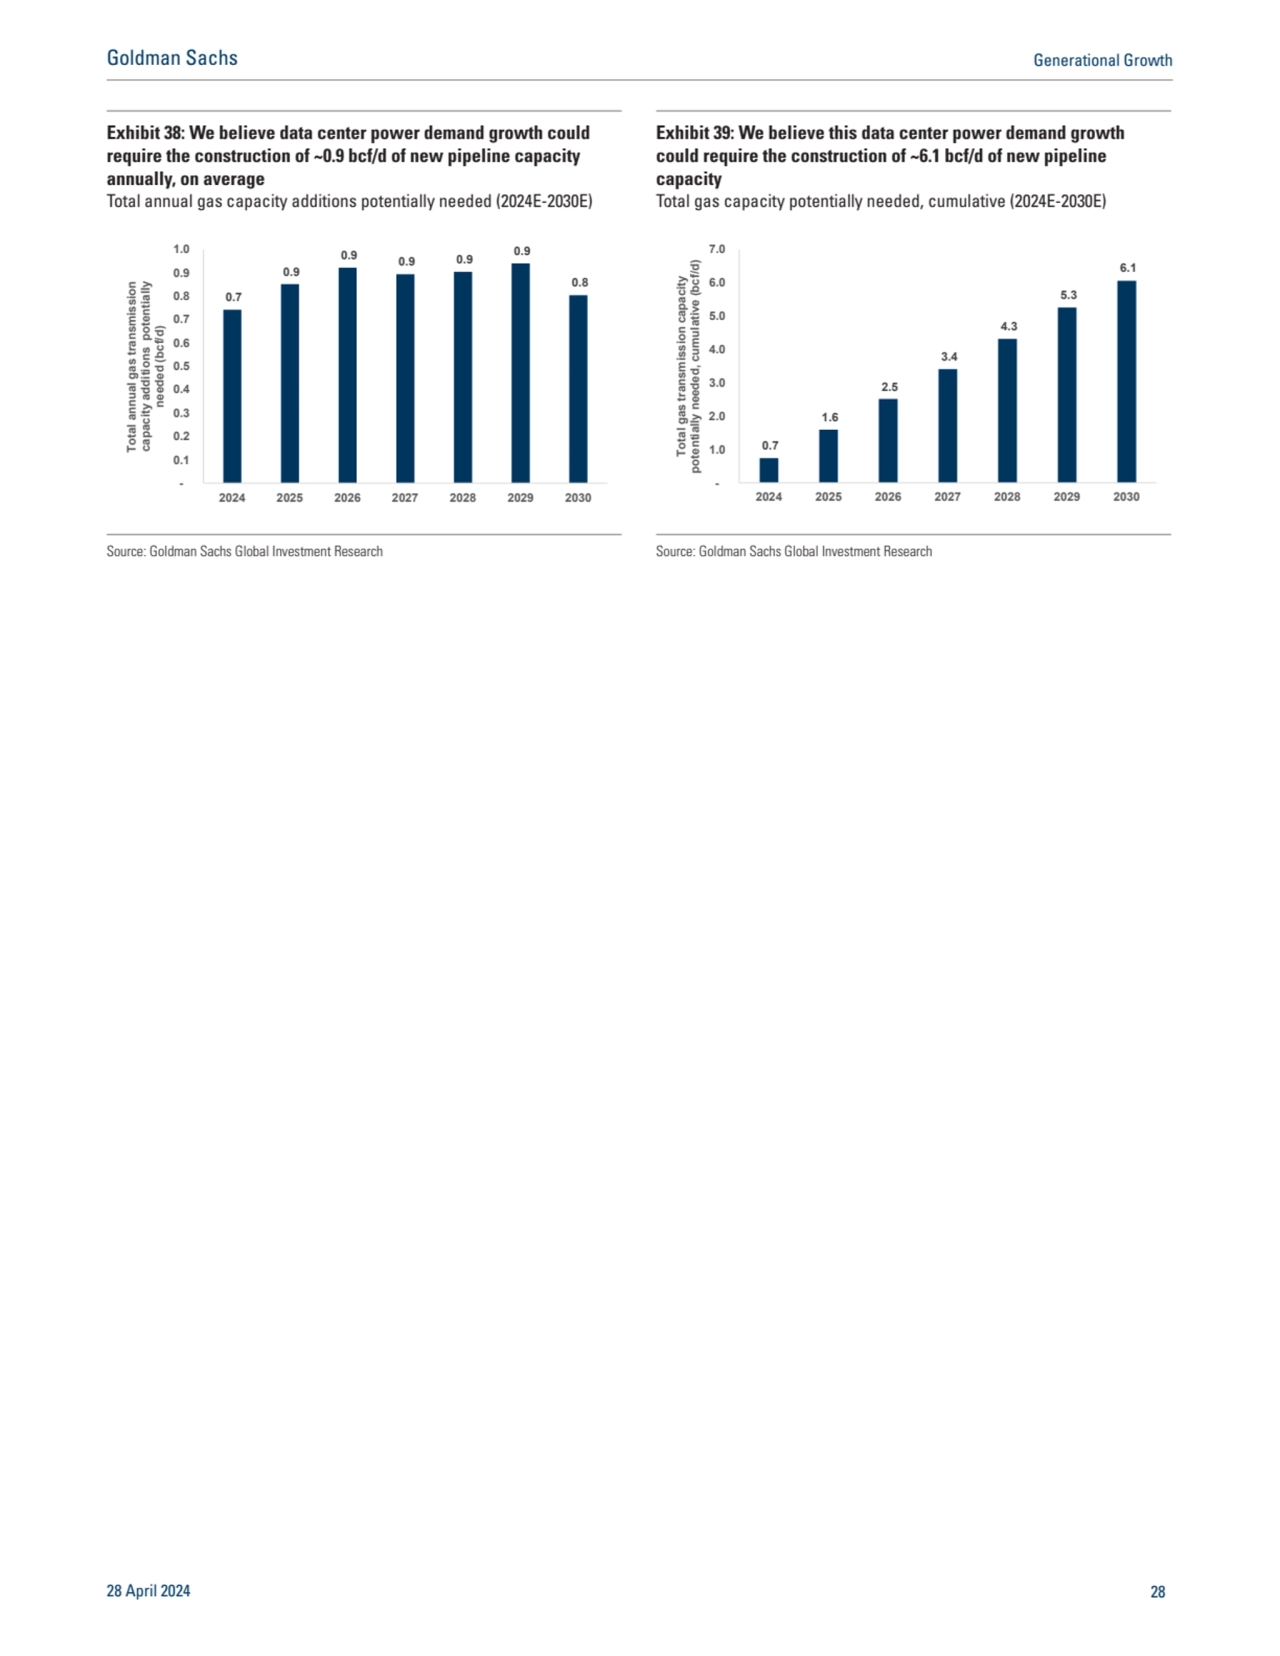
- 28. Exhibit 38: We believe data center power demand growth could require the construction of ~0.9 bcf/d of new pipeline capacity annually, on average Total annual gas capacity additions potentially needed (2024E-2030E) Exhibit 39: We believe this data center power demand growth could require the construction of ~6.1 bcf/d of new pipeline capacity Total gas capacity potentially needed, cumulative (2024E-2030E) 0.7 0.9 0.9 0.9 0.9 0.9 0.8 - 0.1 0.2 0.3 0.4 0.5 0.6 0.7 0.8 0.9 1.0 2024 2025 2026 2027 2028 2029 2030 Total annual gas transmission capacity additions potentially needed (bcf/d) 0.7 1.6 2.5 3.4 4.3 5.3 6.1 - 1.0 2.0 3.0 4.0 5.0 6.0 7.0 2024 2025 2026 2027 2028 2029 2030 Total gas transmission capacity potentially needed, cumulative (bcf/d) Source: Goldman Sachs Global Investment Research Source: Goldman Sachs Global Investment Research 28 April 2024 28 Goldman Sachs Generational Growth
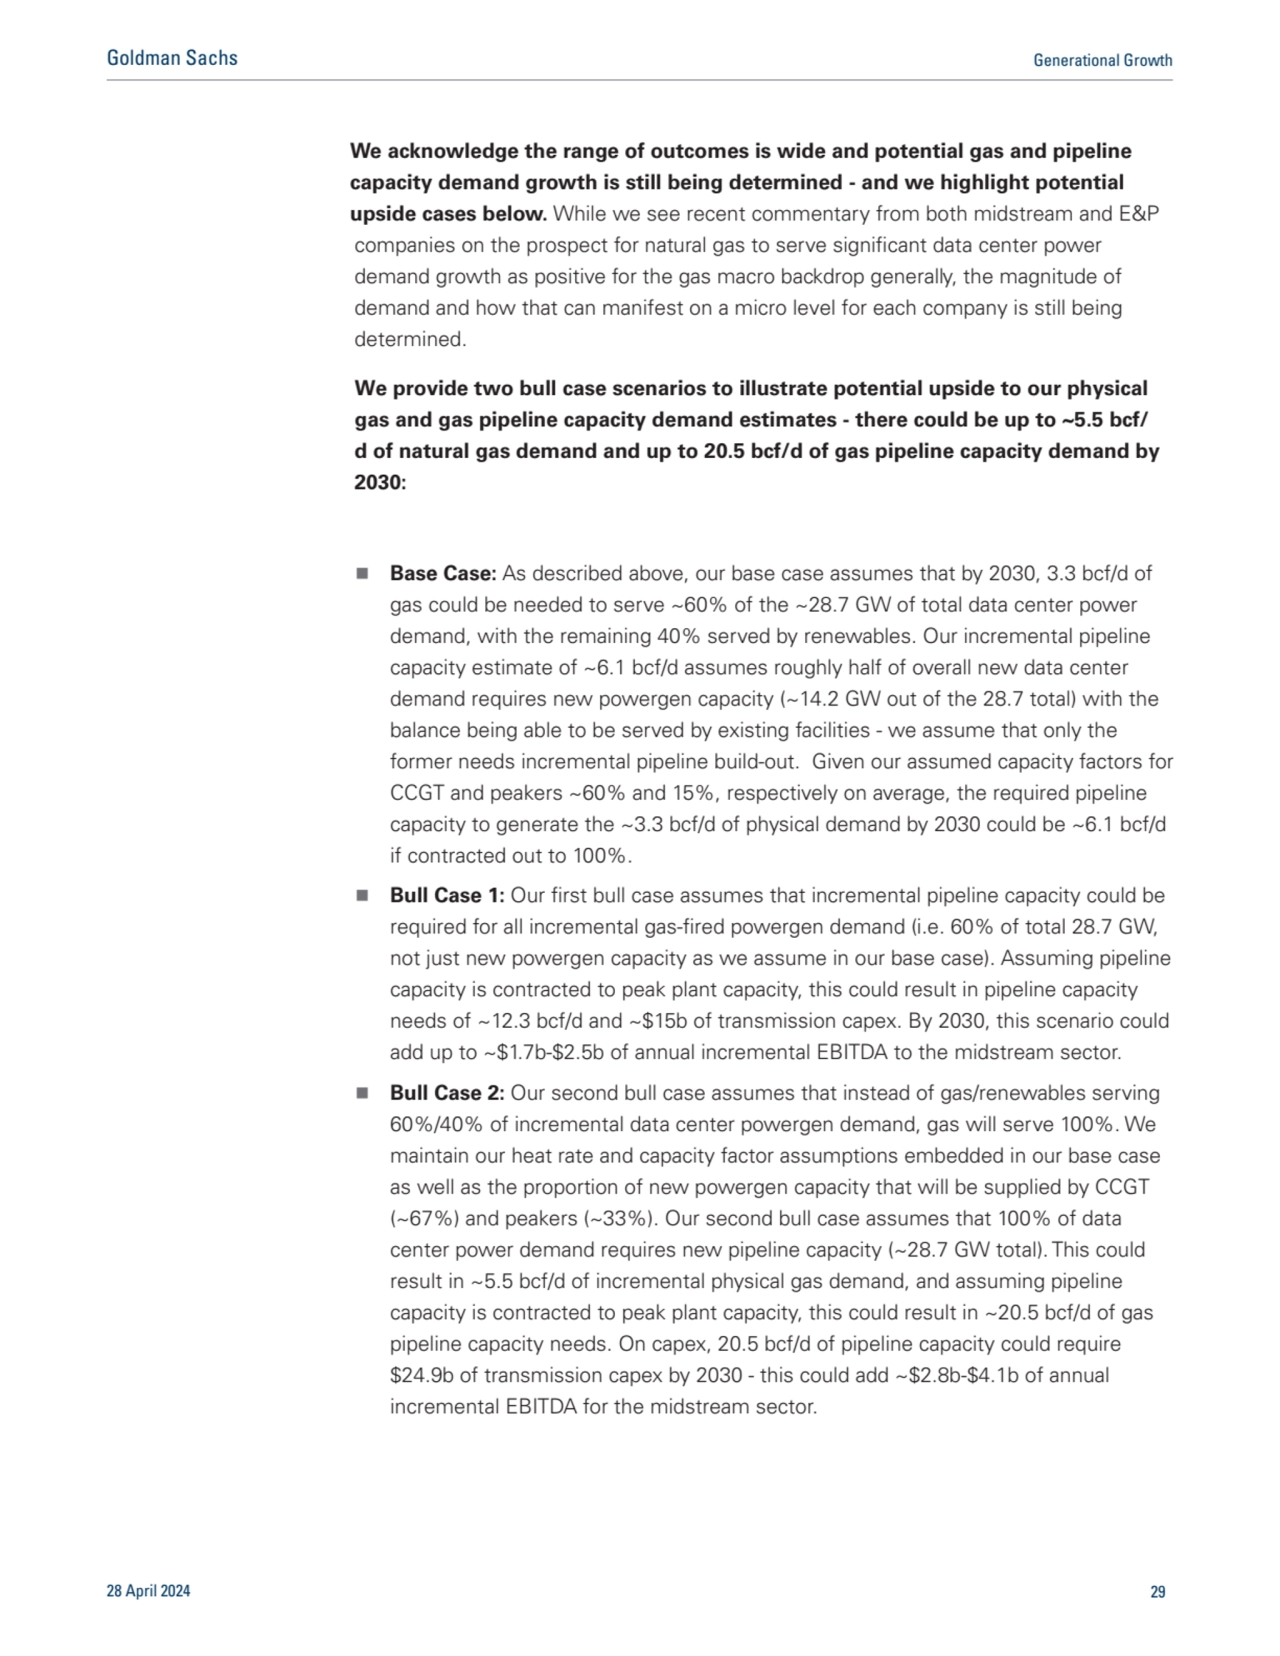
- 29. companies on the prospect for natural gas to serve significant data center power demand growth as positive for the gas macro backdrop generally, the magnitude of demand and how that can manifest on a micro level for each company is still being determined. We provide two bull case scenarios to illustrate potential upside to our physical gas and gas pipeline capacity demand estimates - there could be up to ~5.5 bcf/ d of natural gas demand and up to 20.5 bcf/d of gas pipeline capacity demand by 2030: n Base Case: As described above, our base case assumes that by 2030, 3.3 bcf/d of gas could be needed to serve ~60% of the ~28.7 GW of total data center power demand, with the remaining 40% served by renewables. Our incremental pipeline capacity estimate of ~6.1 bcf/d assumes roughly half of overall new data center demand requires new powergen capacity (~14.2 GW out of the 28.7 total) with the balance being able to be served by existing facilities - we assume that only the former needs incremental pipeline build-out. Given our assumed capacity factors for CCGT and peakers ~60% and 15%, respectively on average, the required pipeline capacity to generate the ~3.3 bcf/d of physical demand by 2030 could be ~6.1 bcf/d if contracted out to 100%. n Bull Case 1: Our first bull case assumes that incremental pipeline capacity could be required for all incremental gas-fired powergen demand (i.e. 60% of total 28.7 GW, not just new powergen capacity as we assume in our base case). Assuming pipeline capacity is contracted to peak plant capacity, this could result in pipeline capacity needs of ~12.3 bcf/d and ~$15b of transmission capex. By 2030, this scenario could add up to ~$1.7b-$2.5b of annual incremental EBITDA to the midstream sector. n Bull Case 2: Our second bull case assumes that instead of gas/renewables serving 60%/40% of incremental data center powergen demand, gas will serve 100%. We maintain our heat rate and capacity factor assumptions embedded in our base case as well as the proportion of new powergen capacity that will be supplied by CCGT (~67%) and peakers (~33%). Our second bull case assumes that 100% of data center power demand requires new pipeline capacity (~28.7 GW total). This could result in ~5.5 bcf/d of incremental physical gas demand, and assuming pipeline capacity is contracted to peak plant capacity, this could result in ~20.5 bcf/d of gas pipeline capacity needs. On capex, 20.5 bcf/d of pipeline capacity could require $24.9b of transmission capex by 2030 - this could add ~$2.8b-$4.1b of annual incremental EBITDA for the midstream sector. 28 April 2024 29 Goldman Sachs Generational Growth We acknowledge the range of outcomes is wide and potential gas and pipeline capacity demand growth is still being determined - and we highlight potential upside cases below. While we see recent commentary from both midstream and E&P
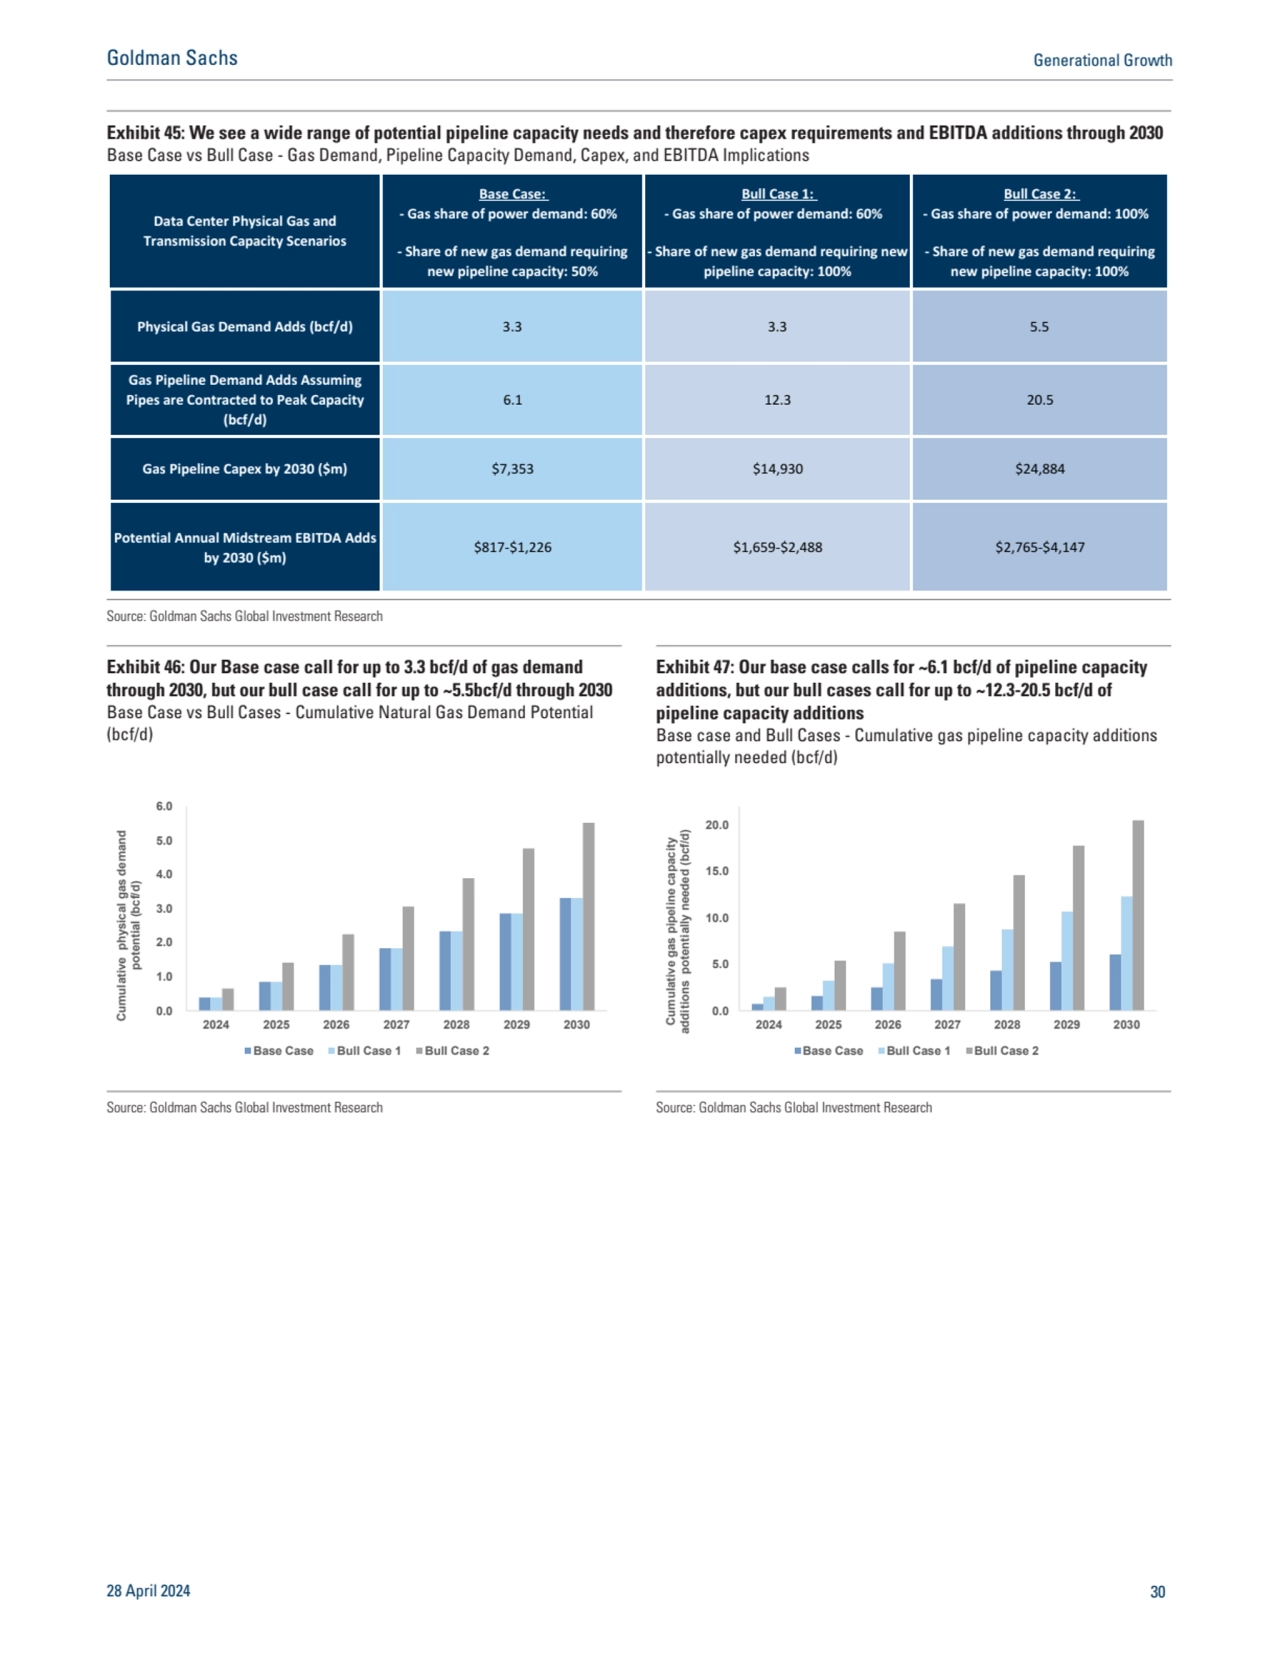
- 30. Exhibit 45: We see a wide range of potential pipeline capacity needs and therefore capex requirements and EBITDA additions through 2030 Base Case vs Bull Case - Gas Demand, Pipeline Capacity Demand, Capex, and EBITDA Implications Base Case: - Gas share of power demand: 60% Bull Case 1: - Gas share of power demand: 60% Bull Case 2: - Gas share of power demand: 100% - Share of new gas demand requiring new pipeline capacity: 50% - Share of new gas demand requiring new pipeline capacity: 100% - Share of new gas demand requiring new pipeline capacity: 100% Physical Gas Demand Adds (bcf/d) 3.3 3.3 5.5 Gas Pipeline Demand Adds Assuming Pipes are Contracted to Peak Capacity (bcf/d) 6.1 12.3 20.5 Gas Pipeline Capex by 2030 ($m) $7,353 $14,930 $24,884 Potential Annual Midstream EBITDA Adds by 2030 ($m) $817-$1,226 $1,659-$2,488 $2,765-$4,147 Data Center Physical Gas and Transmission Capacity Scenarios Source: Goldman Sachs Global Investment Research Exhibit 46: Our Base case call for up to 3.3 bcf/d of gas demand through 2030, but our bull case call for up to ~5.5bcf/d through 2030 Base Case vs Bull Cases - Cumulative Natural Gas Demand Potential (bcf/d) Exhibit 47: Our base case calls for ~6.1 bcf/d of pipeline capacity additions, but our bull cases call for up to ~12.3-20.5 bcf/d of pipeline capacity additions Base case and Bull Cases - Cumulative gas pipeline capacity additions potentially needed (bcf/d) 0.0 1.0 2.0 3.0 4.0 5.0 6.0 2024 2025 2026 2027 2028 2029 2030 Cumulative physical gas demand potential (bcf/d) Base Case Bull Case 1 Bull Case 2 0.0 5.0 10.0 15.0 20.0 Cumulative gas pipeline capacity 2024 2025 2026 2027 2028 2029 2030 additions potentially needed (bcf/d) Base Case Bull Case 1 Bull Case 2 Source: Goldman Sachs Global Investment Research Source: Goldman Sachs Global Investment Research 28 April 2024 30 Goldman Sachs Generational Growth
- 31. Disclosure Appendix Reg AC We, Carly Davenport, Brian Singer, CFA, Neil Mehta, Brian Lee, CFA, John Mackay, Ati Modak, Brendan Corbett, John Miller, Toshiya Hari, Joe Ritchie, Mark Delaney, CFA, Jerry Revich, CFA, Jaskaran Jaiya, Varsha Venugopal, Nick Cash and Olivia Halferty, hereby certify that all of the views expressed in this report accurately reflect our personal views about the subject company or companies and its or their securities. We also certify that no part of our compensation was, is or will be, directly or indirectly, related to the specific recommendations or views expressed in this report. Unless otherwise stated, the individuals listed on the cover page of this report are analysts in Goldman Sachs’ Global Investment Research division. GS Factor Profile The Goldman Sachs Factor Profile provides investment context for a stock by comparing key attributes to the market (i.e. our coverage universe) and its sector peers. The four key attributes depicted are: Growth, Financial Returns, Multiple (e.g. valuation) and Integrated (a composite of Growth, Financial Returns and Multiple). Growth, Financial Returns and Multiple are calculated by using normalized ranks for specific metrics for each stock. The normalized ranks for the metrics are then averaged and converted into percentiles for the relevant attribute. The precise calculation of each metric may vary depending on the fiscal year, industry and region, but the standard approach is as follows: Growth is based on a stock’s forward-looking sales growth, EBITDA growth and EPS growth (for financial stocks, only EPS and sales growth), with a higher percentile indicating a higher growth company. Financial Returns is based on a stock’s forward-looking ROE, ROCE and CROCI (for financial stocks, only ROE), with a higher percentile indicating a company with higher financial returns. Multiple is based on a stock’s forward-looking P/E, P/B, price/dividend (P/D), EV/EBITDA, EV/FCF and EV/Debt Adjusted Cash Flow (DACF) (for financial stocks, only P/E, P/B and P/D), with a higher percentile indicating a stock trading at a higher multiple. The Integrated percentile is calculated as the average of the Growth percentile, Financial Returns percentile and (100% - Multiple percentile). Financial Returns and Multiple use the Goldman Sachs analyst forecasts at the fiscal year-end at least three quarters in the future. Growth uses inputs for the fiscal year at least seven quarters in the future compared with the year at least three quarters in the future (on a per-share basis for all metrics). For a more detailed description of how we calculate the GS Factor Profile, please contact your GS representative. M&A Rank Across our global coverage, we examine stocks using an M&A framework, considering both qualitative factors and quantitative factors (which may vary across sectors and regions) to incorporate the potential that certain companies could be acquired. We then assign a M&A rank as a means of scoring companies under our rated coverage from 1 to 3, with 1 representing high (30%-50%) probability of the company becoming an acquisition target, 2 representing medium (15%-30%) probability and 3 representing low (0%-15%) probability. For companies ranked 1 or 2, in line with our standard departmental guidelines we incorporate an M&A component into our target price. M&A rank of 3 is considered immaterial and therefore does not factor into our price target, and may or may not be discussed in research. Quantum Quantum is Goldman Sachs’ proprietary database providing access to detailed financial statement histories, forecasts and ratios. It can be used for in-depth analysis of a single company, or to make comparisons between companies in different sectors and markets. Disclosures Financial Advisory Disclosure Goldman Sachs and/or one of its affiliates is acting as a financial advisor in connection with an announced strategic matter involving the following company or one of its affiliates: Dominion Energy, Inc. Distribution of ratings/investment banking relationships Goldman Sachs Investment Research global Equity coverage universe 28 April 2024 31 Goldman Sachs Generational Growth
- 32. As of April 1, 2024, Goldman Sachs Global Investment Research had investment ratings on 2,885 equity securities. Goldman Sachs assigns stocks as Buys and Sells on various regional Investment Lists; stocks not so assigned are deemed Neutral. Such assignments equate to Buy, Hold and Sell for the purposes of the above disclosure required by the FINRA Rules. See ‘Ratings, Coverage universe and related definitions’ below. The Investment Banking Relationships chart reflects the percentage of subject companies within each rating category for whom Goldman Sachs has provided investment banking services within the previous twelve months. Regulatory disclosures Disclosures required by United States laws and regulations See company-specific regulatory disclosures above for any of the following disclosures required as to companies referred to in this report: manager or co-manager in a pending transaction; 1% or other ownership; compensation for certain services; types of client relationships; managed/co-managed public offerings in prior periods; directorships; for equity securities, market making and/or specialist role. Goldman Sachs trades or may trade as a principal in debt securities (or in related derivatives) of issuers discussed in this report. The following are additional required disclosures: Ownership and material conflicts of interest: Goldman Sachs policy prohibits its analysts, professionals reporting to analysts and members of their households from owning securities of any company in the analyst’s area of coverage. Analyst compensation: Analysts are paid in part based on the profitability of Goldman Sachs, which includes investment banking revenues. Analyst as officer or director: Goldman Sachs policy generally prohibits its analysts, persons reporting to analysts or members of their households from serving as an officer, director or advisor of any company in the analyst’s area of coverage. Non-U.S. Analysts: Non-U.S. analysts may not be associated persons of Goldman Sachs & Co. LLC and therefore may not be subject to FINRA Rule 2241 or FINRA Rule 2242 restrictions on communications with subject company, public appearances and trading securities held by the analysts. Distribution of ratings: See the distribution of ratings disclosure above. Price chart: See the price chart, with changes of ratings and price targets in prior periods, above, or, if electronic format or if with respect to multiple companies which are the subject of this report, on the Goldman Sachs website at https://www.gs.com/research/hedge.html. Rating Distribution Investment Banking Relationships Buy Hold Sell Buy Hold Sell Global 48% 36% 16% 64% 56% 41% 28 April 2024 32 Goldman Sachs Generational Growth
- 33. Additional disclosures required under the laws and regulations of jurisdictions other than the United States The following disclosures are those required by the jurisdiction indicated, except to the extent already made above pursuant to United States laws and regulations. Australia: Goldman Sachs Australia Pty Ltd and its affiliates are not authorised deposit-taking institutions (as that term is defined in the Banking Act 1959 (Cth)) in Australia and do not provide banking services, nor carry on a banking business, in Australia. This research, and any access to it, is intended only for “wholesale clients” within the meaning of the Australian Corporations Act, unless otherwise agreed by Goldman Sachs. In producing research reports, members of Global Investment Research of Goldman Sachs Australia may attend site visits and other meetings hosted by the companies and other entities which are the subject of its research reports. In some instances the costs of such site visits or meetings may be met in part or in whole by the issuers concerned if Goldman Sachs Australia considers it is appropriate and reasonable in the specific circumstances relating to the site visit or meeting. To the extent that the contents of this document contains any financial product advice, it is general advice only and has been prepared by Goldman Sachs without taking into account a client’s objectives, financial situation or needs. A client should, before acting on any such advice, consider the appropriateness of the advice having regard to the client’s own objectives, financial situation and needs. A copy of certain Goldman Sachs Australia and New Zealand disclosure of interests and a copy of Goldman Sachs’ Australian Sell-Side Research Independence Policy Statement are available at: https://www.goldmansachs.com/disclosures/australia-new-zealand/index.html. Brazil: Disclosure information in relation to CVM Resolution n. 20 is available at https://www.gs.com/worldwide/brazil/area/gir/index.html. Where applicable, the Brazil-registered analyst primarily responsible for the content of this research report, as defined in Article 20 of CVM Resolution n. 20, is the first author named at the beginning of this report, unless indicated otherwise at the end of the text. Canada: This information is being provided to you for information purposes only and is not, and under no circumstances should be construed as, an advertisement, offering or solicitation by Goldman Sachs & Co. LLC for purchasers of securities in Canada to trade in any Canadian security. Goldman Sachs & Co. LLC is not registered as a dealer in any jurisdiction in Canada under applicable Canadian securities laws and generally is not permitted to trade in Canadian securities and may be prohibited from selling certain securities and products in certain jurisdictions in Canada. If you wish to trade in any Canadian securities or other products in Canada please contact Goldman Sachs Canada Inc., an affiliate of The Goldman Sachs Group Inc., or another registered Canadian dealer. Hong Kong: Further information on the securities of covered companies referred to in this research may be obtained on request from Goldman Sachs (Asia) L.L.C. India: Further information on the subject company or companies referred to in this research may be obtained from Goldman Sachs (India) Securities Private Limited, Research Analyst - SEBI Registration Number INH000001493, 951-A, Rational House, Appasaheb Marathe Marg, Prabhadevi, Mumbai 400 025, India, Corporate Identity Number U74140MH2006FTC160634, Phone +91 22 6616 9000, Fax +91 22 6616 9001. Goldman Sachs may beneficially own 1% or more of the securities (as such term is defined in clause 2 (h) the Indian Securities Contracts (Regulation) Act, 1956) of the subject company or companies referred to in this research report. Investment in securities market are subject to market risks. Read all the related documents carefully before investing. Registration granted by SEBI and certification from NISM in no way guarantee performance of the intermediary or provide any assurance of returns to investors. Goldman Sachs (India) Securities Private Limited Investor Grievance E-mail: india-client-support@gs.com. Compliance Officer: Anil Rajput |Tel: + 91 22 6616 9000 | Email: anil.m.rajput@gs.com. Japan: See below. Korea: This research, and any access to it, is intended only for “professional investors” within the meaning of the Financial Services and Capital Markets Act, unless otherwise agreed by Goldman Sachs. Further information on the subject company or companies referred to in this research may be obtained from Goldman Sachs (Asia) L.L.C., Seoul Branch. New Zealand: Goldman Sachs New Zealand Limited and its affiliates are neither “registered banks” nor “deposit takers” (as defined in the Reserve Bank of New Zealand Act 1989) in New Zealand. This research, and any access to it, is intended for “wholesale clients” (as defined in the Financial Advisers Act 2008) unless otherwise agreed by Goldman Sachs. A copy of certain Goldman Sachs Australia and New Zealand disclosure of interests is available at: https://www.goldmansachs.com/disclosures/australia-new-zealand/index.html. Russia: Research reports distributed in the Russian Federation are not advertising as defined in the Russian legislation, but are information and analysis not having product promotion as their main purpose and do not provide appraisal within the meaning of the Russian legislation on appraisal activity. Research reports do not constitute a personalized investment recommendation as defined in Russian laws and regulations, are not addressed to a specific client, and are prepared without analyzing the financial circumstances, investment profiles or risk profiles of clients. Goldman Sachs assumes no responsibility for any investment decisions that may be taken by a client or any other person based on this research report. Singapore: Goldman Sachs (Singapore) Pte. (Company Number: 198602165W), which is regulated by the Monetary Authority of Singapore, accepts legal responsibility for this research, and should be contacted with respect to any matters arising from, or in connection with, this research. Taiwan: This material is for reference only and must not be reprinted without permission. Investors should carefully consider their own investment risk. Investment results are the responsibility of the individual investor. United Kingdom: Persons who would be categorized as retail clients in the United Kingdom, as such term is defined in the rules of the Financial Conduct Authority, should read this research in conjunction with prior Goldman Sachs research on the covered companies referred to herein and should refer to the risk warnings that have been sent to them by Goldman Sachs International. A copy of these risks warnings, and a glossary of certain financial terms used in this report, are available from Goldman Sachs International on request. European Union and United Kingdom: Disclosure information in relation to Article 6 (2) of the European Commission Delegated Regulation (EU) (2016/958) supplementing Regulation (EU) No 596/2014 of the European Parliament and of the Council (including as that Delegated Regulation is implemented into United Kingdom domestic law and regulation following the United Kingdom’s departure from the European Union and the European Economic Area) with regard to regulatory technical standards for the technical arrangements for objective presentation of investment recommendations or other information recommending or suggesting an investment strategy and for disclosure of particular interests or indications of conflicts of interest is available at https://www.gs.com/disclosures/europeanpolicy.html which states the European Policy for Managing Conflicts of Interest in Connection with Investment Research. Japan: Goldman Sachs Japan Co., Ltd. is a Financial Instrument Dealer registered with the Kanto Financial Bureau under registration number Kinsho 69, and a member of Japan Securities Dealers Association, Financial Futures Association of Japan Type II Financial Instruments Firms Association, The Investment Trusts Association, Japan, and Japan Investment Advisers Association. Sales and purchase of equities are subject to commission pre-determined with clients plus consumption tax. See company-specific disclosures as to any applicable disclosures required by Japanese stock exchanges, the Japanese Securities Dealers Association or the Japanese Securities Finance Company. Ratings, coverage universe and related definitions Buy (B), Neutral (N), Sell (S) Analysts recommend stocks as Buys or Sells for inclusion on various regional Investment Lists. Being assigned a Buy or Sell on an Investment List is determined by a stock’s total return potential relative to its coverage universe. Any stock not assigned as a Buy or a Sell on an Investment List with an active rating (i.e., a stock that is not Rating Suspended, Not Rated, Coverage Suspended or Not Covered), is deemed Neutral. Each region manages Regional Conviction lists, which are selected from Buy rated stocks on the respective region’s Investment lists and represent investment recommendations focused on the size of the total return potential and/or the likelihood of the realization of the return across their respective areas of coverage. The addition or removal of stocks from such Conviction lists are managed by the Investment Review Committee or other designated committee in each respective region and do not represent a change in the analysts’ investment rating for such stocks. Total return potential represents the upside or downside differential between the current share price and the price target, including all paid or anticipated dividends, expected during the time horizon associated with the price target. Price targets are required for all covered stocks. The total return potential, price target and associated time horizon are stated in each report adding or reiterating an Investment List membership. Coverage Universe: A list of all stocks in each coverage universe is available by primary analyst, stock and coverage universe at https://www.gs.com/research/hedge.html. Not Rated (NR). The investment rating, target price and earnings estimates (where relevant) are not provided or have been suspended pursuant to Goldman Sachs policy when Goldman Sachs is acting in an advisory capacity in a merger or in a strategic transaction involving this company, when 28 April 2024 33 Goldman Sachs Generational Growth
- 34. there are legal, regulatory or policy constraints due to Goldman Sachs’ involvement in a transaction, when the company is an early-stage biotechnology company, and in certain other circumstances. Rating Suspended (RS). Goldman Sachs Research has suspended the investment rating and price target for this stock, because there is not a sufficient fundamental basis for determining an investment rating or target price. The previous investment rating and target price, if any, are no longer in effect for this stock and should not be relied upon. Coverage Suspended (CS). Goldman Sachs has suspended coverage of this company. Not Covered (NC). Goldman Sachs does not cover this company. Not Available or Not Applicable (NA). The information is not available for display or is not applicable. Not Meaningful (NM). The information is not meaningful and is therefore excluded. Global product; distributing entities Goldman Sachs Global Investment Research produces and distributes research products for clients of Goldman Sachs on a global basis. Analysts based in Goldman Sachs offices around the world produce research on industries and companies, and research on macroeconomics, currencies, commodities and portfolio strategy. This research is disseminated in Australia by Goldman Sachs Australia Pty Ltd (ABN 21 006 797 897); in Brazil by Goldman Sachs do Brasil Corretora de Títulos e Valores Mobiliários S.A.; Public Communication Channel Goldman Sachs Brazil: 0800 727 5764 and / or contatogoldmanbrasil@gs.com. Available Weekdays (except holidays), from 9am to 6pm. Canal de Comunicação com o Público Goldman Sachs Brasil: 0800 727 5764 e/ou contatogoldmanbrasil@gs.com. Horário de funcionamento: segunda-feira à sexta-feira (exceto feriados), das 9h às 18h; in Canada by Goldman Sachs & Co. LLC; in Hong Kong by Goldman Sachs (Asia) L.L.C.; in India by Goldman Sachs (India) Securities Private Ltd.; in Japan by Goldman Sachs Japan Co., Ltd.; in the Republic of Korea by Goldman Sachs (Asia) L.L.C., Seoul Branch; in New Zealand by Goldman Sachs New Zealand Limited; in Russia by OOO Goldman Sachs; in Singapore by Goldman Sachs (Singapore) Pte. (Company Number: 198602165W); and in the United States of America by Goldman Sachs & Co. LLC. Goldman Sachs International has approved this research in connection with its distribution in the United Kingdom. Goldman Sachs International (“GSI”), authorised by the Prudential Regulation Authority (“PRA”) and regulated by the Financial Conduct Authority (“FCA”) and the PRA, has approved this research in connection with its distribution in the United Kingdom. European Economic Area: GSI, authorised by the PRA and regulated by the FCA and the PRA, disseminates research in the following jurisdictions within the European Economic Area: the Grand Duchy of Luxembourg, Italy, the Kingdom of Belgium, the Kingdom of Denmark, the Kingdom of Norway, the Republic of Finland and the Republic of Ireland; GSI - Succursale de Paris (Paris branch) which is authorised by the French Autorité de contrôle prudentiel et de resolution (“ACPR”) and regulated by the Autorité de contrôle prudentiel et de resolution and the Autorité des marches financiers (“AMF”) disseminates research in France; GSI - Sucursal en España (Madrid branch) authorized in Spain by the Comisión Nacional del Mercado de Valores disseminates research in the Kingdom of Spain; GSI - Sweden Bankfilial (Stockholm branch) is authorized by the SFSA as a “third country branch” in accordance with Chapter 4, Section 4 of the Swedish Securities and Market Act (Sw. lag (2007:528) om värdepappersmarknaden) disseminates research in the Kingdom of Sweden; Goldman Sachs Bank Europe SE (“GSBE”) is a credit institution incorporated in Germany and, within the Single Supervisory Mechanism, subject to direct prudential supervision by the European Central Bank and in other respects supervised by German Federal Financial Supervisory Authority (Bundesanstalt für Finanzdienstleistungsaufsicht, BaFin) and Deutsche Bundesbank and disseminates research in the Federal Republic of Germany and those jurisdictions within the European Economic Area where GSI is not authorised to disseminate research and additionally, GSBE, Copenhagen Branch filial af GSBE, Tyskland, supervised by the Danish Financial Authority disseminates research in the Kingdom of Denmark; GSBE - Sucursal en España (Madrid branch) subject (to a limited extent) to local supervision by the Bank of Spain disseminates research in the Kingdom of Spain; GSBE - Succursale Italia (Milan branch) to the relevant applicable extent, subject to local supervision by the Bank of Italy (Banca d’Italia) and the Italian Companies and Exchange Commission (Commissione Nazionale per le Società e la Borsa “Consob”) disseminates research in Italy; GSBE - Succursale de Paris (Paris branch), supervised by the AMF and by the ACPR disseminates research in France; and GSBE - Sweden Bankfilial (Stockholm branch), to a limited extent, subject to local supervision by the Swedish Financial Supervisory Authority (Finansinpektionen) disseminates research in the Kingdom of Sweden. General disclosures This research is for our clients only. Other than disclosures relating to Goldman Sachs, this research is based on current public information that we consider reliable, but we do not represent it is accurate or complete, and it should not be relied on as such. The information, opinions, estimates and forecasts contained herein are as of the date hereof and are subject to change without prior notification. We seek to update our research as appropriate, but various regulations may prevent us from doing so. Other than certain industry reports published on a periodic basis, the large majority of reports are published at irregular intervals as appropriate in the analyst’s judgment. Goldman Sachs conducts a global full-service, integrated investment banking, investment management, and brokerage business. We have investment banking and other business relationships with a substantial percentage of the companies covered by Global Investment Research. Goldman Sachs & Co. LLC, the United States broker dealer, is a member of SIPC (https://www.sipc.org). Our salespeople, traders, and other professionals may provide oral or written market commentary or trading strategies to our clients and principal trading desks that reflect opinions that are contrary to the opinions expressed in this research. Our asset management area, principal trading desks and investing businesses may make investment decisions that are inconsistent with the recommendations or views expressed in this research. The analysts named in this report may have from time to time discussed with our clients, including Goldman Sachs salespersons and traders, or may discuss in this report, trading strategies that reference catalysts or events that may have a near-term impact on the market price of the equity securities discussed in this report, which impact may be directionally counter to the analyst’s published price target expectations for such stocks. Any such trading strategies are distinct from and do not affect the analyst’s fundamental equity rating for such stocks, which rating reflects a stock’s return potential relative to its coverage universe as described herein. We and our affiliates, officers, directors, and employees will from time to time have long or short positions in, act as principal in, and buy or sell, the securities or derivatives, if any, referred to in this research, unless otherwise prohibited by regulation or Goldman Sachs policy. The views attributed to third party presenters at Goldman Sachs arranged conferences, including individuals from other parts of Goldman Sachs, do not necessarily reflect those of Global Investment Research and are not an official view of Goldman Sachs. Any third party referenced herein, including any salespeople, traders and other professionals or members of their household, may have positions in the products mentioned that are inconsistent with the views expressed by analysts named in this report. This research is not an offer to sell or the solicitation of an offer to buy any security in any jurisdiction where such an offer or solicitation would be illegal. It does not constitute a personal recommendation or take into account the particular investment objectives, financial situations, or needs of individual clients. Clients should consider whether any advice or recommendation in this research is suitable for their particular circumstances and, if appropriate, seek professional advice, including tax advice. The price and value of investments referred to in this research and the income from them may fluctuate. Past performance is not a guide to future performance, future returns are not guaranteed, and a loss of original capital may occur. Fluctuations in exchange rates could have adverse effects on the value or price of, or income derived from, certain investments. Certain transactions, including those involving futures, options, and other derivatives, give rise to substantial risk and are not suitable for all investors. Investors should review current options and futures disclosure documents which are available from Goldman Sachs sales representatives or at https://www.theocc.com/about/publications/character-risks.jsp and 28 April 2024 34 Goldman Sachs Generational Growth
- 35. https://www.fiadocumentation.org/fia/regulatory-disclosures_1/fia-uniform-futures-and-options-on-futures-risk-disclosures-booklet-pdf-version-2018. Transaction costs may be significant in option strategies calling for multiple purchase and sales of options such as spreads. Supporting documentation will be supplied upon request. Differing Levels of Service provided by Global Investment Research: The level and types of services provided to you by Goldman Sachs Global Investment Research may vary as compared to that provided to internal and other external clients of GS, depending on various factors including your individual preferences as to the frequency and manner of receiving communication, your risk profile and investment focus and perspective (e.g., marketwide, sector specific, long term, short term), the size and scope of your overall client relationship with GS, and legal and regulatory constraints. As an example, certain clients may request to receive notifications when research on specific securities is published, and certain clients may request that specific data underlying analysts’ fundamental analysis available on our internal client websites be delivered to them electronically through data feeds or otherwise. No change to an analyst’s fundamental research views (e.g., ratings, price targets, or material changes to earnings estimates for equity securities), will be communicated to any client prior to inclusion of such information in a research report broadly disseminated through electronic publication to our internal client websites or through other means, as necessary, to all clients who are entitled to receive such reports. All research reports are disseminated and available to all clients simultaneously through electronic publication to our internal client websites. Not all research content is redistributed to our clients or available to third-party aggregators, nor is Goldman Sachs responsible for the redistribution of our research by third party aggregators. For research, models or other data related to one or more securities, markets or asset classes (including related services) that may be available to you, please contact your GS representative or go to https://research.gs.com. Disclosure information is also available at https://www.gs.com/research/hedge.html or from Research Compliance, 200 West Street, New York, NY 10282. © 2024 Goldman Sachs. No part of this material may be (i) copied, photocopied or duplicated in any form by any means or (ii) redistributed without the prior written consent of The Goldman Sachs Group, Inc. 28 April 2024 35 Goldman Sachs Generational Growth