2025 Zoom Communications Q1 FY26 Earnings

    2025 Zoom Communications Q1 FY26 Earnings

    F5 days ago 3

    Loading...

    © 2025 Zoom Communications, Inc.
Zoom Communications
Q1 FY26 Earnings
May 21, 2025
    1/21

    Loading...

    © 2025 Zoom Communications, Inc.
In addition to the financials presented in accordance with U.S. generally accepted 
accounting principles ("GAAP"), this presentation includes the following non-GAAP 
metrics: Revenue in Constant Currency, non-GAAP gross profit, non-GAAP gross 
margin, non-GAAP R&D expense, non-GAAP S&M expense, non-GAAP G&A expense, 
non-GAAP operating margin, non-GAAP income from operations, non-GAAP net 
income per share or EPS, free cash flow and free cash flow margin. Non-GAAP 
metrics have limitations as analytical tools and you should not consider them in 
isolation or as a substitute for or superior to the most directly comparable financial 
measures prepared in accordance with U.S. GAAP. There are a number of limitations 
related to the use of non-GAAP metrics versus their nearest GAAP equivalents. Other 
companies, including companies in our industry, may calculate non-GAAP metrics 
differently or may use other measures to evaluate their performance, all of which 
could reduce the usefulness of our non-GAAP metrics as tools for comparison. We 
urge you to review the reconciliation of Zoom's non-GAAP metrics to the most directly 
comparable GAAP financial measures, and not to rely on any single financial measure 
to evaluate our business. See the Appendix for reconciliation between each 
non-GAAP metric and the most comparable GAAP measure.
Use of 
non-GAAP 
financial 
measures
    2/21

    Loading...

    © 2025 Zoom Communications, Inc.
This presentation and the accompanying oral presentation contain express and implied 
“forward-looking statementsˮ within the meaning of the Private Securities Litigation Reform Act of 
1995, including statements regarding Zoom's financial outlook for the second quarter of fiscal year 
2026 and full fiscal year 2026; Zoom's expectations regarding financial and business trends, as well 
as impacts from macroeconomic developments; Zoom's market position, stock repurchase program, 
opportunities, go-to-market initiatives, growth strategy and business aspirations; and product 
initiatives, including future product and feature releases, and the expected benefits of such initiatives, 
including of agentic AI. In some cases, you can identify forward-looking statements by terms such as 
“anticipate,ˮ “believe,ˮ “estimate,ˮ “expect,ˮ “intend,ˮ “may,ˮ “might,ˮ “plan,ˮ “project,ˮ “will,ˮ “would,ˮ 
“should,ˮ “could,ˮ “can,ˮ “predict,ˮ “potential,ˮ “target,ˮ “explore,ˮ “continue,ˮ or the negative of these 
terms, and similar expressions intended to identify forward-looking statements. By their nature, these 
statements are subject to numerous uncertainties and risks, including factors beyond our control, that 
could cause actual results, performance or achievement to differ materially and adversely from those 
anticipated or implied in the statements, including: declines in new customers, renewals or upgrades, 
or decline in demand for our platform, difficulties in evaluating our prospects and future results of 
operations given our limited operating history, competition from other providers of communications 
platforms, the effect of macroeconomic conditions on our business, including tariffs and trade 
tensions, inflationary pressures and market volatility, lengthening sales cycles with large 
organizations, delays or outages in services from our co-located data centers, failures in internet 
infrastructure or interference with broadband access, compromised security measures, including ours 
and those of the third parties upon which we rely, and global security concerns and their potential 
impact on regional and global economies and supply chains.
Additional risks and uncertainties that could cause actual outcomes and results to differ materially 
from those contemplated by the forward-looking statements are included under the caption “Risk 
Factorsˮ and elsewhere in our most recent filings with the Securities and Exchange Commission (the 
“SECˮ), including our annual report on Form 10K for the fiscal year ended January 31, 2025. 
Forward-looking statements speak only as of the date the statements are made and are based on 
information available to Zoom at the time those statements are made and/or management's good faith 
belief as of that time with respect to future events. Zoom assumes no obligation to update 
forward-looking statements to reflect events or circumstances after the date they were made, except 
as required by law.
Safe 
Harbor 
Statement
    3/21

    Loading...

    Rapid AI innovation expands customer value
New Agentic 
Capabilities
Zoom Tasks 
Calendar scheduling
Custom agents with 
Zoom AI Studio
New Monetized 
Products GA
Custom AI Companion
Workplace for Clinicians
Workplace for Frontline
Increasing AI adoption
Notable Meeting 
Summary adopter:
40% increase in MAUs
Notable Zoom 
Phone AI adopter:
● Enhances your capabilities ● Simplifies your workday ● Performs your tasks
    4/21

    Loading...

    © 2025 Zoom Communications, Inc.
Full, Integrated Platform drives multi-product adoption
● AI-first Workplace Platform 
● Better together 
Collaboration Experience 
and Customer Experience 
● Open ecosystem
Q1 land & expand win:
    5/21

    Loading...

    © 2025 Zoom Communications, Inc.
Revenue Accelerator
● Licenses 72% YoY
Q1 win:
Workvivo
● Total Customers 106% YoY
Q1 win:
Scaling High-Growth Department Solutions
Customer Experience
● CC Customers 65% YoY 
& ZVA largest deal to date
● ZCX ARR high double 
digits growth
Q1 win: Migration Partner:
    6/21

    Loading...

    © 2025 Zoom Communications, Inc.
Strengthening the Zoom story and paths to market
Q1 Channel Win:
Kim Storin 
Zoom CMO
Strengthening our Channel
Welcome, 
Notable New Strategic Partner:
    7/21

    Loading...

    © 2025 Zoom Communications, Inc.
Revenue expansion in Q1; improved Online churn 
Enterprise Revenue
(in millions)
Total Revenue1
(in millions)
Online Average 
Monthly Churn2
For endnote descriptions, see final slide 
6%
$5 FX Impact
3%
    8/21

    Loading...

    © 2025 Zoom Communications, Inc.
Continued growth in the up-market and internationally
For endnote descriptions, see final slide 
# of Customers Contributing >$100k 
in TTM Revenue
8%
TTM Net Dollar 
Expansion Rate for 
Enterprise Customers1
98%
Revenue by Region2
(in millions)
YoY Growth
Americas
4%
APAC
2%
EMEA
1%
    9/21

    Loading...

    © 2025 Zoom Communications, Inc.
GAAP
Results Yr/Yr Non-GAAP1
Results
Yr/Yr
Revenue $1,175 million 3% $1,175 million 3%
Gross Profit 76.3% 25 bps 79.2% 13 bps
R&D Expense 17.5% 53 bps 10.8% 59 bps
S&M Expense 29.5% 96 bps 23.1% 5 bps
G&A Expense 8.7% 104 bps) 5.4% 45 bps
Operating Income 20.6% 278 bps 39.8% 23 bps
Effective Tax Rate 19.4% 654 bps) 19.2% 4 bps
EPS  Diluted $0.81 17% $1.43 6%
Q1 FY26 expenses and margins
For endnote descriptions, see final slide 
As a % of Revenue
    10/21

    Loading...

    © 2025 Zoom Communications, Inc.
Growth in Deferred Revenue & RPO 
For endnote descriptions, see final slide 
Total RPO1
(in millions)
YoY Growth
Deferred Revenue
5%
Unbilled
6%
YoY Growth
Current RPO
8%
Non-Current RPO
2%
Current2 & Non-Current RPO
(in millions)
59%
41%
39%
61%
Total RPO 
6%
Total RPO
6%
    11/21

    Loading...

    © 2025 Zoom Communications, Inc.
Strong Cash Flow, ~$7.8B cash balance1, accelerated execution 
of share buyback in Q1
For endnote descriptions, see final slide 
Shares repurchased since 
Q1 FY25
~21M
Operating Cash Flow
OCF Margin
Free Cash Flow2
FCF Margin
$489M
41.6%
$463M
39.4%
Share Repurchases
under $2.7B authorization 
Shares repurchased in Q1
5.6M
    12/21

    Loading...

    © 2025 Zoom Communications, Inc.
Q2 & raised fiscal year 2026 outlook
Outlook1 Q2 FY26 FY26
Revenue $1,195  $1,200 million $4,800  $4,810 million
Revenue 
Constant Currency) $1,196  $1,201 million $4,808  $4,818 million
Non-GAAP Operating 
Income $460  $465 million $1,865  $1,875 million
Weighted Average Share 
Count 310 million 312 million
Non-GAAP EPS $1.36  $1.37 $5.56  $5.59
Free Cash Flow2-- $1,680  $1,720 million
For endnote descriptions, see final slide 
$1.2 billion authorized share repurchase remaining as of 4/30/25
(not reflected in Share Count and EPS projections)
    13/21

    Loading...

    © 2025 Zoom Communications, Inc.
    14/21

    Loading...

    © 2025 Zoom Communications, Inc.
Thank you
    15/21

    Loading...

    © 2025 Zoom Communications, Inc.
Appendix
    16/21

    Loading...

    © 2025 Zoom Communications, Inc.
GAAP to Non-GAAP Reconciliation
$ in Thousands) Q1 FY25 Q1 FY26
Gross Profit
Total Revenue $1,141,234 $1,174,715
GAAP Gross Profit $867,932 $896,313
(+) Stock-based compensation expense and related payroll taxes $35,359 $31,988
(+) Acquisition-related expense $1,805 $1,783
Non-GAAP Gross Profit $905,096 $930,084
GAAP Gross Margin 76.1% 76.3%
Non-GAAP Gross Margin 79.3% 79.2%
R&D Expenses
GAAP R&D $205,558 $205,416
(-) Stock-based compensation expense and related payroll taxes $85,421 $75,986
(-) Acquisition-related expense $3,417 $2,351
Non-GAAP R&D $116,720 $127,079
S&M Expenses
GAAP S&M $348,008 $346,970
(-) Stock-based compensation expense and related payroll taxes $81,664 $73,591
(-) Acquisition-related expenses $1,762 $1,580
Non-GAAP S&M $264,582 $271,799
G&A Expenses
GAAP G&A $111,344 $102,335
(-) Stock-based compensation expense and related payroll taxes $40,430 $35,165
(-) Acquisition-related expense $3,717 $3,290
Non-GAAP G&A $67,197 $63,880
    17/21

    Loading...

    © 2025 Zoom Communications, Inc.
GAAP to Non-GAAP Reconciliation
$ in Thousands except EPS Q1 FY25 Q1 FY26
Income from Operations
Total Revenue $1,141,234 $1,174,715
GAAP Income from Operations $203,022 $241,592
(+) Stock-based compensation expense and related payroll taxes $242,874 $216,730
(+) Acquisition-related expense $10,701 $9,004
Non-GAAP Income from Operations $456,597 $467,326
GAAP Operating Margin 17.8% 20.6%
Non-GAAP Operating Margin 40.0% 39.8%
Net Income
GAAP net income attributable to common stockholders $216,308 $254,603
(+) Stock-based compensation expense and related payroll taxes $242,874 $216,730
(+) Acquisition-related expenses $10,701 $9,004
(+) Gains Losses on strategic investments $17,354 $13,619
(-) Tax effects on non-GAAP adjustments $26,211 $45,663
Non-GAAP net income $426,318 $448,293
Earnings Per Share
GAAP net income per share –diluted $0.69 $0.81
Non-GAAP net income per share –diluted $1.35 $1.43
Weighted Average Shares
GAAP and Non-GAAP weighted-average –diluted 315,360,678 312,783,861
    18/21

    Loading...

    © 2025 Zoom Communications, Inc.
GAAP to Non-GAAP Reconciliation
$ in Thousands) Q1 FY25 Q1 FY26
Free Cash Flow
Cash Flow from Operations $588,191 $489,261
(-) Purchases of PPE $18,508 $25,910
Free Cash Flow $569,683 $463,351
Operating Cash Flow Margin 51.5% 41.6%
Free Cash Flow Margin 49.9% 39.4%
Net Cash Used in Investing Activities $107,824 $125,130
Net Cash Used in Financing Activities $142,451 $490,530
$ in Thousands) Q1 FY26 Y/Y growth
Revenue in Constant Currency
GAAP revenue $1,174,715 2.9%
(+) Constant currency impact $4,762 0.5%
Revenue in constant currency (non-GAAP $1,179,477 3.4%
    19/21

    Loading...

    © 2025 Zoom Communications, Inc.
Historic Metrics
For endnote descriptions, see final slide 
$ in millions) Q2 FY24 Q3 FY24 Q4 FY24 Q1 FY25 Q2 FY25 Q3 FY25 Q4 FY25 Q1 FY26
Revenue $1,138.7 $1,136.7 $1,146.5 $1,141.2 $1,162.5 $1,177.5 $1,184.1 $1,174.7
Y/Y growth 4% 3% 3% 3% 2% 4% 3% 3%
GAAP Income from operations $177.6 $169.4 $168.5 $203.0 $202.4 $182.8 $225.1 $241.6
Stock-based compensation and related payroll taxes, 
acquisition-related expenses, restructuring expenses, 
and net litigation settlements $284.1 $277.8 $275.2 $253.6 $253.2 $275.0 $242.9 $225.7
Non-GAAP income from operations $461.7 $447.1 $443.7 $456.6 $455.5 $457.8 $468.0 $467.3
Operating Cash Flow $336.0 $493.2 $351.2 $588.2 $449.3 $483.2 $424.6 $489.3
Capital Expenditures $46.6 $40.0 $18.5 $18.5 $84.2 $25.5 $8.3 $25.9
Free Cash Flow $289.4 $453.2 $332.7 $569.7 $365.1 $457.7 $416.2 $463.4
Deferred Revenue $1,369.8 $1,315.9 $1,270.4 $1,352.2 $1,406.7 $1,379.0 $1,353.7 $1,425.4
Unbilled Accounts Receivable $115.6 $132.3 $124.8 $137.7 $119.9 $122.6 $118.5 $108.1
RPO $3,504.4 $3,571.7 $3,574.8 $3,665.7 $3,778.3 $3,740.7 $3,801.9 $3,877.3
Y/Y growth 9% 10% 4% 5% 8% 5% 6% 6%
Customers $100K TTM Revenue 3,672 3,731 3,810 3,883 3,933 3,995 4,088 4,192
Y/Y growth 18% 14% 10% 8% 7% 7% 7% 8%
Revenue % from Customers $100K TTM 
Revenue 29% 29% 30% 30% 31% 31% 31% 32%
Revenue % from Enterprise Customers 58% 58% 58% 58% 59% 59% 60% 60%
TTM Net $ Expansion Rate for Enterprise 
Customers 109% 105% 101% 99% 98% 98% 98% 98%
Online Average Monthly Churn 3.2% 3.0% 3.0% 3.2% 2.9% 2.7% 2.8% 2.8%
Previous Metrics
Enterprise Customers1 218,100 219,700 220,400 191,000 191,600 192,400 192,600 182,600
Enterprise Customers Migrated to Online in 
Quarter 26,800 11,400
    20/21

    Loading...

    © 2025 Zoom Communications, Inc.
Endnotes
Revenue expansion in Q1; improved Online churn
1. Not drawn to scale. Currency Impact is a non-GAAP metric. See appendix for a reconciliation of 
non-GAAP to GAAP financial measures. Zoom defines revenue in constant currency as GAAP 
revenue adjusted for revenue reported in currencies other than United States dollars as if they were 
converted into United States dollars using the average exchange rates from the comparative period 
rather than the actual exchange rates in effect during the respective periods. 
2. Zoom calculates online average monthly churn by starting with the Online customer MRR as of the 
beginning of the applicable quarter (“Entry MRRˮ). Zoom defines Entry MRR as the recurring revenue 
run-rate of subscription agreements from all Online customers except for subscriptions that Zoom 
recorded as churn in a previous quarter based on the customers' earlier indication to us of their 
intention to cancel that subscription. Zoom then determines the MRR related to customers who 
canceled or downgraded their subscription or notified us of that intention during the applicable 
quarter (“Applicable Quarter MRR Churnˮ) and divides the Applicable Quarter MRR Churn by the 
applicable quarter Entry MRR to arrive at the MRR churn rate for Online Customers for the applicable 
quarter. Zoom then divides that amount by three to calculate the online average monthly churn.
Continued growth in the up-market and internationally
1. Zoom calculates net dollar expansion rate as of a period end by starting with the annual recurring 
revenue (“ARRˮ) from Enterprise customers as of 12 months prior (“Prior Period ARRˮ). Zoom defines 
ARR as the annualized revenue run rate of subscription agreements from all customers at a point in 
time. Zoom calculates ARR by taking the monthly recurring revenue (“MRRˮ) and multiplying it by 12. 
MRR is defined as the recurring revenue run-rate of subscription agreements from all Enterprise 
customers for the last month of the period, including revenue from monthly subscribers who have not 
provided any indication that they intend to cancel their subscriptions. Zoom then calculates the ARR 
from these Enterprise customers as of the current period end (“Current Period ARRˮ), which includes 
any upsells, contraction, and attrition. Zoom divides the Current Period ARR by the Prior Period ARR 
to arrive at the net dollar expansion rate. For the trailing 12 months calculation, Zoom takes an 
average of the net dollar expansion rate over the trailing 12 months.
2. Subtotals revenue and revenue percent have been rounded. 
Q1 FY26 expenses and margins
1. See appendix for a reconciliation of non-GAAP to GAAP financial measures.
Growth in Deferred Revenue and RPO
1. Remaining performance Obligations RPO) consists of both billed considerations and unbilled 
considerations that we expect to recognize as revenue. Subtotals have been rounded.
2. Current RPO refers to the portion of total RPO which we expect to recognize as revenue over the 
following 12 months period.
Strong Cash Flow, ~$7.8B cash balance, accelerated execution of share 
buyback in Q1
1. Cash balance refers to cash, cash equivalents and marketable securities, excluding restricted cash at 
the end of the period.
2. See appendix for a reconciliation of non-GAAP to GAAP financial measures. Zoom defines free cash 
flow as net cash provided by operating activities less purchases of property and equipment.
Q2 & raised fiscal year 2026 outlook
1. A reconciliation of non-GAAP guidance measures to corresponding GAAP measures is not available 
on a forward-looking basis without unreasonable effort due to the uncertainty of expenses that may 
be incurred in the future, although it is important to note that these factors could be material to 
Zoomʼs results computed in accordance with GAAP.
2. Free cash flow is a non-GAAP financial metric. Zoom defines free cash flow as net cash provided by 
operating activities less purchases of property and equipment.
Historic Metrics
1. Enterprise Customers are rounded down to the nearest hundred. In order to enhance customer 
experience and improve efficiency, in Q1 FY25 we transitioned approximately 26,800 Enterprise 
customers and in Q1 FY26 we transitioned approximately 11,400 Enterprise customers with lower 
MRR away from working with direct sales teams, resellers, or strategic partners to our Online 
channel. The impact of these transitions did not have a material impact on the percent of revenue 
from Enterprise and Online customers, net dollar expansion rate, or Online average monthly churn.
    21/21

    2025 Zoom Communications Q1 FY26 Earnings

    • 1. © 2025 Zoom Communications, Inc. Zoom Communications Q1 FY26 Earnings May 21, 2025
    • 2. © 2025 Zoom Communications, Inc. In addition to the financials presented in accordance with U.S. generally accepted accounting principles ("GAAP"), this presentation includes the following non-GAAP metrics: Revenue in Constant Currency, non-GAAP gross profit, non-GAAP gross margin, non-GAAP R&D expense, non-GAAP S&M expense, non-GAAP G&A expense, non-GAAP operating margin, non-GAAP income from operations, non-GAAP net income per share or EPS, free cash flow and free cash flow margin. Non-GAAP metrics have limitations as analytical tools and you should not consider them in isolation or as a substitute for or superior to the most directly comparable financial measures prepared in accordance with U.S. GAAP. There are a number of limitations related to the use of non-GAAP metrics versus their nearest GAAP equivalents. Other companies, including companies in our industry, may calculate non-GAAP metrics differently or may use other measures to evaluate their performance, all of which could reduce the usefulness of our non-GAAP metrics as tools for comparison. We urge you to review the reconciliation of Zoom's non-GAAP metrics to the most directly comparable GAAP financial measures, and not to rely on any single financial measure to evaluate our business. See the Appendix for reconciliation between each non-GAAP metric and the most comparable GAAP measure. Use of non-GAAP financial measures
    • 3. © 2025 Zoom Communications, Inc. This presentation and the accompanying oral presentation contain express and implied “forward-looking statementsˮ within the meaning of the Private Securities Litigation Reform Act of 1995, including statements regarding Zoom's financial outlook for the second quarter of fiscal year 2026 and full fiscal year 2026; Zoom's expectations regarding financial and business trends, as well as impacts from macroeconomic developments; Zoom's market position, stock repurchase program, opportunities, go-to-market initiatives, growth strategy and business aspirations; and product initiatives, including future product and feature releases, and the expected benefits of such initiatives, including of agentic AI. In some cases, you can identify forward-looking statements by terms such as “anticipate,ˮ “believe,ˮ “estimate,ˮ “expect,ˮ “intend,ˮ “may,ˮ “might,ˮ “plan,ˮ “project,ˮ “will,ˮ “would,ˮ “should,ˮ “could,ˮ “can,ˮ “predict,ˮ “potential,ˮ “target,ˮ “explore,ˮ “continue,ˮ or the negative of these terms, and similar expressions intended to identify forward-looking statements. By their nature, these statements are subject to numerous uncertainties and risks, including factors beyond our control, that could cause actual results, performance or achievement to differ materially and adversely from those anticipated or implied in the statements, including: declines in new customers, renewals or upgrades, or decline in demand for our platform, difficulties in evaluating our prospects and future results of operations given our limited operating history, competition from other providers of communications platforms, the effect of macroeconomic conditions on our business, including tariffs and trade tensions, inflationary pressures and market volatility, lengthening sales cycles with large organizations, delays or outages in services from our co-located data centers, failures in internet infrastructure or interference with broadband access, compromised security measures, including ours and those of the third parties upon which we rely, and global security concerns and their potential impact on regional and global economies and supply chains. Additional risks and uncertainties that could cause actual outcomes and results to differ materially from those contemplated by the forward-looking statements are included under the caption “Risk Factorsˮ and elsewhere in our most recent filings with the Securities and Exchange Commission (the “SECˮ), including our annual report on Form 10K for the fiscal year ended January 31, 2025. Forward-looking statements speak only as of the date the statements are made and are based on information available to Zoom at the time those statements are made and/or management's good faith belief as of that time with respect to future events. Zoom assumes no obligation to update forward-looking statements to reflect events or circumstances after the date they were made, except as required by law. Safe Harbor Statement
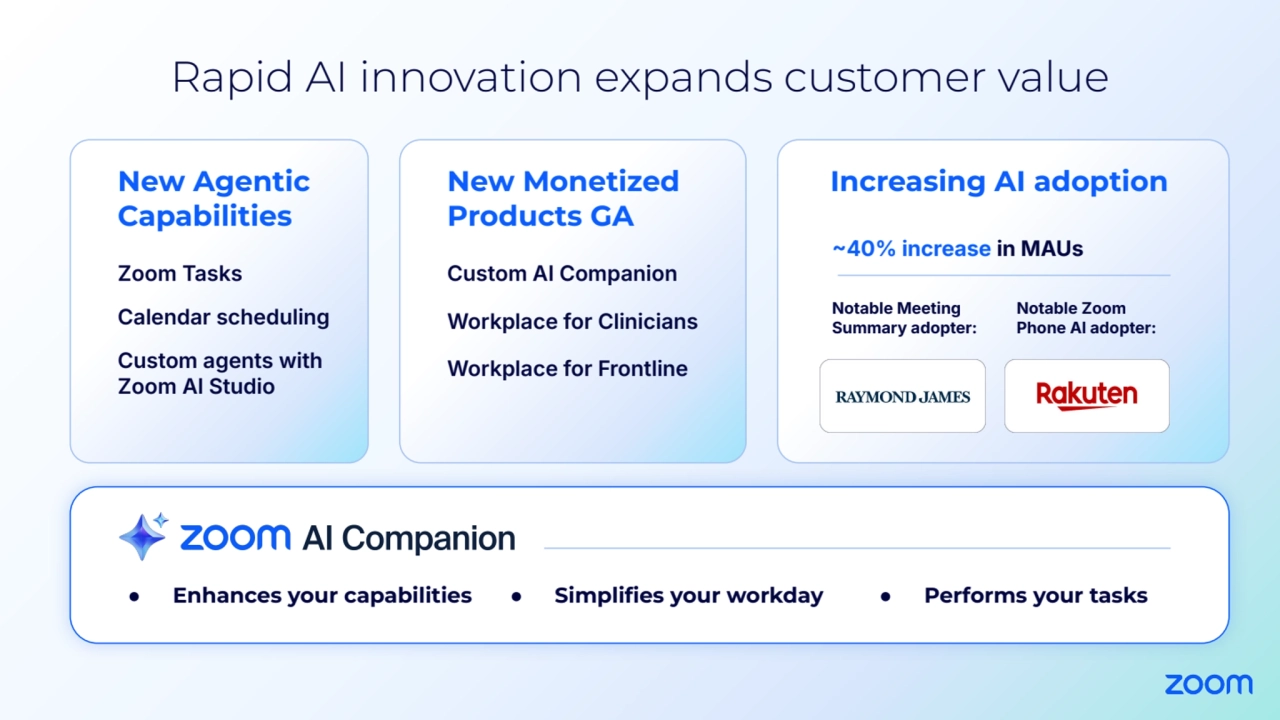
    • 4. Rapid AI innovation expands customer value New Agentic Capabilities Zoom Tasks Calendar scheduling Custom agents with Zoom AI Studio New Monetized Products GA Custom AI Companion Workplace for Clinicians Workplace for Frontline Increasing AI adoption Notable Meeting Summary adopter: 40% increase in MAUs Notable Zoom Phone AI adopter: ● Enhances your capabilities ● Simplifies your workday ● Performs your tasks
    • 5. © 2025 Zoom Communications, Inc. Full, Integrated Platform drives multi-product adoption ● AI-first Workplace Platform ● Better together Collaboration Experience and Customer Experience ● Open ecosystem Q1 land & expand win:
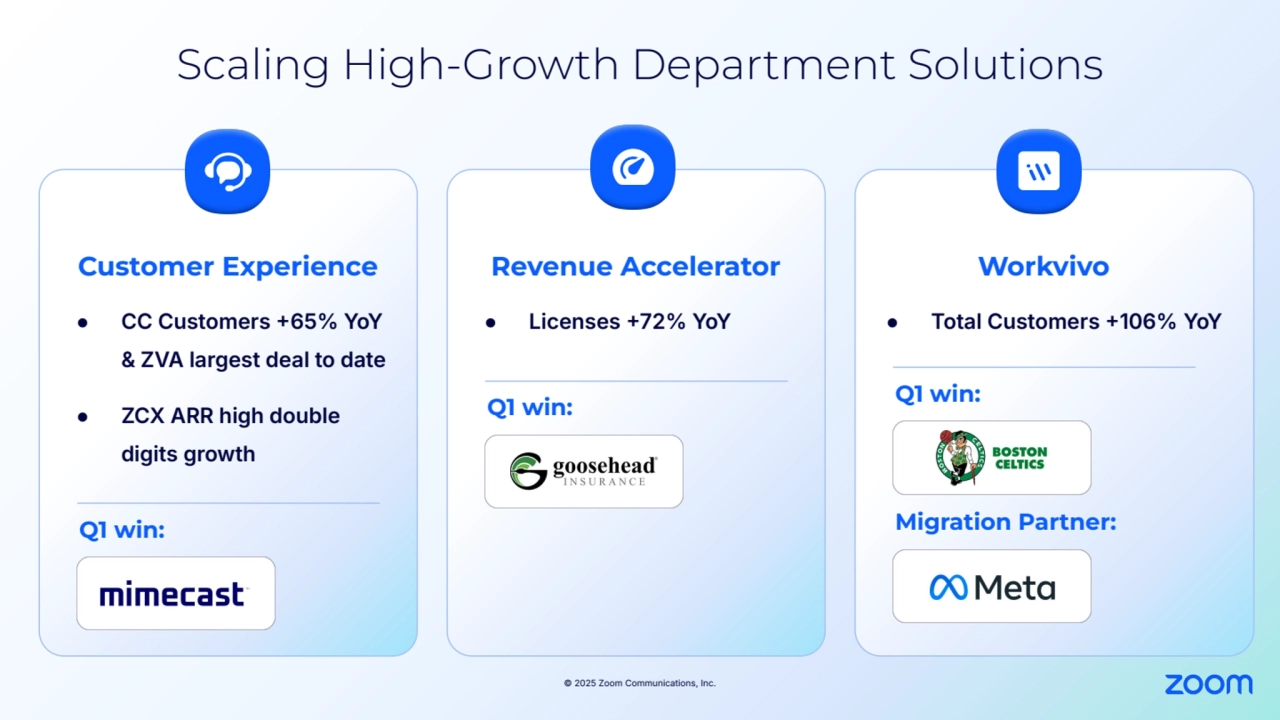
    • 6. © 2025 Zoom Communications, Inc. Revenue Accelerator ● Licenses 72% YoY Q1 win: Workvivo ● Total Customers 106% YoY Q1 win: Scaling High-Growth Department Solutions Customer Experience ● CC Customers 65% YoY & ZVA largest deal to date ● ZCX ARR high double digits growth Q1 win: Migration Partner:
    • 7. © 2025 Zoom Communications, Inc. Strengthening the Zoom story and paths to market Q1 Channel Win: Kim Storin Zoom CMO Strengthening our Channel Welcome, Notable New Strategic Partner:
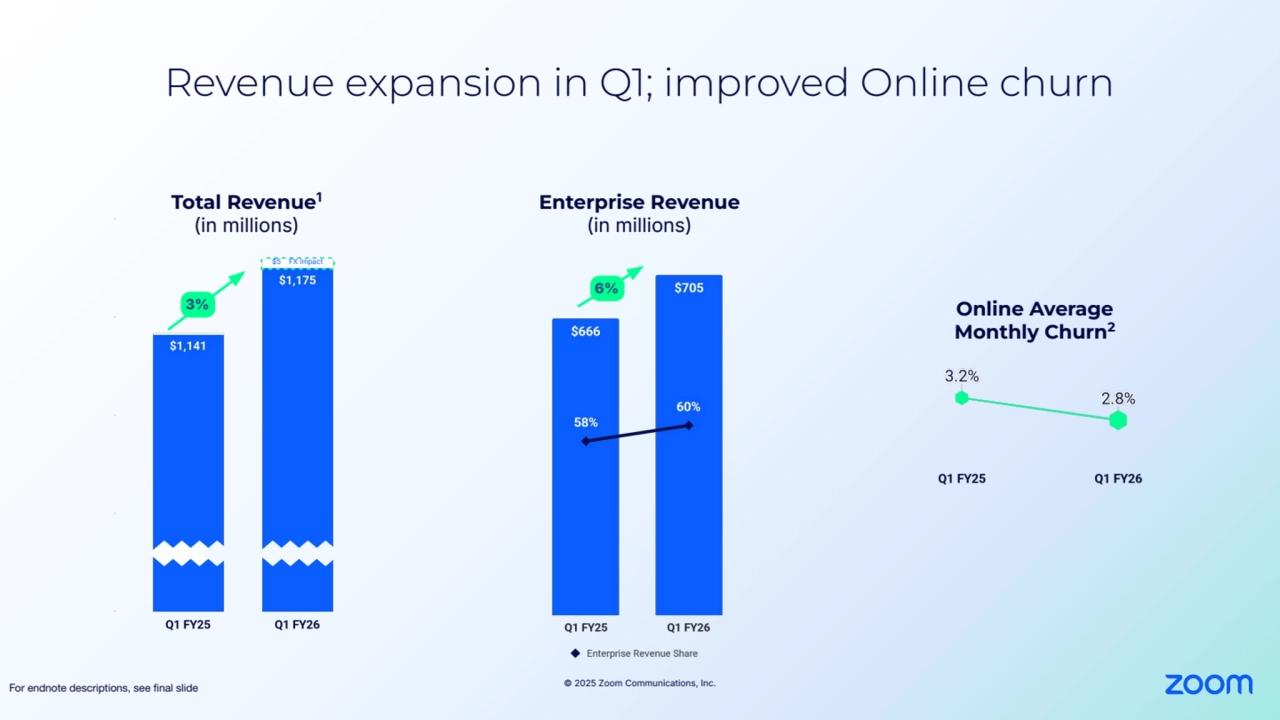
    • 8. © 2025 Zoom Communications, Inc. Revenue expansion in Q1; improved Online churn Enterprise Revenue (in millions) Total Revenue1 (in millions) Online Average Monthly Churn2 For endnote descriptions, see final slide 6% $5 FX Impact 3%
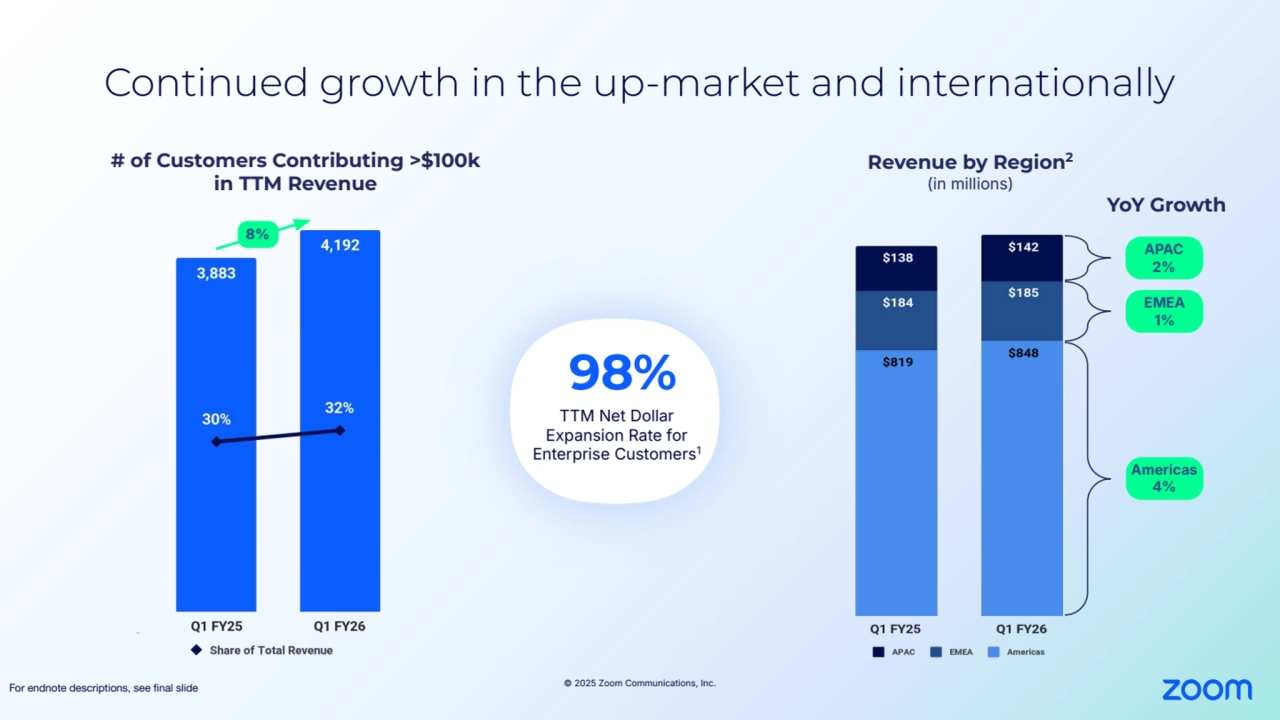
    • 9. © 2025 Zoom Communications, Inc. Continued growth in the up-market and internationally For endnote descriptions, see final slide # of Customers Contributing >$100k in TTM Revenue 8% TTM Net Dollar Expansion Rate for Enterprise Customers1 98% Revenue by Region2 (in millions) YoY Growth Americas 4% APAC 2% EMEA 1%
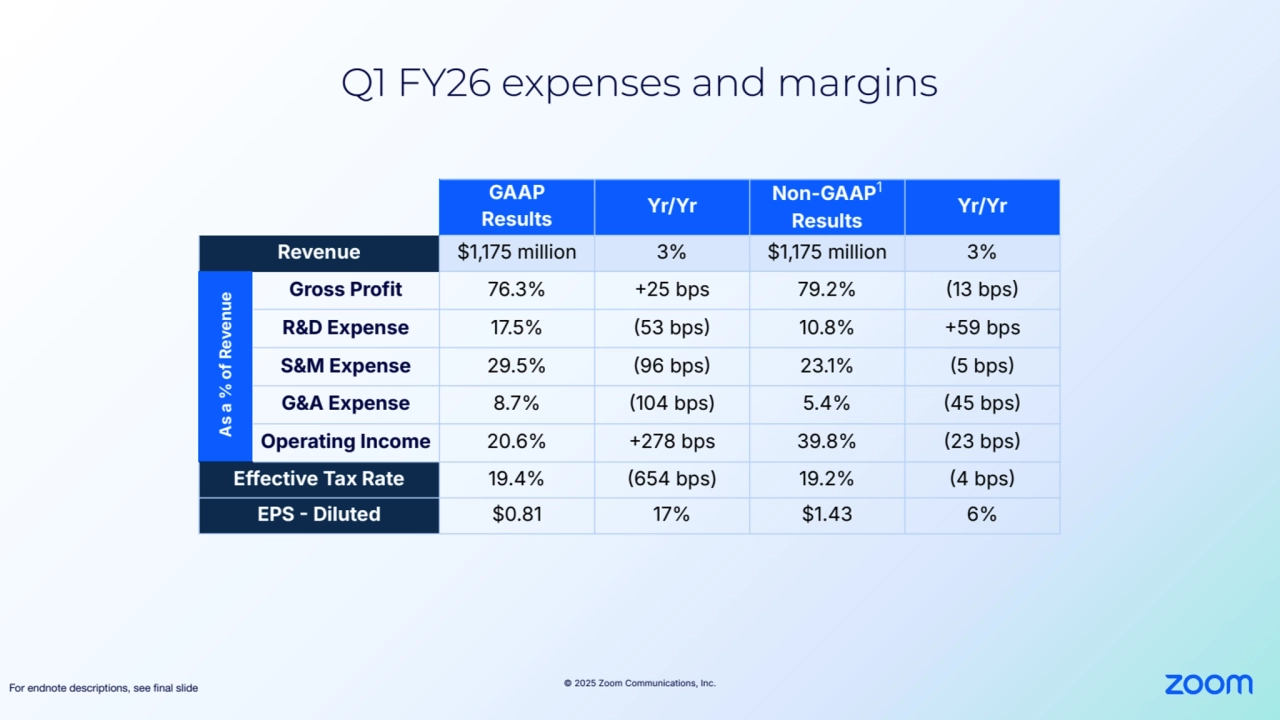
    • 10. © 2025 Zoom Communications, Inc. GAAP Results Yr/Yr Non-GAAP1 Results Yr/Yr Revenue $1,175 million 3% $1,175 million 3% Gross Profit 76.3% 25 bps 79.2% 13 bps R&D Expense 17.5% 53 bps 10.8% 59 bps S&M Expense 29.5% 96 bps 23.1% 5 bps G&A Expense 8.7% 104 bps) 5.4% 45 bps Operating Income 20.6% 278 bps 39.8% 23 bps Effective Tax Rate 19.4% 654 bps) 19.2% 4 bps EPS  Diluted $0.81 17% $1.43 6% Q1 FY26 expenses and margins For endnote descriptions, see final slide As a % of Revenue
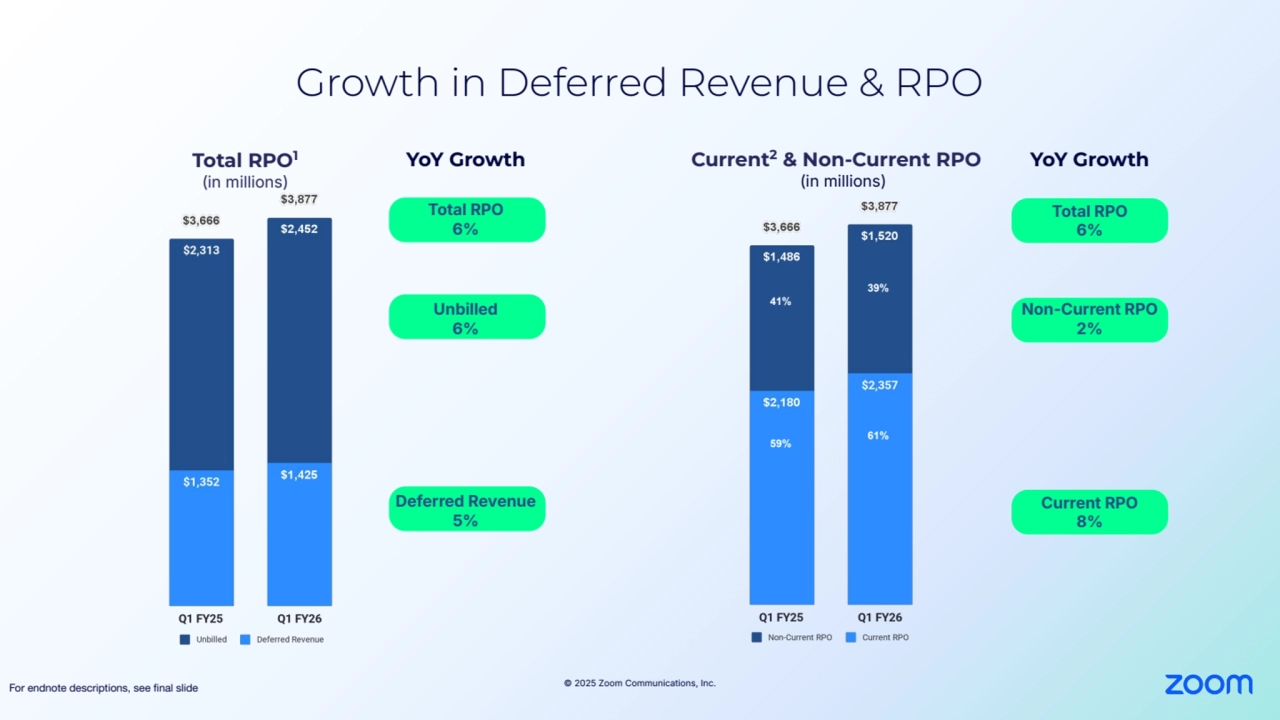
    • 11. © 2025 Zoom Communications, Inc. Growth in Deferred Revenue & RPO For endnote descriptions, see final slide Total RPO1 (in millions) YoY Growth Deferred Revenue 5% Unbilled 6% YoY Growth Current RPO 8% Non-Current RPO 2% Current2 & Non-Current RPO (in millions) 59% 41% 39% 61% Total RPO 6% Total RPO 6%
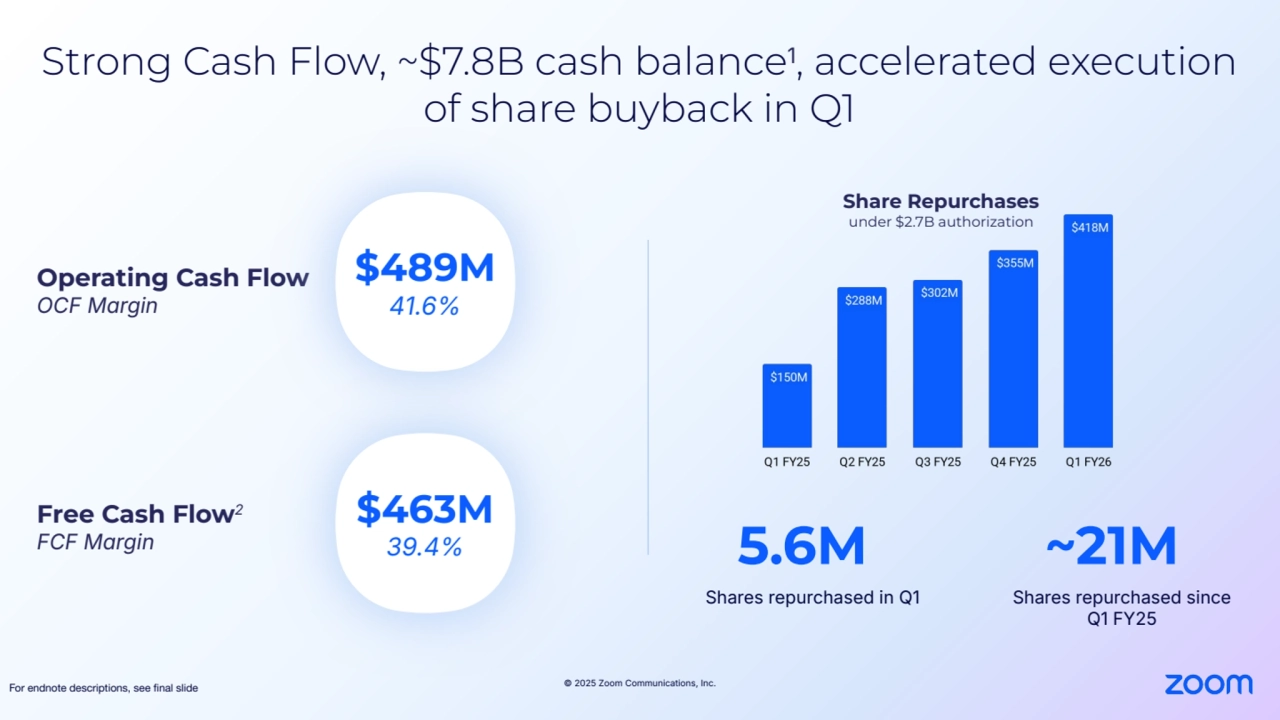
    • 12. © 2025 Zoom Communications, Inc. Strong Cash Flow, ~$7.8B cash balance1, accelerated execution of share buyback in Q1 For endnote descriptions, see final slide Shares repurchased since Q1 FY25 ~21M Operating Cash Flow OCF Margin Free Cash Flow2 FCF Margin $489M 41.6% $463M 39.4% Share Repurchases under $2.7B authorization Shares repurchased in Q1 5.6M
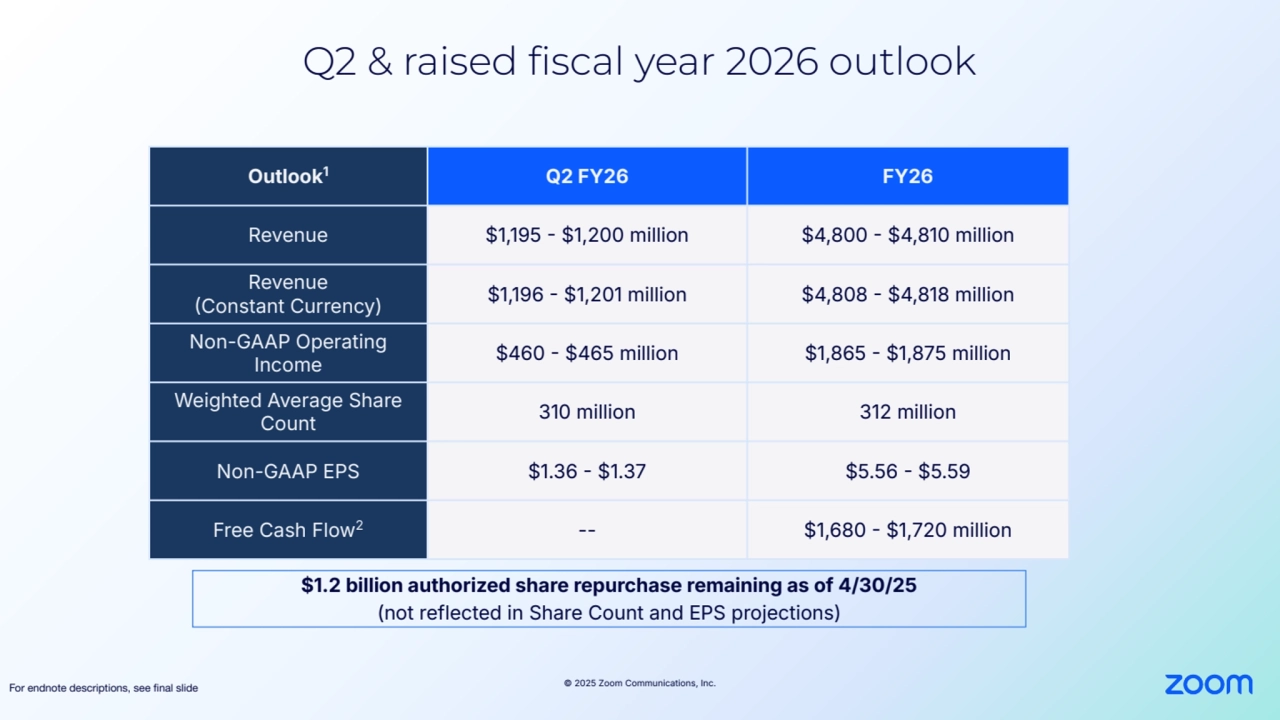
    • 13. © 2025 Zoom Communications, Inc. Q2 & raised fiscal year 2026 outlook Outlook1 Q2 FY26 FY26 Revenue $1,195  $1,200 million $4,800  $4,810 million Revenue Constant Currency) $1,196  $1,201 million $4,808  $4,818 million Non-GAAP Operating Income $460  $465 million $1,865  $1,875 million Weighted Average Share Count 310 million 312 million Non-GAAP EPS $1.36  $1.37 $5.56  $5.59 Free Cash Flow2-- $1,680  $1,720 million For endnote descriptions, see final slide $1.2 billion authorized share repurchase remaining as of 4/30/25 (not reflected in Share Count and EPS projections)
    • 14. © 2025 Zoom Communications, Inc.
    • 15. © 2025 Zoom Communications, Inc. Thank you
    • 16. © 2025 Zoom Communications, Inc. Appendix
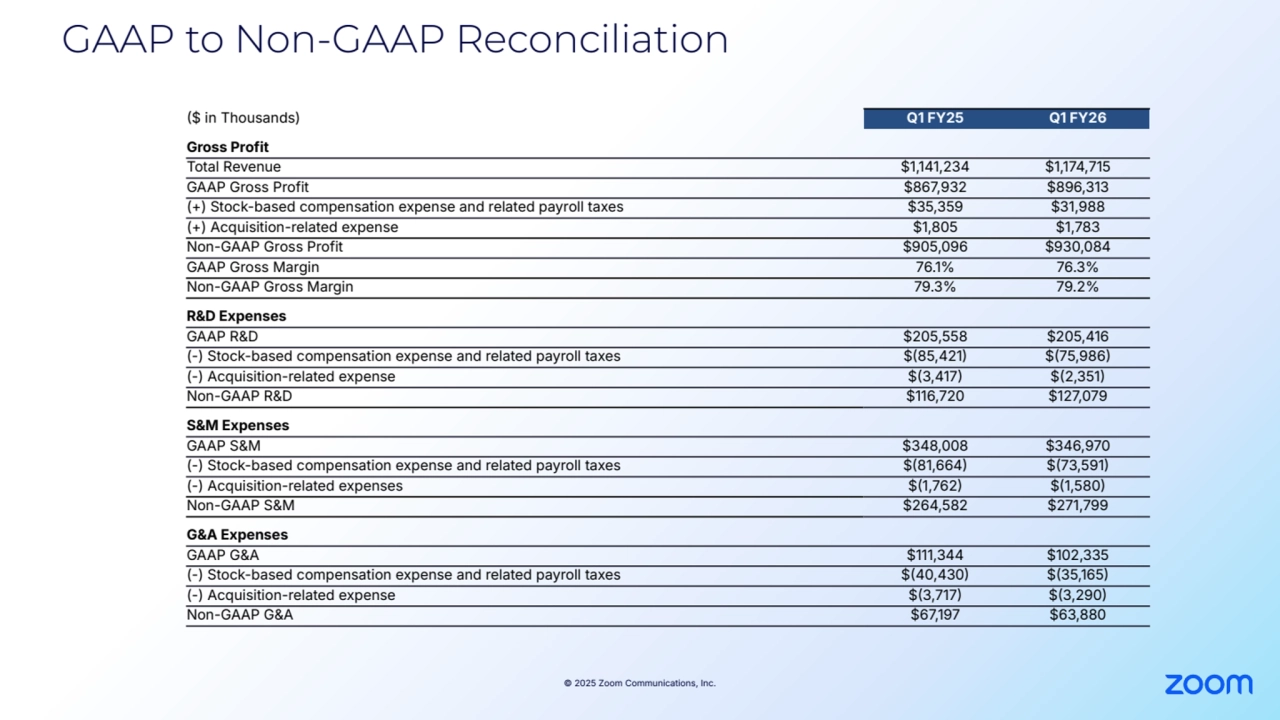
    • 17. © 2025 Zoom Communications, Inc. GAAP to Non-GAAP Reconciliation $ in Thousands) Q1 FY25 Q1 FY26 Gross Profit Total Revenue $1,141,234 $1,174,715 GAAP Gross Profit $867,932 $896,313 (+) Stock-based compensation expense and related payroll taxes $35,359 $31,988 (+) Acquisition-related expense $1,805 $1,783 Non-GAAP Gross Profit $905,096 $930,084 GAAP Gross Margin 76.1% 76.3% Non-GAAP Gross Margin 79.3% 79.2% R&D Expenses GAAP R&D $205,558 $205,416 (-) Stock-based compensation expense and related payroll taxes $85,421 $75,986 (-) Acquisition-related expense $3,417 $2,351 Non-GAAP R&D $116,720 $127,079 S&M Expenses GAAP S&M $348,008 $346,970 (-) Stock-based compensation expense and related payroll taxes $81,664 $73,591 (-) Acquisition-related expenses $1,762 $1,580 Non-GAAP S&M $264,582 $271,799 G&A Expenses GAAP G&A $111,344 $102,335 (-) Stock-based compensation expense and related payroll taxes $40,430 $35,165 (-) Acquisition-related expense $3,717 $3,290 Non-GAAP G&A $67,197 $63,880
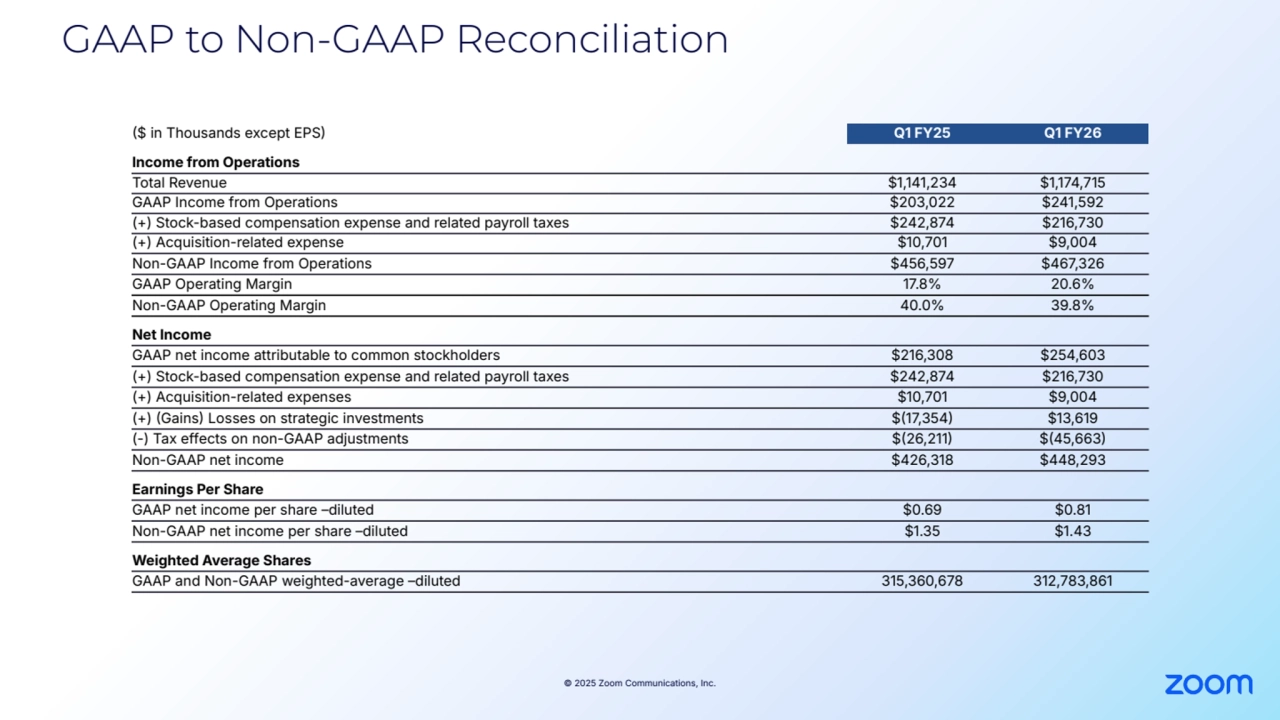
    • 18. © 2025 Zoom Communications, Inc. GAAP to Non-GAAP Reconciliation $ in Thousands except EPS Q1 FY25 Q1 FY26 Income from Operations Total Revenue $1,141,234 $1,174,715 GAAP Income from Operations $203,022 $241,592 (+) Stock-based compensation expense and related payroll taxes $242,874 $216,730 (+) Acquisition-related expense $10,701 $9,004 Non-GAAP Income from Operations $456,597 $467,326 GAAP Operating Margin 17.8% 20.6% Non-GAAP Operating Margin 40.0% 39.8% Net Income GAAP net income attributable to common stockholders $216,308 $254,603 (+) Stock-based compensation expense and related payroll taxes $242,874 $216,730 (+) Acquisition-related expenses $10,701 $9,004 (+) Gains Losses on strategic investments $17,354 $13,619 (-) Tax effects on non-GAAP adjustments $26,211 $45,663 Non-GAAP net income $426,318 $448,293 Earnings Per Share GAAP net income per share –diluted $0.69 $0.81 Non-GAAP net income per share –diluted $1.35 $1.43 Weighted Average Shares GAAP and Non-GAAP weighted-average –diluted 315,360,678 312,783,861
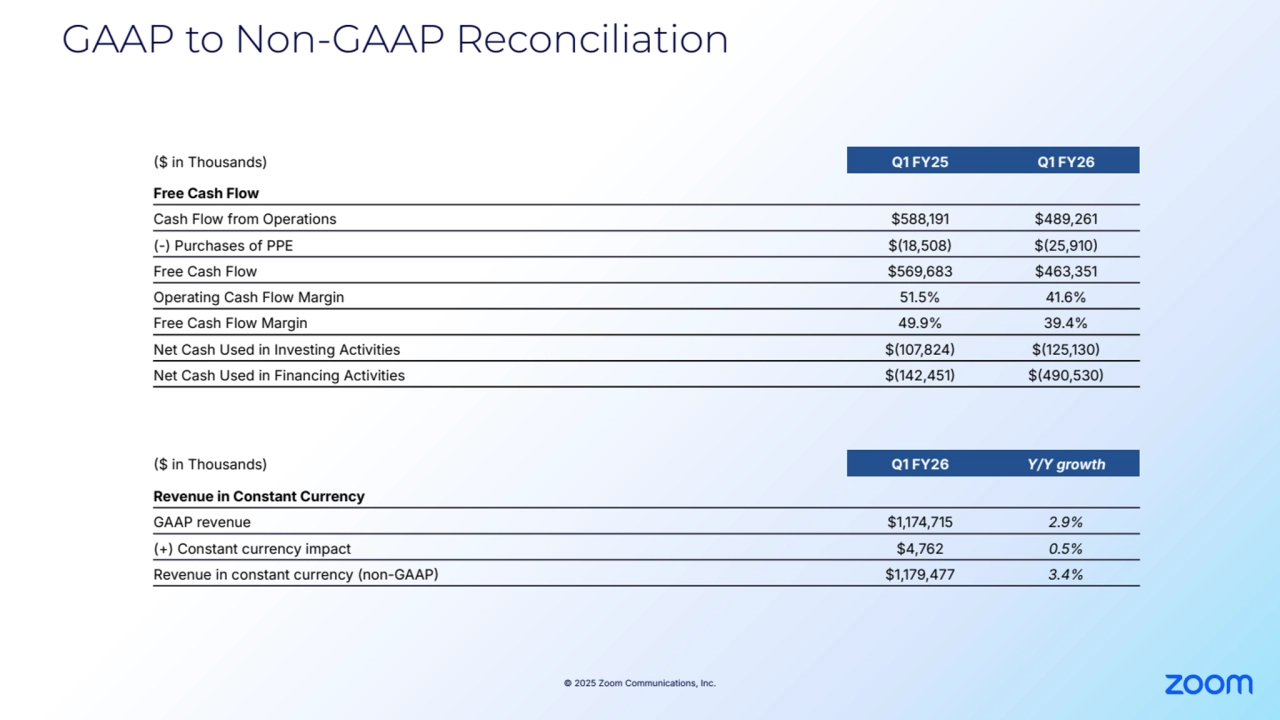
    • 19. © 2025 Zoom Communications, Inc. GAAP to Non-GAAP Reconciliation $ in Thousands) Q1 FY25 Q1 FY26 Free Cash Flow Cash Flow from Operations $588,191 $489,261 (-) Purchases of PPE $18,508 $25,910 Free Cash Flow $569,683 $463,351 Operating Cash Flow Margin 51.5% 41.6% Free Cash Flow Margin 49.9% 39.4% Net Cash Used in Investing Activities $107,824 $125,130 Net Cash Used in Financing Activities $142,451 $490,530 $ in Thousands) Q1 FY26 Y/Y growth Revenue in Constant Currency GAAP revenue $1,174,715 2.9% (+) Constant currency impact $4,762 0.5% Revenue in constant currency (non-GAAP $1,179,477 3.4%
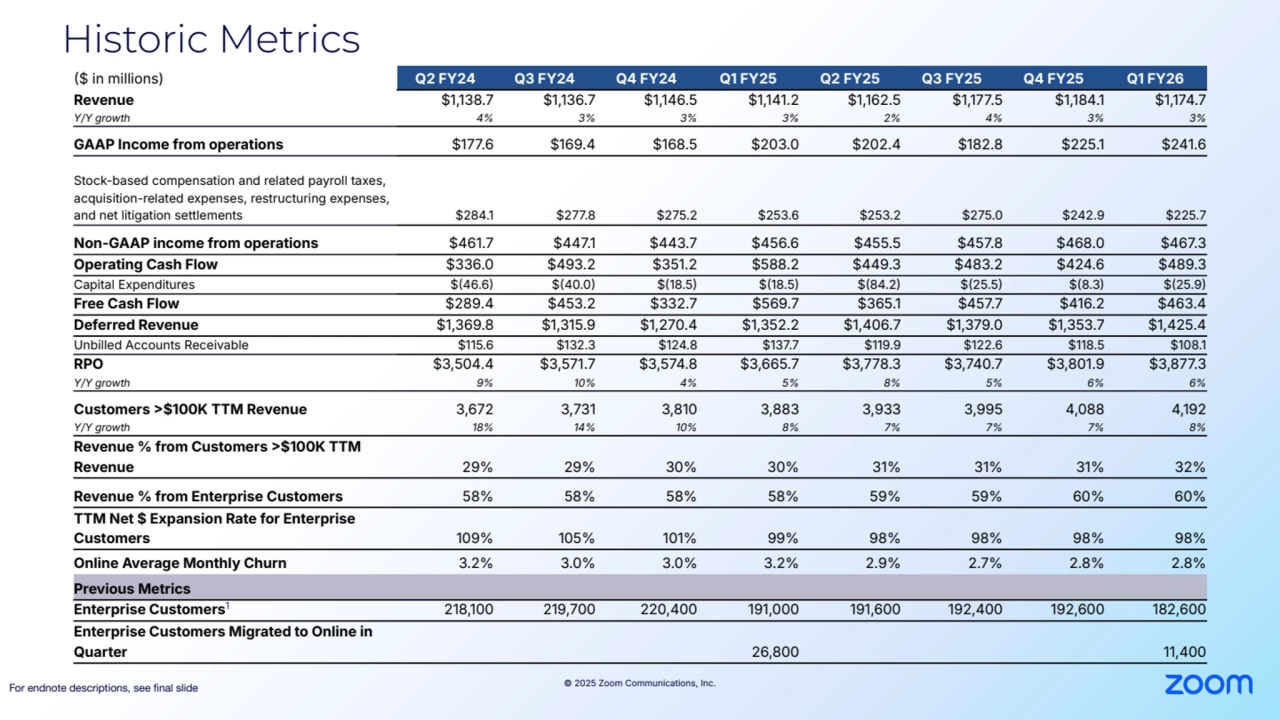
    • 20. © 2025 Zoom Communications, Inc. Historic Metrics For endnote descriptions, see final slide $ in millions) Q2 FY24 Q3 FY24 Q4 FY24 Q1 FY25 Q2 FY25 Q3 FY25 Q4 FY25 Q1 FY26 Revenue $1,138.7 $1,136.7 $1,146.5 $1,141.2 $1,162.5 $1,177.5 $1,184.1 $1,174.7 Y/Y growth 4% 3% 3% 3% 2% 4% 3% 3% GAAP Income from operations $177.6 $169.4 $168.5 $203.0 $202.4 $182.8 $225.1 $241.6 Stock-based compensation and related payroll taxes, acquisition-related expenses, restructuring expenses, and net litigation settlements $284.1 $277.8 $275.2 $253.6 $253.2 $275.0 $242.9 $225.7 Non-GAAP income from operations $461.7 $447.1 $443.7 $456.6 $455.5 $457.8 $468.0 $467.3 Operating Cash Flow $336.0 $493.2 $351.2 $588.2 $449.3 $483.2 $424.6 $489.3 Capital Expenditures $46.6 $40.0 $18.5 $18.5 $84.2 $25.5 $8.3 $25.9 Free Cash Flow $289.4 $453.2 $332.7 $569.7 $365.1 $457.7 $416.2 $463.4 Deferred Revenue $1,369.8 $1,315.9 $1,270.4 $1,352.2 $1,406.7 $1,379.0 $1,353.7 $1,425.4 Unbilled Accounts Receivable $115.6 $132.3 $124.8 $137.7 $119.9 $122.6 $118.5 $108.1 RPO $3,504.4 $3,571.7 $3,574.8 $3,665.7 $3,778.3 $3,740.7 $3,801.9 $3,877.3 Y/Y growth 9% 10% 4% 5% 8% 5% 6% 6% Customers $100K TTM Revenue 3,672 3,731 3,810 3,883 3,933 3,995 4,088 4,192 Y/Y growth 18% 14% 10% 8% 7% 7% 7% 8% Revenue % from Customers $100K TTM Revenue 29% 29% 30% 30% 31% 31% 31% 32% Revenue % from Enterprise Customers 58% 58% 58% 58% 59% 59% 60% 60% TTM Net $ Expansion Rate for Enterprise Customers 109% 105% 101% 99% 98% 98% 98% 98% Online Average Monthly Churn 3.2% 3.0% 3.0% 3.2% 2.9% 2.7% 2.8% 2.8% Previous Metrics Enterprise Customers1 218,100 219,700 220,400 191,000 191,600 192,400 192,600 182,600 Enterprise Customers Migrated to Online in Quarter 26,800 11,400
    • 21. © 2025 Zoom Communications, Inc. Endnotes Revenue expansion in Q1; improved Online churn 1. Not drawn to scale. Currency Impact is a non-GAAP metric. See appendix for a reconciliation of non-GAAP to GAAP financial measures. Zoom defines revenue in constant currency as GAAP revenue adjusted for revenue reported in currencies other than United States dollars as if they were converted into United States dollars using the average exchange rates from the comparative period rather than the actual exchange rates in effect during the respective periods. 2. Zoom calculates online average monthly churn by starting with the Online customer MRR as of the beginning of the applicable quarter (“Entry MRRˮ). Zoom defines Entry MRR as the recurring revenue run-rate of subscription agreements from all Online customers except for subscriptions that Zoom recorded as churn in a previous quarter based on the customers' earlier indication to us of their intention to cancel that subscription. Zoom then determines the MRR related to customers who canceled or downgraded their subscription or notified us of that intention during the applicable quarter (“Applicable Quarter MRR Churnˮ) and divides the Applicable Quarter MRR Churn by the applicable quarter Entry MRR to arrive at the MRR churn rate for Online Customers for the applicable quarter. Zoom then divides that amount by three to calculate the online average monthly churn. Continued growth in the up-market and internationally 1. Zoom calculates net dollar expansion rate as of a period end by starting with the annual recurring revenue (“ARRˮ) from Enterprise customers as of 12 months prior (“Prior Period ARRˮ). Zoom defines ARR as the annualized revenue run rate of subscription agreements from all customers at a point in time. Zoom calculates ARR by taking the monthly recurring revenue (“MRRˮ) and multiplying it by 12. MRR is defined as the recurring revenue run-rate of subscription agreements from all Enterprise customers for the last month of the period, including revenue from monthly subscribers who have not provided any indication that they intend to cancel their subscriptions. Zoom then calculates the ARR from these Enterprise customers as of the current period end (“Current Period ARRˮ), which includes any upsells, contraction, and attrition. Zoom divides the Current Period ARR by the Prior Period ARR to arrive at the net dollar expansion rate. For the trailing 12 months calculation, Zoom takes an average of the net dollar expansion rate over the trailing 12 months. 2. Subtotals revenue and revenue percent have been rounded. Q1 FY26 expenses and margins 1. See appendix for a reconciliation of non-GAAP to GAAP financial measures. Growth in Deferred Revenue and RPO 1. Remaining performance Obligations RPO) consists of both billed considerations and unbilled considerations that we expect to recognize as revenue. Subtotals have been rounded. 2. Current RPO refers to the portion of total RPO which we expect to recognize as revenue over the following 12 months period. Strong Cash Flow, ~$7.8B cash balance, accelerated execution of share buyback in Q1 1. Cash balance refers to cash, cash equivalents and marketable securities, excluding restricted cash at the end of the period. 2. See appendix for a reconciliation of non-GAAP to GAAP financial measures. Zoom defines free cash flow as net cash provided by operating activities less purchases of property and equipment. Q2 & raised fiscal year 2026 outlook 1. A reconciliation of non-GAAP guidance measures to corresponding GAAP measures is not available on a forward-looking basis without unreasonable effort due to the uncertainty of expenses that may be incurred in the future, although it is important to note that these factors could be material to Zoomʼs results computed in accordance with GAAP. 2. Free cash flow is a non-GAAP financial metric. Zoom defines free cash flow as net cash provided by operating activities less purchases of property and equipment. Historic Metrics 1. Enterprise Customers are rounded down to the nearest hundred. In order to enhance customer experience and improve efficiency, in Q1 FY25 we transitioned approximately 26,800 Enterprise customers and in Q1 FY26 we transitioned approximately 11,400 Enterprise customers with lower MRR away from working with direct sales teams, resellers, or strategic partners to our Online channel. The impact of these transitions did not have a material impact on the percent of revenue from Enterprise and Online customers, net dollar expansion rate, or Online average monthly churn.


    • Previous
    • Next
    • f Fullscreen
    • esc Exit Fullscreen