2Q 2025 Earnings Presentation Udemy
 AI Summary
Key Insights
- 📈 Revenue Growth: $199.9M in revenue, exceeding expectations, driven by enterprise segment growth.
- ✅ Positive Income: Delivered $6.3M in GAAP net income, the first positive quarter since IPO.
- 🤖 AI Initiatives: Launched AI Packages and Role Play for real-world soft skills.
- 🔄 Subscription Model: Subscription revenue increased to 15% of the segment’s total mix.
- 💵 Cash Flow: Positive free cash flow for Q2 was $39.0 million.


2Q 2025 Earnings Presentation Udemy
- 1. 2Q 2025 Earnings Presentation July 30, 2025
- 2. This presentation and any accompanying oral commentary include forward-looking statements within the meaning of the Private Securities Litigation Reform Act of 1995. Forward-looking statements include all statements other than those of historical fact, including information concerning our future operating results and financial position, anticipated future expenses and investments, business strategies and plans, market growth, market position and potential market opportunities, and the impact of acquisitions and business alliances. These forward-looking statements are based on our current expectations, plans, and assumptions, which we have made in light of our experience in the industry, as well as our perceptions of historical trends, current conditions, expected future developments, and other factors we believe are appropriate under the circumstances, taking into account the information currently available to us. These statements are only predictions based upon our current expectations and projections about future events. Various factors, including those identified in the "Risk Factors" section of our filings with the Securities and Exchange Commission ("SEC"), could cause our actual results, level of activity, performance, or achievements to differ materially from those expressed or implied by these forward-looking statements. Additional factors that could cause actual results to differ materially from those expressed or implied in forward-looking statements can be found in our other filings with the SEC which are available, free of charge, on the SEC’s website at www.sec.gov. Any forward-looking statement made by us in this presentation speaks only as of the date of this presentation and is expressly qualified in its entirety by the cautionary statements included in this presentation. These statements are made as of July 30, 2025. We undertake no obligation to publicly update or review any forward-looking statement, whether as a result of new information, future developments, or otherwise, except as may be required by any applicable laws. You should not place undue reliance on our forward-looking statements. This presentation contains “non-GAAP measures” that are financial measures that either exclude or include amounts that are not excluded or included in the most directly comparable measures calculated and presented in accordance with U.S. generally accepted accounting principles (“GAAP”). Among other non-GAAP measures, this presentation uses (1) non-GAAP gross profit, which we define as gross profit adjusted to exclude stock-based compensation expense and the amortization and acquired intangible assets; (2) non-GAAP gross margin, which we calculate as non-GAAP gross profit divided by revenue for the same period; (3) non-GAAP net income (loss), which we define as net income (loss) adjusted to exclude stock-based compensation expense, amortization of acquired intangible assets, and restructuring charges; (4) adjusted EBITDA (or AEBITDA), which we calculate as net income (loss) adjusted to exclude interest income, interest expense, provision for income taxes, depreciation and amortization, other income (expense), net (including gains and losses from the remeasurement of foreign currency assets and liabilities into their functional currency), stock-based compensation expense, and restructuring charges; and (5) free cash flow, which we calculate as net cash provided by operating activities, less purchases of property and equipment and capitalized software costs, as we consider these capital expenditures necessary to support our ongoing operations. These measures have limitations as an analytical tool and should not be considered in isolation, or as a substitute for our results as reported under GAAP. These non-GAAP measures may also differ from non-GAAP measures used by other companies. See the appendix for a reconciliation of the non-GAAP measures used in this presentation to the most directly comparable GAAP financial measure. Unless otherwise noted, historical numerical figures and related graphics used in this presentation are accurate as of June 30, 2025. Numerical figures in this presentation have been subject to rounding adjustments. Accordingly, numerical figures shown as totals in various tables may not be arithmetic aggregations of the figures that precede them. The Udemy design logo, “Udemy,” and our other registered or common law trademarks, service marks or trade names appearing in this presentation are our property. This presentation contains additional trademarks, trade names, and service marks of other companies that are the property of their respective owners. We do not intend our use or display of other companies’ trademarks, trade names, or service marks to imply relationships with, or endorsement or sponsorship of us by, these other companies. Safe Harbor Notice
- 3. 3 Udemy is THE AI-POWERED SKILLS ACCELERATION PLATFORM for the future workplace
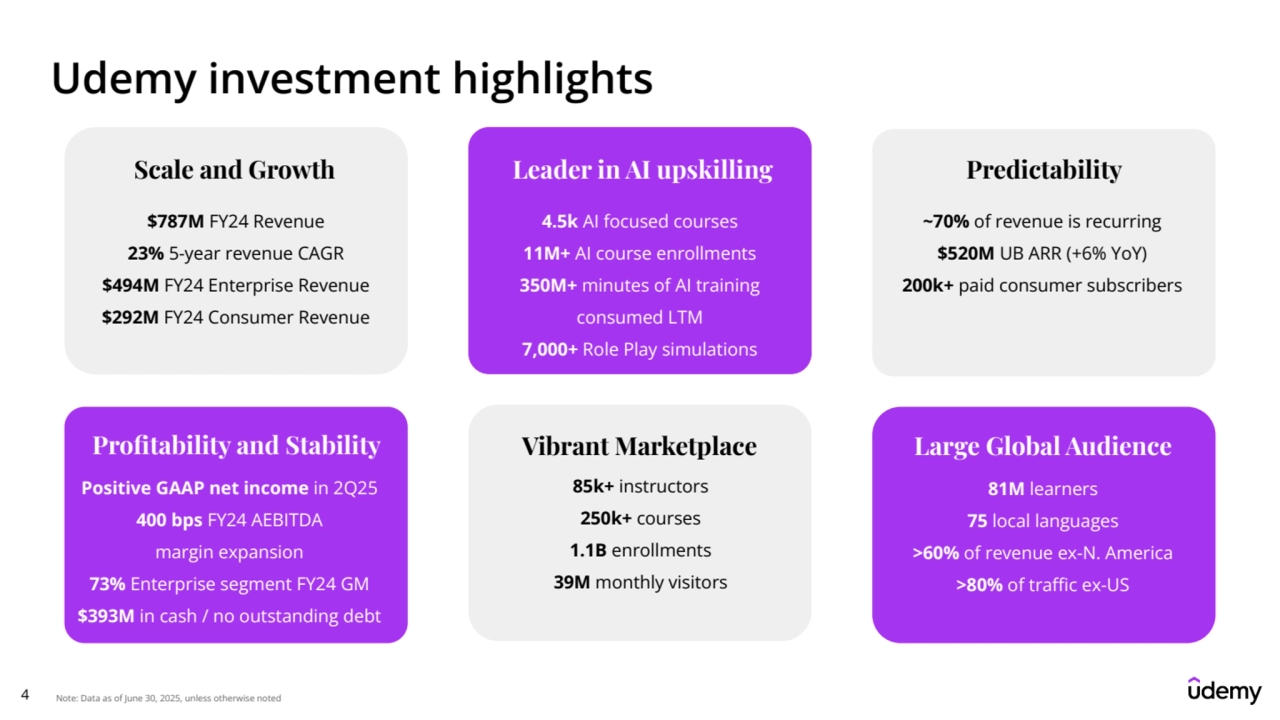
- 4. 4 Udemy investment highlights Note: Data as of June 30, 2025, unless otherwise noted Leader in AI upskilling 4.5k AI focused courses 11M+ AI course enrollments 350M+ minutes of AI training consumed LTM 7,000+ Role Play simulations Scale and Growth $787M FY24 Revenue 23% 5-year revenue CAGR $494M FY24 Enterprise Revenue $292M FY24 Consumer Revenue Predictability ~70% of revenue is recurring $520M UB ARR (+6% YoY) 200k+ paid consumer subscribers Profitability and Stability Positive GAAP net income in 2Q25 400 bps FY24 AEBITDA margin expansion 73% Enterprise segment FY24 GM $393M in cash / no outstanding debt Vibrant Marketplace 85k+ instructors 250k+ courses 1.1B enrollments 39M monthly visitors Large Global Audience 81M learners 75 local languages >60% of revenue ex-N. America >80% of traffic ex-US
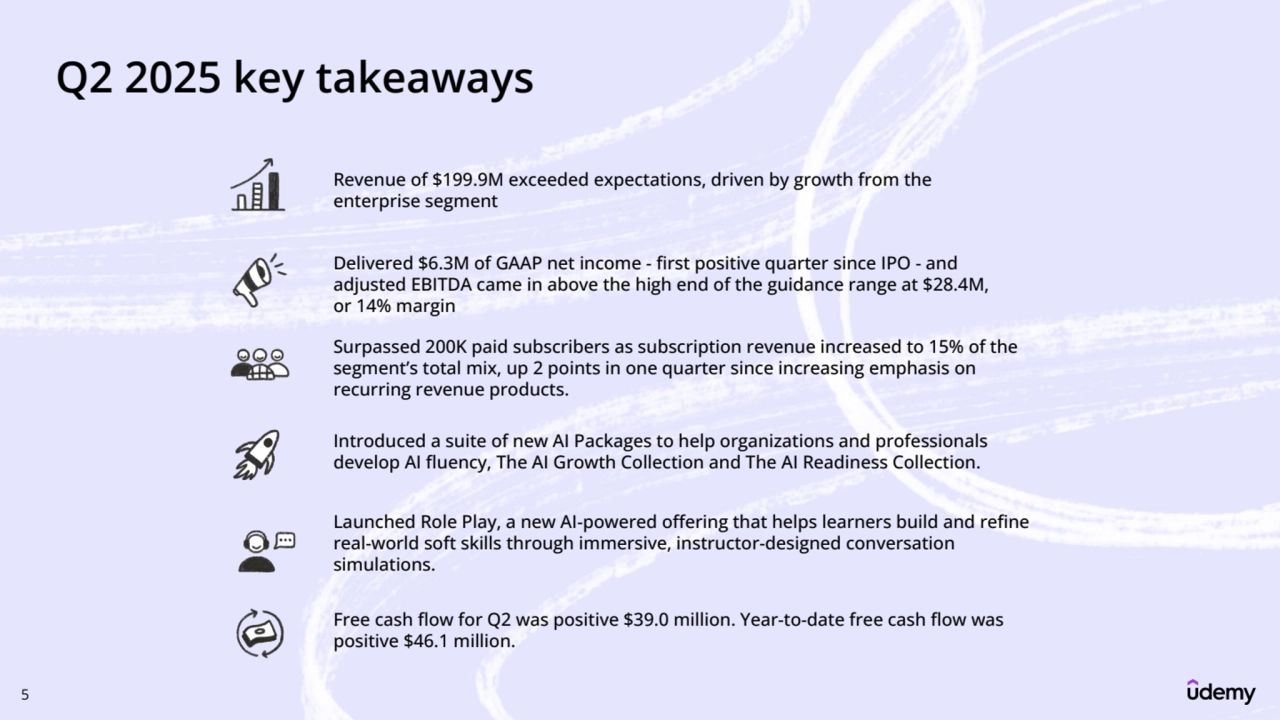
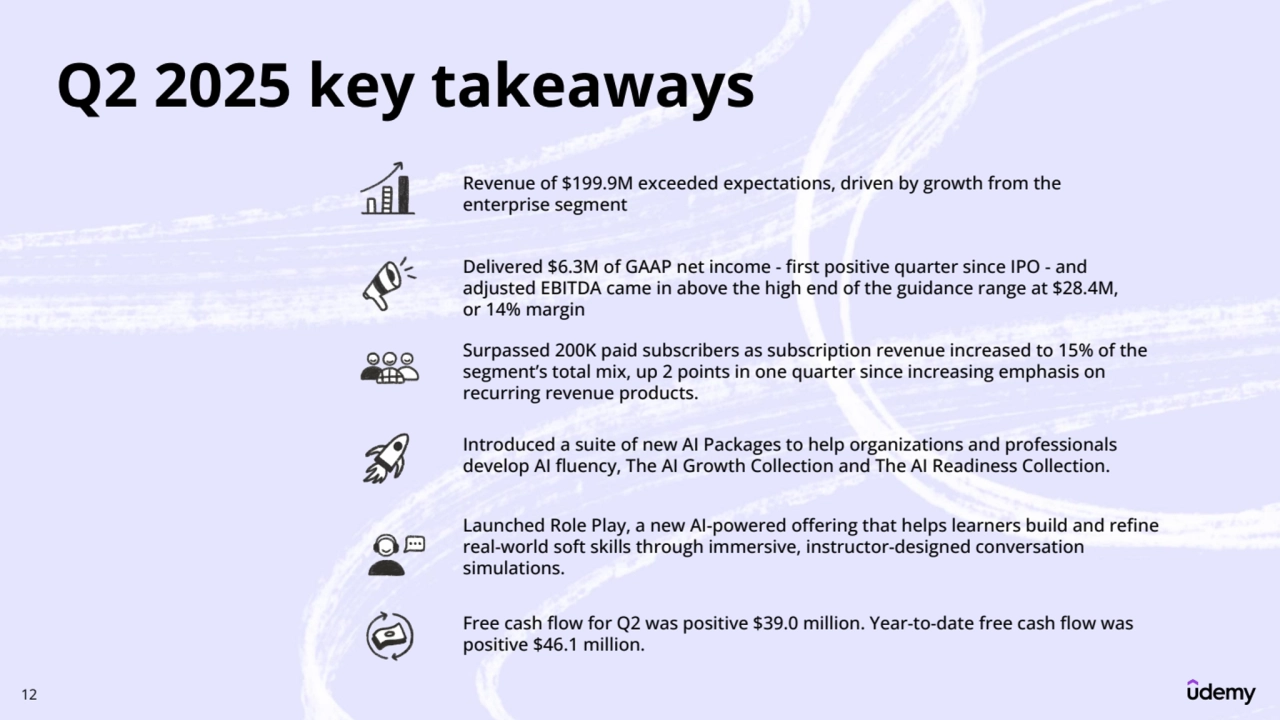
- 5. 5 Q2 2025 key takeaways Revenue of $199.9M exceeded expectations, driven by growth from the enterprise segment Delivered $6.3M of GAAP net income - first positive quarter since IPO - and adjusted EBITDA came in above the high end of the guidance range at $28.4M, or 14% margin Surpassed 200K paid subscribers as subscription revenue increased to 15% of the segment’s total mix, up 2 points in one quarter since increasing emphasis on recurring revenue products. Launched Role Play, a new AI-powered offering that helps learners build and refine real-world soft skills through immersive, instructor-designed conversation simulations. Introduced a suite of new AI Packages to help organizations and professionals develop AI fluency, The AI Growth Collection and The AI Readiness Collection. Free cash flow for Q2 was positive $39.0 million. Year-to-date free cash flow was positive $46.1 million.
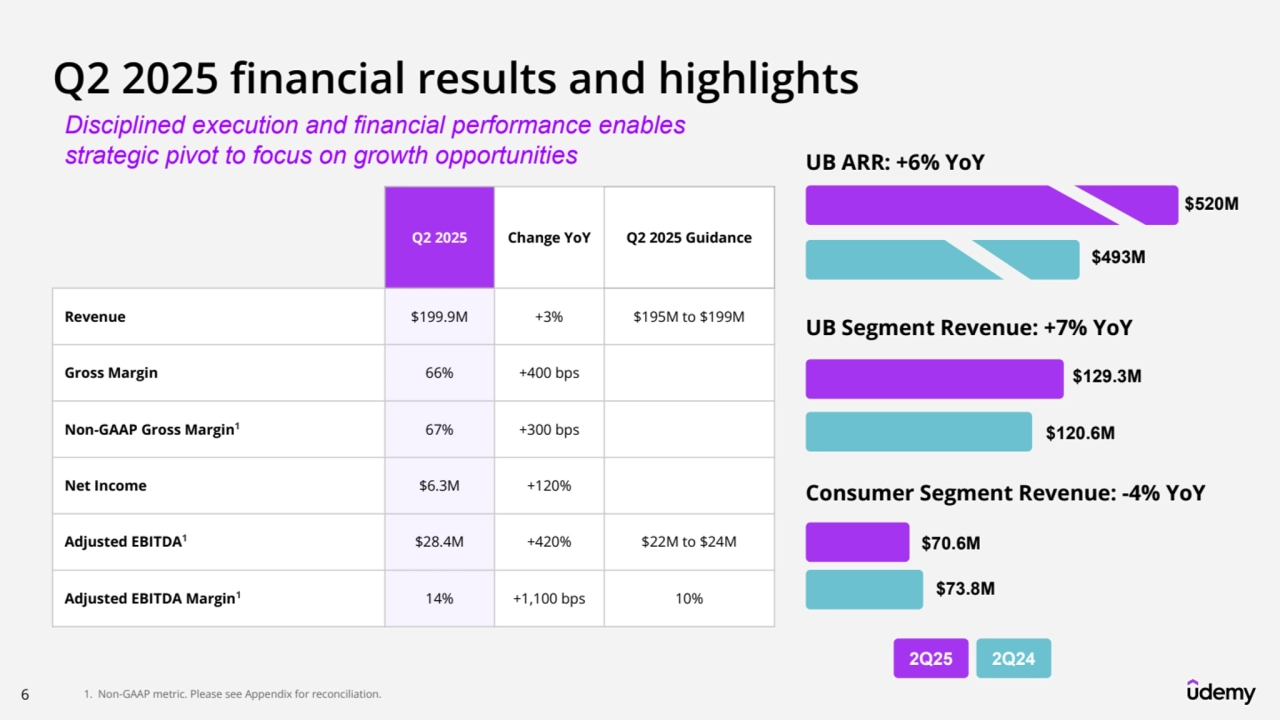
- 6. 6 Q2 2025 financial results and highlights 1. Non-GAAP metric. Please see Appendix for reconciliation. Q2 2025 Change YoY Q2 2025 Guidance Revenue $199.9M +3% $195M to $199M Gross Margin 66% +400 bps Non-GAAP Gross Margin167% +300 bps Net Income $6.3M +120% Adjusted EBITDA1$28.4M +420% $22M to $24M Adjusted EBITDA Margin114% +1,100 bps 10% UB ARR: +6% YoY $520M $493M UB Segment Revenue: +7% YoY $129.3M $120.6M Consumer Segment Revenue: -4% YoY $70.6M $73.8M Disciplined execution and financial performance enables strategic pivot to focus on growth opportunities 2Q25 2Q24
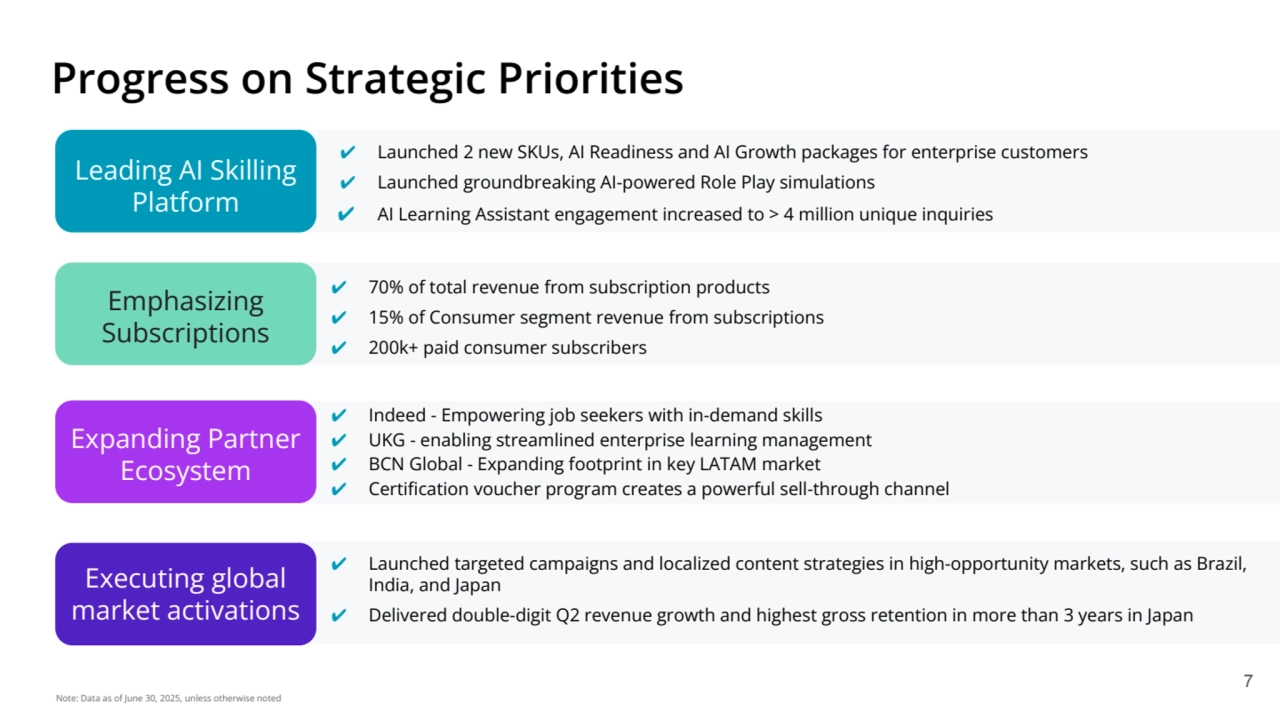
- 7. ✔ Indeed - Empowering job seekers with in-demand skills ✔ UKG - enabling streamlined enterprise learning management ✔ BCN Global - Expanding footprint in key LATAM market ✔ Certification voucher program creates a powerful sell-through channel Progress on Strategic Priorities 7 ✔ Launched 2 new SKUs, AI Readiness and AI Growth packages for enterprise customers ✔ Launched groundbreaking AI-powered Role Play simulations ✔ AI Learning Assistant engagement increased to > 4 million unique inquiries Emphasizing Subscriptions Expanding Partner Ecosystem Executing global market activations ✔ 70% of total revenue from subscription products ✔ 15% of Consumer segment revenue from subscriptions ✔ 200k+ paid consumer subscribers ✔ Launched targeted campaigns and localized content strategies in high-opportunity markets, such as Brazil, India, and Japan ✔ Delivered double-digit Q2 revenue growth and highest gross retention in more than 3 years in Japan Note: Data as of June 30, 2025, unless otherwise noted Leading AI Skilling Platform
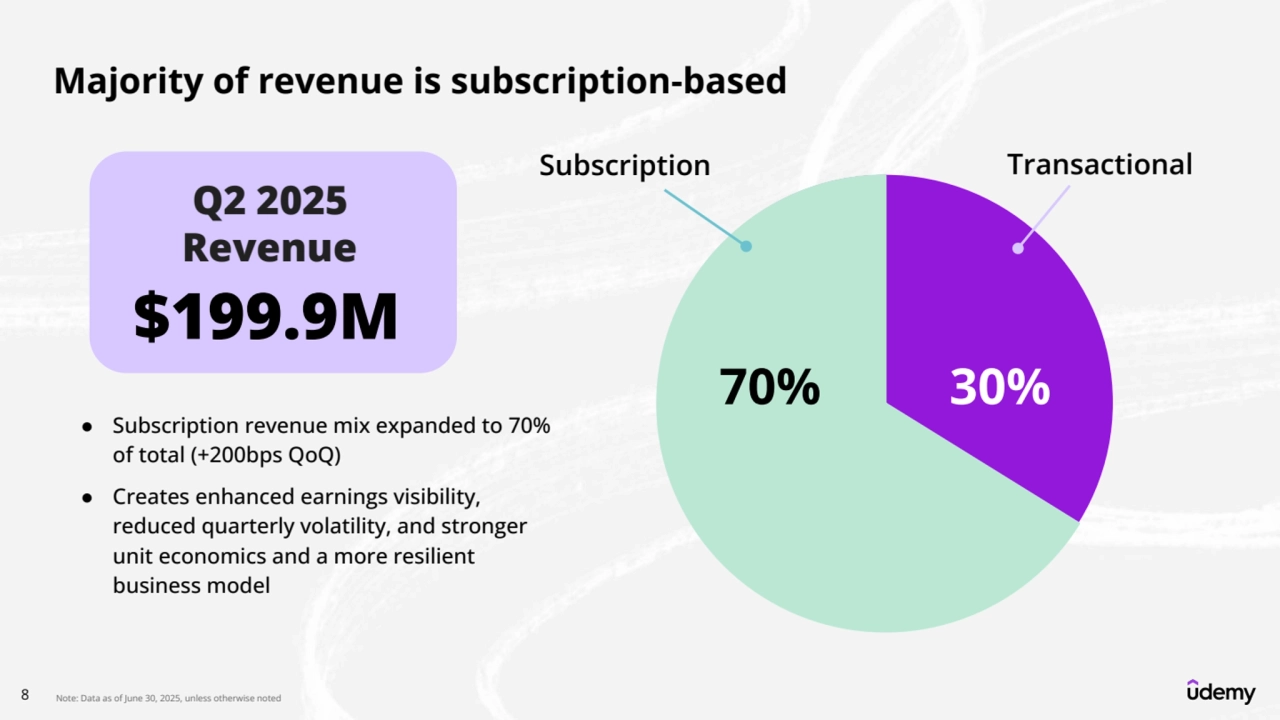
- 8. 8 Majority of revenue is subscription-based Subscription Transactional Q2 2025 Revenue $199.9M 70% 30% ● Subscription revenue mix expanded to 70% of total (+200bps QoQ) ● Creates enhanced earnings visibility, reduced quarterly volatility, and stronger unit economics and a more resilient business model Note: Data as of June 30, 2025, unless otherwise noted
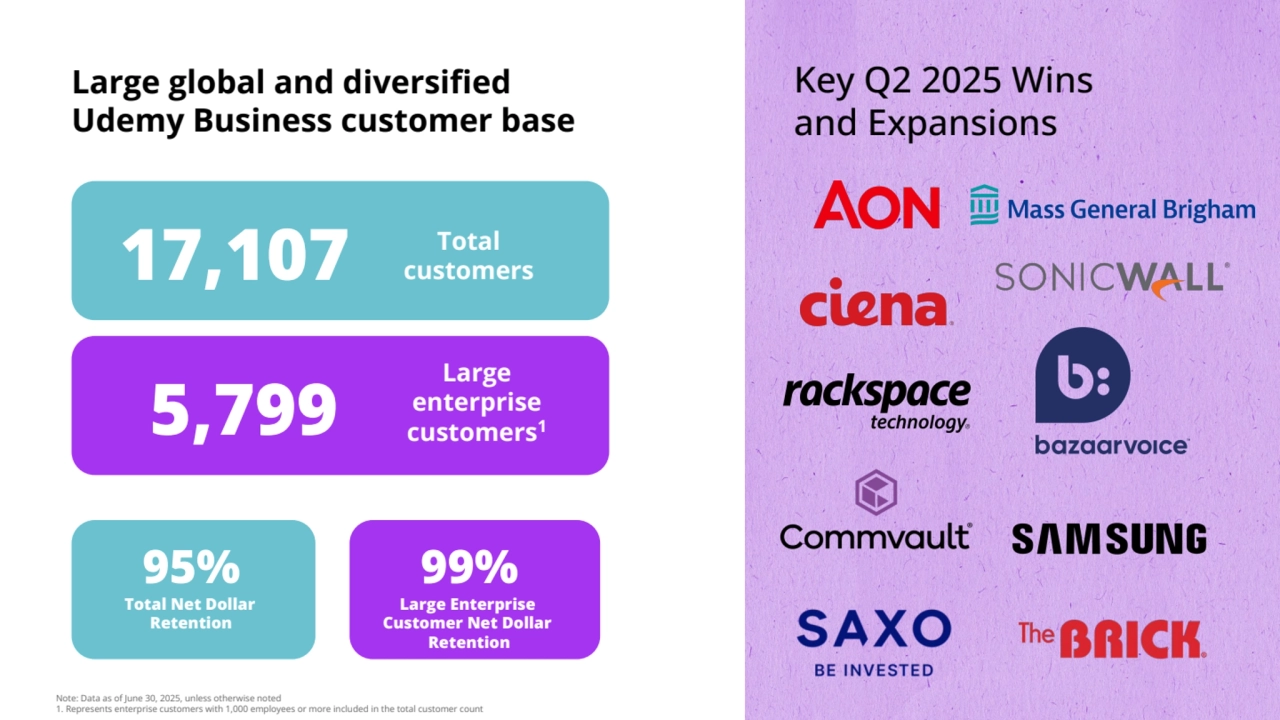
- 9. Large global and diversified Udemy Business customer base Key Q2 2025 Wins and Expansions 17,107 Total customers 5,799 Large enterprise customers1 95% Total Net Dollar Retention 99% Large Enterprise Customer Net Dollar Retention Note: Data as of June 30, 2025, unless otherwise noted 1. Represents enterprise customers with 1,000 employees or more included in the total customer count
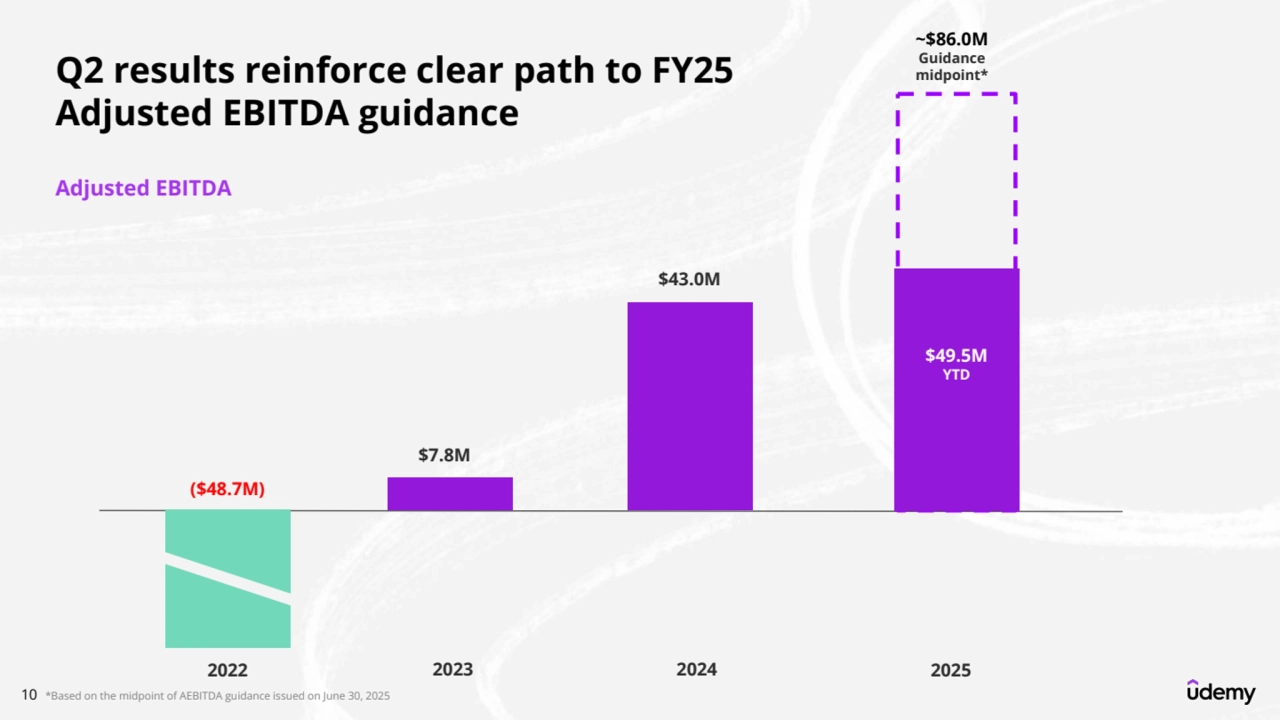
- 10. 10 ($48.7M) $7.8M $43.0M ~$86.0M Guidance midpoint* 2022 2023 2024 2025 Adjusted EBITDA Q2 results reinforce clear path to FY25 Adjusted EBITDA guidance $49.5M YTD *Based on the midpoint of AEBITDA guidance issued on June 30, 2025
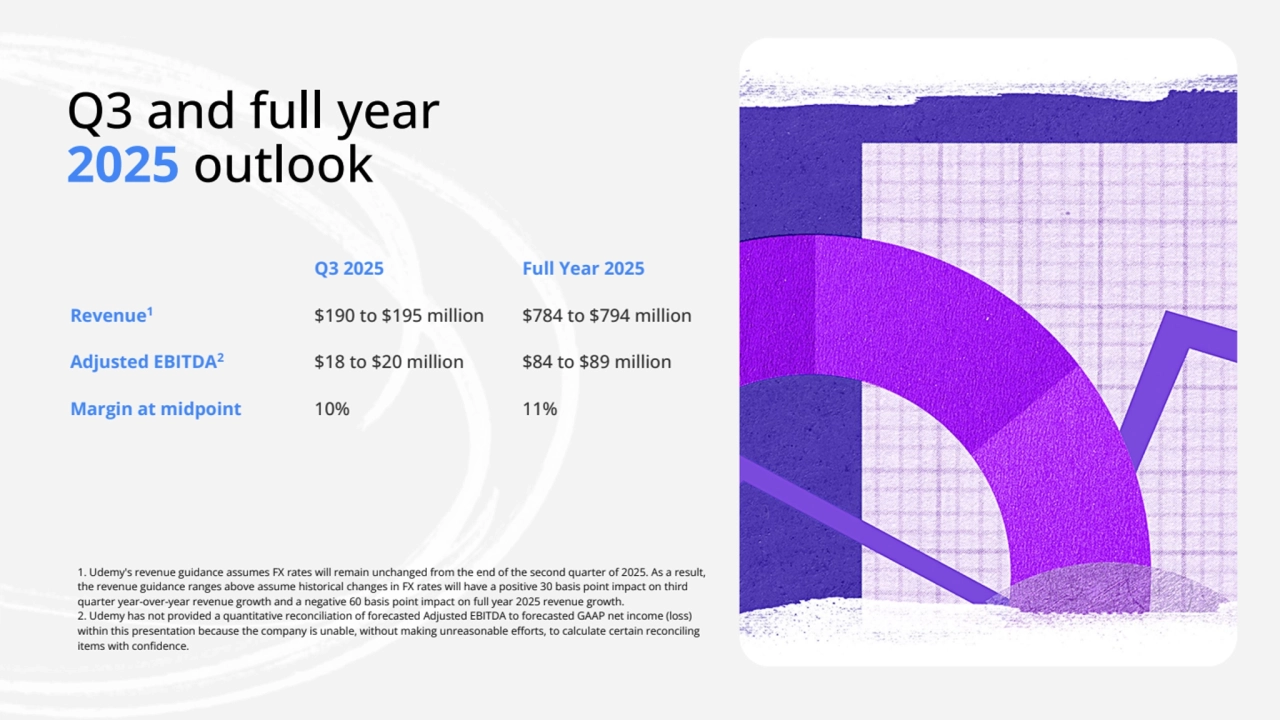
- 11. Revenue1 Adjusted EBITDA2 Margin at midpoint $190 to $195 million $18 to $20 million 10% $784 to $794 million $84 to $89 million 11% Q3 2025 Full Year 2025 1. Udemy's revenue guidance assumes FX rates will remain unchanged from the end of the second quarter of 2025. As a result, the revenue guidance ranges above assume historical changes in FX rates will have a positive 30 basis point impact on third quarter year-over-year revenue growth and a negative 60 basis point impact on full year 2025 revenue growth. 2. Udemy has not provided a quantitative reconciliation of forecasted Adjusted EBITDA to forecasted GAAP net income (loss) within this presentation because the company is unable, without making unreasonable efforts, to calculate certain reconciling items with confidence. Q3 and full year 2025 outlook
- 12. 12 Q2 2025 key takeaways Revenue of $199.9M exceeded expectations, driven by growth from the enterprise segment Delivered $6.3M of GAAP net income - first positive quarter since IPO - and adjusted EBITDA came in above the high end of the guidance range at $28.4M, or 14% margin Surpassed 200K paid subscribers as subscription revenue increased to 15% of the segment’s total mix, up 2 points in one quarter since increasing emphasis on recurring revenue products. Launched Role Play, a new AI-powered offering that helps learners build and refine real-world soft skills through immersive, instructor-designed conversation simulations. Introduced a suite of new AI Packages to help organizations and professionals develop AI fluency, The AI Growth Collection and The AI Readiness Collection. Free cash flow for Q2 was positive $39.0 million. Year-to-date free cash flow was positive $46.1 million.
- 13. Products
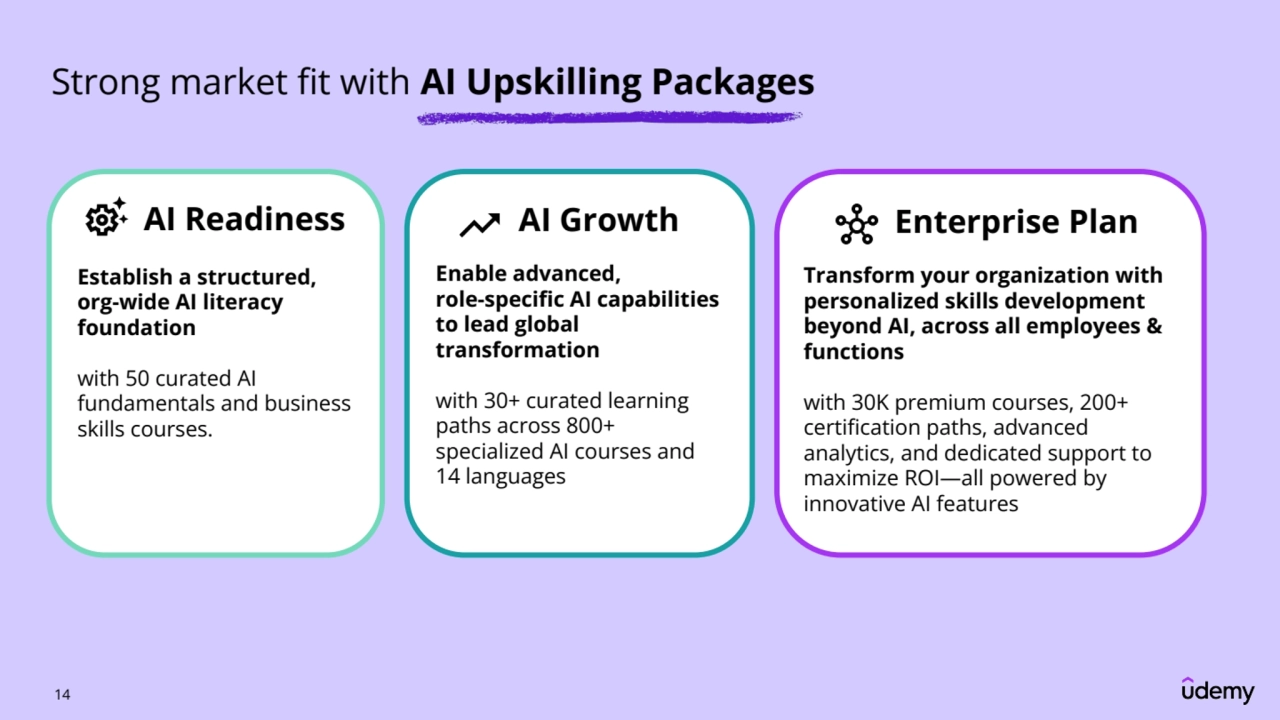
- 14. 14 Enterprise Plan Transform your organization with personalized skills development beyond AI, across all employees & functions with 30K premium courses, 200+ certification paths, advanced analytics, and dedicated support to maximize ROI—all powered by innovative AI features AI Growth Enable advanced, role-specific AI capabilities to lead global transformation with 30+ curated learning paths across 800+ specialized AI courses and 14 languages AI Readiness Establish a structured, org-wide AI literacy foundation with 50 curated AI fundamentals and business skills courses. Strong market fit with AI Upskilling Packages
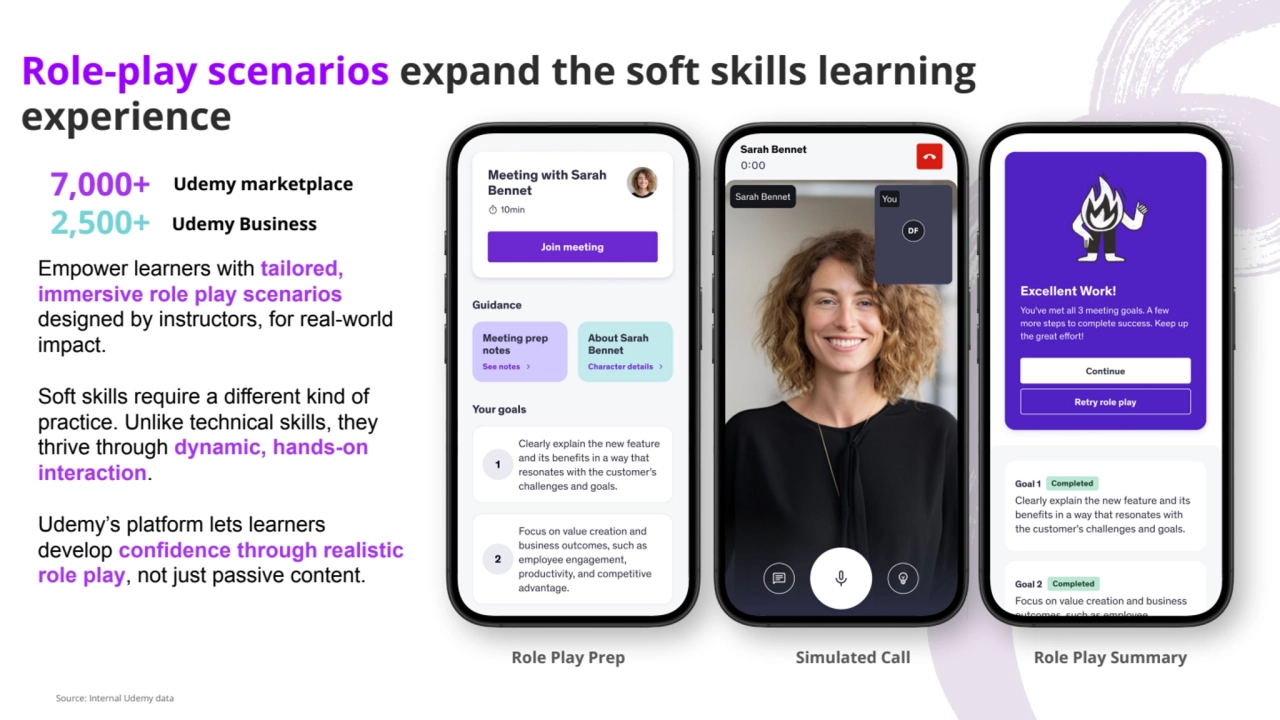
- 15. Role-play scenarios expand the soft skills learning experience Role Play Prep Simulated Call Role Play Summary Empower learners with tailored, immersive role play scenarios designed by instructors, for real-world impact. Soft skills require a different kind of practice. Unlike technical skills, they thrive through dynamic, hands-on interaction. Udemy’s platform lets learners develop confidence through realistic role play, not just passive content. 7,000+ 2,500+ Udemy marketplace Udemy Business Source: Internal Udemy data
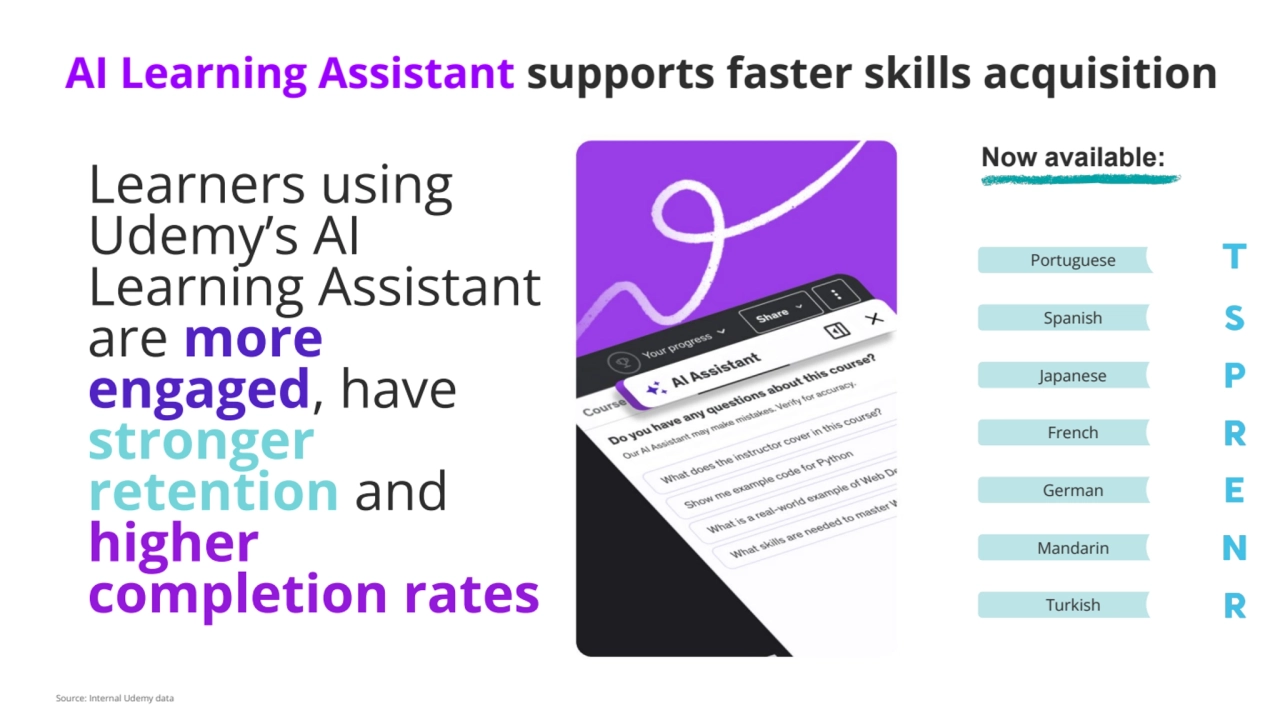
- 16. Japanese French German Mandarin Turkish Spanish Portuguese Learners using Udemy’s AI Learning Assistant are more engaged, have stronger retention and higher completion rates 🇹 Now available: 🇸 🇵 🇷 🇪 🇳 🇷 AI Learning Assistant supports faster skills acquisition Source: Internal Udemy data
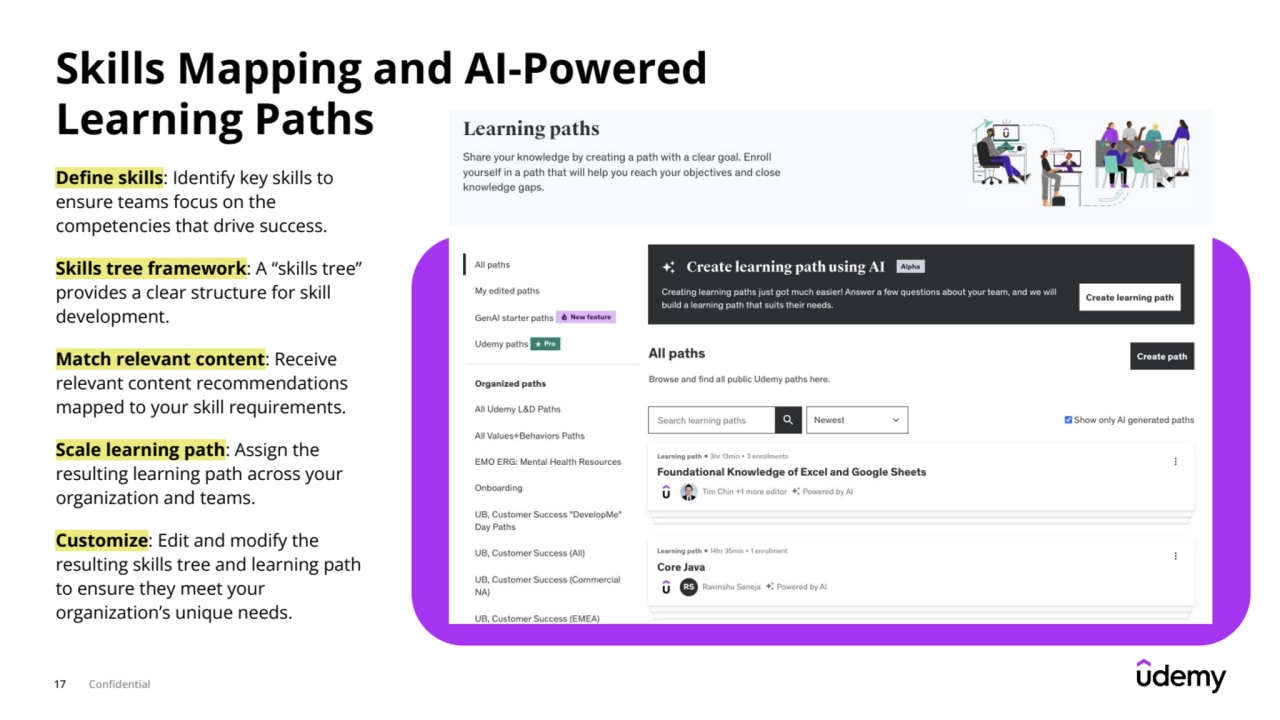
- 17. 17 Confidential Skills Mapping and AI-Powered Learning Paths Define skills: Identify key skills to ensure teams focus on the competencies that drive success. Skills tree framework: A “skills tree” provides a clear structure for skill development. Match relevant content: Receive relevant content recommendations mapped to your skill requirements. Scale learning path: Assign the resulting learning path across your organization and teams. Customize: Edit and modify the resulting skills tree and learning path to ensure they meet your organization’s unique needs.
- 18. Appendix
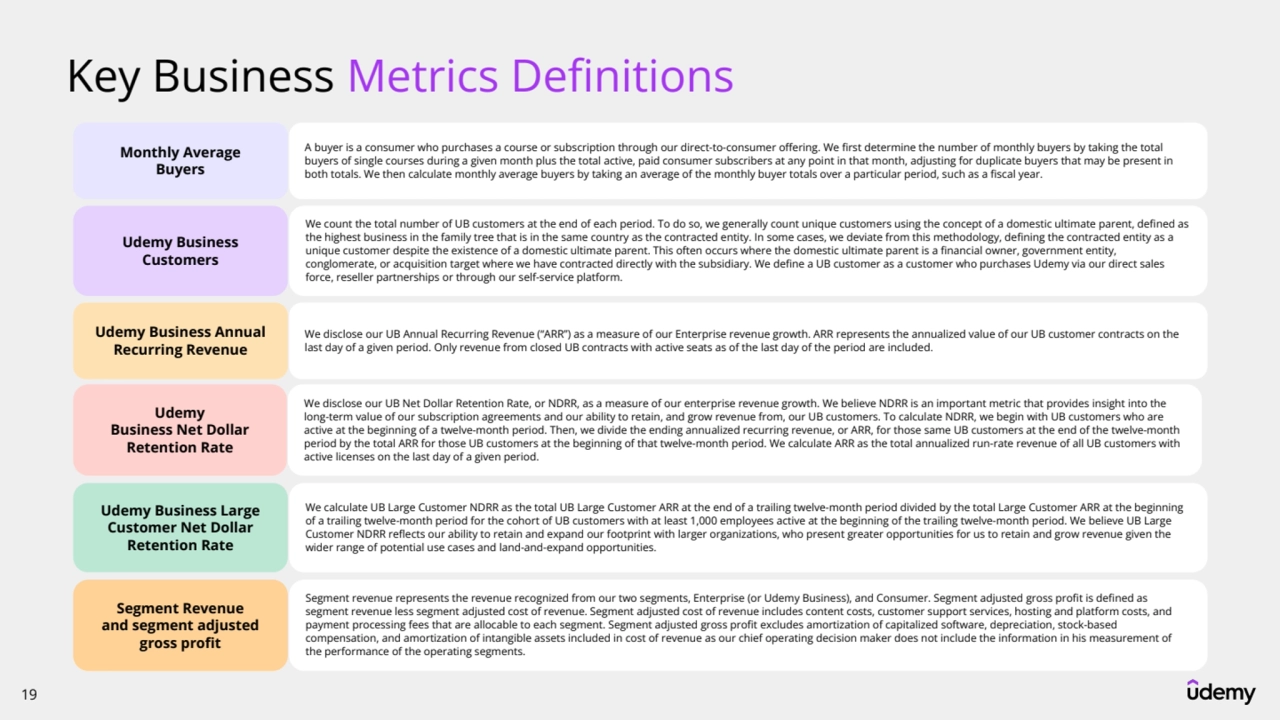
- 19. 19 Key Business Metrics Definitions Monthly Average Buyers A buyer is a consumer who purchases a course or subscription through our direct-to-consumer offering. We first determine the number of monthly buyers by taking the total buyers of single courses during a given month plus the total active, paid consumer subscribers at any point in that month, adjusting for duplicate buyers that may be present in both totals. We then calculate monthly average buyers by taking an average of the monthly buyer totals over a particular period, such as a fiscal year. Udemy Business Customers We count the total number of UB customers at the end of each period. To do so, we generally count unique customers using the concept of a domestic ultimate parent, defined as the highest business in the family tree that is in the same country as the contracted entity. In some cases, we deviate from this methodology, defining the contracted entity as a unique customer despite the existence of a domestic ultimate parent. This often occurs where the domestic ultimate parent is a financial owner, government entity, conglomerate, or acquisition target where we have contracted directly with the subsidiary. We define a UB customer as a customer who purchases Udemy via our direct sales force, reseller partnerships or through our self-service platform. Udemy Business Annual Recurring Revenue We disclose our UB Annual Recurring Revenue (“ARR”) as a measure of our Enterprise revenue growth. ARR represents the annualized value of our UB customer contracts on the last day of a given period. Only revenue from closed UB contracts with active seats as of the last day of the period are included. Udemy Business Net Dollar Retention Rate We disclose our UB Net Dollar Retention Rate, or NDRR, as a measure of our enterprise revenue growth. We believe NDRR is an important metric that provides insight into the long-term value of our subscription agreements and our ability to retain, and grow revenue from, our UB customers. To calculate NDRR, we begin with UB customers who are active at the beginning of a twelve-month period. Then, we divide the ending annualized recurring revenue, or ARR, for those same UB customers at the end of the twelve-month period by the total ARR for those UB customers at the beginning of that twelve-month period. We calculate ARR as the total annualized run-rate revenue of all UB customers with active licenses on the last day of a given period. Udemy Business Large Customer Net Dollar Retention Rate We calculate UB Large Customer NDRR as the total UB Large Customer ARR at the end of a trailing twelve-month period divided by the total Large Customer ARR at the beginning of a trailing twelve-month period for the cohort of UB customers with at least 1,000 employees active at the beginning of the trailing twelve-month period. We believe UB Large Customer NDRR reflects our ability to retain and expand our footprint with larger organizations, who present greater opportunities for us to retain and grow revenue given the wider range of potential use cases and land-and-expand opportunities. Segment Revenue and segment adjusted gross profit Segment revenue represents the revenue recognized from our two segments, Enterprise (or Udemy Business), and Consumer. Segment adjusted gross profit is defined as segment revenue less segment adjusted cost of revenue. Segment adjusted cost of revenue includes content costs, customer support services, hosting and platform costs, and payment processing fees that are allocable to each segment. Segment adjusted gross profit excludes amortization of capitalized software, depreciation, stock-based compensation, and amortization of intangible assets included in cost of revenue as our chief operating decision maker does not include the information in his measurement of the performance of the operating segments.
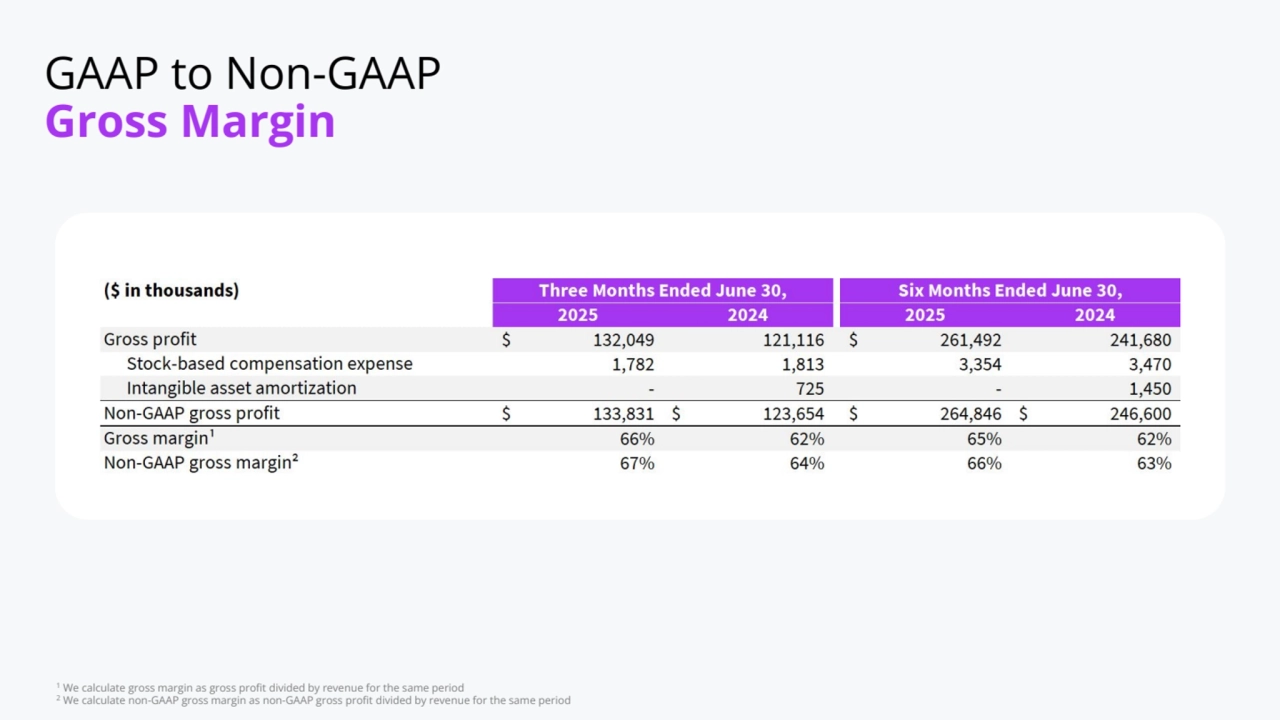
- 20. 1 We calculate gross margin as gross profit divided by revenue for the same period 2 We calculate non-GAAP gross margin as non-GAAP gross profit divided by revenue for the same period GAAP to Non-GAAP Gross Margin
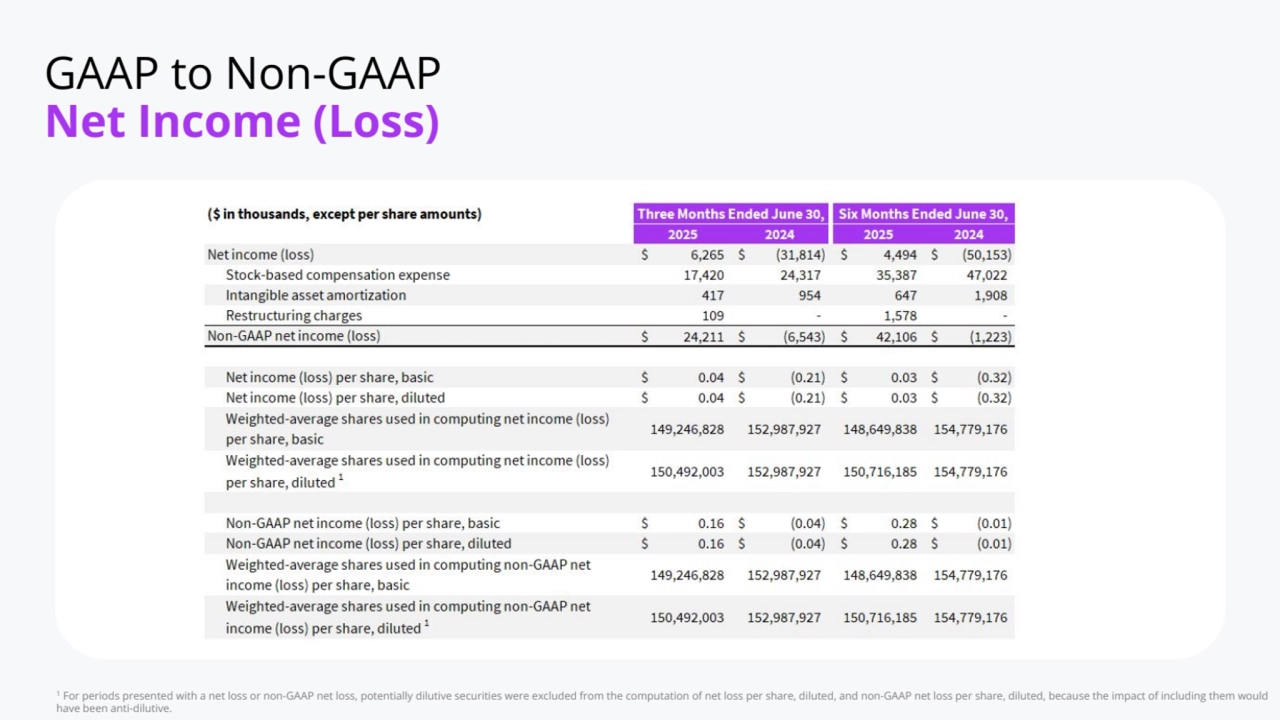
- 21. 1 For periods presented with a net loss or non-GAAP net loss, potentially dilutive securities were excluded from the computation of net loss per share, diluted, and non-GAAP net loss per share, diluted, because the impact of including them would have been anti-dilutive. GAAP to Non-GAAP Net Income (Loss)
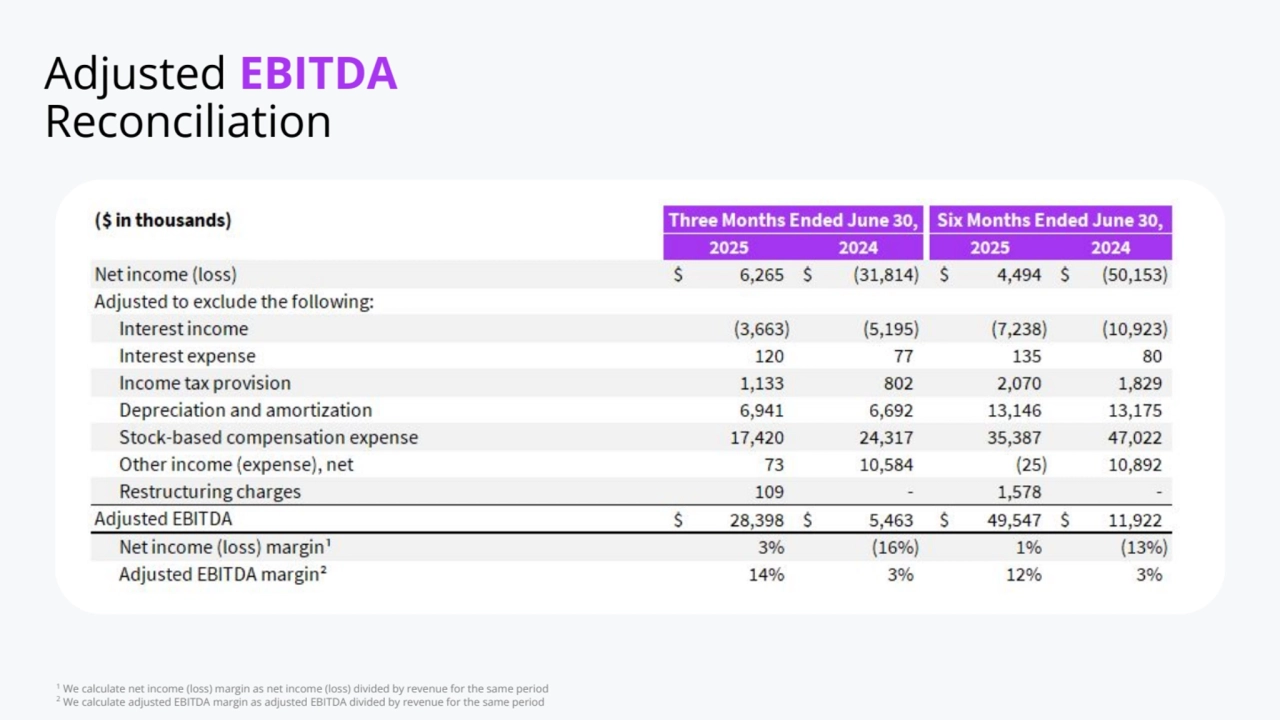
- 22. 1 We calculate net income (loss) margin as net income (loss) divided by revenue for the same period 2 We calculate adjusted EBITDA margin as adjusted EBITDA divided by revenue for the same period Adjusted EBITDA Reconciliation
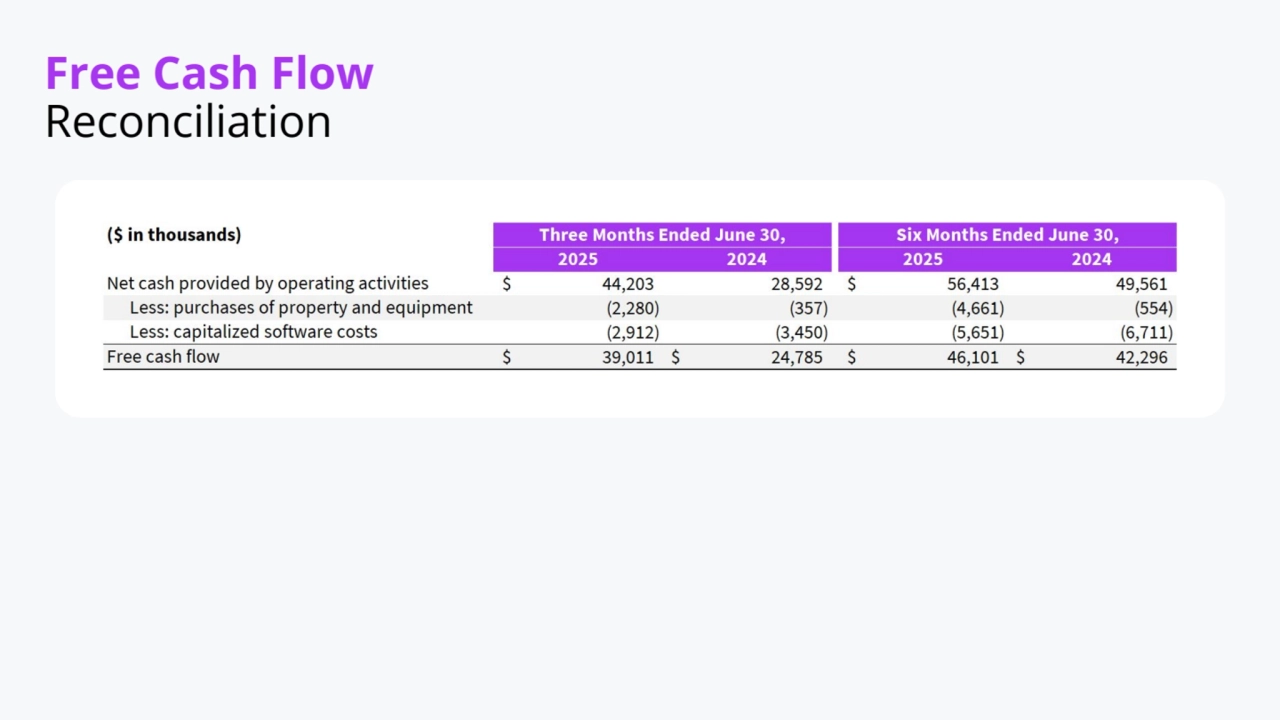
- 23. Free Cash Flow Reconciliation