August 2025 Investor Presentation Datadog

    August 2025 Investor Presentation Datadog

    F5 days ago 3

    Loading...

    August 2025
Investor Presentation 
DATADOG
    1/35

    Loading...

    Safe harbor
This presentation and the accompanying oral presentation have been prepared by Datadog, Inc. (“Datadog” or the “company”) for informational purposes only and not for any other 
purpose. Nothing contained in this presentation is, or should be construed as, a recommendation, promise or representation by the presenter or Datadog or any officer, director, 
employee, agent or advisor of Datadog. This presentation does not purport to be all-inclusive or to contain all of the information you may desire. Information provided in this 
presentation speaks only as of the date hereof, unless otherwise indicated. 
This presentation and accompanying oral presentation contain “forward-looking” statements, as that term is defined under the federal securities laws, including but not limited to 
statements regarding Datadog’s strategy, product and platform capabilities, the growth in and ability to capitalize on long-term market opportunities including the pace and scope of 
cloud migration and digital transformation, the potential size of the cloud, observability and cloud security markets, gross margins and operating margins including with respect to 
sales and marketing, research and development expenses, capital expenditures and capitalized software, net interest and other income, tax rates and Datadog’s future financial 
performance, including its financial guidance, outlook and goals on slides “Rapid Revenue Growth,” “Financial Outlook,” “Long-Term Margin Goal,” “Capital Allocation Goals,” and 
“Stock-Based Compensation.” These forward-looking statements are based on Datadog’s current assumptions, expectations and beliefs and are subject to substantial risks, 
uncertainties, assumptions and changes in circumstances that may cause Datadog’s actual results, performance or achievements to differ materially from those expressed or implied 
in any forward-looking statement.
The risks and uncertainties referred to above include, but are not limited to (1) our recent rapid growth may not be indicative of our future growth; (2) our history of operating losses; 
(3) our limited operating history; (4) our dependence on existing customers purchasing additional subscriptions and products from us and renewing their subscriptions; (5) our ability 
to attract new customers; (6) our ability to effectively develop and expand our sales and marketing capabilities; (7) risk of a security breach; (8) risk of interruptions or performance 
problems associated with our products and platform capabilities; (9) our ability to adapt and respond to rapidly changing technology or customer needs; (10) the competitive markets 
in which we participate; (11) risks associated with successfully managing our growth and (12) general market, political, economic, and business conditions including concerns about 
reduced economic growth and associated decreases in information technology spending. These risks and uncertainties are more fully described in our filings with the Securities and 
Exchange Commission (SEC), including in the section entitled “Risk Factors” in our Quarterly Report on Form 10-Q for the quarter ended June 30, 2025. Additional information will be 
made available in our other filings and reports that we may file from time to time with the SEC. Moreover, we operate in a very competitive and rapidly changing environment. New risks 
emerge from time to time. It is not possible for our management to predict all risks, nor can we assess the impact of all factors on our business or the extent to which any factor, or 
combination of factors, may cause actual results to differ materially from those contained in any forward-looking statements we may make. In light of these risks, uncertainties and 
assumptions, we cannot guarantee future results, levels of activity, performance, achievements, or events and circumstances reflected in the forward-looking statements will occur. 
Forward-looking statements represent our beliefs and assumptions only as of the date specified or as of this presentation, as applicable. We disclaim any obligation to update 
forward-looking statements.
2
    2/35

    Loading...

    Datadog is the observability 
and security platform for 
cloud applications
    3/35

    Loading...

    Evolving technology paradigms create rising complexity
4
Diversity of technologies in use
Frequency of release
Scale in number of computing units
Number of people involved
    4/35

    Loading...

    Datadog breaks down silos
5
Unified 
platform
Simple but 
not simplistic
Deployed 
everywhere, 
used by 
everyone
Breaking 
down silos
    5/35

    Loading...

    August 2025 Investor Presentation Datadog - Page 6
    6/35

    Loading...

    Our history of innovation
7
    7/35

    Loading...

    8
Our history of innovation
    8/35

    Loading...

    9
 
Log Management
Observability 
Pipelines
Audit Trail
Log Forwarding
Error Tracking
Synthetics
Mobile App Testing
Browser Real User 
Monitoring
Mobile Real User 
Monitoring
Session Replay
Error Tracking
Product Analytics
Shared Platform Services
 Dashboards ● CoScreen ● Teams ● Agent ● OpenTelemetry ● Notebooks ● Software Catalog ● IDE Plugins ● ChatOps ● SLOs ● Case Management
UNIFIED METRICS, LOGS, TRACES, SESSIONS
AI
 Natural Language Querying ● Root Cause Analysis ● Anomaly Detection ● Impact Analysis ● Proactive Alerts ● Autonomous Investigations ● Bits AI 
Infrastructure Applications Digital 
Experience 
Logs Cloud Security Software 
Delivery
Cloud Service 
Management
Datadog Platform
900+ INTEGRATIONS
CI Visibility
Test Optimization
Continuous Testing
Cloud Security 
Code Security
Cloud SIEM
Sensitive 
Data Scanner
Workload Protection
App and API 
Protection
Application 
Performance 
Monitoring
Distributed Tracing
Continuous Profiler 
Database Monitoring
Universal Service 
Monitoring
Data Streams 
Monitoring
Data Jobs 
Monitoring
LLM Observability
Error Tracking
Infrastructure 
Monitoring
Metrics
Cloud Network 
Monitoring
Network Device 
Monitoring
Container Monitoring
Serverless
Cloud Cost 
Management
Cloudcraft
On-Call
Incident 
Management
Event Management
Workflow 
Automation
App Builder
    9/35

    Loading...

    Long-term growth drivers are still in early stages 
Gartner Forecast: Public Cloud Services, Worldwide - 2010-2016, 4Q12 Update; 2011-2017, 4Q13 Update; 2012-2018, 4Q14 Update; 2013-2019, 4Q15 Update; 2014-2020, 4Q16 Update; 
2015-2021, 4Q17 Update; 2016-2022, 4Q18 Update; 2017-2023, 4Q19 Update; 2018-2024, 4Q20 Update; 2019-2025, 4Q21 Update; 2020-2026, 4Q22 Update; 2021-2027, 4Q23 Update; 
2022-2028, 4Q24 Update. 
Gartner Market Databook - 2010-2016, 4Q12 Update; 2011-2017, 4Q13 Update; 2012-2018, 4Q14 Update; 2013-2019, 4Q15 Update; 2014-2020, 4Q16 Update; 2015-2021, 4Q17 Update; 
2016-2022, 4Q18 Update; 2017-2023, 4Q19 Update; 2018-2024, 4Q20 Update; 2019-2025, 4Q21 Update; 2020-2026, 4Q22 Update; 2021-2027, 4Q23 Update, 2022-2028, 4Q24 Update.
Cloud spend continues to grow rapidly
Cloud Spend
Cloud Spend as % 
of Global IT Spend
10
    10/35

    Loading...

    11 Gartner Forecast: Public Cloud Services, Worldwide - 2020-2026, 4Q22 Update; 2021-2027, 4Q23 Update; 2022-2028, 4Q24 Update. 
Gartner Public Cloud Services Market, 2020-2028E
Secular tailwind of digital transformation and cloud migration
20% CAGR The Cloud market is a ~$600B 
market today, growing at a 
20% CAGR through 2028
    11/35

    Loading...

    Large and growing Observability TAM
12 Gartner Forecast: Enterprise Infrastructure Software, Worldwide - 2020-2026, 4Q22 Update; 2021-2027, 4Q23 Update; 2022-2028, 4Q24 Update. 
Gartner IT Operations Market, 2020-2028E
11% CAGR
Our Observability market is 
~$53B today, growing at a 
11% CAGR through 2028
    12/35

    Loading...

    Cloud Security TAM opportunity
13
Gartner Forecast: Information Security and Risk Management, Worldwide - 2020-2026, 4Q22 Update; 2021-2027, 4Q23 Update; 2022-2028, 4Q24 Update. 
Included: Within Application Security: Application Security Testing Software; Vulnerability Assessment Software; Web Application Firewalls Software; within Cloud Security: Cloud Access Security Brokers 
Software; Cloud Workload Protection Platforms; within Data security: Encryption Software; Enterprise Data Loss Prevention Software, Tokenization Software; within Infrastructure Protection: Security 
Information and Event Management (SIEM) Software.
Datadog Cloud Security market, 2020-2028E
Our Cloud Security market is 
~$26B today, growing at a 
16% CAGR through 2028
16% CAGR
    13/35

    Loading...

    Datadog named a 
Leader in the 2025 
Gartner® Magic 
Quadrant™ for 
Observability Platforms
INDUSTRY RECOGNITION
This graphic was published by Gartner, Inc. as part of a larger research document and should be 
evaluated in the context of the entire document. The Gartner document is available upon request from 
Datadog.
Gartner does not endorse any vendor, product or service depicted in its research publications, and does 
not advise technology users to select only those vendors with the highest ratings or other designation. 
Gartner research publications consist of the opinions of Gartner’s research organization and should not 
be construed as statements of fact. Gartner disclaims all warranties, express or implied, with respect to 
this research, including any warranties of merchantability or fitness for a particular purpose.
Gartner and Magic Quadrant are registered trademarks of Gartner, Inc. and/or its affiliates in the U.S. and 
internationally and is used herein with permission. All rights reserved.
14
Source: Gartner, Magic Quadrant for Observability Platforms, Gregg Siegfried, Padraig 
Byrne, Andre Bridges, Martin Caren, 7 July 2025
    14/35

    Loading...

    15
Source: Gartner, Magic Quadrant for Digital Experience Monitoring, Padraig Byrne, Matt 
Crossley, DB Cummings, Martin Caren, Pankaj Prasad, October 2024
Datadog named a 
Leader in the 2024 
Gartner® Magic 
Quadrant™ for Digital 
Experience Monitoring
INDUSTRY RECOGNITION
This graphic was published by Gartner, Inc. as part of a larger research document and should be 
evaluated in the context of the entire document. The Gartner document is available upon request from 
Datadog.
Gartner does not endorse any vendor, product or service depicted in its research publications, and does 
not advise technology users to select only those vendors with the highest ratings or other designation. 
Gartner research publications consist of the opinions of Gartner’s research organization and should not 
be construed as statements of fact. Gartner disclaims all warranties, express or implied, with respect to 
this research, including any warranties of merchantability or fitness for a particular purpose.
Gartner and Magic Quadrant are registered trademarks of Gartner, Inc. and/or its affiliates in the U.S. and 
internationally and is used herein with permission. All rights reserved.
    15/35

    Loading...

    Datadog named a 
Leader in The Forrester 
Wave™: AIOps 
Platforms, Q2 2025
INDUSTRY RECOGNITION
Forrester does not endorse any company, product, brand, or service included in its 
research publications and does not advise any person to select the products or services 
of any company or brand based on the ratings included in such publications. Information 
is based on the best available resources. Opinions reflect judgment at the time and are 
subject to change. For more information, read about Forrester’s objectivity here.
16
    16/35

    Loading...

    Datadog scales across ~31,400 global customers
17
Customers who are transforming Customers who are born in cloud
Trillions
of data points per/hr 
(1) Customers as of June 30, 2025.
    17/35

    Loading...

    Financial overview
    18/35

    Loading...

    Datadog today (1)
FINANCIAL
$3.02B
TTM revenue
+26%
TTM Y/Y growth
23%
TTM non-GAAP operating margin
28%
TTM free cash flow margin
About 120%
Dollar-based TTM net retention rate
$3.9B
Cash, cash equivalents, and marketable 
securities 
CUSTOMERS
~31,400
Total customers
~3,850
$100k+ ARR customers
PLATFORM ADOPTION
83%
Customers using 2+ products
52%
Customers using 4+ products
PEOPLE
~6,500 in 33 
countries(2)
24 PRODUCTS IN AN INTEGRATED DATA PLATFORM
29%
Customers using 6+ products
(1) All data as of June 30, 2025. Non-GAAP operating margin and free cash flow margin are non-GAAP measures. See Appendix for a reconciliation to financial results prepared in accordance with GAAP. 
(2) Employee headcount as of December 31, 2024. 19
14%
Customers using 8+ products
Observability
● Infra Monitoring
● Application Performance 
Monitoring
● Log Management
● Continuous Profiler
● Synthetic Monitoring
● Real User Monitoring
● Network Monitoring
● Database Monitoring
● Data Observability
● Error Tracking
● Observability Pipelines
● LLM Observability
● Cloud Cost Mgmt
Security
● Cloud Security 
Management
● Code Security
● Threat Mgmt
● Cloud SIEM
● Sensitive Data 
Scanner
Product Analytics
● OnCall ● Product Analytics
● Incident Mgmt
Cloud Service Management
● Event Mgmt
● Workflow Automation
We were named a Leader in 
the Gartner® Magic 
Quadrants for Observability 
Platforms (2025) and 
Digital Experience 
Monitoring (2024)
Software Delivery
● CI Visibility
    19/35

    Loading...

    Our growth drivers
1
2
3
4
Secular tailwind of digital transformation and cloud migration
Increased penetration of cloud and next-gen DevOps customers
Expanding products / use cases for customers
Adding new markets beyond observability
20
    20/35

    Loading...

    Rapid revenue growth
(1) Guided revenues are forward-looking statements as of August 7, 2025.  See Safe Harbor for important information about these assumptions and forward-looking statements.  21
Quarterly revenue
$M’s
Annual revenue
$M’s
41%
CAGR
Guided (1)
3,312-3,322
Guided (1)
847-851
    21/35

    Loading...

    Strong customer growth
22
Total customers
    22/35

    Loading...

    Strong customer growth
23
# of customers with ARR $1M+ # of customers with ARR $100K+
See our Quarterly Report on Form 10-Q for the quarter ended June 30, 2025 for the definition of ARR.
% of total ARR
78% 83% 85% 86% 88% 87% 89%
    23/35

    Loading...

    Platform strategy is resonating with customers
24
% of customers using 
2+ products
% of customers using 
4+ products
% of customers using 
6+ products
% of customers using 
8+ products
    24/35

    Loading...

    Strong retention and upsell
25
Mid-to-high 
90%s
Dollar-based 
gross retention rate
About
120%
Dollar-based 
net retention rate
As of June 30, 2025. See Appendix for more information regarding gross retention rate and net retention rate.
    25/35

    Loading...

    FY20 FY21 FY22 FY23 FY24 TTM (Jun-25)
Revenue $ 603M $1,029M $1,675M $2,128M $2,684M $3,016M
% Y/Y growth 66% 70% 63% 27% 26% 26%
Gross margin(1) 79% 78% 80% 82% 82% 81%
Research & development 
margin(1) 29% 30% 30% 30% 28% 30%
Sales & marketing margin(1) 31% 25% 25% 24% 23% 23%
General & administrative 
margin(1) 8% 7% 6% 6% 5% 5%
Operating profit(1) $64M $165M $326M $490M $674M $683M
Operating margin(1) 11% 16% 19% 23% 25% 23%
Free cash flow(1) $83M $251M $354M $598M $775M $854M
Free cash flow margin(1) 14% 24% 21% 28% 29% 28%
Financial summary
(1) Non-GAAP measures. See Appendix for a reconciliation of these non-GAAP measures to the most directly comparable GAAP measures. 26
    26/35

    Loading...

    Financial outlook (as of August 7, 2025) (1)
(1) Financial outlook are forward-looking statements.  See Safe Harbor for important information about these assumptions and forward-looking statements. 27
(2) See Appendix for information about these non-GAAP measures.
3Q25 FY25
Revenue $847-851M $3,312-3,322M
Non-GAAP operating income (2) $176-180M $684-694M
Non-GAAP EPS (2) $0.44-0.46 $1.80-1.83
Weighted average diluted shares Approx. 364M Approx. 364M
    27/35

    Loading...

    Long-term margin goal
(1) Non-GAAP measures. See Appendix for a reconciliation of these non-GAAP measures to the most directly comparable GAAP measures.
Operating Margin Goal is a forward-looking statement and speaks as of our Investor Day on February 15, 2024. See Safe Harbor for important information about these assumptions and 
forward-looking statements.
Non-GAAP % (1) 2019 2020 2021 2022 2023 2024 Goal 
Operating Margin -1% 11% 16% 19% 23% 25% 25%+
Free Cash Flow 
Margin 0% 14% 24% 21% 28% 29%
28
    28/35

    Loading...

    Capital allocation goals
Ensure our leadership has flexibility and 
capacity to invest
Generate healthy amounts of FCF
Maintain our thoughtful and disciplined 
acquisition strategy
29
    29/35

    Loading...

    Stock-based 
compensation
Target annual dilution related to 
RSUs/PSUs awarded
2019 2020 2021 2022 2023 2024
RSU/PSU shares 
awarded (M’s) 0.6 4.9 5.2 7.6 7.4 7.0
% dilution on BoP 
basic shares 1.6% 1.7% 2.4% 2.3% 2.1%
Target annual dilution is a forward-looking statement and speaks as of our Investor Day on February 15, 2024. See Safe Harbor for 
important information about these assumptions and forward-looking statements. 30
    30/35

    Loading...

    Appendix
    31/35

    Loading...

    Non-GAAP financial measures and other 
information
The statistical data, estimates and forecasts referenced in this presentation and the accompanying oral presentation are based on independent industry publications or other publicly available information, as well as information 
based on our internal sources. While we believe the industry and market data included in this this presentation and the accompanying oral presentation are reliable and are based on reasonable assumptions, these data involve 
many assumptions and limitations, and you are cautioned not to give undue weight to these estimates. We have not independently verified the accuracy or completeness of the data contained in these industry publications and 
other publicly available information. 
We define the number of customers as the number of accounts with a unique account identifier for which we have an active subscription in the period indicated. Users of our free trials or tier are not included in our customer count. 
A single organization with multiple divisions, segments or subsidiaries is generally counted as a single customer. However, in some cases where they have separate billing terms, we may count separate divisions, segments or 
subsidiaries as multiple customers. Customers as of December 31, 2022 exclude customers from a then-recent acquisition, which did not contribute meaningful revenue during the fiscal year. Other terms such as annual recurring 
revenue or ARR and dollar-based net revenue retention rate shall have the meanings set forth in our Annual Report. Dollar-based gross retention rate is calculated by first calculating the point-in-time gross retention as the previous 
year ARR minus ARR attrition over the last 12 months, divided by the previous year ARR. The ARR attrition for each month is calculated by identifying any customer that has changed their account type to a “free tier,” requested a 
downgrade through customer support or sent a formal termination notice to us during that month, and aggregating the dollars of ARR generated by each such customer in the prior month. We then calculate the dollar-based gross 
retention rate as the weighted average of the trailing 12-month point-in-time gross retention rates. We believe dollar-based gross retention rate demonstrates the stickiness of the product category we operate in, and of our platform 
in particular.
Non-GAAP Financial Measures
Datadog discloses the following non-GAAP financial measures in this presentation and the accompanying oral presentation: non-GAAP gross profit, non-GAAP gross margin, non-GAAP operating expenses (sales and marketing, 
research and development, general and administrative), non-GAAP operating income (loss), non-GAAP operating margin, non-GAAP net income (loss), non-GAAP net income (loss) per diluted share, non-GAAP net income (loss) per 
basic share, free cash flow and free cash flow margin. Datadog uses each of these non-GAAP financial measures internally to understand and compare operating results across accounting periods, for internal budgeting and 
forecasting purposes, for short- and long-term operating plans, and to evaluate Datadog’s financial performance. Datadog believes they are useful to investors, as a supplement to GAAP measures, in evaluating its operational 
performance, as further discussed below. Datadog’s non-GAAP financial measures may not provide information that is directly comparable to that provided by other companies in its industry, as other companies in its industry may 
calculate non-GAAP financial results differently, particularly related to non-recurring and unusual items. In addition, there are limitations in using non-GAAP financial measures because the non-GAAP financial measures are not 
prepared in accordance with GAAP and may be different from non-GAAP financial measures used by other companies and exclude expenses that may have a material impact on Datadog’s reported financial results.
Non-GAAP financial measures should not be considered in isolation from, or as a substitute for, financial information prepared in accordance with GAAP. A reconciliation of the historical non-GAAP financial measures to their most 
directly comparable GAAP measures has been provided in this Appendix.
Datadog defines non-GAAP gross profit, non-GAAP gross margin, non-GAAP operating expenses (sales and marketing, research and development, general and administrative), non-GAAP operating income (loss), non-GAAP 
operating margin and non-GAAP net income (loss) as the respective GAAP balances, adjusted for, as applicable: (1) stock-based compensation expense; (2) the amortization of acquired intangibles; (3) employer payroll taxes on 
employee stock transactions; (4) M&A transaction costs; (5) amortization of issuance costs; and (6) an assumed provision for income taxes based on our long-term projected tax rate. Non-GAAP financial measures prior to April 1, 
2025 have not been adjusted for M&A transaction costs, as such costs were not material to our results of operations in such prior periods. Our estimated long-term projected tax rate is subject to change for a variety of reasons, 
including the rapidly evolving global tax environment, significant changes in Datadog's geographic earnings mix, or other changes to our strategy or business operations. We will re-evaluate our long-term projected tax rate as 
appropriate. Datadog defines free cash flow as net cash provided by operating activities, minus capital expenditures and minus capitalized software development costs. Investors are encouraged to review the reconciliation of 
these historical non-GAAP financial measures to their most directly comparable GAAP financial measures.
Datadog has not reconciled its expectations as to non-GAAP operating income, or as to non-GAAP net income per share, to their most directly comparable GAAP measure as a result of uncertainty regarding, and the potential 
variability of, reconciling items such as stock-based compensation and employer payroll taxes on equity incentive plans. Accordingly, reconciliation is not available without unreasonable effort, although it is important to note that 
these factors could be material to Datadog’s results computed in accordance with GAAP.
32
    32/35

    Loading...

    GAAP to Non-GAAP reconciliation
33
Gross profit margin ($000’s)
    33/35

    Loading...

    GAAP to Non-GAAP reconciliation
34
Operating expenses and operating profit ($000’s)
    34/35

    Loading...

    Free cash flow bridge
35
Free cash flow ($000’s)
    35/35

    August 2025 Investor Presentation Datadog

    • 1. August 2025 Investor Presentation DATADOG
    • 2. Safe harbor This presentation and the accompanying oral presentation have been prepared by Datadog, Inc. (“Datadog” or the “company”) for informational purposes only and not for any other purpose. Nothing contained in this presentation is, or should be construed as, a recommendation, promise or representation by the presenter or Datadog or any officer, director, employee, agent or advisor of Datadog. This presentation does not purport to be all-inclusive or to contain all of the information you may desire. Information provided in this presentation speaks only as of the date hereof, unless otherwise indicated. This presentation and accompanying oral presentation contain “forward-looking” statements, as that term is defined under the federal securities laws, including but not limited to statements regarding Datadog’s strategy, product and platform capabilities, the growth in and ability to capitalize on long-term market opportunities including the pace and scope of cloud migration and digital transformation, the potential size of the cloud, observability and cloud security markets, gross margins and operating margins including with respect to sales and marketing, research and development expenses, capital expenditures and capitalized software, net interest and other income, tax rates and Datadog’s future financial performance, including its financial guidance, outlook and goals on slides “Rapid Revenue Growth,” “Financial Outlook,” “Long-Term Margin Goal,” “Capital Allocation Goals,” and “Stock-Based Compensation.” These forward-looking statements are based on Datadog’s current assumptions, expectations and beliefs and are subject to substantial risks, uncertainties, assumptions and changes in circumstances that may cause Datadog’s actual results, performance or achievements to differ materially from those expressed or implied in any forward-looking statement. The risks and uncertainties referred to above include, but are not limited to (1) our recent rapid growth may not be indicative of our future growth; (2) our history of operating losses; (3) our limited operating history; (4) our dependence on existing customers purchasing additional subscriptions and products from us and renewing their subscriptions; (5) our ability to attract new customers; (6) our ability to effectively develop and expand our sales and marketing capabilities; (7) risk of a security breach; (8) risk of interruptions or performance problems associated with our products and platform capabilities; (9) our ability to adapt and respond to rapidly changing technology or customer needs; (10) the competitive markets in which we participate; (11) risks associated with successfully managing our growth and (12) general market, political, economic, and business conditions including concerns about reduced economic growth and associated decreases in information technology spending. These risks and uncertainties are more fully described in our filings with the Securities and Exchange Commission (SEC), including in the section entitled “Risk Factors” in our Quarterly Report on Form 10-Q for the quarter ended June 30, 2025. Additional information will be made available in our other filings and reports that we may file from time to time with the SEC. Moreover, we operate in a very competitive and rapidly changing environment. New risks emerge from time to time. It is not possible for our management to predict all risks, nor can we assess the impact of all factors on our business or the extent to which any factor, or combination of factors, may cause actual results to differ materially from those contained in any forward-looking statements we may make. In light of these risks, uncertainties and assumptions, we cannot guarantee future results, levels of activity, performance, achievements, or events and circumstances reflected in the forward-looking statements will occur. Forward-looking statements represent our beliefs and assumptions only as of the date specified or as of this presentation, as applicable. We disclaim any obligation to update forward-looking statements. 2
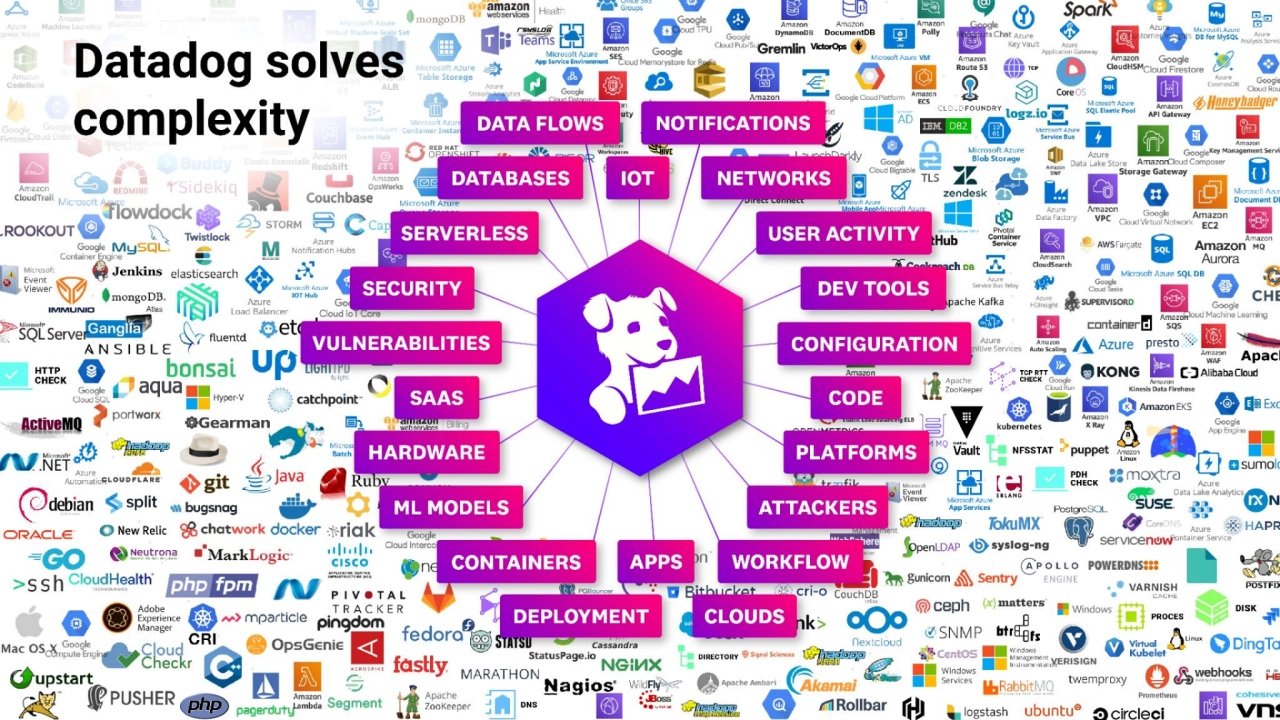
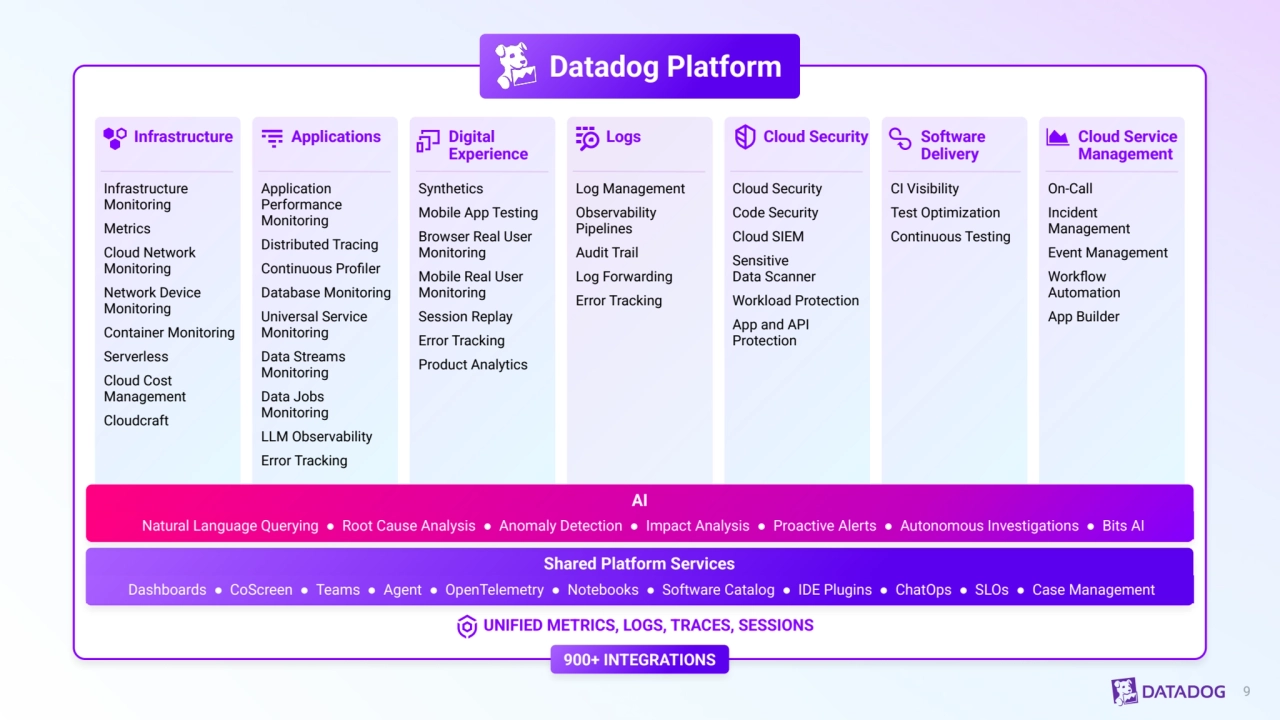
    • 3. Datadog is the observability and security platform for cloud applications
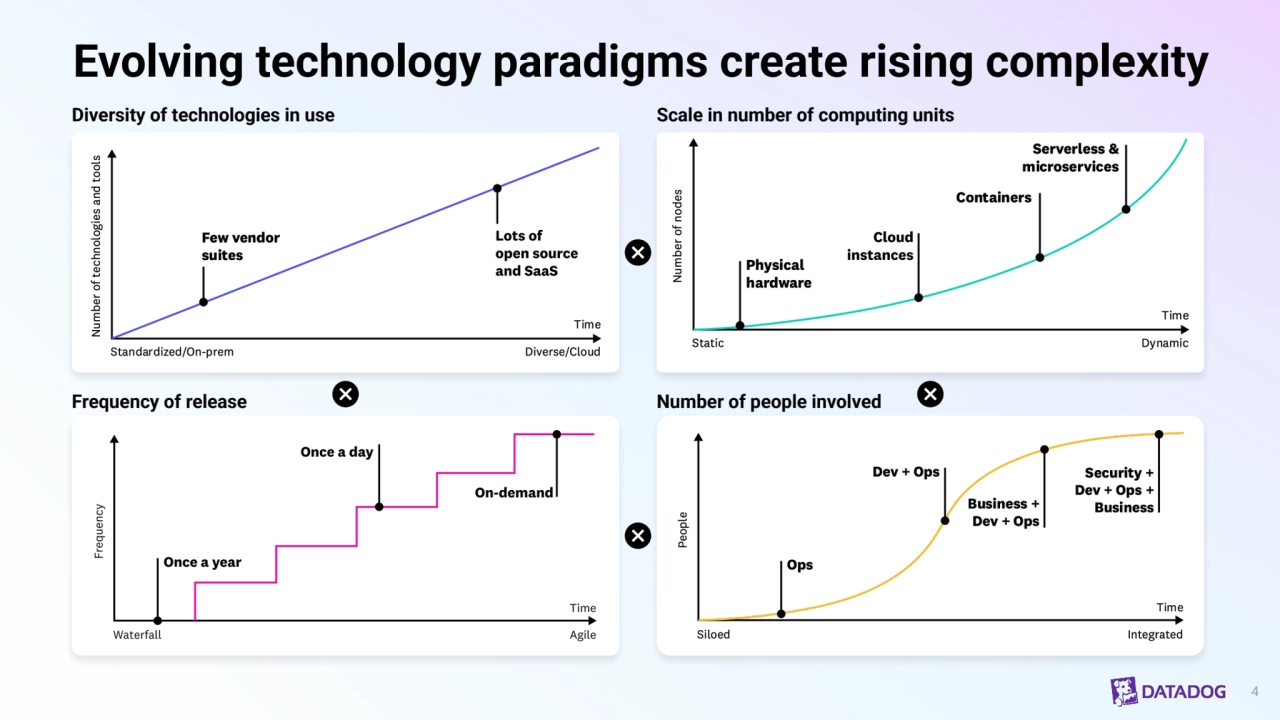
    • 4. Evolving technology paradigms create rising complexity 4 Diversity of technologies in use Frequency of release Scale in number of computing units Number of people involved
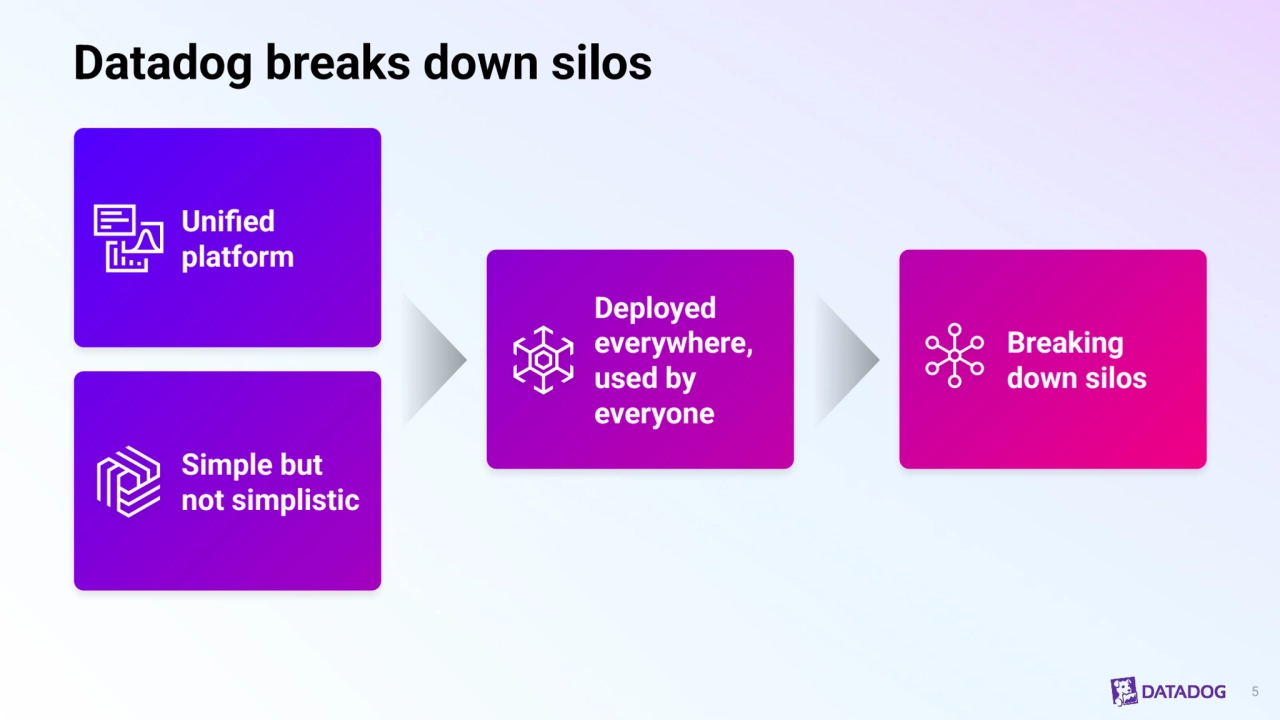
    • 5. Datadog breaks down silos 5 Unified platform Simple but not simplistic Deployed everywhere, used by everyone Breaking down silos
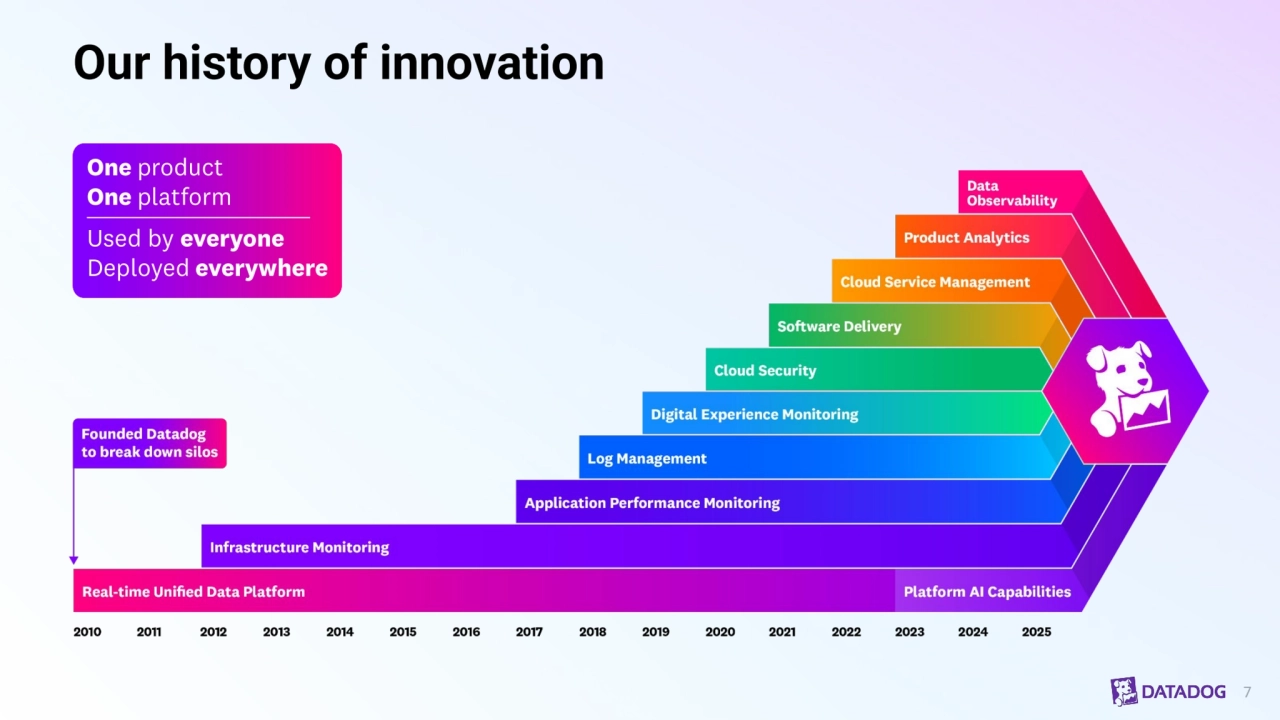
    • 7. Our history of innovation 7
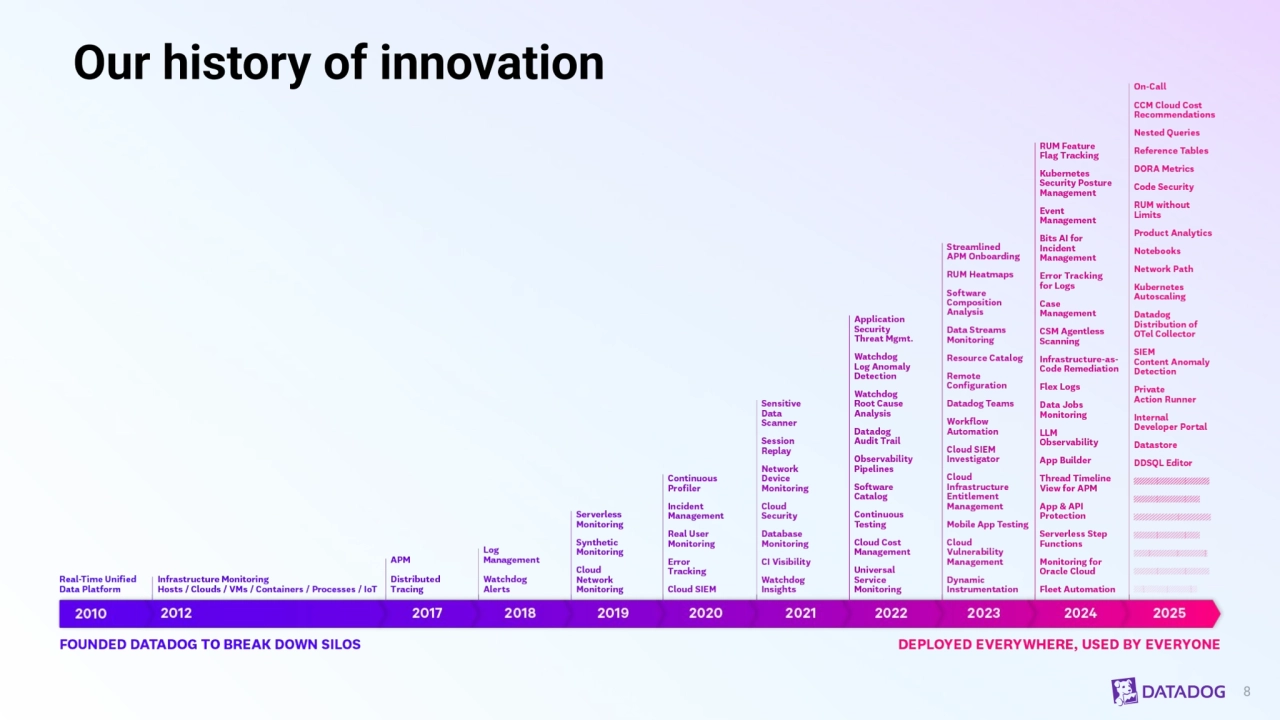
    • 8. 8 Our history of innovation
    • 9. 9 Log Management Observability Pipelines Audit Trail Log Forwarding Error Tracking Synthetics Mobile App Testing Browser Real User Monitoring Mobile Real User Monitoring Session Replay Error Tracking Product Analytics Shared Platform Services Dashboards ● CoScreen ● Teams ● Agent ● OpenTelemetry ● Notebooks ● Software Catalog ● IDE Plugins ● ChatOps ● SLOs ● Case Management UNIFIED METRICS, LOGS, TRACES, SESSIONS AI Natural Language Querying ● Root Cause Analysis ● Anomaly Detection ● Impact Analysis ● Proactive Alerts ● Autonomous Investigations ● Bits AI Infrastructure Applications Digital Experience Logs Cloud Security Software Delivery Cloud Service Management Datadog Platform 900+ INTEGRATIONS CI Visibility Test Optimization Continuous Testing Cloud Security Code Security Cloud SIEM Sensitive Data Scanner Workload Protection App and API Protection Application Performance Monitoring Distributed Tracing Continuous Profiler Database Monitoring Universal Service Monitoring Data Streams Monitoring Data Jobs Monitoring LLM Observability Error Tracking Infrastructure Monitoring Metrics Cloud Network Monitoring Network Device Monitoring Container Monitoring Serverless Cloud Cost Management Cloudcraft On-Call Incident Management Event Management Workflow Automation App Builder
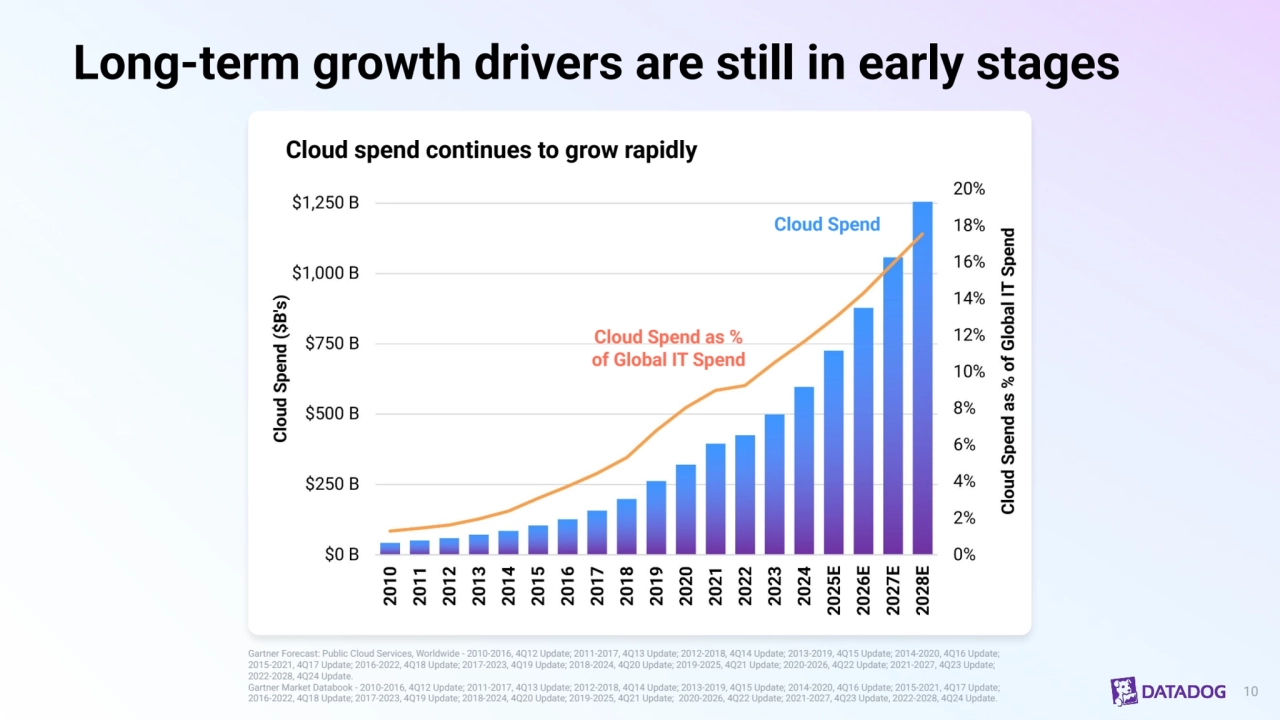
    • 10. Long-term growth drivers are still in early stages Gartner Forecast: Public Cloud Services, Worldwide - 2010-2016, 4Q12 Update; 2011-2017, 4Q13 Update; 2012-2018, 4Q14 Update; 2013-2019, 4Q15 Update; 2014-2020, 4Q16 Update; 2015-2021, 4Q17 Update; 2016-2022, 4Q18 Update; 2017-2023, 4Q19 Update; 2018-2024, 4Q20 Update; 2019-2025, 4Q21 Update; 2020-2026, 4Q22 Update; 2021-2027, 4Q23 Update; 2022-2028, 4Q24 Update. Gartner Market Databook - 2010-2016, 4Q12 Update; 2011-2017, 4Q13 Update; 2012-2018, 4Q14 Update; 2013-2019, 4Q15 Update; 2014-2020, 4Q16 Update; 2015-2021, 4Q17 Update; 2016-2022, 4Q18 Update; 2017-2023, 4Q19 Update; 2018-2024, 4Q20 Update; 2019-2025, 4Q21 Update; 2020-2026, 4Q22 Update; 2021-2027, 4Q23 Update, 2022-2028, 4Q24 Update. Cloud spend continues to grow rapidly Cloud Spend Cloud Spend as % of Global IT Spend 10
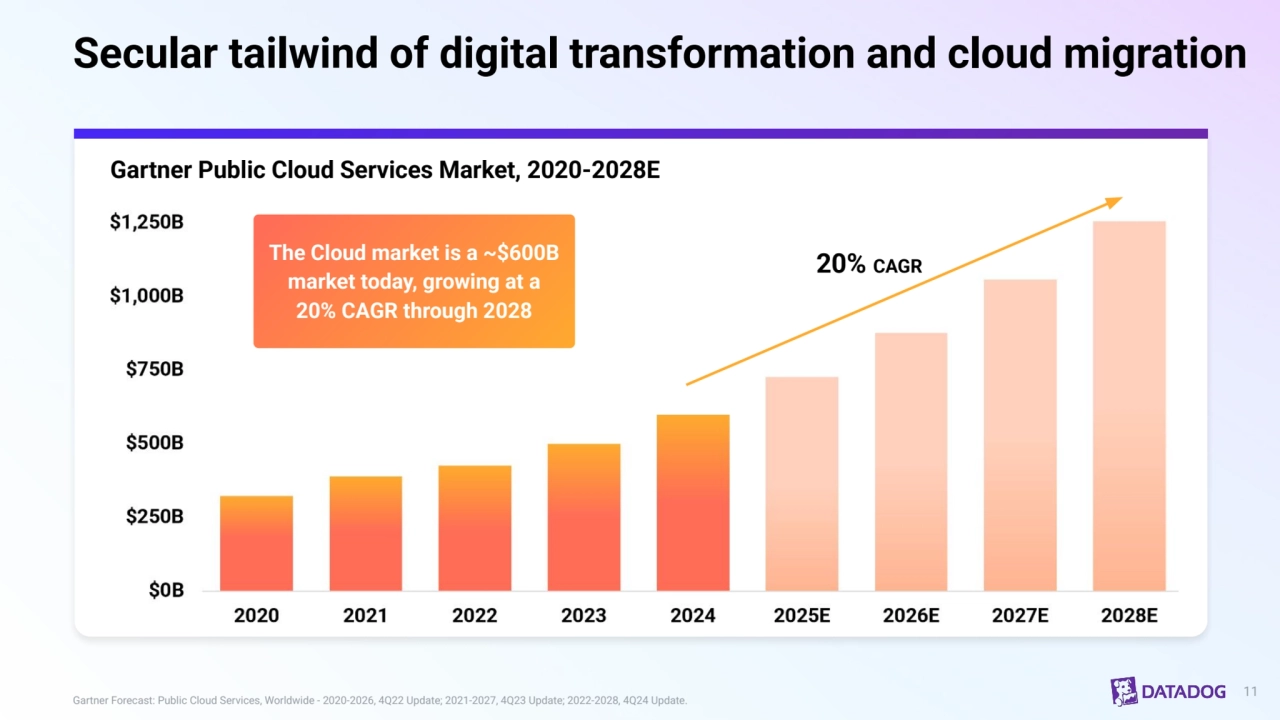
    • 11. 11 Gartner Forecast: Public Cloud Services, Worldwide - 2020-2026, 4Q22 Update; 2021-2027, 4Q23 Update; 2022-2028, 4Q24 Update. Gartner Public Cloud Services Market, 2020-2028E Secular tailwind of digital transformation and cloud migration 20% CAGR The Cloud market is a ~$600B market today, growing at a 20% CAGR through 2028
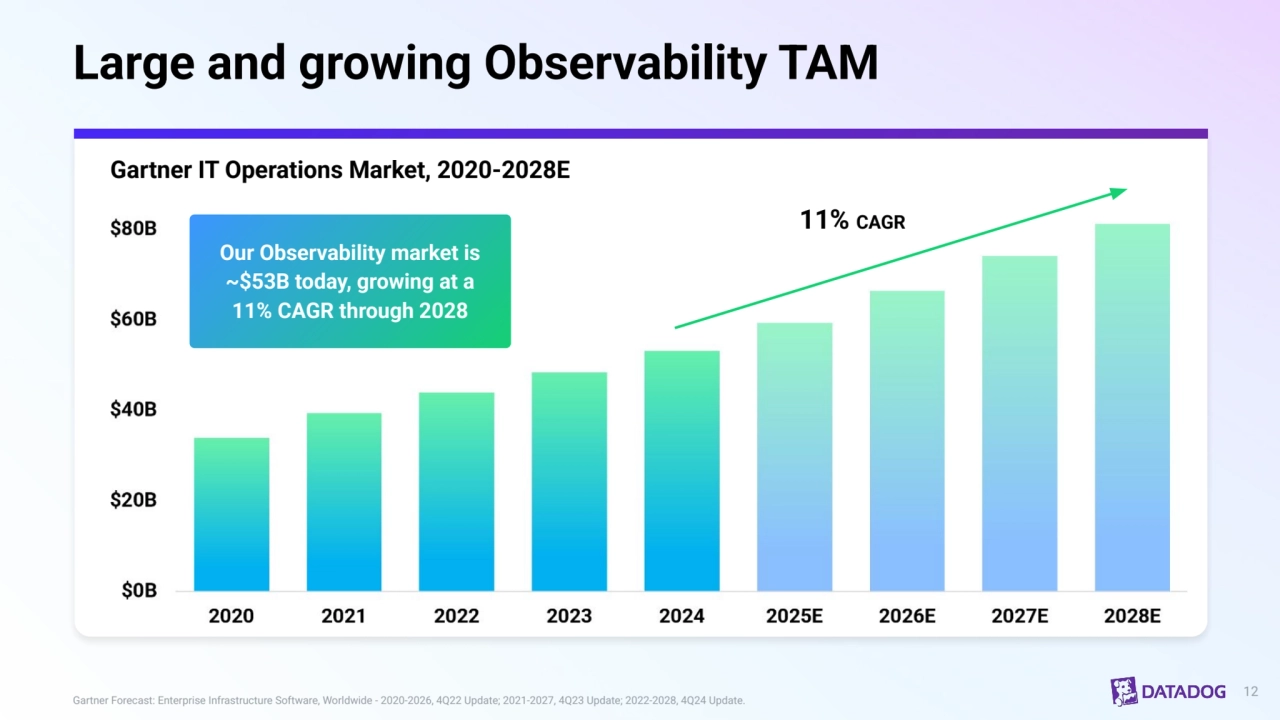
    • 12. Large and growing Observability TAM 12 Gartner Forecast: Enterprise Infrastructure Software, Worldwide - 2020-2026, 4Q22 Update; 2021-2027, 4Q23 Update; 2022-2028, 4Q24 Update. Gartner IT Operations Market, 2020-2028E 11% CAGR Our Observability market is ~$53B today, growing at a 11% CAGR through 2028
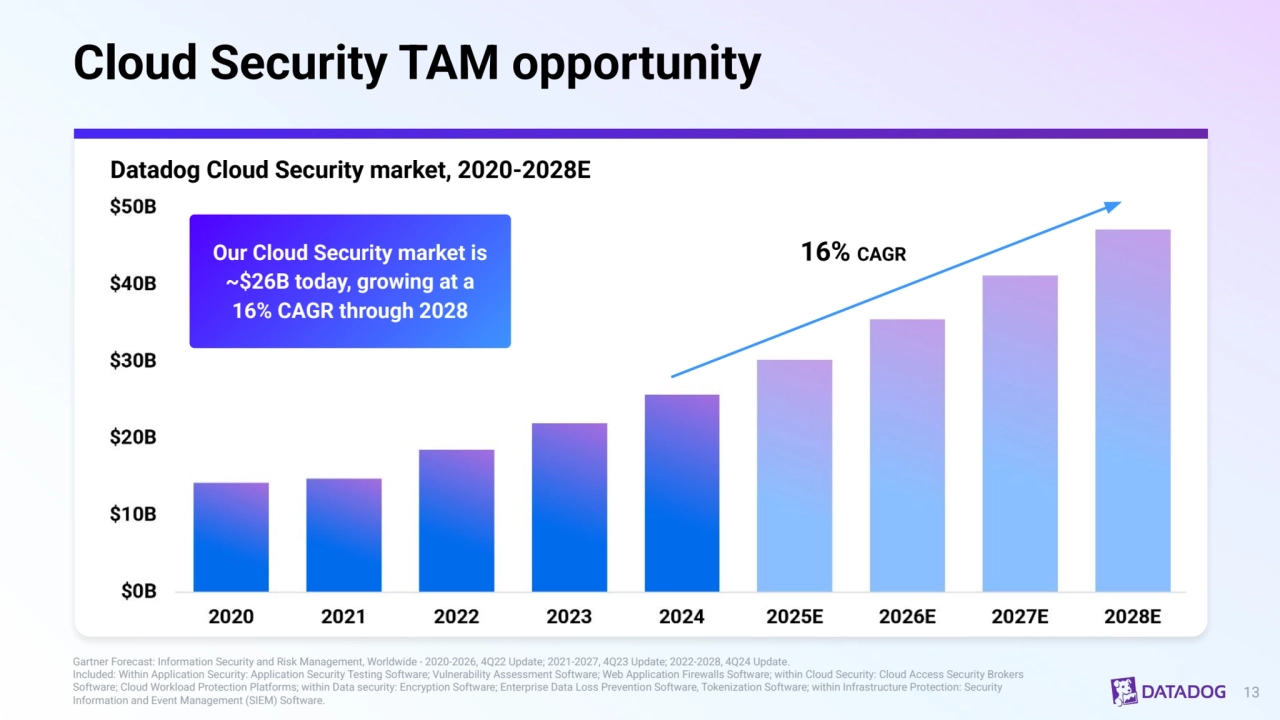
    • 13. Cloud Security TAM opportunity 13 Gartner Forecast: Information Security and Risk Management, Worldwide - 2020-2026, 4Q22 Update; 2021-2027, 4Q23 Update; 2022-2028, 4Q24 Update. Included: Within Application Security: Application Security Testing Software; Vulnerability Assessment Software; Web Application Firewalls Software; within Cloud Security: Cloud Access Security Brokers Software; Cloud Workload Protection Platforms; within Data security: Encryption Software; Enterprise Data Loss Prevention Software, Tokenization Software; within Infrastructure Protection: Security Information and Event Management (SIEM) Software. Datadog Cloud Security market, 2020-2028E Our Cloud Security market is ~$26B today, growing at a 16% CAGR through 2028 16% CAGR
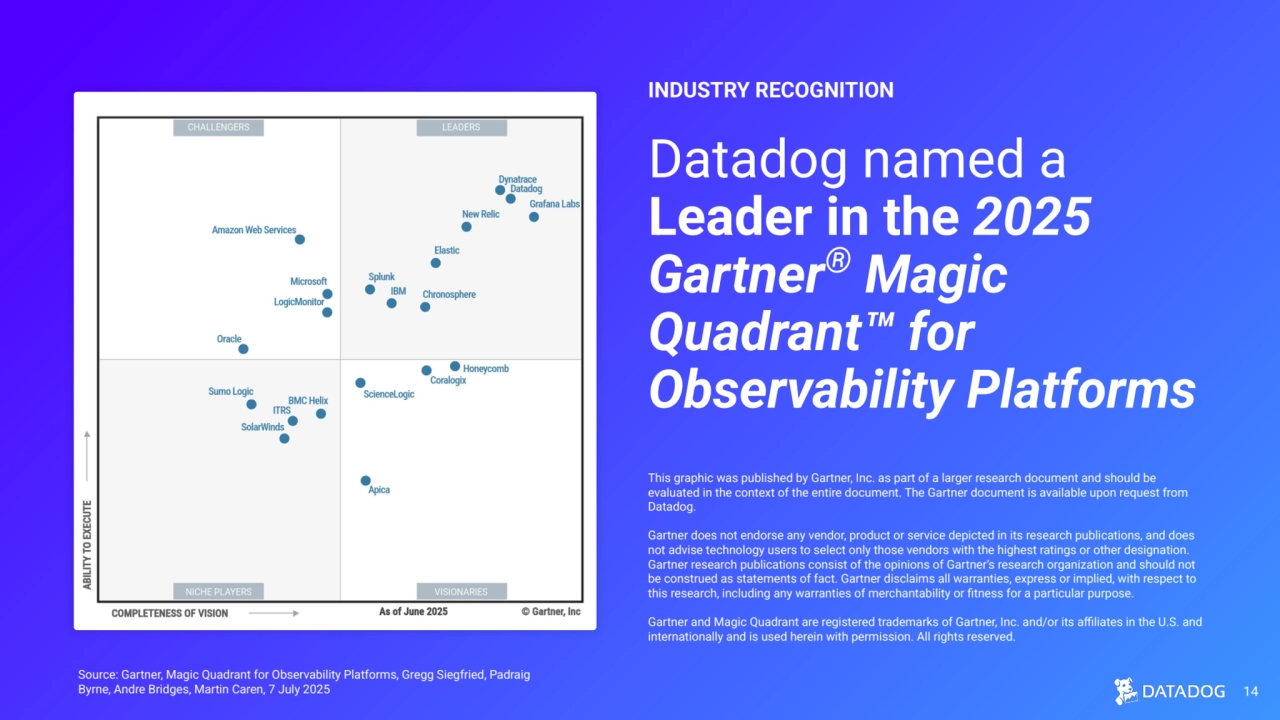
    • 14. Datadog named a Leader in the 2025 Gartner® Magic Quadrant™ for Observability Platforms INDUSTRY RECOGNITION This graphic was published by Gartner, Inc. as part of a larger research document and should be evaluated in the context of the entire document. The Gartner document is available upon request from Datadog. Gartner does not endorse any vendor, product or service depicted in its research publications, and does not advise technology users to select only those vendors with the highest ratings or other designation. Gartner research publications consist of the opinions of Gartner’s research organization and should not be construed as statements of fact. Gartner disclaims all warranties, express or implied, with respect to this research, including any warranties of merchantability or fitness for a particular purpose. Gartner and Magic Quadrant are registered trademarks of Gartner, Inc. and/or its affiliates in the U.S. and internationally and is used herein with permission. All rights reserved. 14 Source: Gartner, Magic Quadrant for Observability Platforms, Gregg Siegfried, Padraig Byrne, Andre Bridges, Martin Caren, 7 July 2025
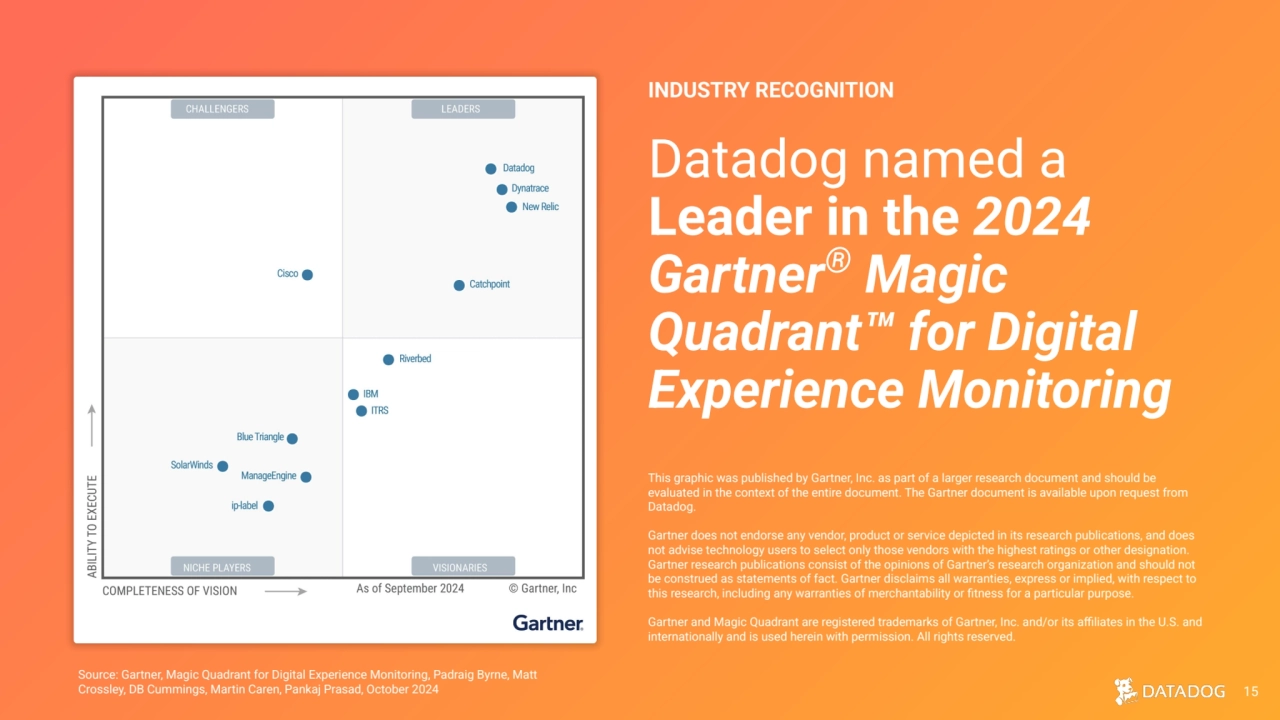
    • 15. 15 Source: Gartner, Magic Quadrant for Digital Experience Monitoring, Padraig Byrne, Matt Crossley, DB Cummings, Martin Caren, Pankaj Prasad, October 2024 Datadog named a Leader in the 2024 Gartner® Magic Quadrant™ for Digital Experience Monitoring INDUSTRY RECOGNITION This graphic was published by Gartner, Inc. as part of a larger research document and should be evaluated in the context of the entire document. The Gartner document is available upon request from Datadog. Gartner does not endorse any vendor, product or service depicted in its research publications, and does not advise technology users to select only those vendors with the highest ratings or other designation. Gartner research publications consist of the opinions of Gartner’s research organization and should not be construed as statements of fact. Gartner disclaims all warranties, express or implied, with respect to this research, including any warranties of merchantability or fitness for a particular purpose. Gartner and Magic Quadrant are registered trademarks of Gartner, Inc. and/or its affiliates in the U.S. and internationally and is used herein with permission. All rights reserved.
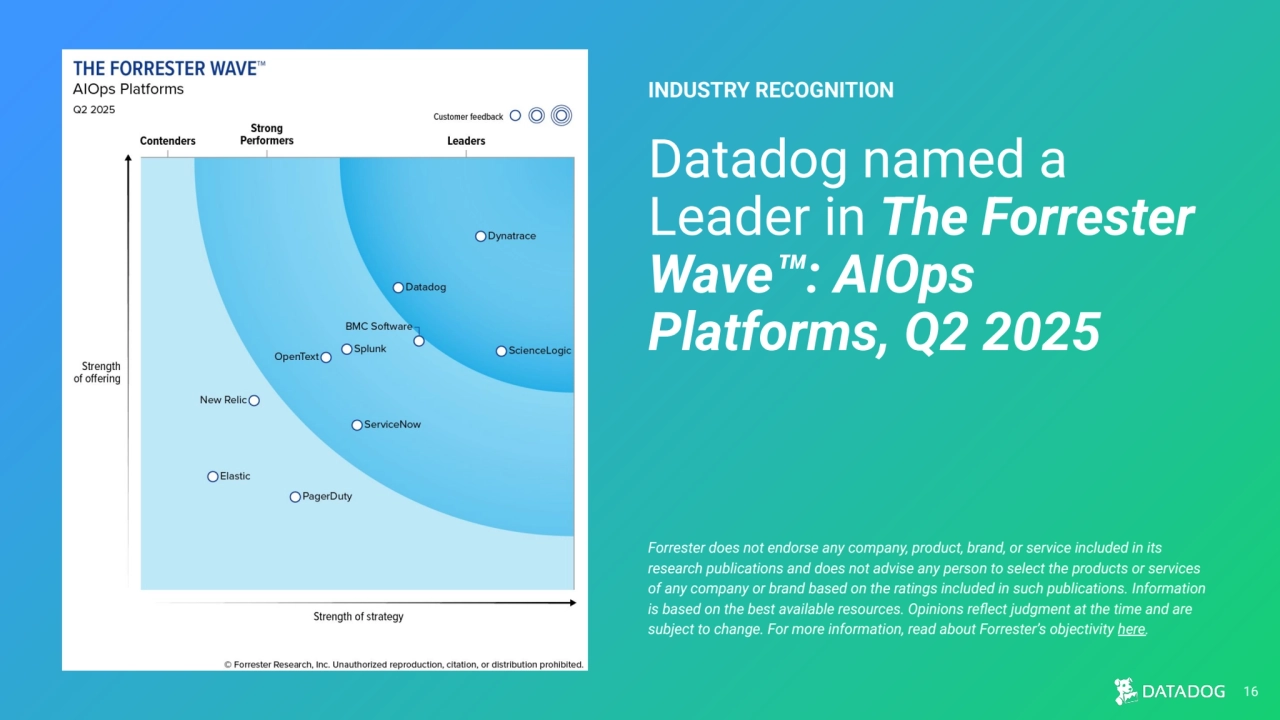
    • 16. Datadog named a Leader in The Forrester Wave™: AIOps Platforms, Q2 2025 INDUSTRY RECOGNITION Forrester does not endorse any company, product, brand, or service included in its research publications and does not advise any person to select the products or services of any company or brand based on the ratings included in such publications. Information is based on the best available resources. Opinions reflect judgment at the time and are subject to change. For more information, read about Forrester’s objectivity here. 16
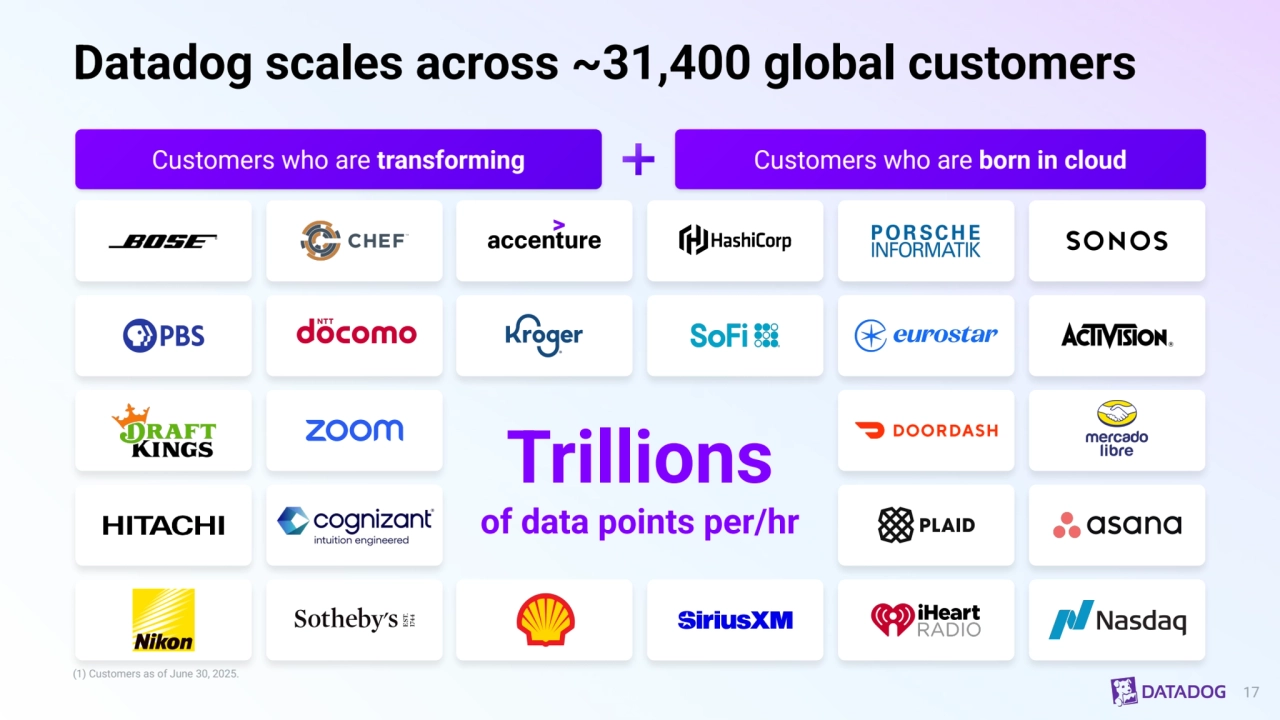
    • 17. Datadog scales across ~31,400 global customers 17 Customers who are transforming Customers who are born in cloud Trillions of data points per/hr (1) Customers as of June 30, 2025.
    • 18. Financial overview
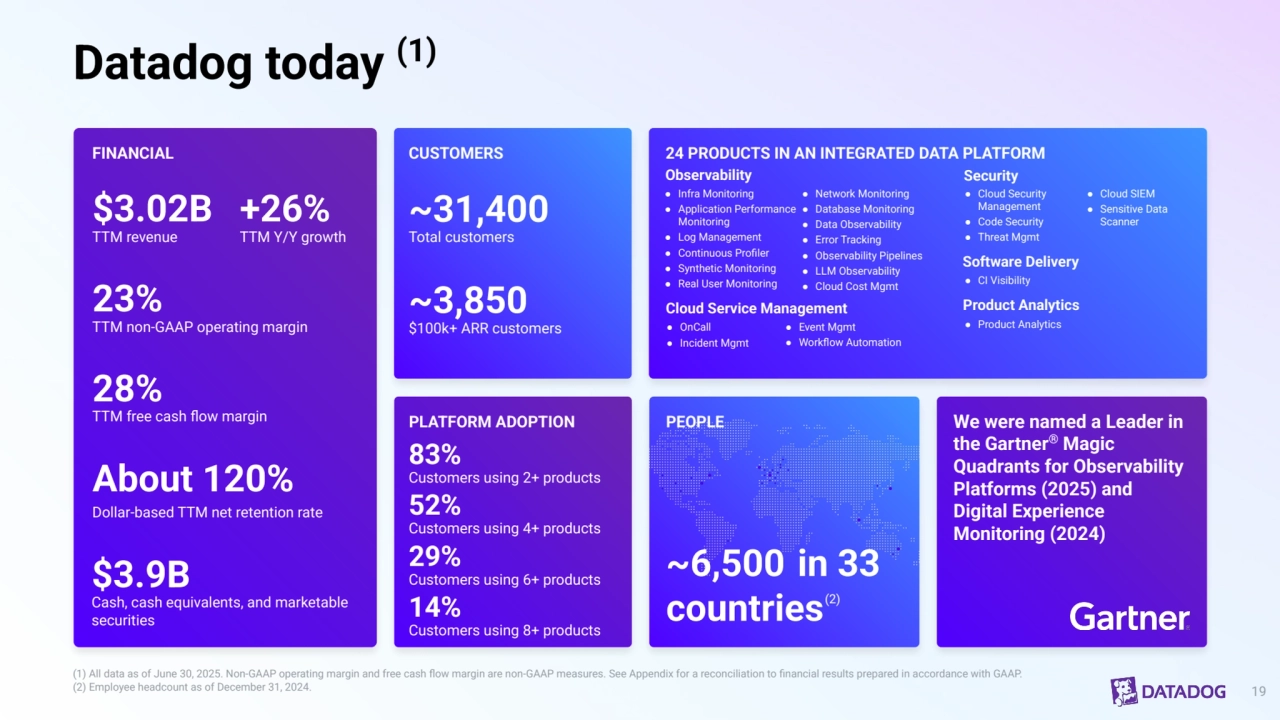
    • 19. Datadog today (1) FINANCIAL $3.02B TTM revenue +26% TTM Y/Y growth 23% TTM non-GAAP operating margin 28% TTM free cash flow margin About 120% Dollar-based TTM net retention rate $3.9B Cash, cash equivalents, and marketable securities CUSTOMERS ~31,400 Total customers ~3,850 $100k+ ARR customers PLATFORM ADOPTION 83% Customers using 2+ products 52% Customers using 4+ products PEOPLE ~6,500 in 33 countries(2) 24 PRODUCTS IN AN INTEGRATED DATA PLATFORM 29% Customers using 6+ products (1) All data as of June 30, 2025. Non-GAAP operating margin and free cash flow margin are non-GAAP measures. See Appendix for a reconciliation to financial results prepared in accordance with GAAP.  (2) Employee headcount as of December 31, 2024. 19 14% Customers using 8+ products Observability ● Infra Monitoring ● Application Performance Monitoring ● Log Management ● Continuous Profiler ● Synthetic Monitoring ● Real User Monitoring ● Network Monitoring ● Database Monitoring ● Data Observability ● Error Tracking ● Observability Pipelines ● LLM Observability ● Cloud Cost Mgmt Security ● Cloud Security Management ● Code Security ● Threat Mgmt ● Cloud SIEM ● Sensitive Data Scanner Product Analytics ● OnCall ● Product Analytics ● Incident Mgmt Cloud Service Management ● Event Mgmt ● Workflow Automation We were named a Leader in the Gartner® Magic Quadrants for Observability Platforms (2025) and Digital Experience Monitoring (2024) Software Delivery ● CI Visibility
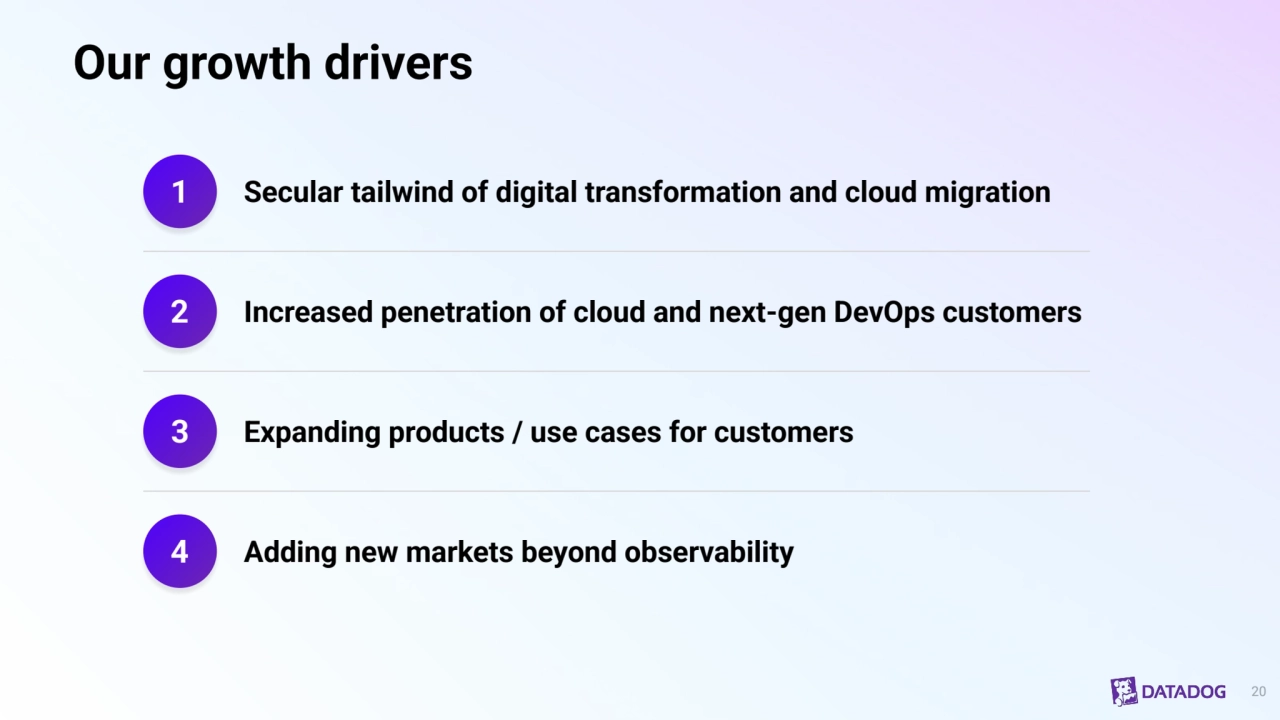
    • 20. Our growth drivers 1 2 3 4 Secular tailwind of digital transformation and cloud migration Increased penetration of cloud and next-gen DevOps customers Expanding products / use cases for customers Adding new markets beyond observability 20
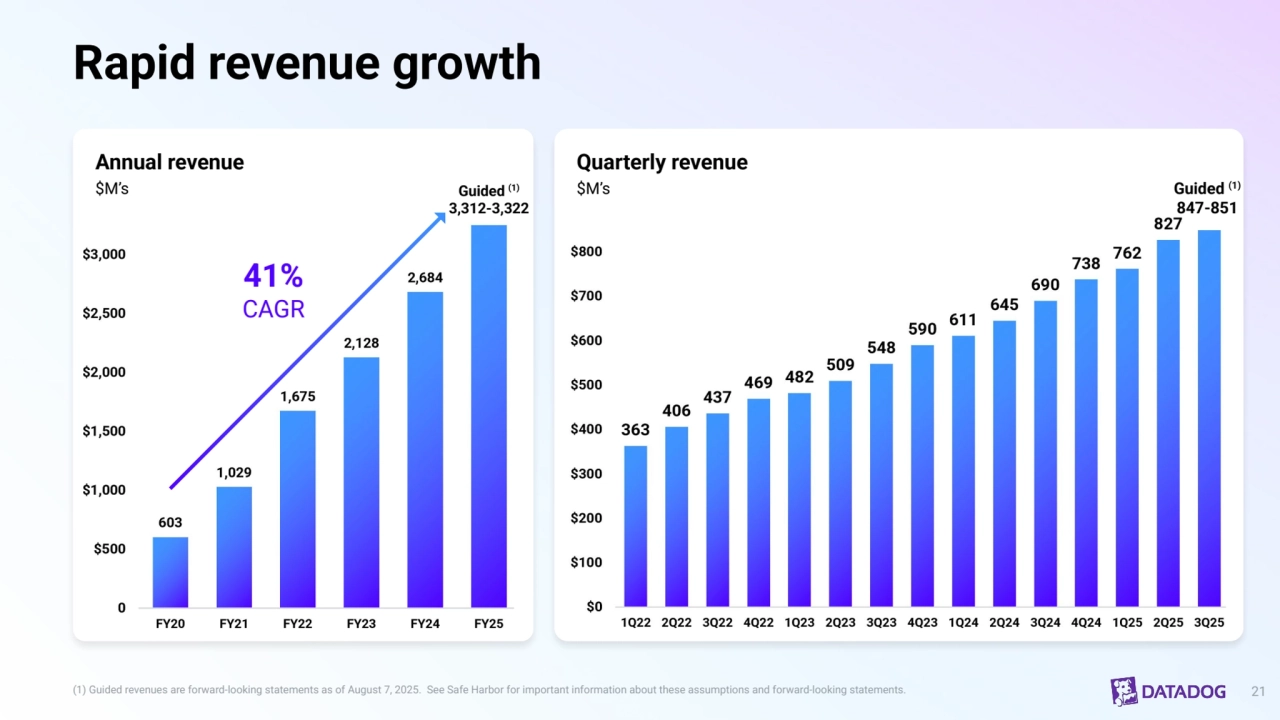
    • 21. Rapid revenue growth (1) Guided revenues are forward-looking statements as of August 7, 2025.  See Safe Harbor for important information about these assumptions and forward-looking statements.  21 Quarterly revenue $M’s Annual revenue $M’s 41% CAGR Guided (1) 3,312-3,322 Guided (1) 847-851
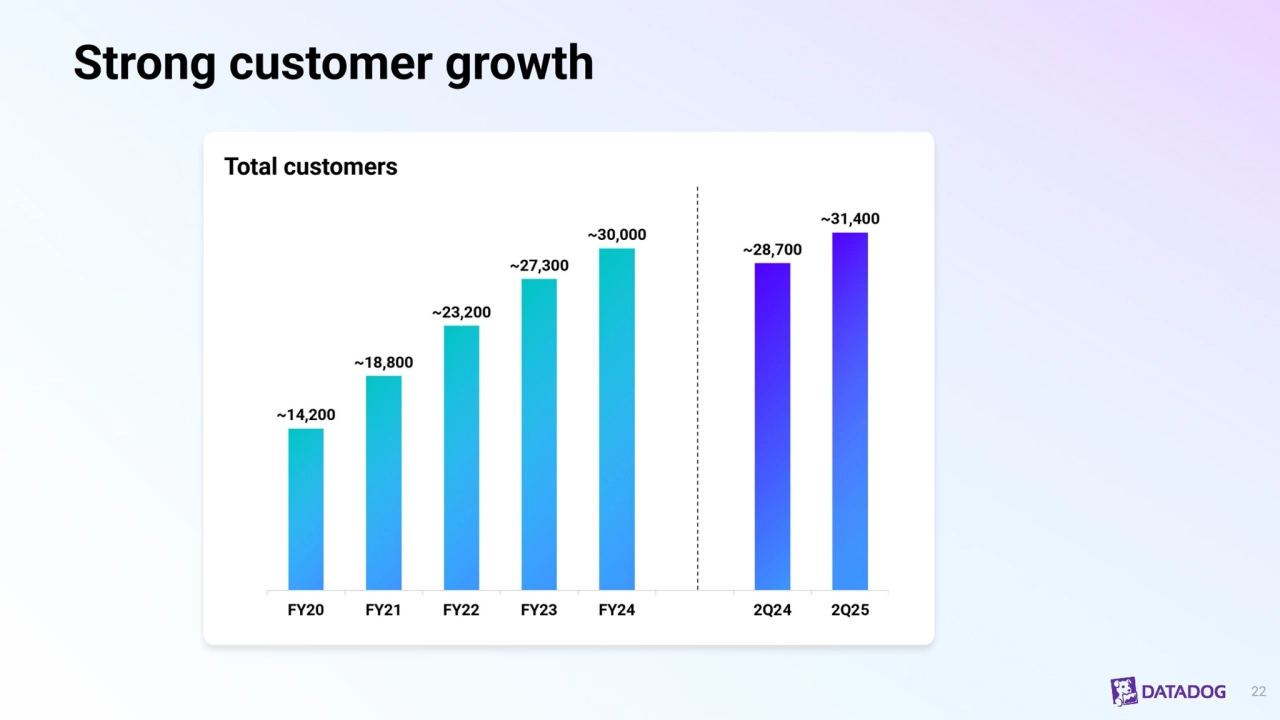
    • 22. Strong customer growth 22 Total customers
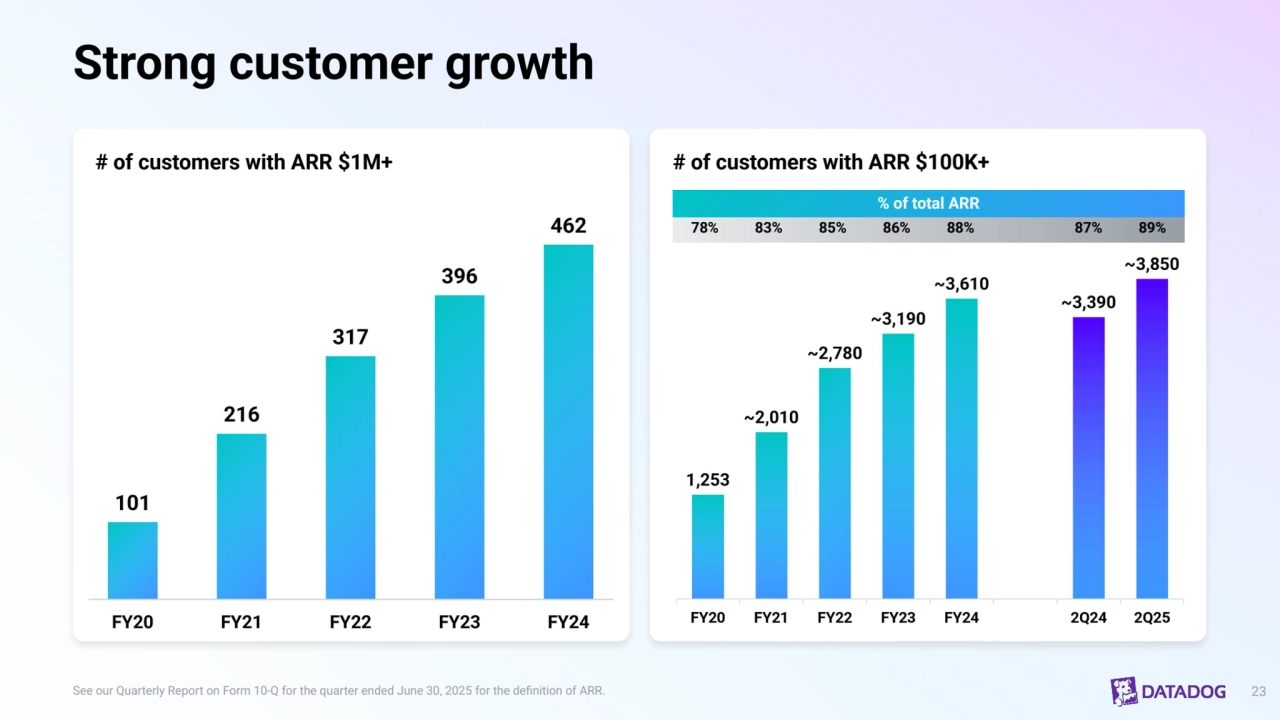
    • 23. Strong customer growth 23 # of customers with ARR $1M+ # of customers with ARR $100K+ See our Quarterly Report on Form 10-Q for the quarter ended June 30, 2025 for the definition of ARR. % of total ARR 78% 83% 85% 86% 88% 87% 89%
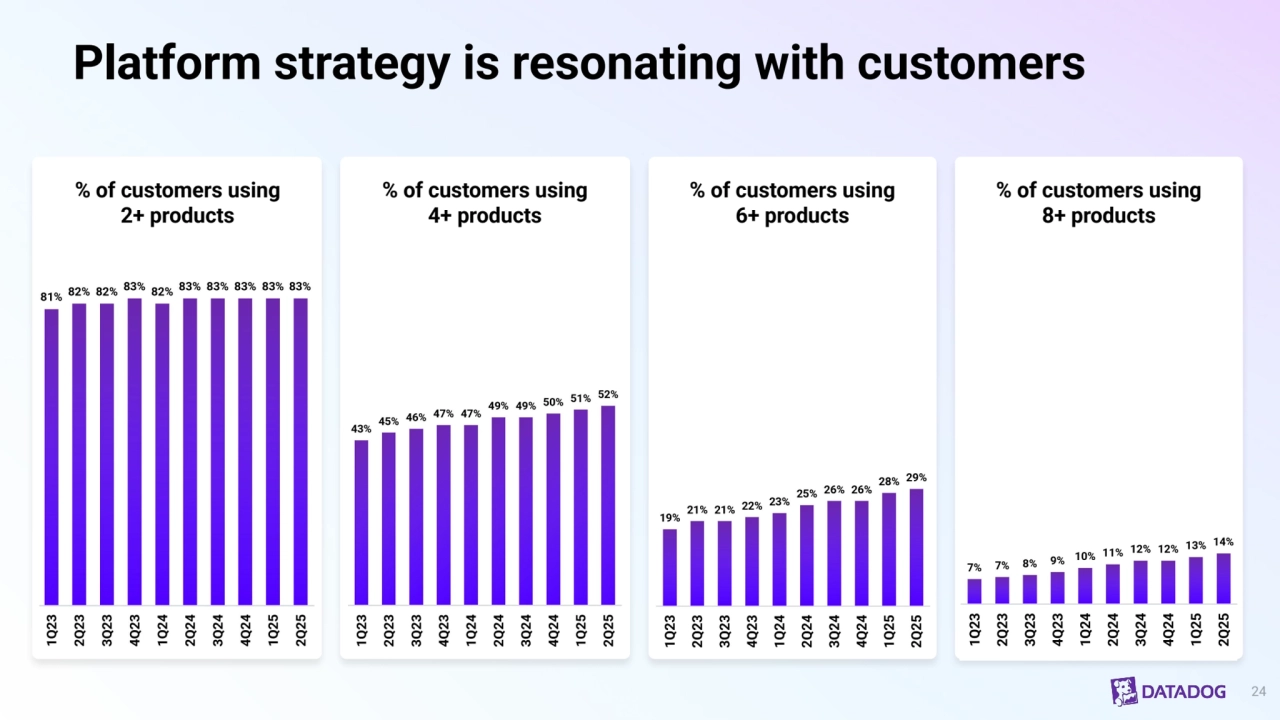
    • 24. Platform strategy is resonating with customers 24 % of customers using 2+ products % of customers using 4+ products % of customers using 6+ products % of customers using 8+ products
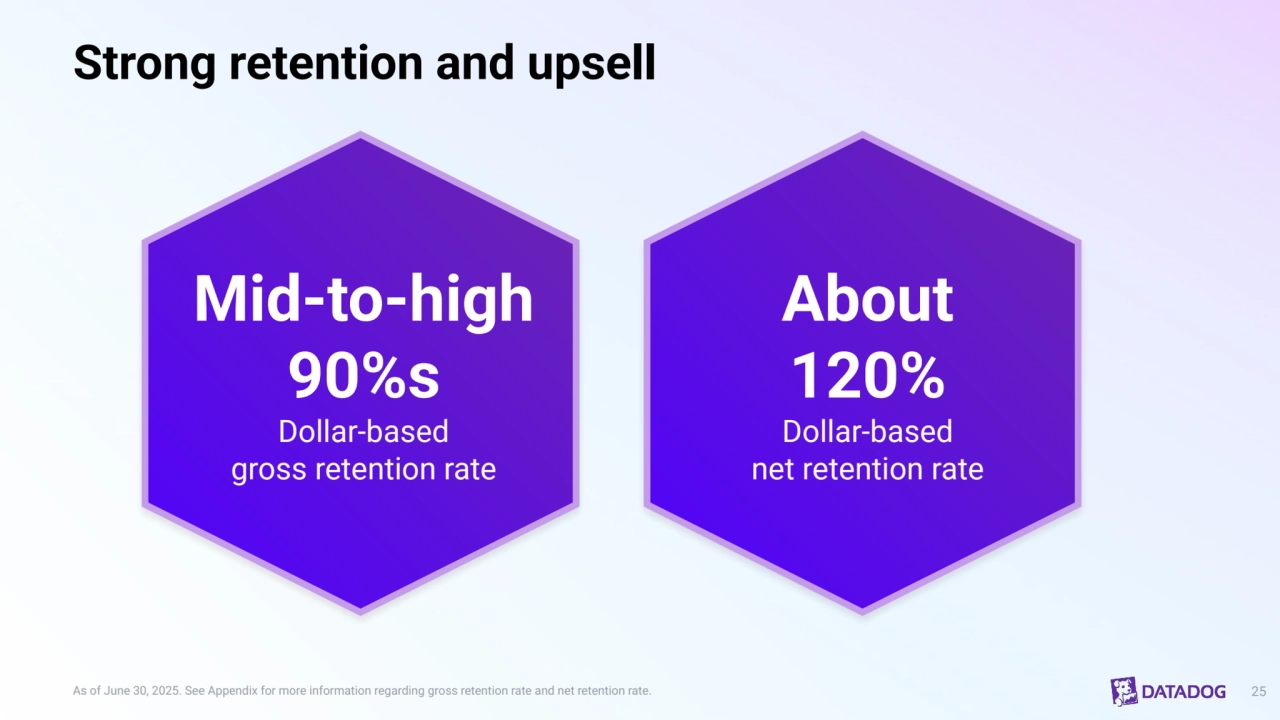
    • 25. Strong retention and upsell 25 Mid-to-high 90%s Dollar-based gross retention rate About 120% Dollar-based net retention rate As of June 30, 2025. See Appendix for more information regarding gross retention rate and net retention rate.
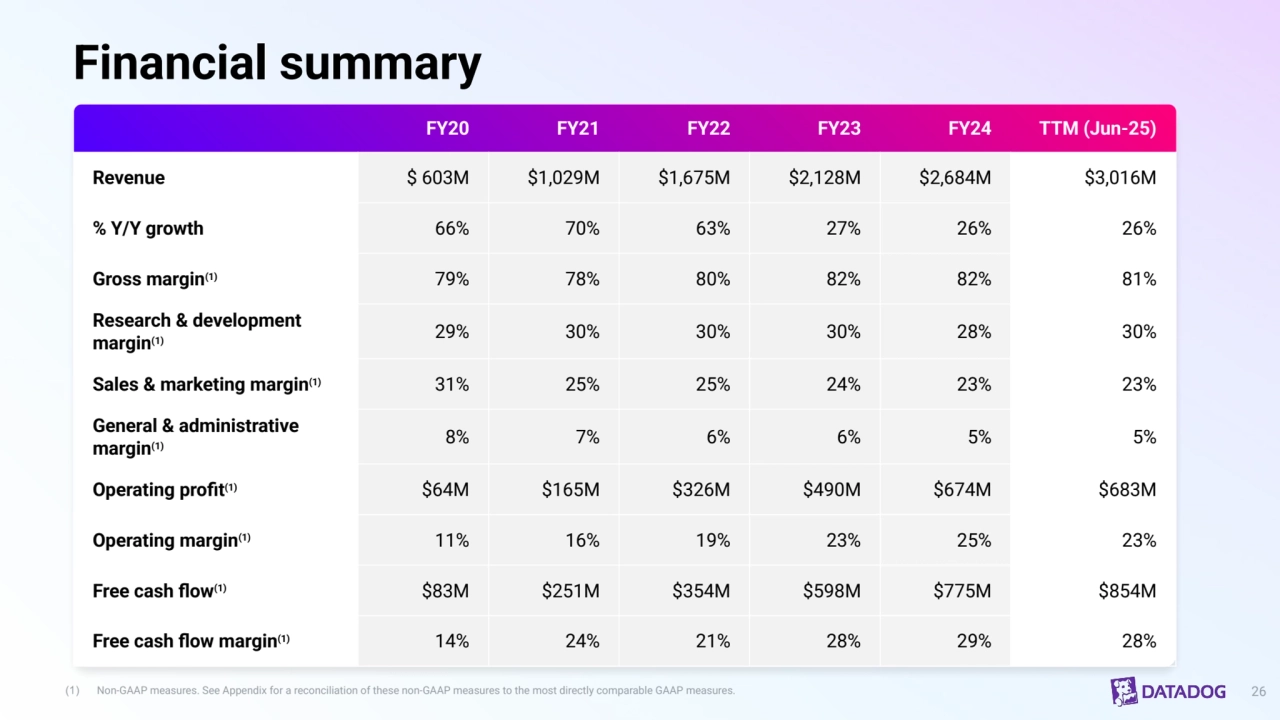
    • 26. FY20 FY21 FY22 FY23 FY24 TTM (Jun-25) Revenue $ 603M $1,029M $1,675M $2,128M $2,684M $3,016M % Y/Y growth 66% 70% 63% 27% 26% 26% Gross margin(1) 79% 78% 80% 82% 82% 81% Research & development margin(1) 29% 30% 30% 30% 28% 30% Sales & marketing margin(1) 31% 25% 25% 24% 23% 23% General & administrative margin(1) 8% 7% 6% 6% 5% 5% Operating profit(1) $64M $165M $326M $490M $674M $683M Operating margin(1) 11% 16% 19% 23% 25% 23% Free cash flow(1) $83M $251M $354M $598M $775M $854M Free cash flow margin(1) 14% 24% 21% 28% 29% 28% Financial summary (1) Non-GAAP measures. See Appendix for a reconciliation of these non-GAAP measures to the most directly comparable GAAP measures. 26
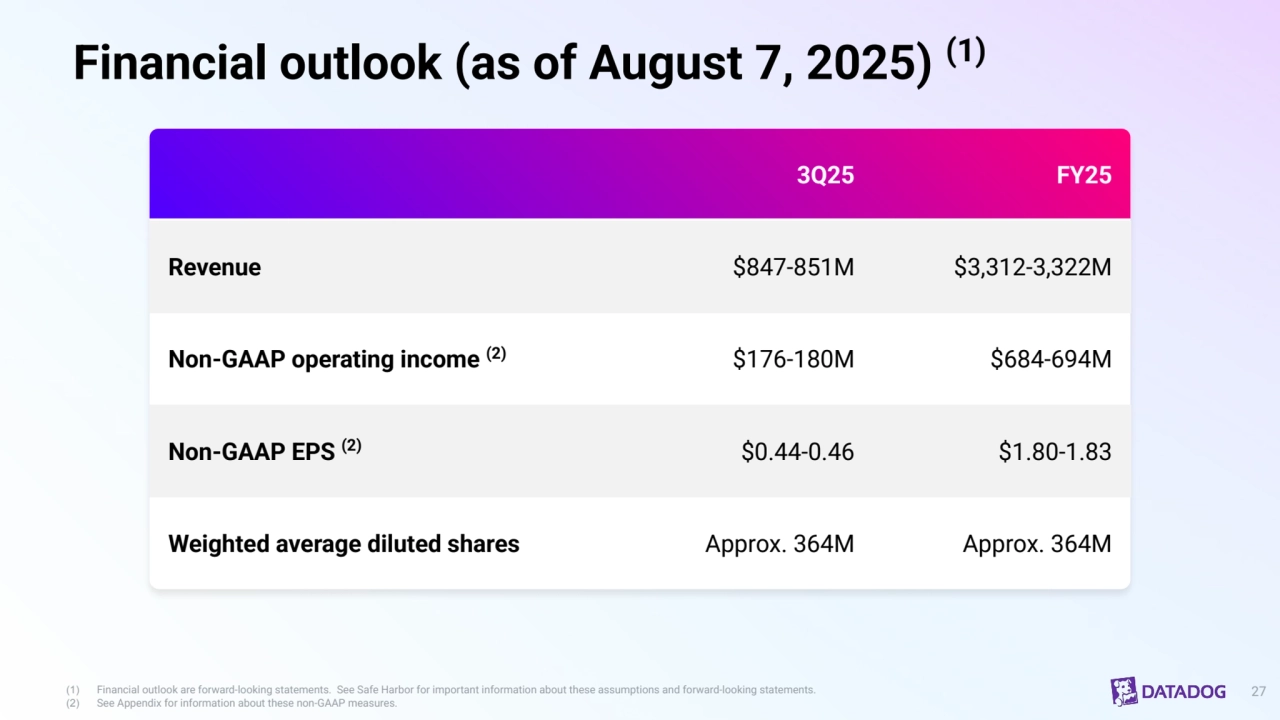
    • 27. Financial outlook (as of August 7, 2025) (1) (1) Financial outlook are forward-looking statements.  See Safe Harbor for important information about these assumptions and forward-looking statements. 27 (2) See Appendix for information about these non-GAAP measures. 3Q25 FY25 Revenue $847-851M $3,312-3,322M Non-GAAP operating income (2) $176-180M $684-694M Non-GAAP EPS (2) $0.44-0.46 $1.80-1.83 Weighted average diluted shares Approx. 364M Approx. 364M
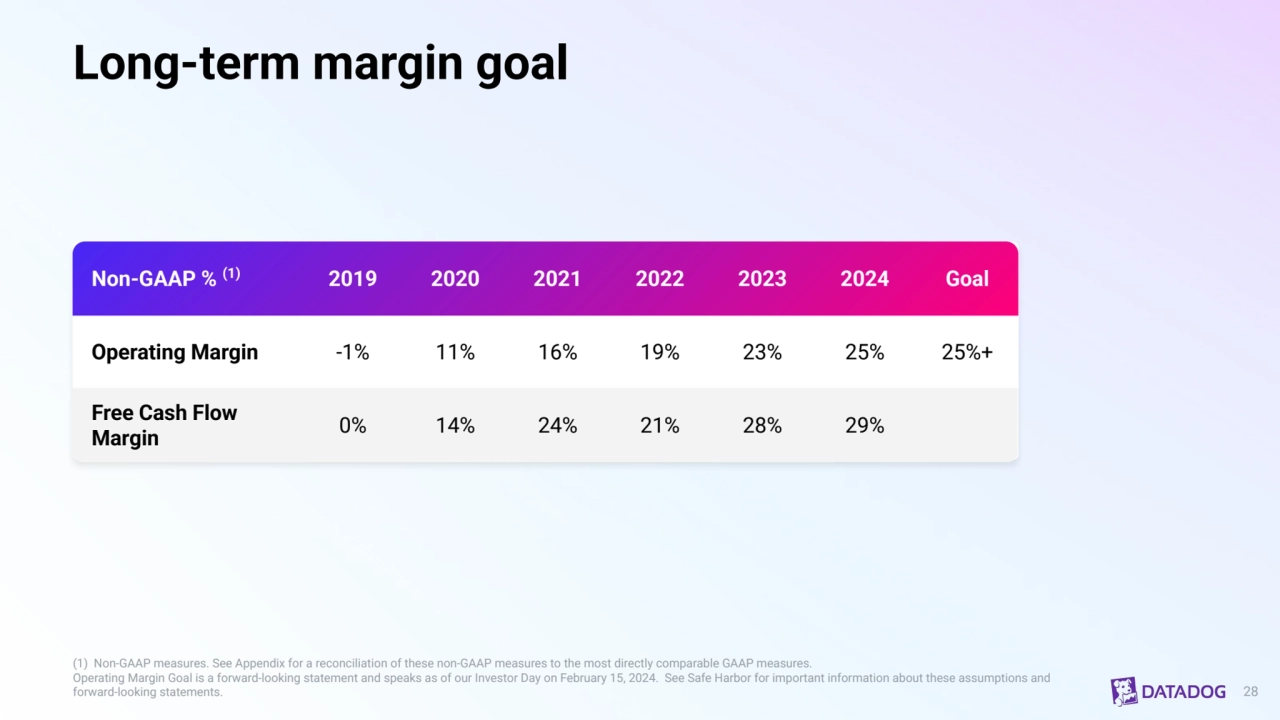
    • 28. Long-term margin goal (1) Non-GAAP measures. See Appendix for a reconciliation of these non-GAAP measures to the most directly comparable GAAP measures. Operating Margin Goal is a forward-looking statement and speaks as of our Investor Day on February 15, 2024. See Safe Harbor for important information about these assumptions and forward-looking statements. Non-GAAP % (1) 2019 2020 2021 2022 2023 2024 Goal Operating Margin -1% 11% 16% 19% 23% 25% 25%+ Free Cash Flow Margin 0% 14% 24% 21% 28% 29% 28
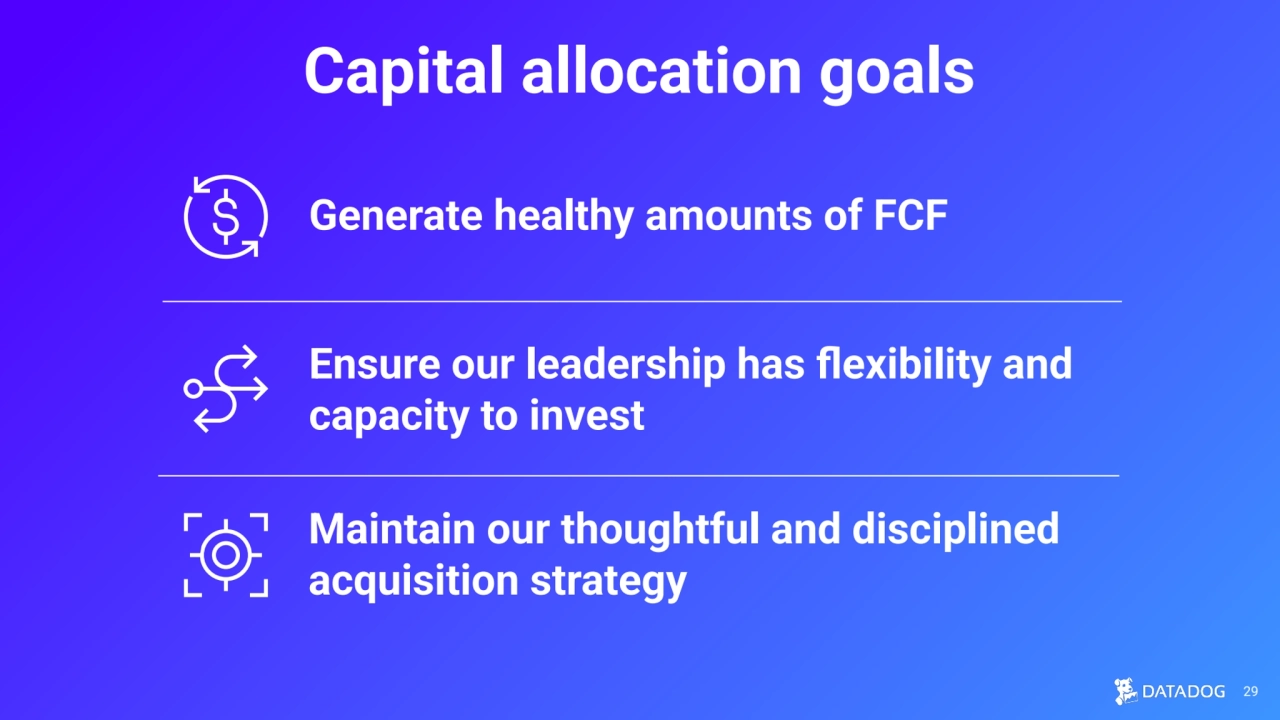
    • 29. Capital allocation goals Ensure our leadership has flexibility and capacity to invest Generate healthy amounts of FCF Maintain our thoughtful and disciplined acquisition strategy 29
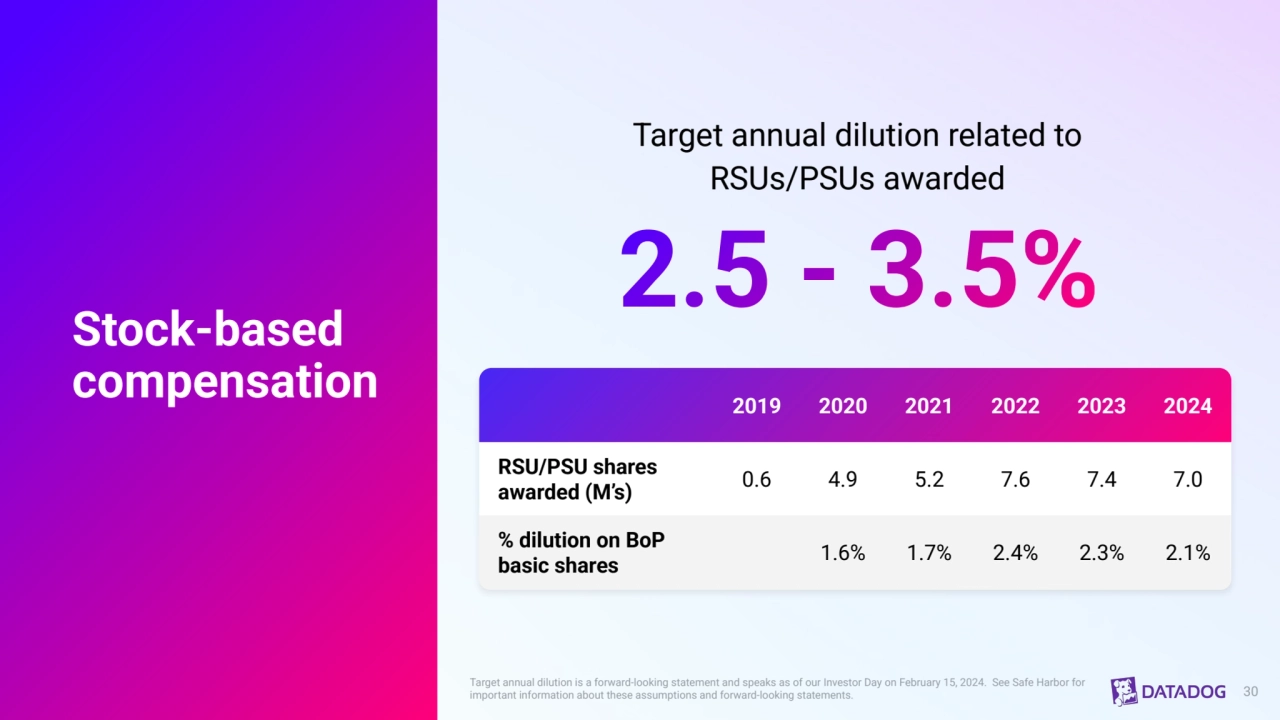
    • 30. Stock-based compensation Target annual dilution related to RSUs/PSUs awarded 2019 2020 2021 2022 2023 2024 RSU/PSU shares awarded (M’s) 0.6 4.9 5.2 7.6 7.4 7.0 % dilution on BoP basic shares 1.6% 1.7% 2.4% 2.3% 2.1% Target annual dilution is a forward-looking statement and speaks as of our Investor Day on February 15, 2024. See Safe Harbor for important information about these assumptions and forward-looking statements. 30
    • 31. Appendix
    • 32. Non-GAAP financial measures and other information The statistical data, estimates and forecasts referenced in this presentation and the accompanying oral presentation are based on independent industry publications or other publicly available information, as well as information based on our internal sources. While we believe the industry and market data included in this this presentation and the accompanying oral presentation are reliable and are based on reasonable assumptions, these data involve many assumptions and limitations, and you are cautioned not to give undue weight to these estimates. We have not independently verified the accuracy or completeness of the data contained in these industry publications and other publicly available information. We define the number of customers as the number of accounts with a unique account identifier for which we have an active subscription in the period indicated. Users of our free trials or tier are not included in our customer count. A single organization with multiple divisions, segments or subsidiaries is generally counted as a single customer. However, in some cases where they have separate billing terms, we may count separate divisions, segments or subsidiaries as multiple customers. Customers as of December 31, 2022 exclude customers from a then-recent acquisition, which did not contribute meaningful revenue during the fiscal year. Other terms such as annual recurring revenue or ARR and dollar-based net revenue retention rate shall have the meanings set forth in our Annual Report. Dollar-based gross retention rate is calculated by first calculating the point-in-time gross retention as the previous year ARR minus ARR attrition over the last 12 months, divided by the previous year ARR. The ARR attrition for each month is calculated by identifying any customer that has changed their account type to a “free tier,” requested a downgrade through customer support or sent a formal termination notice to us during that month, and aggregating the dollars of ARR generated by each such customer in the prior month. We then calculate the dollar-based gross retention rate as the weighted average of the trailing 12-month point-in-time gross retention rates. We believe dollar-based gross retention rate demonstrates the stickiness of the product category we operate in, and of our platform in particular. Non-GAAP Financial Measures Datadog discloses the following non-GAAP financial measures in this presentation and the accompanying oral presentation: non-GAAP gross profit, non-GAAP gross margin, non-GAAP operating expenses (sales and marketing, research and development, general and administrative), non-GAAP operating income (loss), non-GAAP operating margin, non-GAAP net income (loss), non-GAAP net income (loss) per diluted share, non-GAAP net income (loss) per basic share, free cash flow and free cash flow margin. Datadog uses each of these non-GAAP financial measures internally to understand and compare operating results across accounting periods, for internal budgeting and forecasting purposes, for short- and long-term operating plans, and to evaluate Datadog’s financial performance. Datadog believes they are useful to investors, as a supplement to GAAP measures, in evaluating its operational performance, as further discussed below. Datadog’s non-GAAP financial measures may not provide information that is directly comparable to that provided by other companies in its industry, as other companies in its industry may calculate non-GAAP financial results differently, particularly related to non-recurring and unusual items. In addition, there are limitations in using non-GAAP financial measures because the non-GAAP financial measures are not prepared in accordance with GAAP and may be different from non-GAAP financial measures used by other companies and exclude expenses that may have a material impact on Datadog’s reported financial results. Non-GAAP financial measures should not be considered in isolation from, or as a substitute for, financial information prepared in accordance with GAAP. A reconciliation of the historical non-GAAP financial measures to their most directly comparable GAAP measures has been provided in this Appendix. Datadog defines non-GAAP gross profit, non-GAAP gross margin, non-GAAP operating expenses (sales and marketing, research and development, general and administrative), non-GAAP operating income (loss), non-GAAP operating margin and non-GAAP net income (loss) as the respective GAAP balances, adjusted for, as applicable: (1) stock-based compensation expense; (2) the amortization of acquired intangibles; (3) employer payroll taxes on employee stock transactions; (4) M&A transaction costs; (5) amortization of issuance costs; and (6) an assumed provision for income taxes based on our long-term projected tax rate. Non-GAAP financial measures prior to April 1, 2025 have not been adjusted for M&A transaction costs, as such costs were not material to our results of operations in such prior periods. Our estimated long-term projected tax rate is subject to change for a variety of reasons, including the rapidly evolving global tax environment, significant changes in Datadog's geographic earnings mix, or other changes to our strategy or business operations. We will re-evaluate our long-term projected tax rate as appropriate. Datadog defines free cash flow as net cash provided by operating activities, minus capital expenditures and minus capitalized software development costs. Investors are encouraged to review the reconciliation of these historical non-GAAP financial measures to their most directly comparable GAAP financial measures. Datadog has not reconciled its expectations as to non-GAAP operating income, or as to non-GAAP net income per share, to their most directly comparable GAAP measure as a result of uncertainty regarding, and the potential variability of, reconciling items such as stock-based compensation and employer payroll taxes on equity incentive plans. Accordingly, reconciliation is not available without unreasonable effort, although it is important to note that these factors could be material to Datadog’s results computed in accordance with GAAP. 32
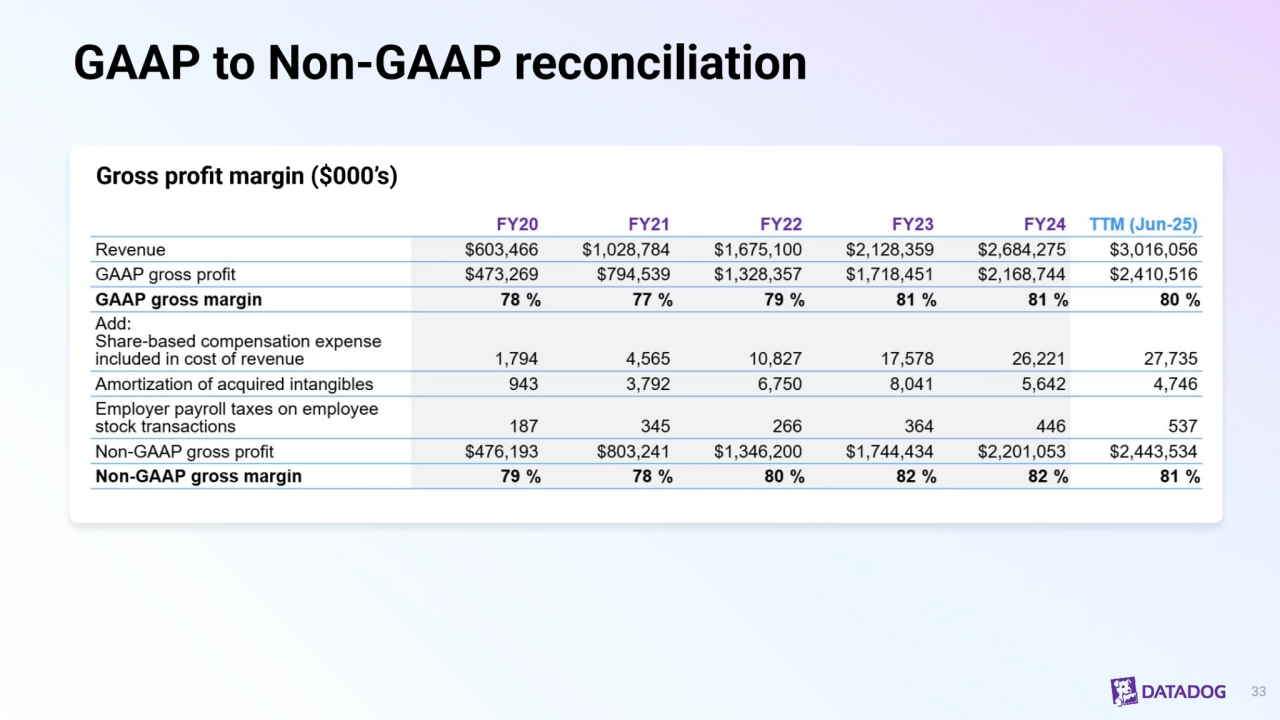
    • 33. GAAP to Non-GAAP reconciliation 33 Gross profit margin ($000’s)
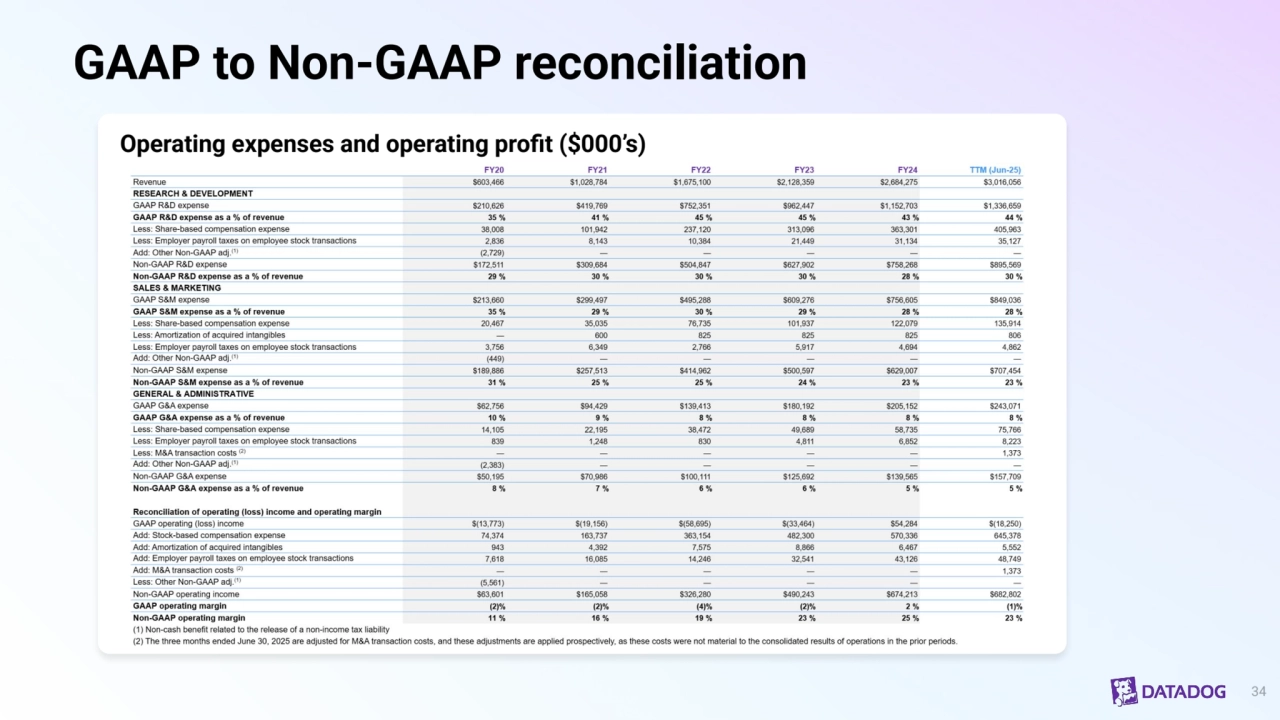
    • 34. GAAP to Non-GAAP reconciliation 34 Operating expenses and operating profit ($000’s)
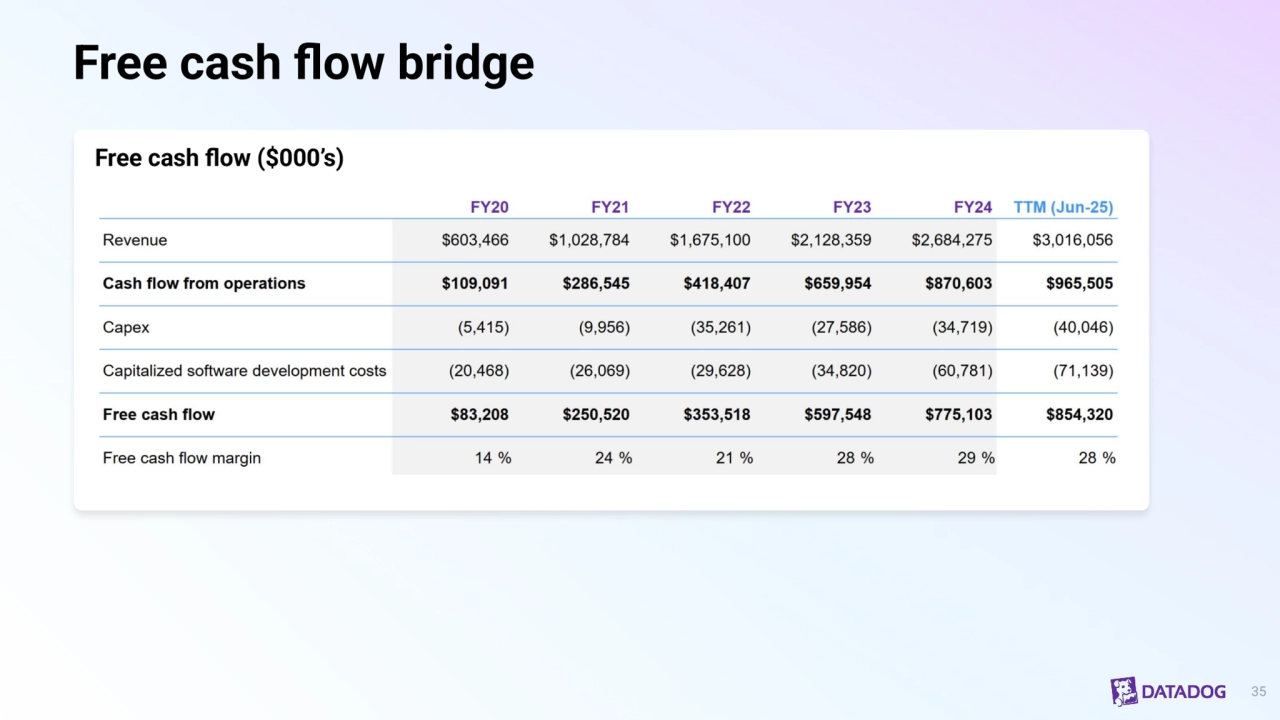
    • 35. Free cash flow bridge 35 Free cash flow ($000’s)


    • Previous
    • Next
    • f Fullscreen
    • esc Exit Fullscreen