Beyond: 2Q 2025 Earnings Call
 AI Summary
Key Insights
- [object Object]
- [object Object]
- [object Object]
- [object Object]
- [object Object]


Beyond: 2Q 2025 Earnings Call
- 1. July 29, 2025 2Q 2025 Earnings Call
- 2. 2Q 25 Earnings Call | July 2025 Forward-Looking Statements Forward-Looking Statements The information presented herein may contain forward-looking statements within the meaning of the federal securities laws. Such forward-looking statements include without limitation all statements other than statements of historical fact, including forecasts of our growth, path to profitability, plan to reduced fixed expenses, refinement of systems, technology, and data analytics, financial results or performance for the year or any other time period, macroeconomic and market conditions, potential value of our brands and monetization of their intellectual property and systems, our intention to generate capital returns through strategic and financially accretive partnerships and joint ventures, the timing of any of the foregoing, and other factors that will impact our results of operations. You should not place undue reliance on any forward-looking statements, which speak only as of the date they were made. We undertake no obligation to update any forward-looking statements as a result of any new information, future developments, or otherwise. Forward-looking statements are inherently difficult to predict. Accordingly, actual results could differ materially for a variety of reasons, including but not limited to, difficulties we may have with our fulfillment partners, supply chain, access to products, shipping costs, insurance, competition, consumer needs and spending, marketing, macroeconomic factors, tariffs or product bans, our evolving business model and use of our brands, changes to our leadership team or compensation approach, attraction/retention of employees, and search engine optimization results. Other risks and uncertainties include, among others, our ability to become profitable or generate positive cash flows, any problems with our infrastructure, transaction processing systems, cyber-attacks or data breaches affecting us, adverse tax, compliance, regulatory or legal developments, any restrictions on tracking technologies, losses relating to equity method investments, any ability to optimize our operations including customer service; any failure to effectively utilize technological advancements or protect our intellectual property, negative consequences of global conflict and politics, problems resulting from our determination to partially self-insure, impacts from our evolving business practices and expanded product and service offerings, any negative impacts from allowing third-parties to license our trademarks, any inability to realize the benefits of our investments in new businesses, strategies, partnerships, ventures, acquisitions, or other transactions, and whether our partnership with Pelion Venture Partners will achieve its objectives. More information about factors that could potentially affect our financial results are included in our Form 10-K for the year ended December 31, 2024, filed with the SEC on February 25, 2025, and in our subsequent filings with the SEC. The Forms 10-K and our subsequent filings with the SEC identify important factors that could cause our actual results to differ materially from those contained in or contemplated by our projections, estimates, and other forward-looking statements.
- 3. Financial Update
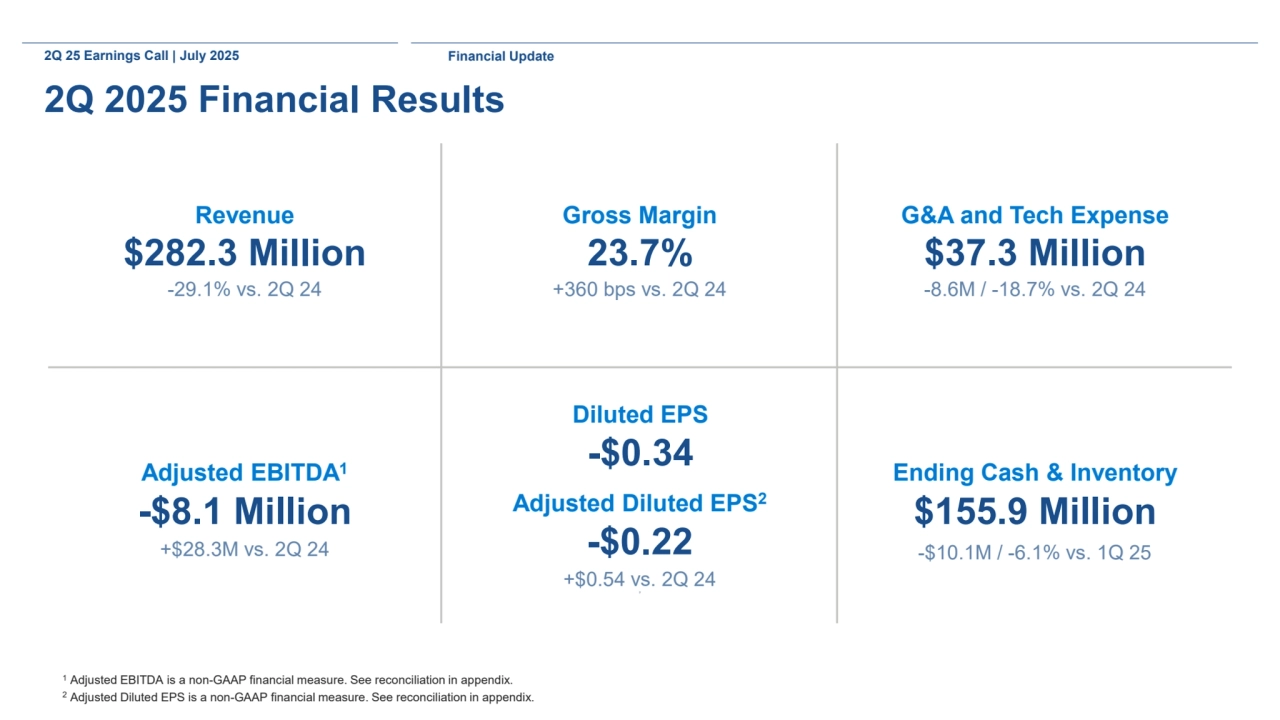
- 4. 2Q 25 Earnings Call | July 2025 2Q 2025 Financial Results 1 Adjusted EBITDA is a non-GAAP financial measure. See reconciliation in appendix. 2 Adjusted Diluted EPS is a non-GAAP financial measure. See reconciliation in appendix. $282.3 Million -29.1% vs. 2Q 24 Revenue 23.7% +360 bps vs. 2Q 24 Gross Margin Adjusted EBITDA1 -$8.1 Million +$28.3M vs. 2Q 24 Adjusted Diluted EPS2 -$0.22 +$0.54 vs. 2Q 24 2 Diluted EPS -$0.34 $155.9 Million Ending Cash & Inventory -$10.1M / -6.1% vs. 1Q 25 $37.3 Million -8.6M / -18.7% vs. 2Q 24 G&A and Tech Expense Financial Update
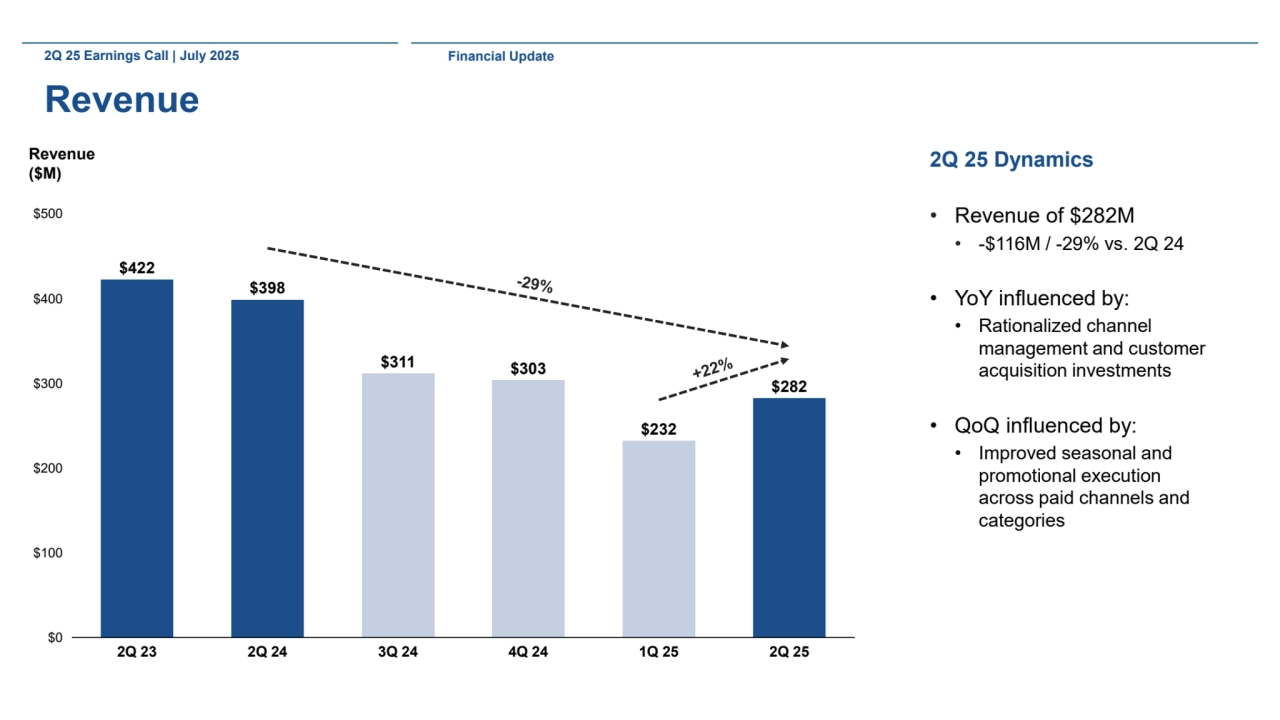
- 5. 2Q 25 Earnings Call | July 2025 Revenue 2Q 25 Dynamics • Revenue of $282M • -$116M / -29% vs. 2Q 24 • YoY influenced by: • Rationalized channel management and customer acquisition investments • QoQ influenced by: • Improved seasonal and promotional execution across paid channels and categories Revenue ($M) $0 $100 $200 $300 $400 $500 2Q 23 2Q 24 3Q 24 4Q 24 1Q 25 2Q 25 $422 $398 $311 $303 $232 $282 Financial Update
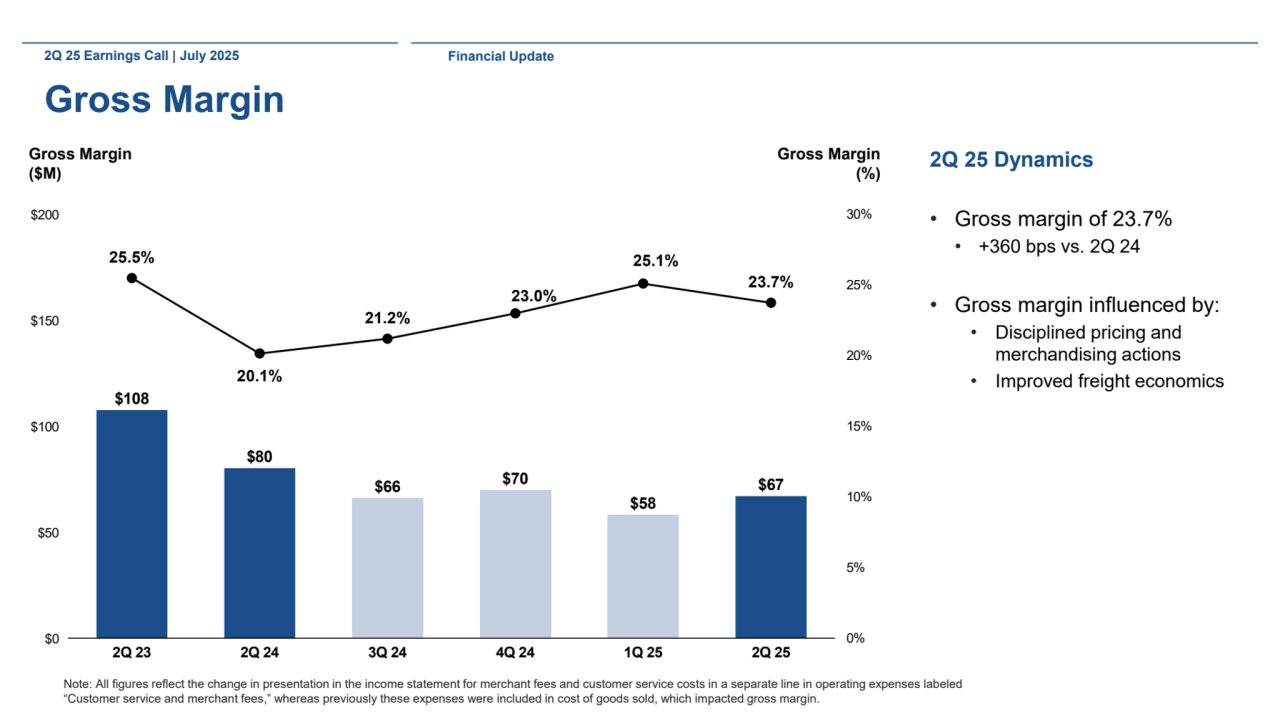
- 6. 2Q 25 Earnings Call | July 2025 Gross Margin 2Q 25 Dynamics • Gross margin of 23.7% • +360 bps vs. 2Q 24 • Gross margin influenced by: • Disciplined pricing and merchandising actions • Improved freight economics Gross Margin ($M) Gross Margin (%) 25.5% 20.1% 21.2% 23.0% 25.1% 23.7% 0% 5% 10% 15% 20% 25% 30% $0 $50 $100 $150 $200 2Q 23 2Q 24 3Q 24 4Q 24 1Q 25 2Q 25 $108 $80 $66 $70 $58 $67 Note: All figures reflect the change in presentation in the income statement for merchant fees and customer service costs in a separate line in operating expenses labeled “Customer service and merchant fees,” whereas previously these expenses were included in cost of goods sold, which impacted gross margin. Financial Update
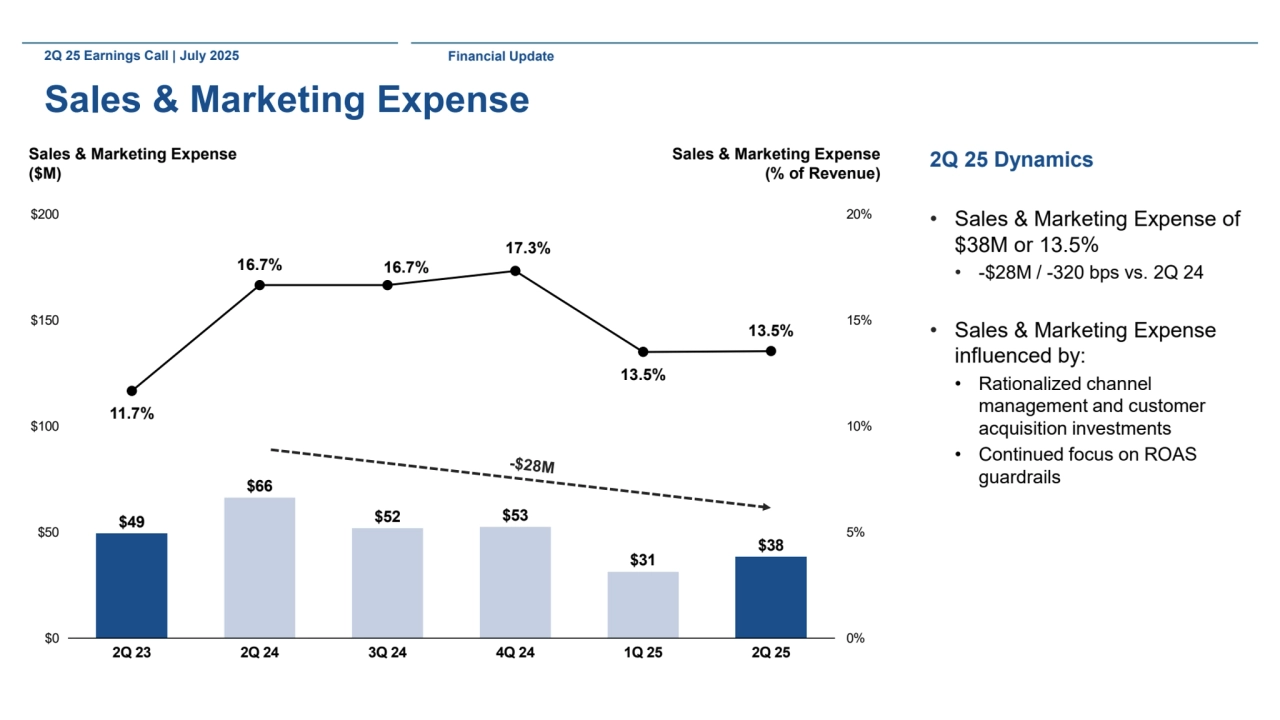
- 7. 2Q 25 Earnings Call | July 2025 Sales & Marketing Expense 2Q 25 Dynamics • Sales & Marketing Expense of $38M or 13.5% • -$28M / -320 bps vs. 2Q 24 • Sales & Marketing Expense influenced by: • Rationalized channel management and customer acquisition investments • Continued focus on ROAS guardrails Sales & Marketing Expense ($M) Sales & Marketing Expense (% of Revenue) 11.7% 16.7% 16.7% 17.3% 13.5% 13.5% 0% 5% 10% 15% 20% $0 $50 $100 $150 $200 2Q 23 2Q 24 3Q 24 4Q 24 1Q 25 2Q 25 $49 $66 $52 $53 $31 $38 Financial Update
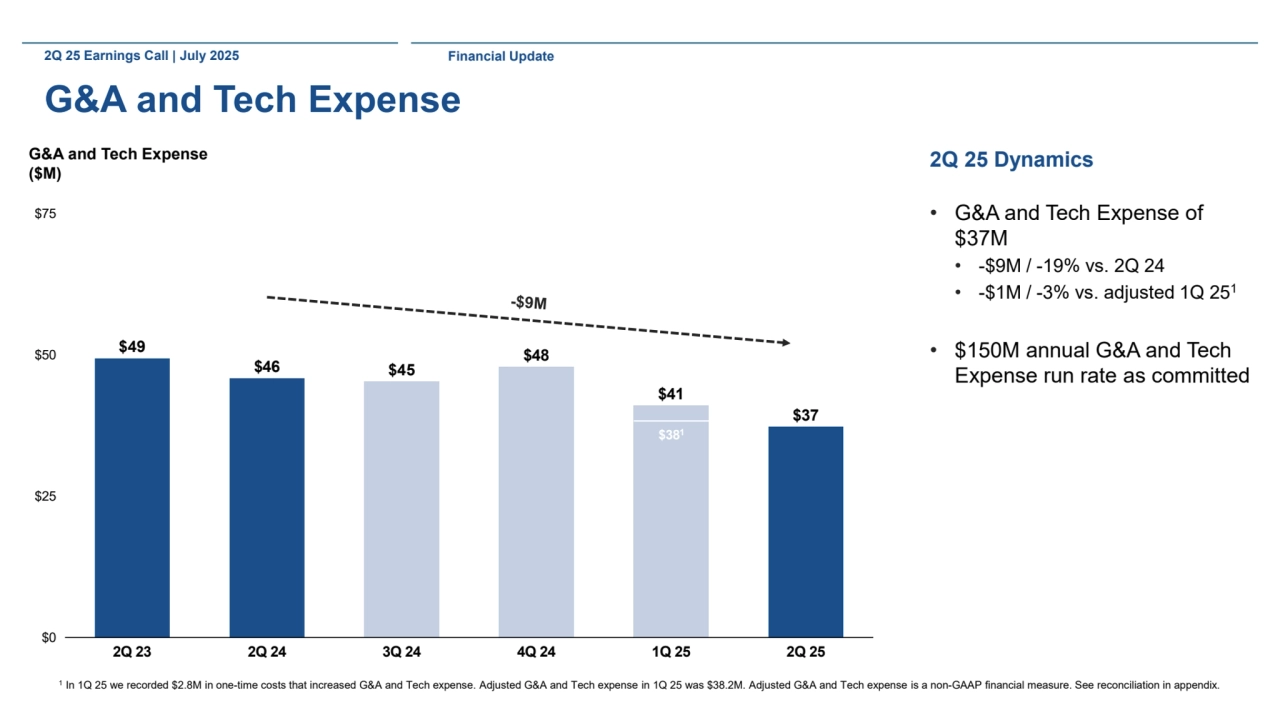
- 8. 2Q 25 Earnings Call | July 2025 G&A and Tech Expense 2Q 25 Dynamics • G&A and Tech Expense of $37M • -$9M / -19% vs. 2Q 24 • -$1M / -3% vs. adjusted 1Q 251 • $150M annual G&A and Tech Expense run rate as committed G&A and Tech Expense ($M) $0 $25 $50 $75 2Q 23 2Q 24 3Q 24 4Q 24 1Q 25 2Q 25 $49 $46 $45 $48 $41 $37 Financial Update $381 1 In 1Q 25 we recorded $2.8M in one-time costs that increased G&A and Tech expense. Adjusted G&A and Tech expense in 1Q 25 was $38.2M. Adjusted G&A and Tech expense is a non-GAAP financial measure. See reconciliation in appendix.
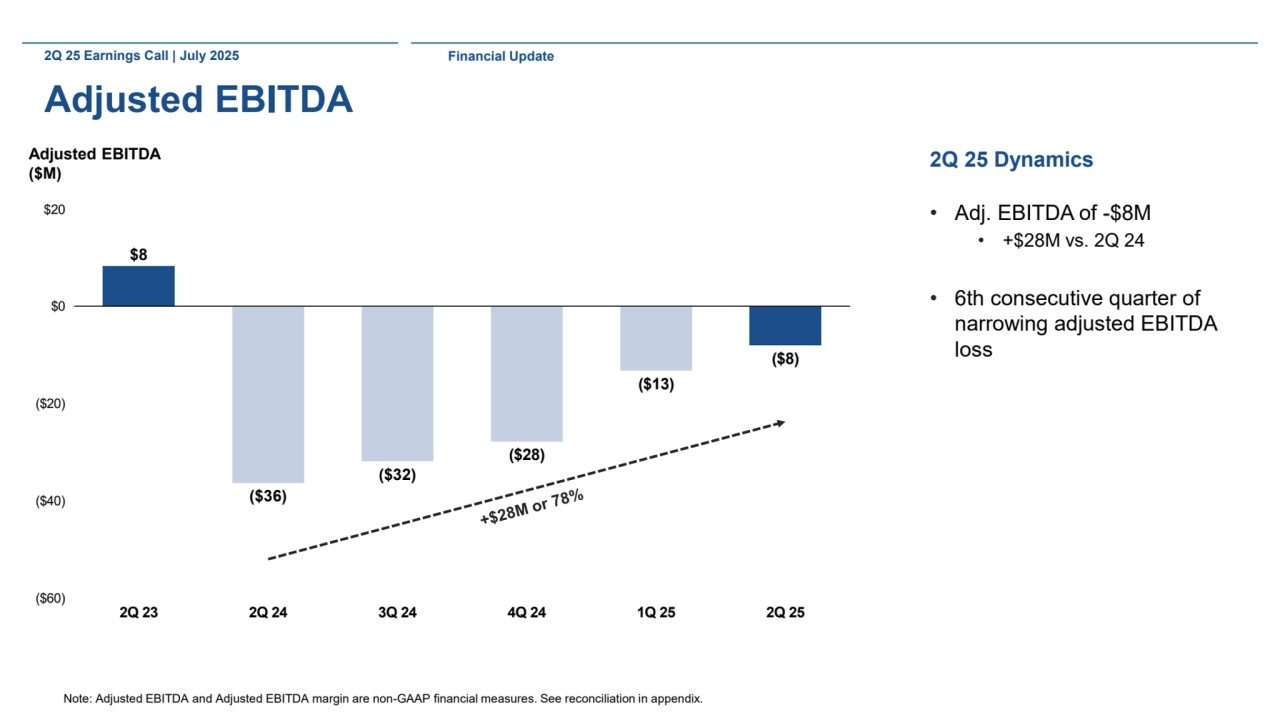
- 9. 2Q 25 Earnings Call | July 2025 Adjusted EBITDA 2Q 25 Dynamics • Adj. EBITDA of -$8M • +$28M vs. 2Q 24 • 6th consecutive quarter of narrowing adjusted EBITDA loss Adjusted EBITDA ($M) ($60) ($40) ($20) $0 $20 2Q 23 2Q 24 3Q 24 4Q 24 1Q 25 2Q 25 $8 ($36) ($32) ($28) ($13) ($8) Note: Adjusted EBITDA and Adjusted EBITDA margin are non-GAAP financial measures. See reconciliation in appendix. Financial Update
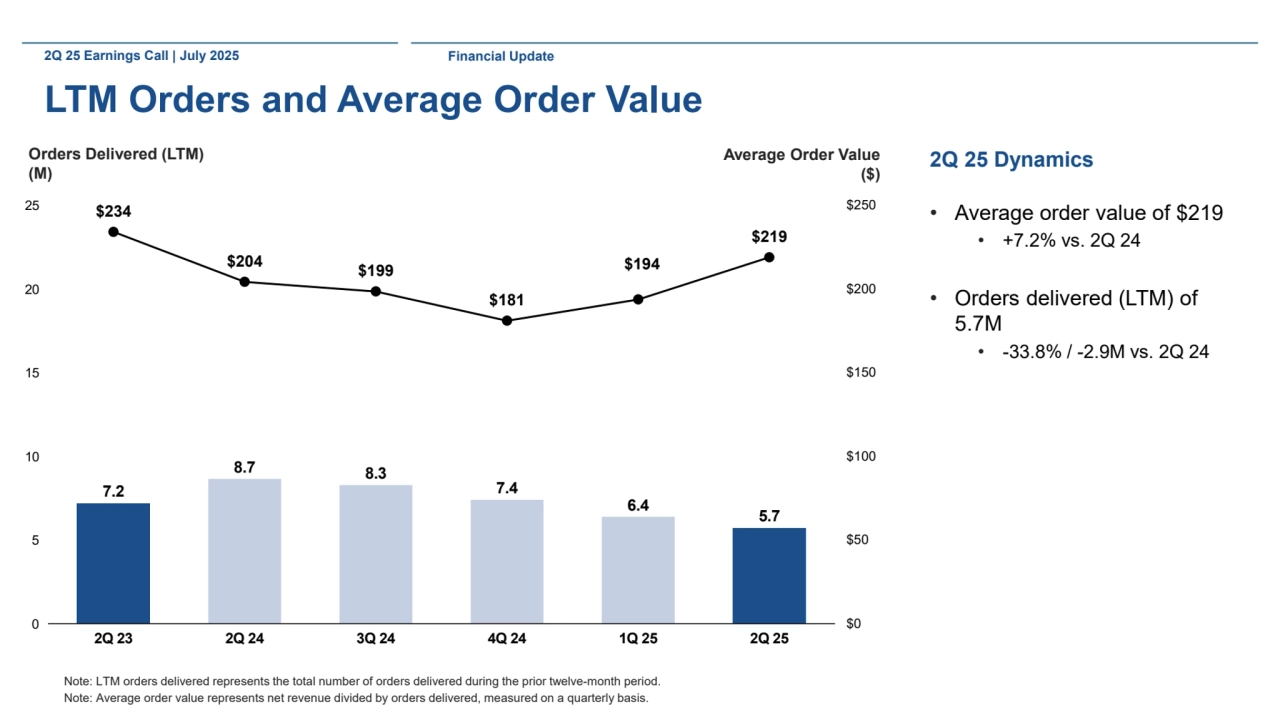
- 10. 2Q 25 Earnings Call | July 2025 LTM Orders and Average Order Value 2Q 25 Dynamics • Average order value of $219 • +7.2% vs. 2Q 24 • Orders delivered (LTM) of 5.7M • -33.8% / -2.9M vs. 2Q 24 Note: LTM orders delivered represents the total number of orders delivered during the prior twelve-month period. Note: Average order value represents net revenue divided by orders delivered, measured on a quarterly basis. Orders Delivered (LTM) (M) Average Order Value ($) $234 $204 $199 $181 $194 $219 $0 $50 $100 $150 $200 $250 0 5 10 15 20 25 2Q 23 2Q 24 3Q 24 4Q 24 1Q 25 2Q 25 7.2 8.7 8.3 7.4 6.4 5.7 Financial Update
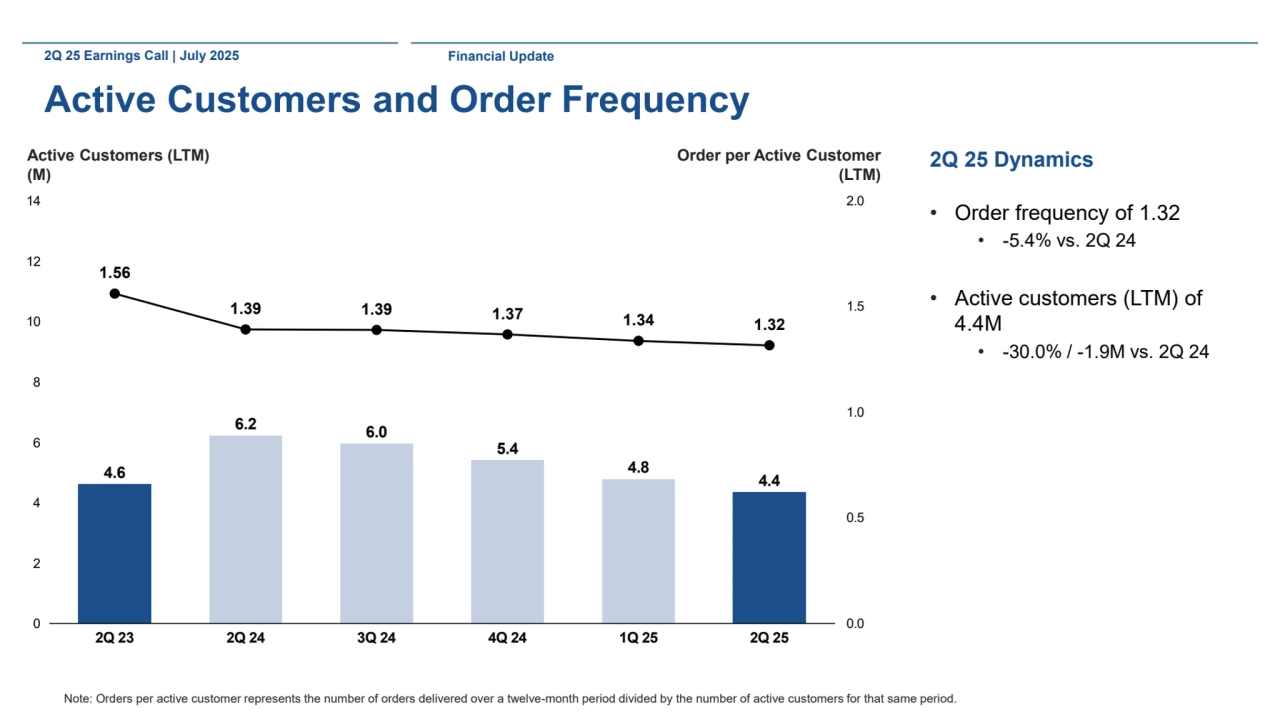
- 11. 2Q 25 Earnings Call | July 2025 Active Customers and Order Frequency 2Q 25 Dynamics • Order frequency of 1.32 • -5.4% vs. 2Q 24 • Active customers (LTM) of 4.4M • -30.0% / -1.9M vs. 2Q 24 Active Customers (LTM) (M) Order per Active Customer (LTM) 1.56 1.39 1.39 1.37 1.34 1.32 0.0 0.5 1.0 1.5 2.0 0 2 4 6 8 10 12 14 2Q 23 2Q 24 3Q 24 4Q 24 1Q 25 2Q 25 4.6 6.2 6.0 5.4 4.8 4.4 Note: Orders per active customer represents the number of orders delivered over a twelve-month period divided by the number of active customers for that same period. Financial Update
- 12. Operations Update
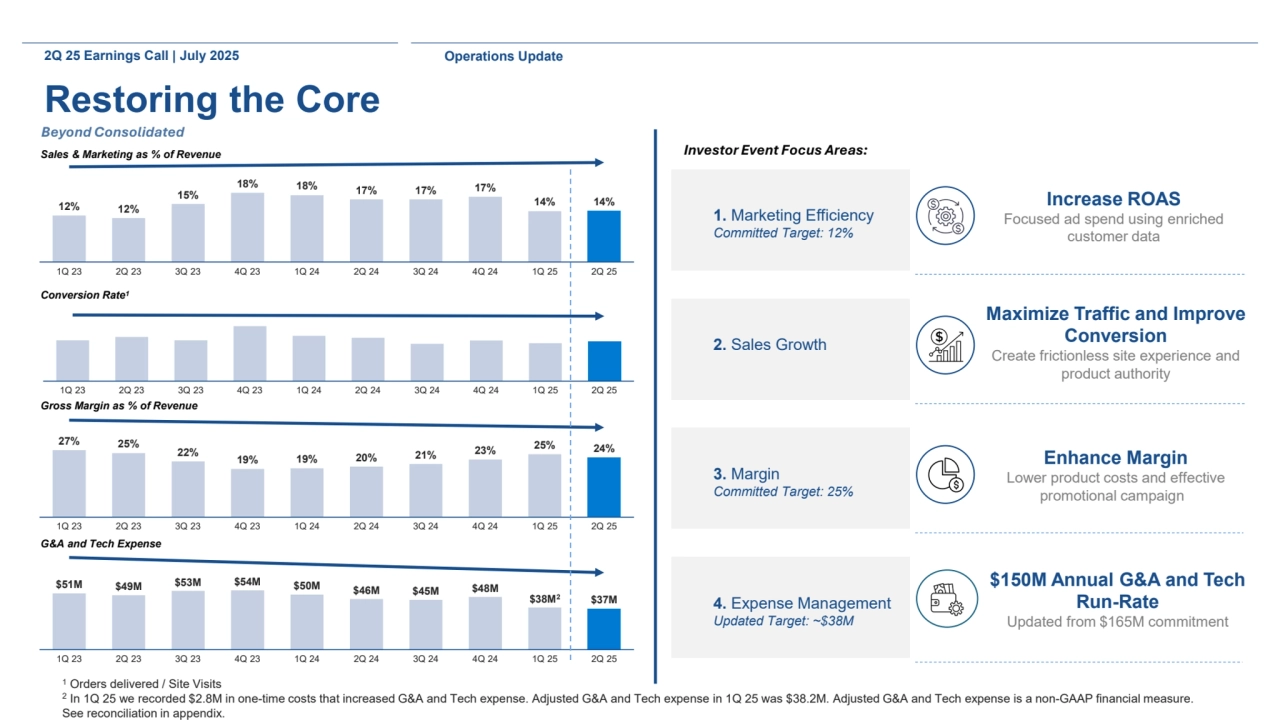
- 13. 1. Marketing Efficiency Committed Target: 12% 2. Sales Growth 3. Margin Committed Target: 25% 4. Expense Management Updated Target: ~$38M Icon Beyond Consolidated Investor Event Focus Areas: 2Q 25 Earnings Call | July 2025 Operations Update Restoring the Core 1 Orders delivered / Site Visits 2 In 1Q 25 we recorded $2.8M in one-time costs that increased G&A and Tech expense. Adjusted G&A and Tech expense in 1Q 25 was $38.2M. Adjusted G&A and Tech expense is a non-GAAP financial measure. See reconciliation in appendix. Increase ROAS Focused ad spend using enriched customer data Maximize Traffic and Improve Conversion Create frictionless site experience and product authority Enhance Margin Lower product costs and effective promotional campaigns $150M Annual G&A and Tech Run-Rate Updated from $165M commitment Optimized structure for the future 12% 12% 15% 18% 18% 17% 17% 17% 14% 14% 1Q 23 2Q 23 3Q 23 4Q 23 1Q 24 2Q 24 3Q 24 4Q 24 1Q 25 2Q 25 27% 25% 22% 19% 19% 20% 21% 23% 25% 24% 1Q 23 2Q 23 3Q 23 4Q 23 1Q 24 2Q 24 3Q 24 4Q 24 1Q 25 2Q 25 1Q 23 2Q 23 3Q 23 4Q 23 1Q 24 2Q 24 3Q 24 4Q 24 1Q 25 2Q 25 $51M $49M $53M $54M $50M $46M $45M $48M $38M2 $37M Sales & Marketing as % of Revenue G&A and Tech Expense Gross Margin as % of Revenue Conversion Rate1 1Q 23 2Q 23 3Q 23 4Q 23 1Q 24 2Q 24 3Q 24 4Q 24 1Q 25 2Q 25
- 14. Appendix
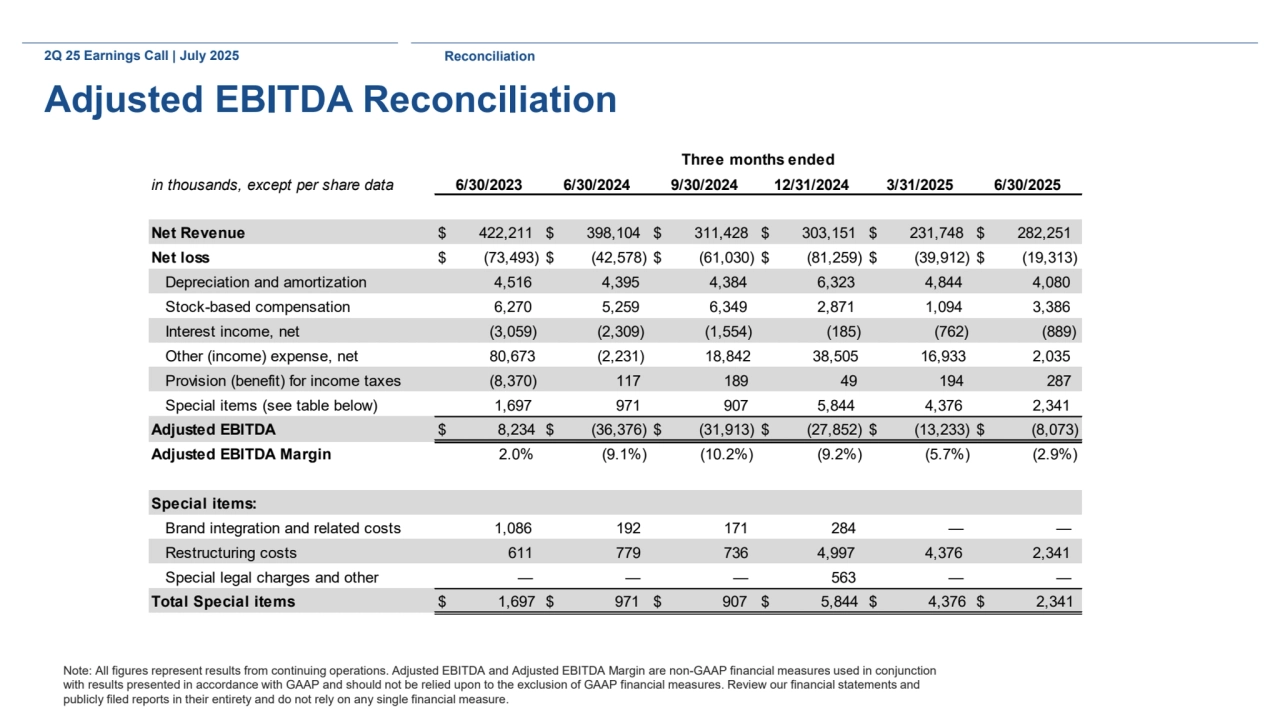
- 15. in thousands, except per share data 6/30/2023 6/30/2024 9/30/2024 12/31/2024 3/31/2025 6/30/2025 Net Revenue $ 422,211 $ 398,104 $ 311,428 $ 303,151 $ 231,748 $ 282,251 Net loss $ (73,493) $ (42,578) $ (61,030) $ (81,259) $ (39,912) $ (19,313) Depreciation and amortization 4,516 4,395 4,384 6,323 4,844 4,080 Stock-based compensation 6,270 5,259 6,349 2,871 1,094 3,386 Interest income, net (3,059) (2,309) (1,554) (185) (762) (889) Other (income) expense, net 80,673 (2,231) 18,842 38,505 16,933 2,035 Provision (benefit) for income taxes (8,370) 117 189 49 194 287 Special items (see table below) 1,697 971 907 5,844 4,376 2,341 Adjusted EBITDA $ 8,234 $ (36,376) $ (31,913) $ (27,852) $ (13,233) $ (8,073) Adjusted EBITDA Margin 2.0% (9.1%) (10.2%) (9.2%) (5.7%) (2.9%) Special items: Brand integration and related costs 1,086 192 171 284 — — Restructuring costs 611 779 736 4,997 4,376 2,341 Special legal charges and other — — — 563 — — Total Special items $ 1,697 $ 971 $ 907 $ 5,844 $ 4,376 $ 2,341 Three months ended 2Q 25 Earnings Call | July 2025 Reconciliation Adjusted EBITDA Reconciliation Note: All figures represent results from continuing operations. Adjusted EBITDA and Adjusted EBITDA Margin are non-GAAP financial measures used in conjunction with results presented in accordance with GAAP and should not be relied upon to the exclusion of GAAP financial measures. Review our financial statements and publicly filed reports in their entirety and do not rely on any single financial measure.
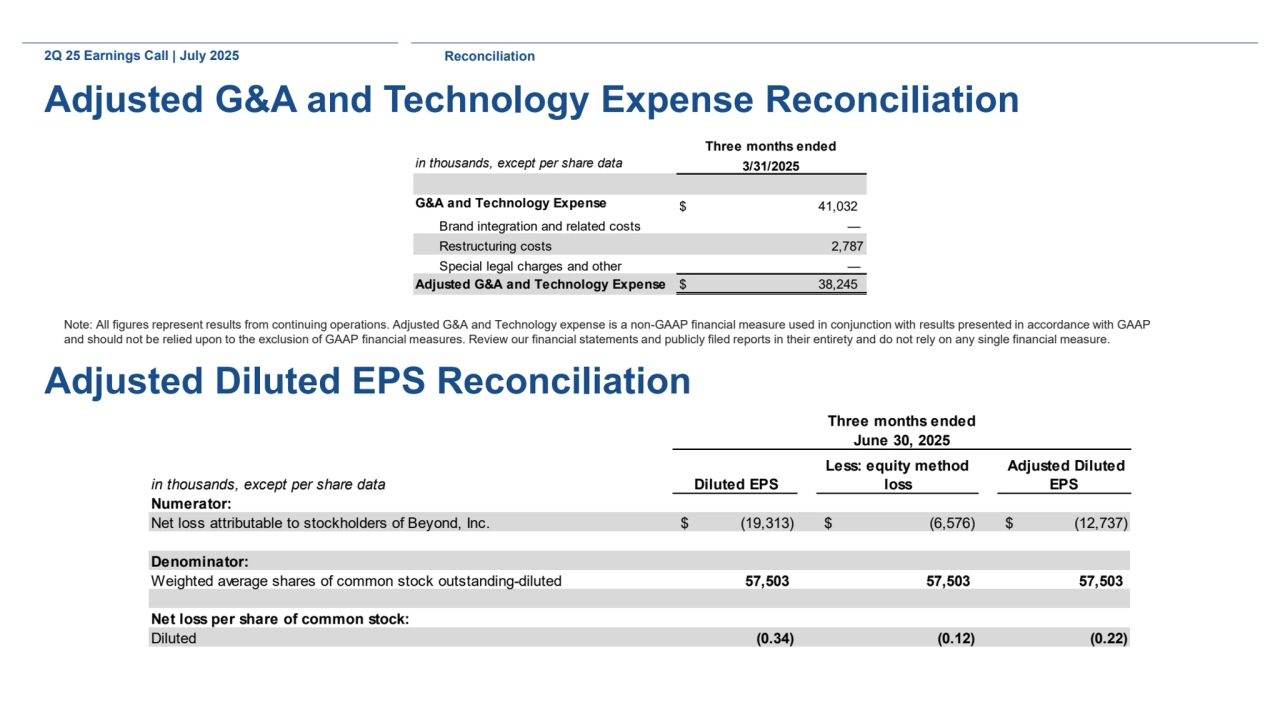
- 16. in thousands, except per share data Numerator: Net loss attributable to stockholders of Beyond, Inc. $ (19,313) $ (6,576) $ (12,737) Denominator: Weighted average shares of common stock outstanding-diluted 57,503 57,503 57,503 Net loss per share of common stock: Diluted (0.34) (0.12) (0.22) Adjusted Diluted EPS Three months ended June 30, 2025 Diluted EPS Less: equity method loss 2Q 25 Earnings Call | July 2025 Reconciliation Adjusted G&A and Technology Expense Reconciliation Adjusted Diluted EPS Reconciliation in thousands, except per share data 3/31/2025 G&A and Technology Expense $ 41,032 Brand integration and related costs — Restructuring costs 2,787 Special legal charges and other — Adjusted G&A and Technology Expense $ 38,245 Three months ended Note: All figures represent results from continuing operations. Adjusted G&A and Technology expense is a non-GAAP financial measure used in conjunction with results presented in accordance with GAAP and should not be relied upon to the exclusion of GAAP financial measures. Review our financial statements and publicly filed reports in their entirety and do not rely on any single financial measure.