Booking Holdings Q2 2025 Financial Overview
 AI Summary
Key Insights
- 📈 Financial Overview: Booking Holdings reports Q2 2025 earnings, exceeding expectations.
- 🏨 Alternative Accommodations: 10% YoY growth in alternative accommodation room nights, increasing mix.
- 📱 Mobile App: Mobile app usage rises, now representing a mid 50%'s mix in bookings.
- 🌍 Regional Growth: Room Night growth varied by region; Europe & RoW up high single digits, Asia up low double digits, U.S. up low single digits.
- 💰 Capital Returns: Free cash flow increases with capital being returned through share repurchases.


Booking Holdings Q2 2025 Financial Overview
- 1. Q2 2025 Earnings Presentation July 29, 2025
- 2. Disclosure Regarding Forward-Looking Statements This presentation contains forward-looking statements including regarding our outlook. These forward-looking statements reflect the views of Booking Holdings Inc.’s (the “Company” or “Booking Holdings” or “BKNG”) management regarding current expectations and projections about future events and conditions and are based on currently available information and current foreign currency exchange rates. Forward-looking statements are not guarantees of future performance and are subject to risks, uncertainties, and assumptions that are difficult to predict such as: ● adverse changes in market conditions for travel services; ● the effects of competition; ● the Company's ability to successfully manage growth and expand its global business; ● adverse changes in third-party relationships; ● the Company’s performance marketing efficiency and the effectiveness of its marketing efforts; ● the Company’s ability to respond to and keep up with rapid technological or other market changes; ● the development and use of generative AI; ● the Company's ability to attract and retain qualified personnel; ● operational and technological infrastructure risks; ● data privacy and cyberattack risks; ● IT systems-related failures or security breaches; ● risks related to exposure to additional tax liabilities and maintaining tax benefits; ● legal and regulatory risks; ● risks associated with the facilitation of payments; ● fluctuations in foreign currency exchange rates and other risks associated with doing business in multiple currencies and jurisdictions; ● risks of increased debt levels and stock price volatility; and ● success of investments and acquisitions, including integration of acquired businesses. For a detailed discussion of these and other factors that could cause the Company's actual results to differ materially from those described in this presentation, refer to the Company's most recent Annual Report on Form 10-K, any current reports on Form 8-K, and any subsequent Quarterly Reports on Form 10-Q filed with the Securities and Exchange Commission (the “SEC”). Unless required by law, the Company undertakes no obligation to update publicly any forward-looking statements, whether as a result of new information, future events, or otherwise. This presentation may contain industry market data, industry forecasts, and other statistical information. Such information has been obtained from publicly available information, industry publications and other third-party sources, and the Company makes no representations as to the accuracy of such information. The Company has not independently verified any such information. Certain information in this presentation is based upon management forecasts and reflects prevailing conditions and management's views as of this date, all of which are subject to change. Adjusted Financial Measures: While the Company reports financial results in accordance with accounting principles generally accepted in the United States of America (“GAAP”), this presentation includes certain Adjusted “Non-GAAP” measures, including Adjusted EBITDA, Free Cash Flow, Adjusted Net Income, and Adjusted Net Income per Diluted Common Share (Adjusted EPS), which are not presented in accordance with GAAP and should not be considered in isolation or as a substitute for, or superior to, the financial information prepared and presented in accordance with GAAP. The Company also uses information on (i) the impact of the adjustments required to compute Adjusted Net income and Adjusted EBITDA on line items as reported in the Company's consolidated statements of operations, as applicable, and (ii) Adjusted fixed operating expenses, which is Total operating expenses, as reported in the Company's consolidated statements of operations, adjusted to exclude (a) certain operating expenses which are generally more likely to vary based on changes in business volumes and (b) amounts which are excluded in the computation of Adjusted EBITDA. The Company uses non-GAAP financial measures for financial and operational decision-making and as a basis to evaluate performance and set targets for employee compensation programs. The Company believes that these non-GAAP financial measures are useful for analysts and investors to evaluate the Company's ongoing operating performance because they facilitate comparison of the Company's results for the current period and projected next-period results to those of prior periods and to those of its competitors (though other companies may calculate similar non-GAAP financial measures differently from those calculated by the Company). These non-GAAP financial measures, in particular Adjusted Net income, Adjusted EBITDA, and Free cash flow, are not intended to represent funds available for Booking Holdings' discretionary use and are not intended to represent or to be used as a substitute for Operating income, Net income, or Net cash provided by operating activities as measured under GAAP. The items excluded from these non-GAAP measures, but included in the calculation of their closest GAAP equivalent, are significant components of the Company's consolidated statements of operations and cash flows and must be considered in performing a comprehensive assessment of overall financial performance. For a reconciliation of Adjusted EBITDA, Free Cash Flow, Adjusted Net Income, and Adjusted EPS to the comparable GAAP measures, see the Appendix. We evaluate certain operating and financial measures on both an as-reported and constant currency basis. We calculate constant currency measures based on the predominant transactional currency in each country, converting our current-year period results in currencies other than U.S. Dollars using the corresponding prior-year period monthly average exchange rates. We are not able to provide a reconciliation between forward-looking Adjusted EBITDA and GAAP Net income because we cannot predict certain components of such reconciliation without unreasonable effort as they arise from events in future periods. This is due to the unpredictable nature of these reconciling items, which would require an unreasonable effort to forecast, and would result in a large range of projected values that would not be meaningful to investors. See Item 10(e)(1)(i)(B) of SEC Regulation S-K. Disclaimer 2
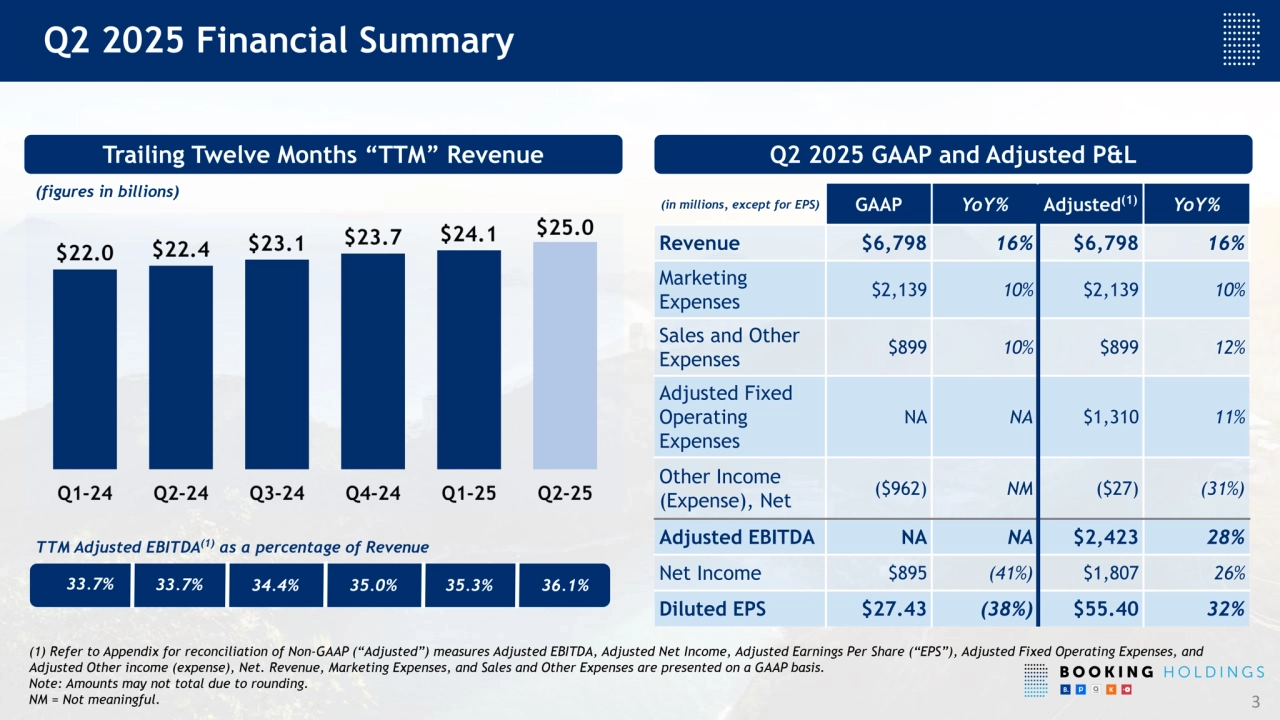
- 3. TTM Adjusted EBITDA(1) as a percentage of Revenue (in millions, except for EPS) GAAP YoY% Adjusted (1) YoY% Revenue $6,798 16% $6,798 16% Marketing Expenses $2,139 10% $2,139 10% Sales and Other Expenses $899 10% $899 12% Adjusted Fixed Operating Expenses NA NA $1,310 11% Other Income (Expense), Net ($962) NM ($27) (31%) Adjusted EBITDA NA NA $2,423 28% Net Income $895 (41%) $1,807 26% Diluted EPS $27.43 (38%) $55.40 32% (figures in billions) 3 Q2 2025 Financial Summary Trailing Twelve Months “TTM” Revenue Q2 2025 GAAP and Adjusted P&L 33.7% 33.7% 34.4% (1) Refer to Appendix for reconciliation of Non-GAAP (“Adjusted”) measures Adjusted EBITDA, Adjusted Net Income, Adjusted Earnings Per Share (“EPS”), Adjusted Fixed Operating Expenses, and Adjusted Other income (expense), Net. Revenue, Marketing Expenses, and Sales and Other Expenses are presented on a GAAP basis. Note: Amounts may not total due to rounding. NM = Not meaningful. 35.0% 35.3% 36.1%
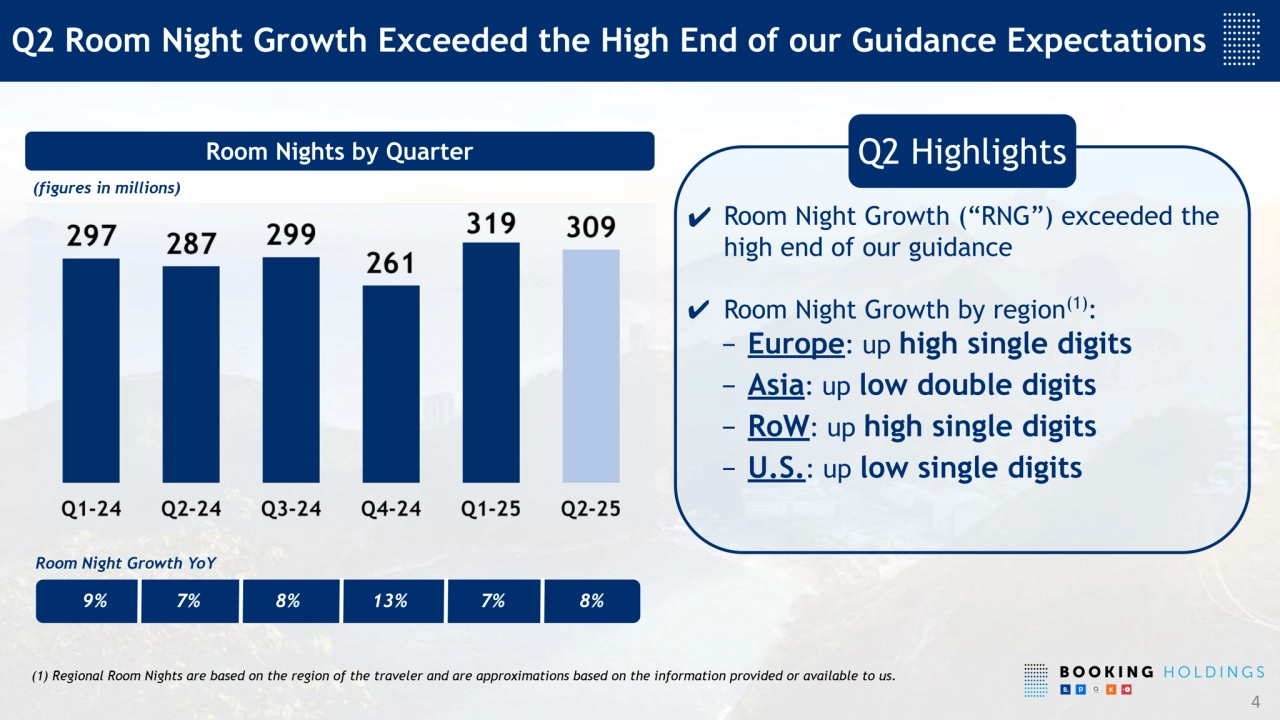
- 4. Q2 Room Night Growth Exceeded the High End of our Guidance Expectations Room Nights by Quarter 4 (figures in millions) Room Night Growth YoY 9% 7% 8% 7% (1) Regional Room Nights are based on the region of the traveler and are approximations based on the information provided or available to us. 13% ✔ Room Night Growth (“RNG”) exceeded the high end of our guidance ✔ Room Night Growth by region (1) : − Europe: up high single digits − Asia: up low double digits − RoW: up high single digits − U.S.: up low single digits Q2 Highlights 8%
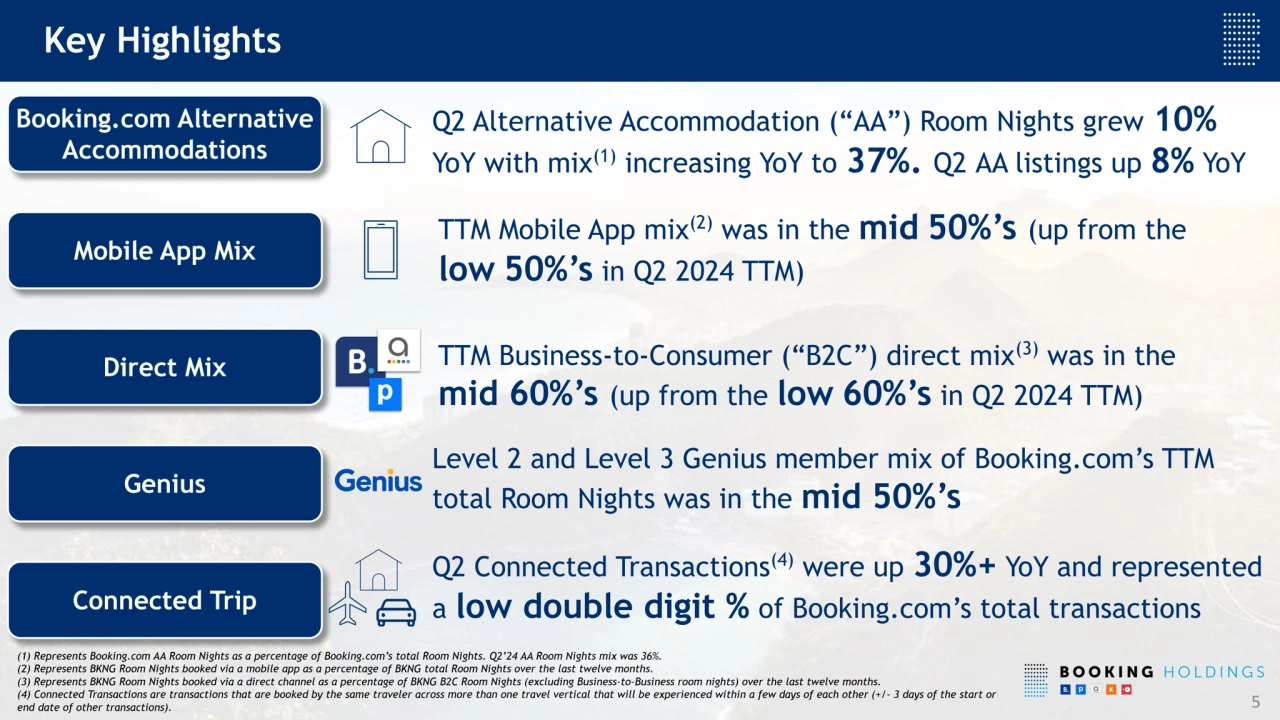
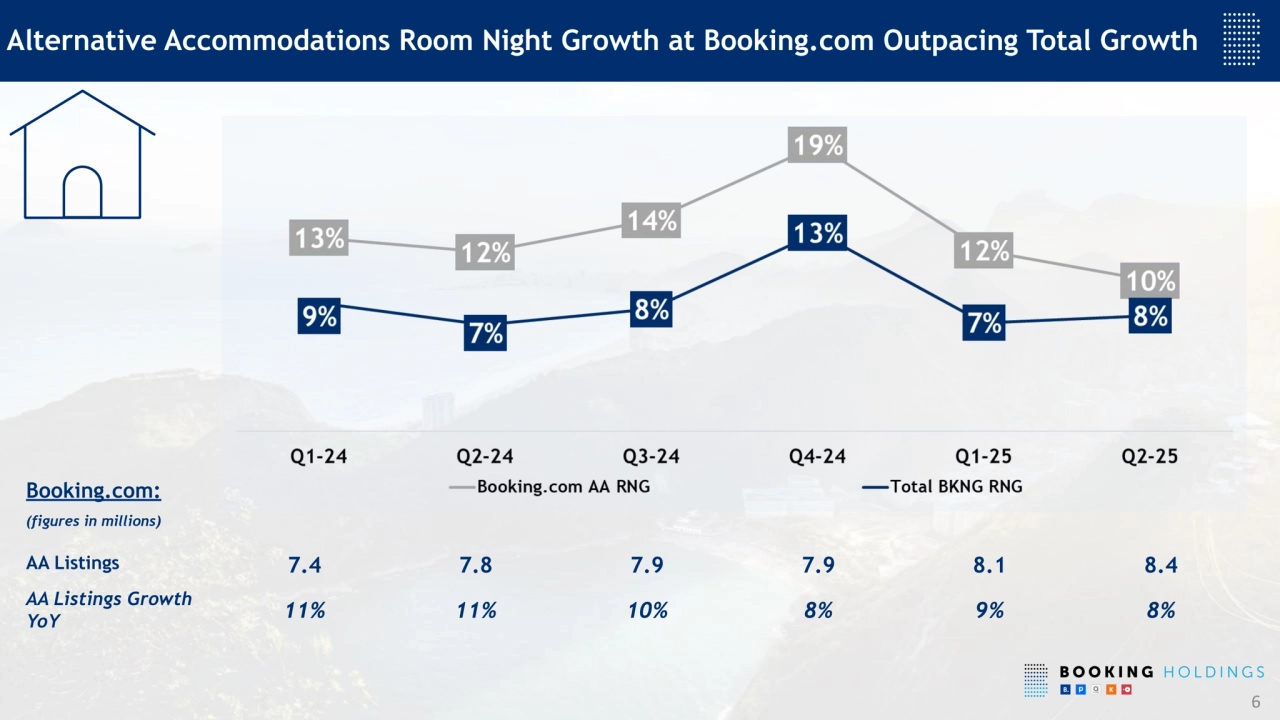
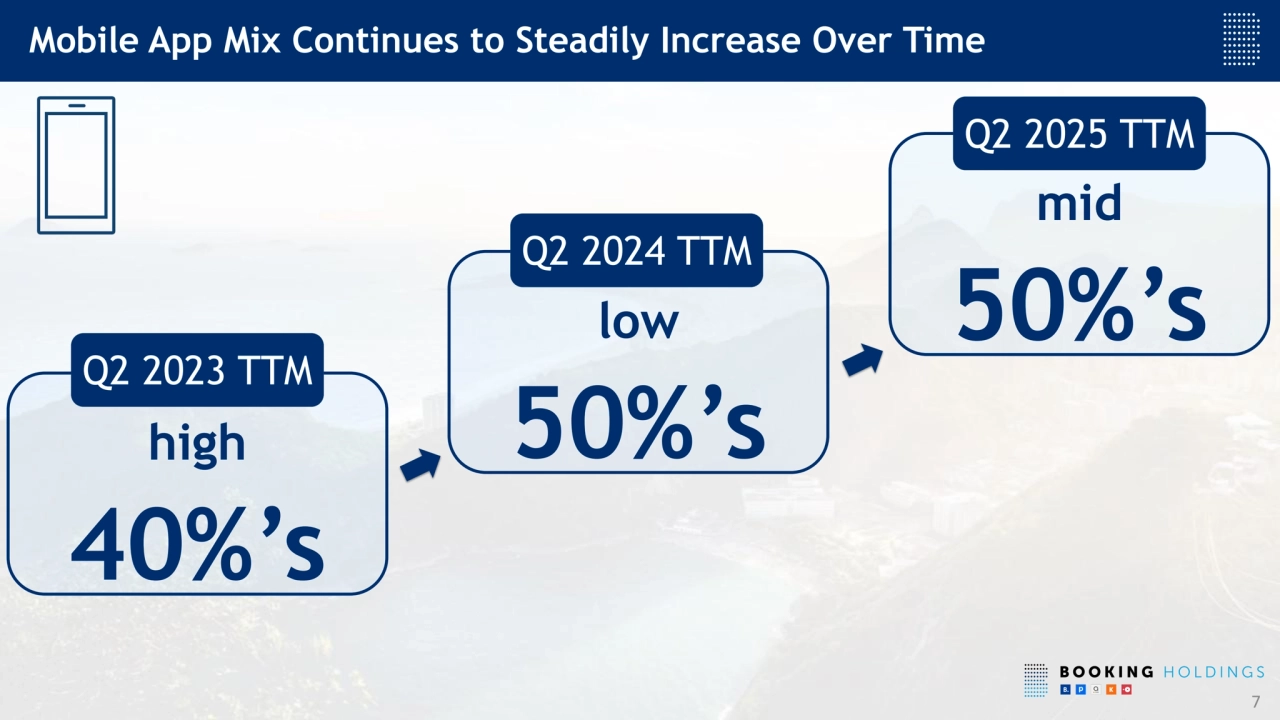
- 5. (1) Represents Booking.com AA Room Nights as a percentage of Booking.com’s total Room Nights. Q2’24 AA Room Nights mix was 36%. (2) Represents BKNG Room Nights booked via a mobile app as a percentage of BKNG total Room Nights over the last twelve months. (3) Represents BKNG Room Nights booked via a direct channel as a percentage of BKNG B2C Room Nights (excluding Business-to-Business room nights) over the last twelve months. (4) Connected Transactions are transactions that are booked by the same traveler across more than one travel vertical that will be experienced within a few days of each other (+/- 3 days of the start or end date of other transactions). 5 Level 2 and Level 3 Genius member mix of Booking.com’s TTM total Room Nights was in the mid 50%’s Key Highlights Mobile App Mix Direct Mix Booking.com Alternative Accommodations Genius Connected Trip TTM Business-to-Consumer (“B2C”) direct mix (3) was in the mid 60%’s (up from the low 60%’s in Q2 2024 TTM) Q2 Alternative Accommodation (“AA”) Room Nights grew 10% YoY with mix(1) increasing YoY to 37%. Q2 AA listings up 8% YoY TTM Mobile App mix (2) was in the mid 50%’s (up from the low 50%’s in Q2 2024 TTM) Q2 Connected Transactions (4) were up 30%+ YoY and represented a low double digit % of Booking.com’s total transactions
- 6. Alternative Accommodations Room Night Growth at Booking.com Outpacing Total Growth 6 Booking.com: (figures in millions) AA Listings 7.4 7.8 7.9 7.9 8.1 8.4 AA Listings Growth YoY 11% 11% 10% 8% 9% 8%
- 7. high 40%’s 7 Mobile App Mix Continues to Steadily Increase Over Time Q2 2023 TTM low 50%’s mid 50%’s Q2 2024 TTM Q2 2025 TTM
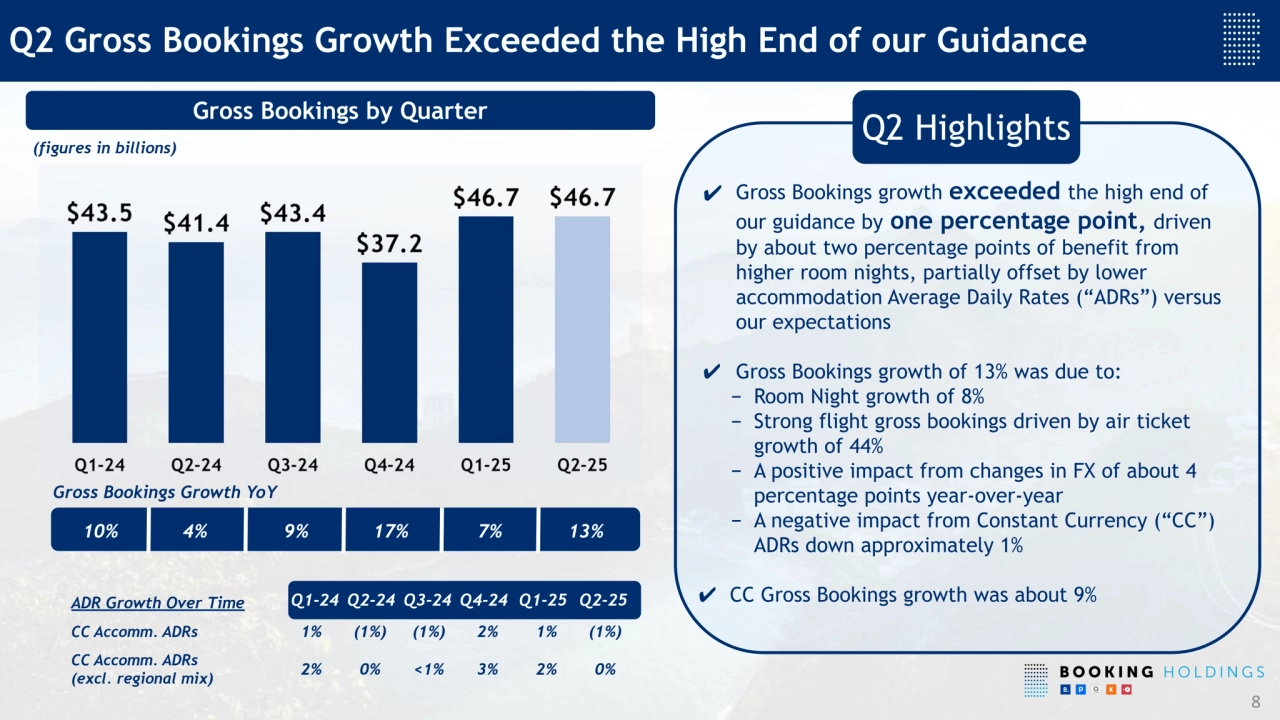
- 8. ✔ Gross Bookings growth exceeded the high end of our guidance by one percentage point, driven by about two percentage points of benefit from higher room nights, partially offset by lower accommodation Average Daily Rates (“ADRs”) versus our expectations ✔ Gross Bookings growth of 13% was due to: − Room Night growth of 8% − Strong flight gross bookings driven by air ticket growth of 44% − A positive impact from changes in FX of about 4 percentage points year-over-year − A negative impact from Constant Currency (“CC”) ADRs down approximately 1% ✔ CC Gross Bookings growth was about 9% ADR Growth Over Time Q1-24 Q2-24 Q3-24 CC Accomm. ADRs 1% (1%) (1%) 2% 1% (1%) CC Accomm. ADRs (excl. regional mix) 2% 0% <1% 3% 2% 0% Gross Bookings by Quarter 8 Q2 Gross Bookings Growth Exceeded the High End of our Guidance 4% Gross Bookings Growth YoY (figures in billions) 9% Q1-24 Q2-24 Q3-24 Q4-24 10% 17% 7% Q1-25 Q2 Highlights 13% Q2-25
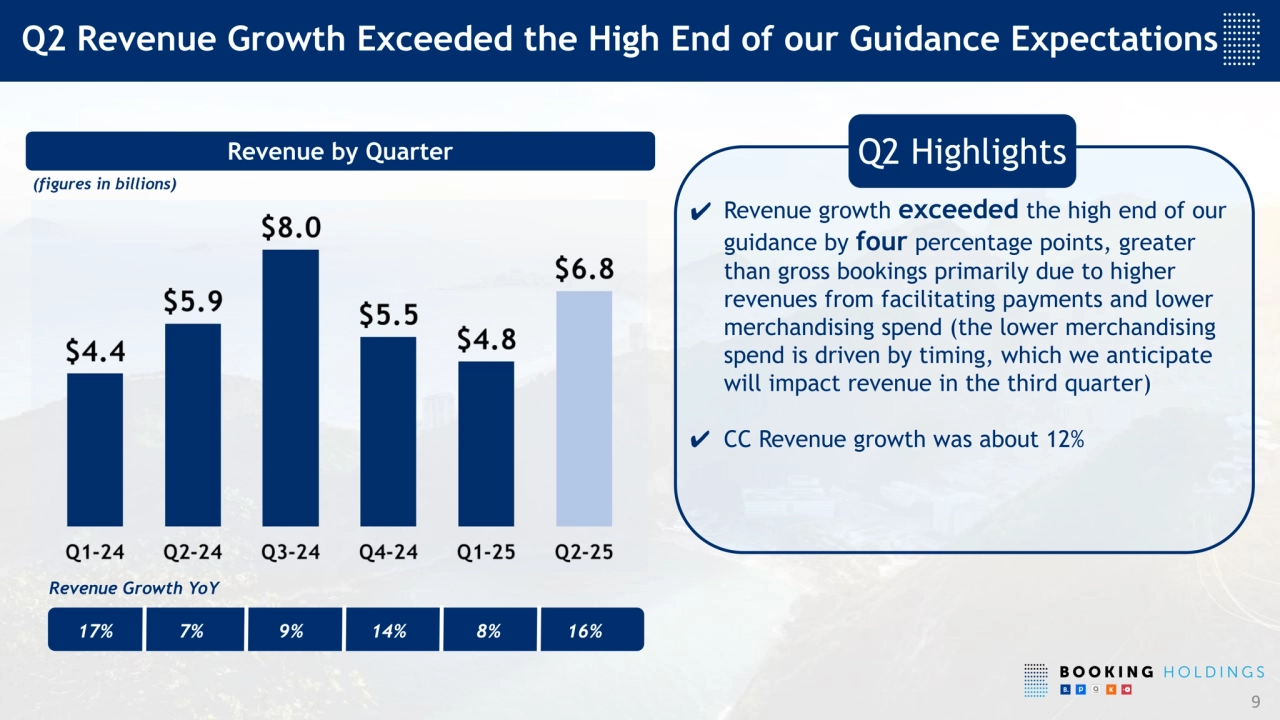
- 9. ✔ Revenue growth exceeded the high end of our guidance by four percentage points, greater than gross bookings primarily due to higher revenues from facilitating payments and lower merchandising spend (the lower merchandising spend is driven by timing, which we anticipate will impact revenue in the third quarter) ✔ CC Revenue growth was about 12% Q2 Revenue Growth Exceeded the High End of our Guidance Expectations Revenue by Quarter 9 (figures in billions) 17% 7% 9% Revenue Growth YoY 14% 8% 16% Q2 Highlights
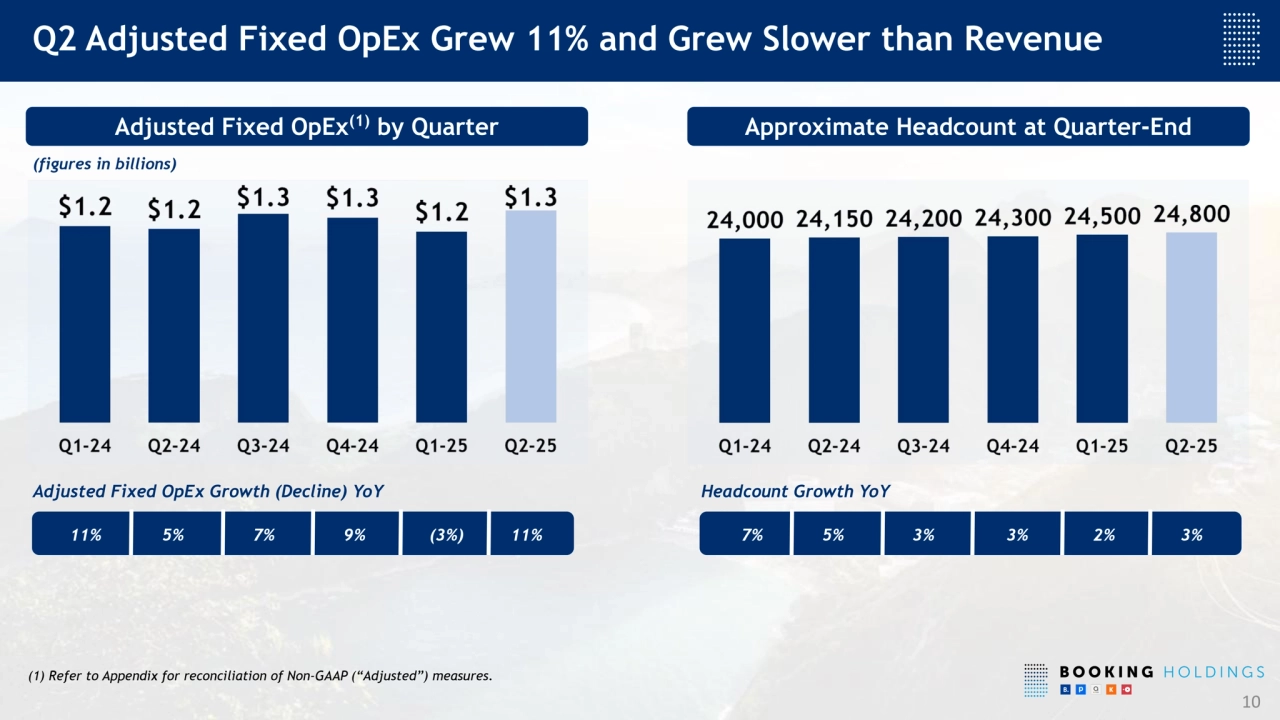
- 10. Q2 Adjusted Fixed OpEx Grew 11% and Grew Slower than Revenue Approximate Headcount at Quarter-End 10 Adjusted Fixed OpEx(1) by Quarter (figures in billions) 11% 5% Adjusted Fixed OpEx Growth (Decline) YoY Headcount Growth YoY 7% 7% 5% 3% (1) Refer to Appendix for reconciliation of Non-GAAP (“Adjusted”) measures. 9% (3%) 11% 3% 2% 3%
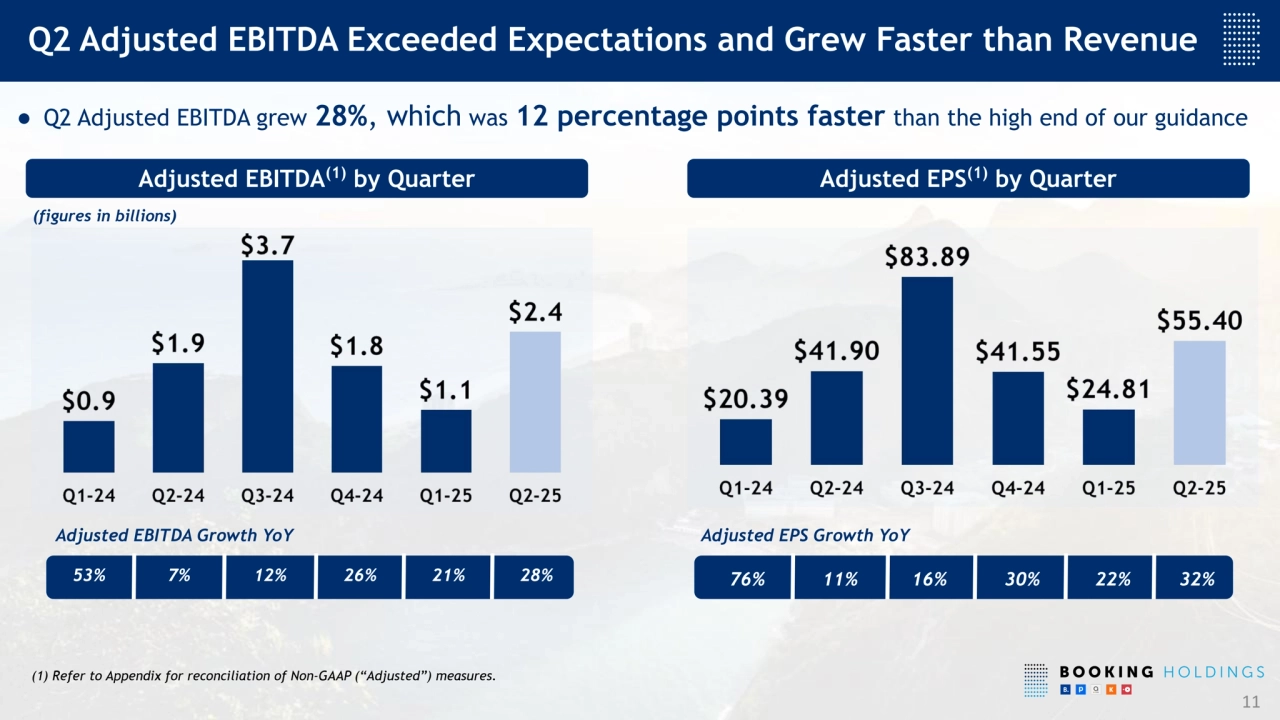
- 11. Adjusted EBITDA Growth YoY Adjusted EPS (1) by Quarter 11 Adjusted EBITDA(1) by Quarter (figures in billions) ● Q2 Adjusted EBITDA grew 28%, which was 12 percentage points faster than the high end of our guidance 76% 11% Adjusted EPS Growth YoY 53% 7% 26% 16% (1) Refer to Appendix for reconciliation of Non-GAAP (“Adjusted”) measures. 12% 21% 30% 22% Q2 Adjusted EBITDA Exceeded Expectations and Grew Faster than Revenue 28% 32%
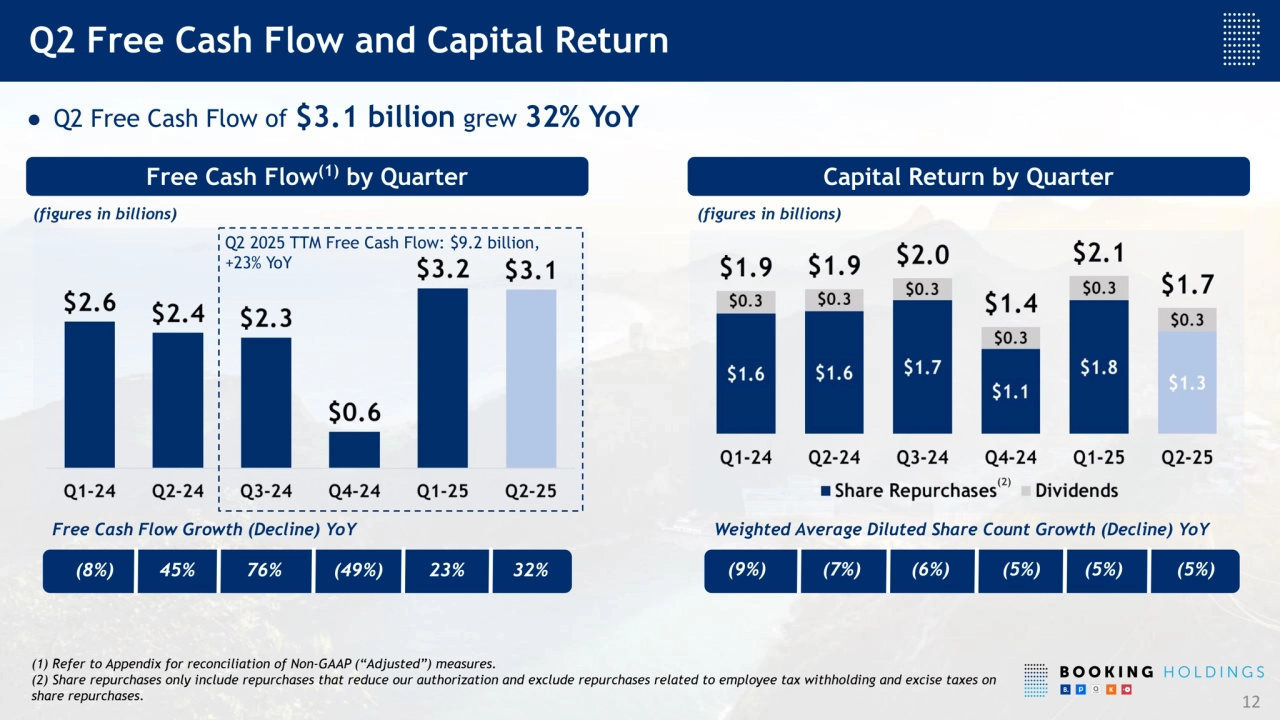
- 12. ● Q2 Free Cash Flow of $3.1 billion grew 32% YoY 12 (figures in billions) Capital Return by Quarter (figures in billions) Free Cash Flow(1) by Quarter Free Cash Flow Growth (Decline) YoY (8%) 45% (49%) (9%) (7%) (6%) (2) Weighted Average Diluted Share Count Growth (Decline) YoY 76% (5%) Q2 Free Cash Flow and Capital Return 23% Q2 2025 TTM Free Cash Flow: $9.2 billion, +23% YoY (5%) (1) Refer to Appendix for reconciliation of Non-GAAP (“Adjusted”) measures. (2) Share repurchases only include repurchases that reduce our authorization and exclude repurchases related to employee tax withholding and excise taxes on share repurchases. 32% (5%)
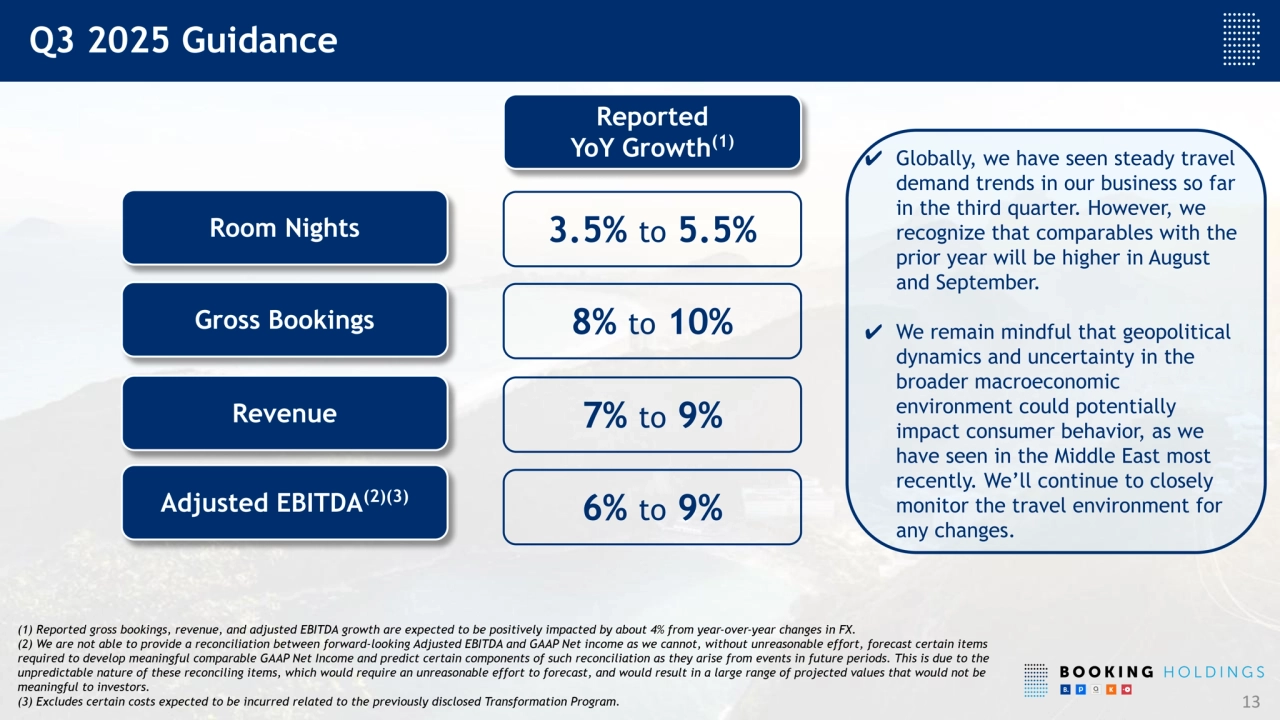
- 13. (1) Reported gross bookings, revenue, and adjusted EBITDA growth are expected to be positively impacted by about 4% from year-over-year changes in FX. (2) We are not able to provide a reconciliation between forward-looking Adjusted EBITDA and GAAP Net income as we cannot, without unreasonable effort, forecast certain items required to develop meaningful comparable GAAP Net Income and predict certain components of such reconciliation as they arise from events in future periods. This is due to the unpredictable nature of these reconciling items, which would require an unreasonable effort to forecast, and would result in a large range of projected values that would not be meaningful to investors. (3) Excludes certain costs expected to be incurred related to the previously disclosed Transformation Program. 13 Room Nights Q3 2025 Guidance Gross Bookings Revenue Adjusted EBITDA(2)(3) Reported YoY Growth (1) ✔ Globally, we have seen steady travel demand trends in our business so far in the third quarter. However, we recognize that comparables with the prior year will be higher in August and September. ✔ We remain mindful that geopolitical dynamics and uncertainty in the broader macroeconomic environment could potentially impact consumer behavior, as we have seen in the Middle East most recently. We’ll continue to closely monitor the travel environment for any changes. 3.5% to 5.5% 8% to 10% 7% to 9% 6% to 9%
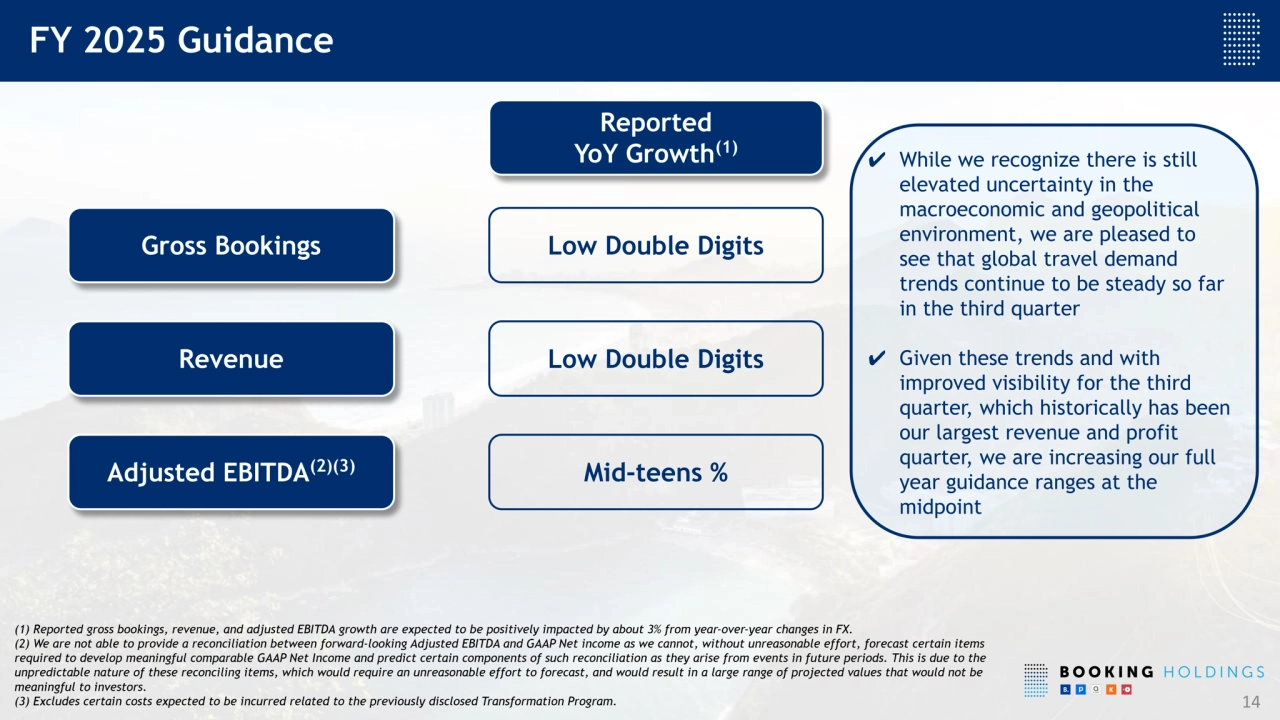
- 14. (1) Reported gross bookings, revenue, and adjusted EBITDA growth are expected to be positively impacted by about 3% from year-over-year changes in FX. (2) We are not able to provide a reconciliation between forward-looking Adjusted EBITDA and GAAP Net income as we cannot, without unreasonable effort, forecast certain items required to develop meaningful comparable GAAP Net Income and predict certain components of such reconciliation as they arise from events in future periods. This is due to the unpredictable nature of these reconciling items, which would require an unreasonable effort to forecast, and would result in a large range of projected values that would not be meaningful to investors. (3) Excludes certain costs expected to be incurred related to the previously disclosed Transformation Program. 14 Gross Bookings FY 2025 Guidance Revenue Adjusted EBITDA(2)(3) Reported YoY Growth (1) ✔ While we recognize there is still elevated uncertainty in the macroeconomic and geopolitical environment, we are pleased to see that global travel demand trends continue to be steady so far in the third quarter ✔ Given these trends and with improved visibility for the third quarter, which historically has been our largest revenue and profit quarter, we are increasing our full year guidance ranges at the midpoint Low Double Digits Low Double Digits Mid-teens %
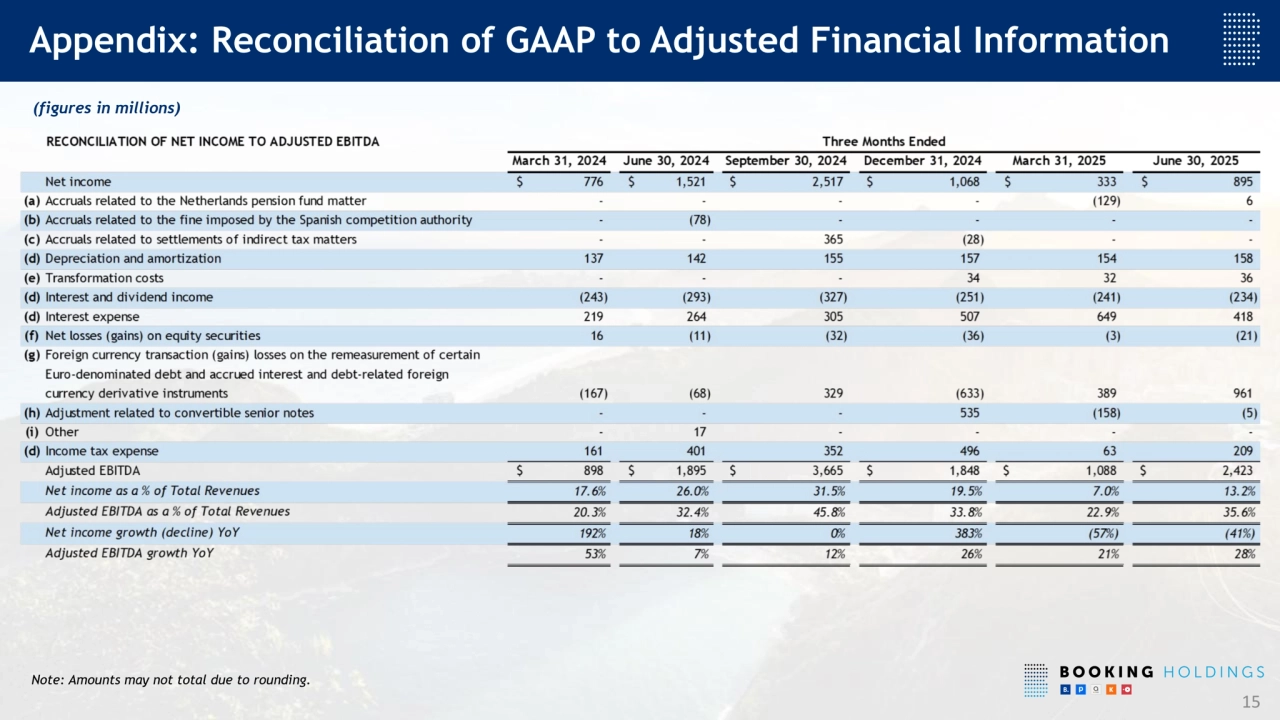
- 15. 15 Appendix: Reconciliation of GAAP to Adjusted Financial Information (figures in millions) Note: Amounts may not total due to rounding.
- 16. 16 Appendix: Reconciliation of GAAP to Adjusted Financial Information Note: Amounts may not total due to rounding. (figures in millions)
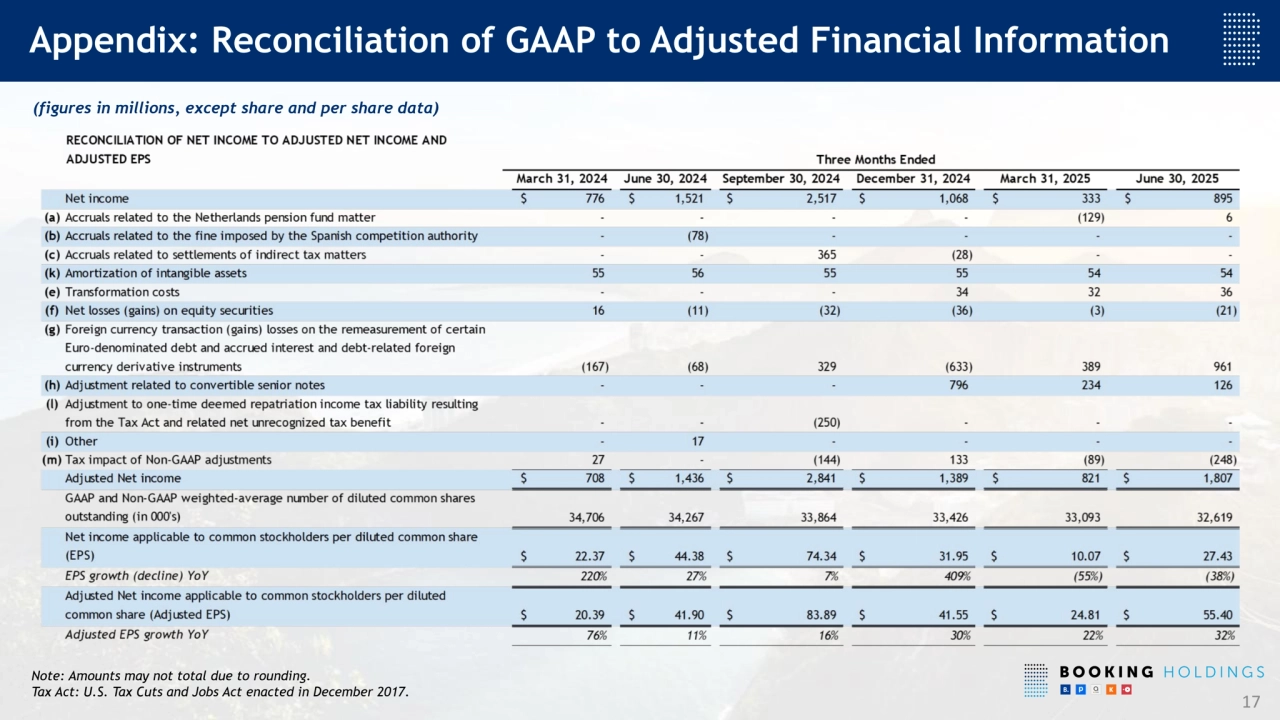
- 17. 17 Appendix: Reconciliation of GAAP to Adjusted Financial Information (figures in millions, except share and per share data) Note: Amounts may not total due to rounding. Tax Act: U.S. Tax Cuts and Jobs Act enacted in December 2017.
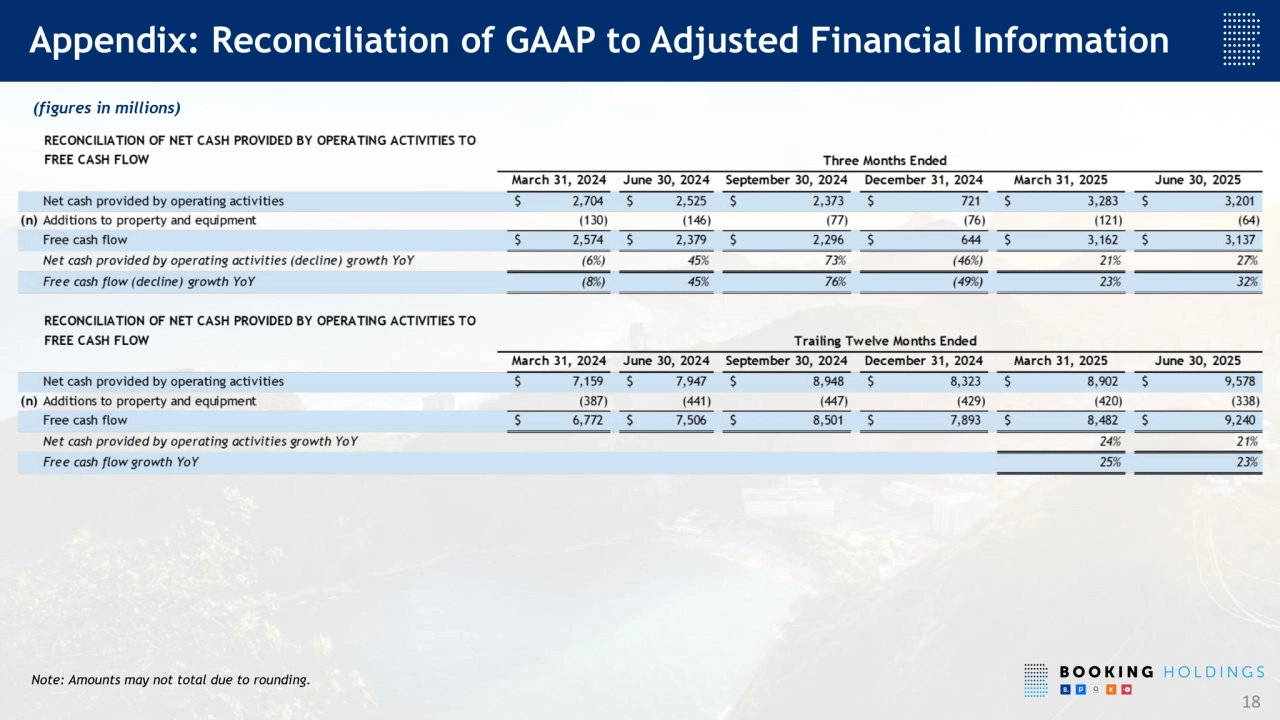
- 18. 18 Appendix: Reconciliation of GAAP to Adjusted Financial Information (figures in millions) Note: Amounts may not total due to rounding.
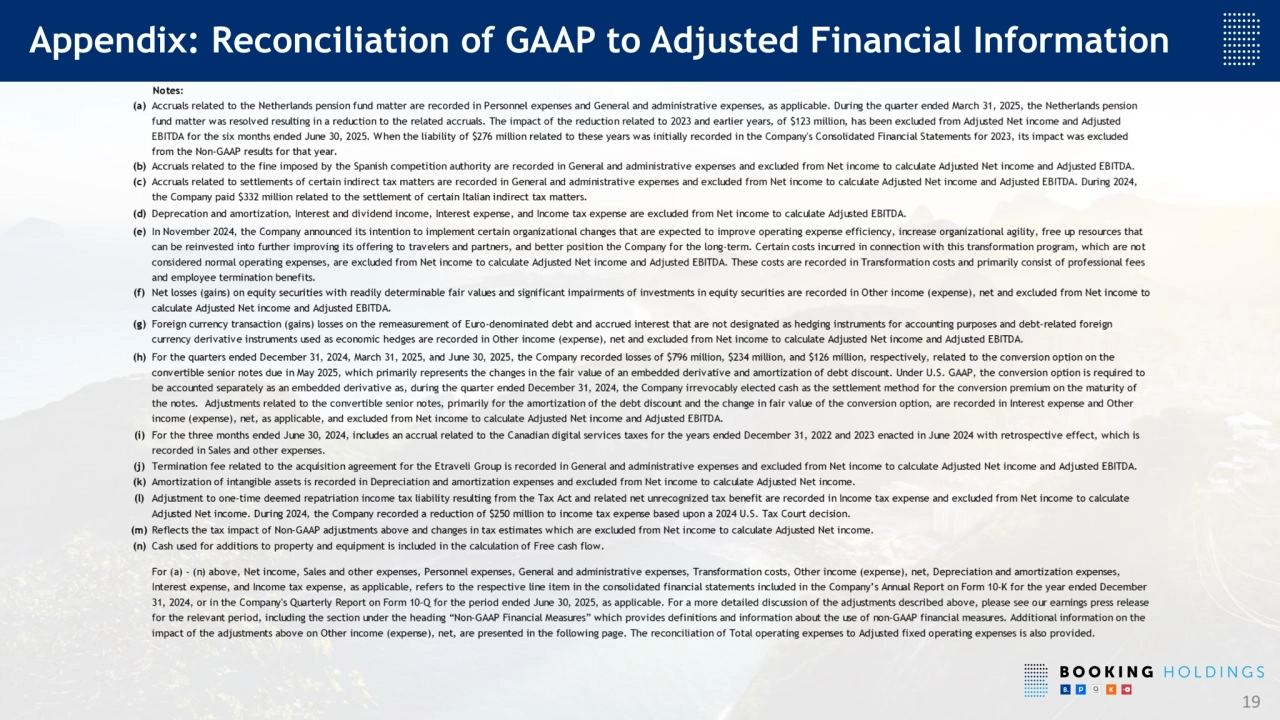
- 19. 19 Appendix: Reconciliation of GAAP to Adjusted Financial Information
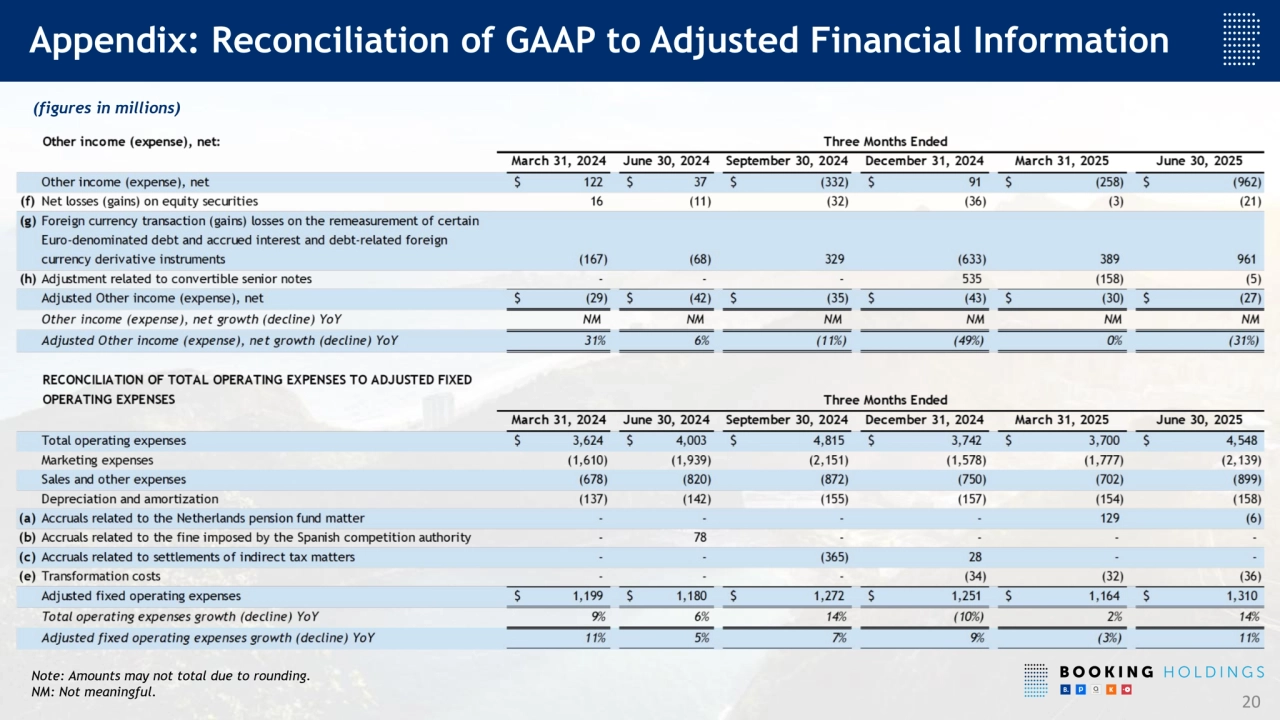
- 20. 20 Appendix: Reconciliation of GAAP to Adjusted Financial Information (figures in millions) Note: Amounts may not total due to rounding. NM: Not meaningful.