Check Point: 2025 Q2 Financial Results
 AI Summary
Key Insights
- 📈 Revenue & EPS: Revenues and EPS inline with projections.
- 🚀 Appliance Demand: Quantum Force Appliance demand accelerated.
- 📧 Demand Surge: Continued strong demand for Email, SASE and ERM.
- 💰 Profitability: Exhibits strong profitability.
- 🔮 Business Outlook: Provided a business outlook.


Check Point: 2025 Q2 Financial Results
- 1. ©2025 Check Point Software Technologies Ltd. 1 July 30 , 2025 2025 Second Quarter Financial Results Kip E. Meintzer Global Head of IR Nadav Zafrir CEO Roei Golan CFO
- 2. ©2025 Check Point Software Technologies Ltd. 2 Forward Looking Statement This presentation may contain certain forward-looking statements. These forward-looking statements generally relate to future events or our future financial or operating performance. Forward-looking statements in this report include, but are not limited to: Our expectations regarding our products and solutions, expectations related to cybersecurity and other threats, and our financial projections for the future quarter and year end results. Our expectations and beliefs regarding these matters may not materialize, and actual results or events in the future are subject to risks and uncertainties that could cause actual results or events to differ materially from those projected. These risks include our ability to continue to develop platform capabilities and solutions; customer acceptance and purchase of our existing products and solutions and new products and solutions; the market for IT security continuing to develop; competition from other products and services; and general market, political, economic, and business conditions, including acts terrorism or war. These forward-looking statements are also subject to other risks and uncertainties, including those more fully described in our filings with the Securities and Exchange Commission, including our Annual Report on Form 20-F filed with the Securities and Exchange Commission on March 17, 2025. The forward-looking statements in this presentation are based on information available to Check Point as of the date hereof, and Check Point disclaims any obligation to update any forward-looking statements, except as required by law. In this presentation and in our press release, which has been posted on our website, we present GAAP and non-GAAP results, along with a reconciliation of such results as well as the reasons for our presentation of non-GAAP information.
- 3. ©2025 Check Point Software Technologies Ltd. ©2025 Check Point Software Technologies Ltd. 3 Financial Results
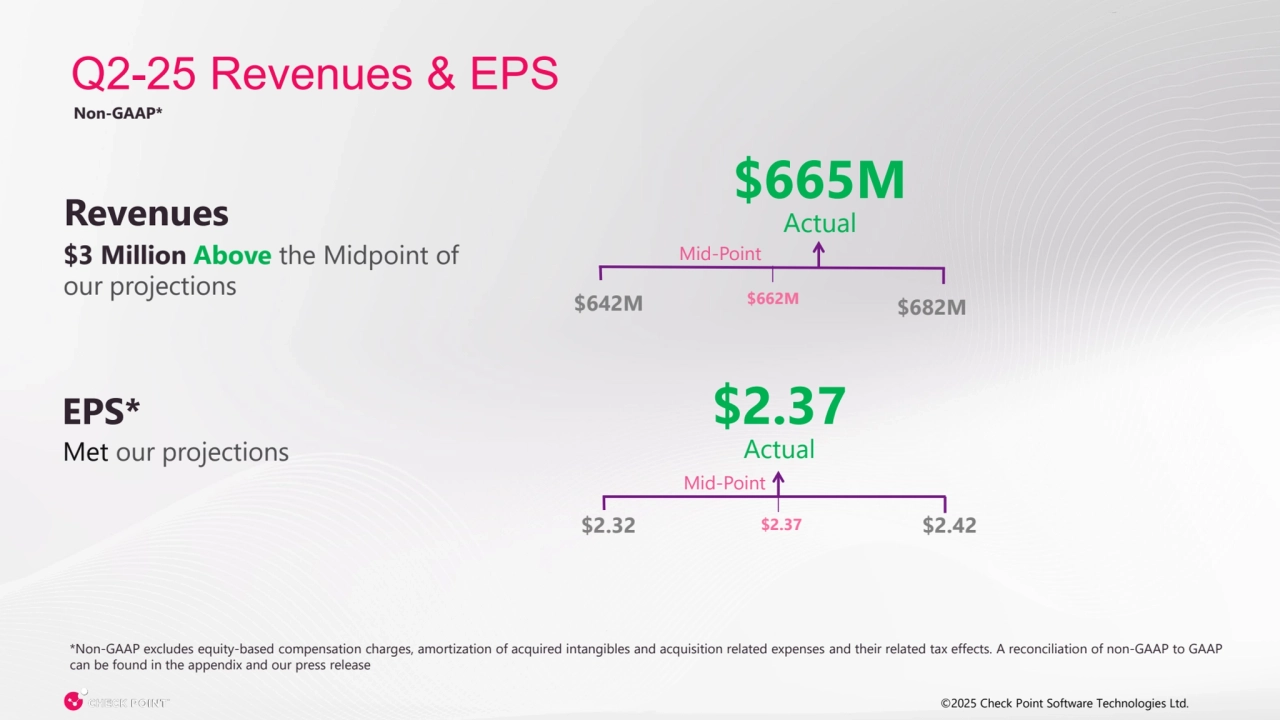
- 4. ©2025 Check Point Software Technologies Ltd. ©2025 Check Point Software Technologies Ltd. 4 Q2-25 Revenues & EPS Revenues $3 Million Above the Midpoint of our projections $665M Actual $642M $682M $2.32 $2.42 *Non-GAAP excludes equity-based compensation charges, amortization of acquired intangibles and acquisition related expenses and their related tax effects. A reconciliation of non-GAAP to GAAP can be found in the appendix and our press release EPS* Met our projections $2.37 Actual Non-GAAP* Mid-Point Mid-Point $2.37 $662M
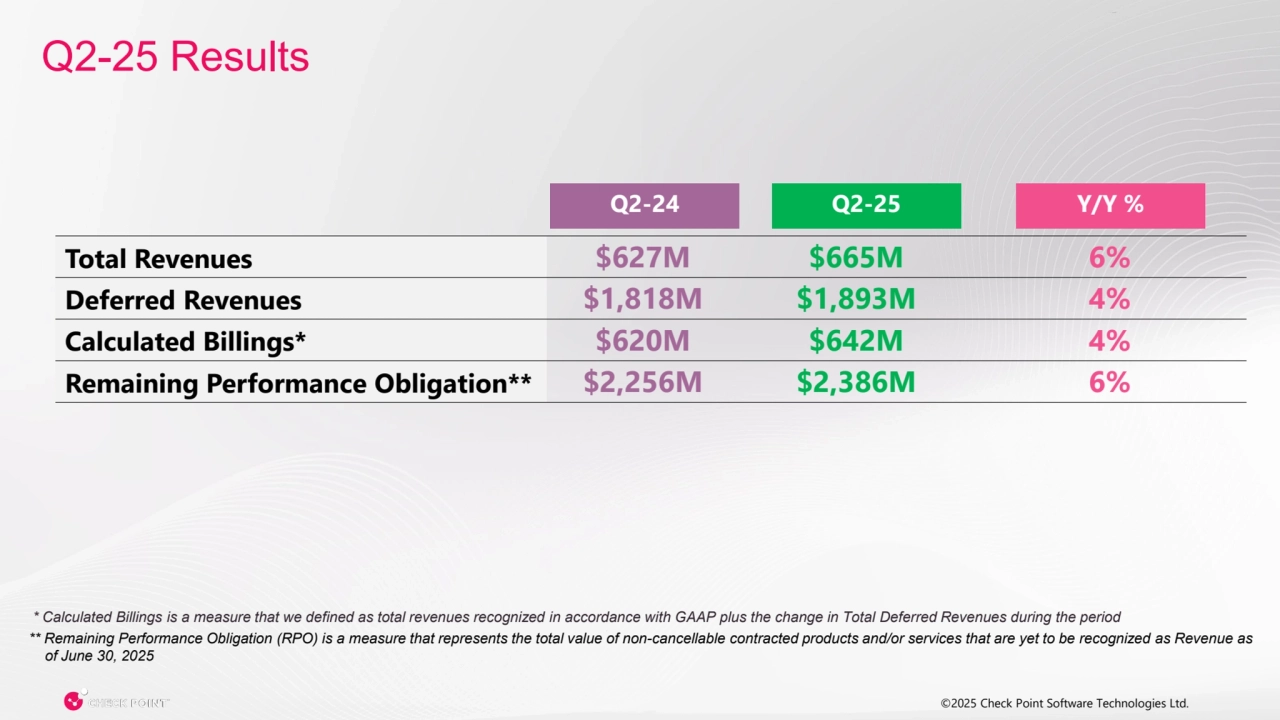
- 5. ©2025 Check Point Software Technologies Ltd. ©2025 Check Point Software Technologies Ltd. 5 Total Revenues $627M $665M 6% Deferred Revenues $1,818M $1,893M 4% Calculated Billings* $620M $642M 4% Remaining Performance Obligation** $2,256M $2,386M 6% Q2-24 Q2-25 Y/Y % Q2-25 Results * Calculated Billings is a measure that we defined as total revenues recognized in accordance with GAAP plus the change in Total Deferred Revenues during the period ** Remaining Performance Obligation (RPO) is a measure that represents the total value of non-cancellable contracted products and/or services that are yet to be recognized as Revenue as of June 30, 2025
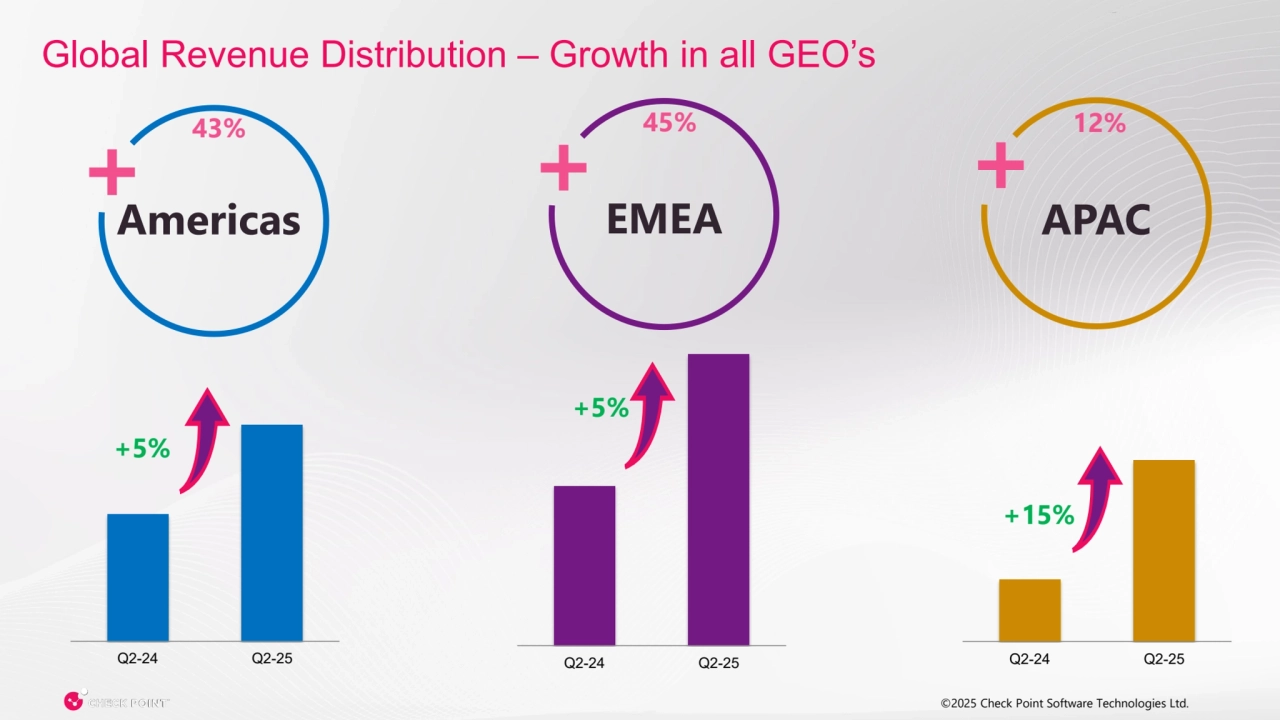
- 6. ©2025 Check Point Software Technologies Ltd. ©2025 Check Point Software Technologies Ltd. 6 Q2-24 Q2-25 +15% Global Revenue Distribution – Growth in all GEO’s Americas + Q2-24 Q2-25 Q2-24 Q2-25 +5% EMEA APAC + + +5% 43% 45% 12%
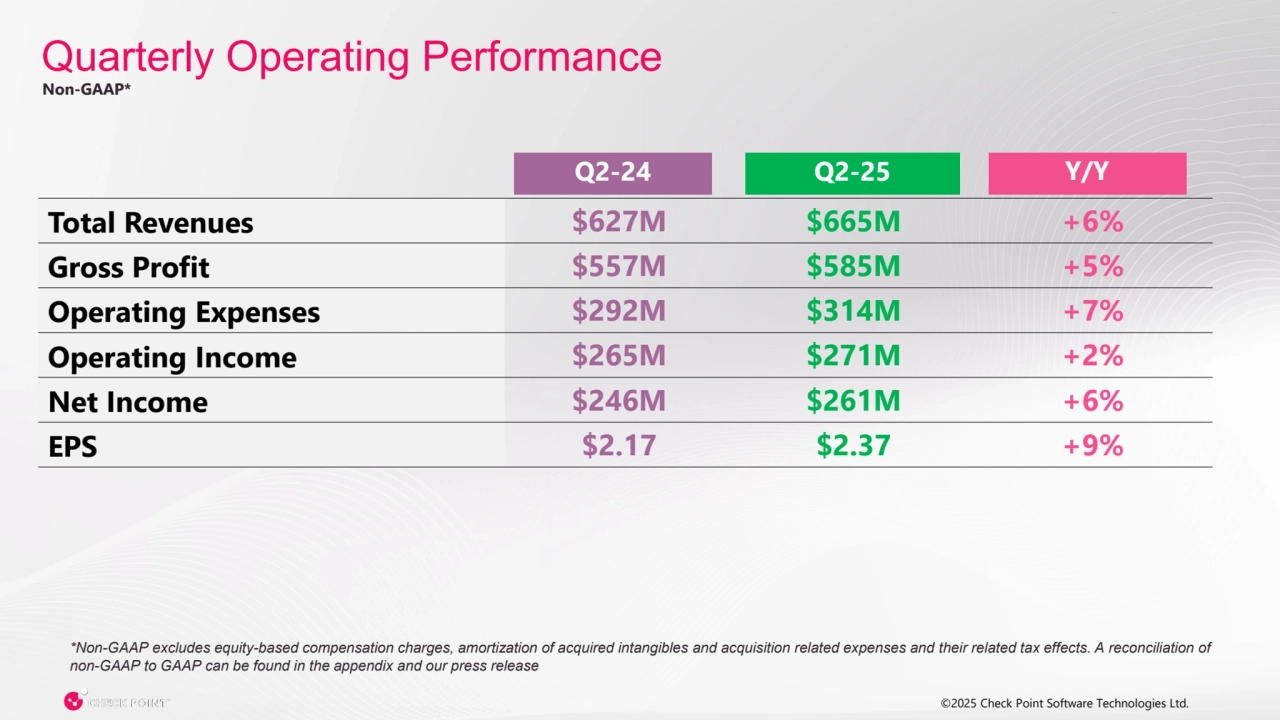
- 7. ©2025 Check Point Software Technologies Ltd. ©2025 Check Point Software Technologies Ltd. 7 YOY Total Revenues $627M $665M +6% Gross Profit $557M $585M +5% Operating Expenses $292M $314M +7% Operating Income $265M $271M +2% Net Income $246M $261M +6% EPS $2.17 $2.37 +9% Q2-24 Q2-25 Y/Y Quarterly Operating Performance *Non-GAAP excludes equity-based compensation charges, amortization of acquired intangibles and acquisition related expenses and their related tax effects. A reconciliation of non-GAAP to GAAP can be found in the appendix and our press release Non-GAAP*
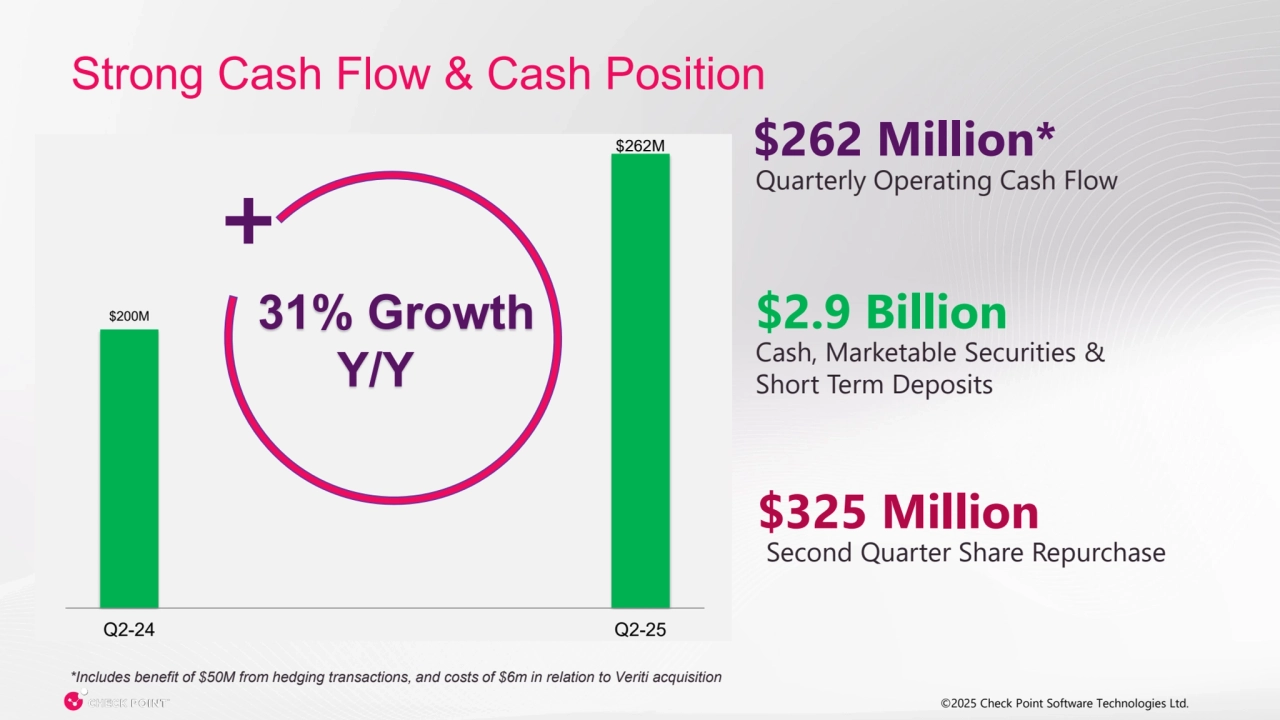
- 8. ©©2025 Check Point Software Technologies Ltd. 2025 Check Point Software Technologies Ltd. 8 Strong Cash Flow & Cash Position Quarterly Operating Cash Flow $262 Million* $200M $262M Q2-24 Q2-25 + 31% Growth Y/Y $2.9 Billion Cash, Marketable Securities & Short Term Deposits $325 Million Second Quarter Share Repurchase *Includes benefit of $50M from hedging transactions, and costs of $6m in relation to Veriti acquisition
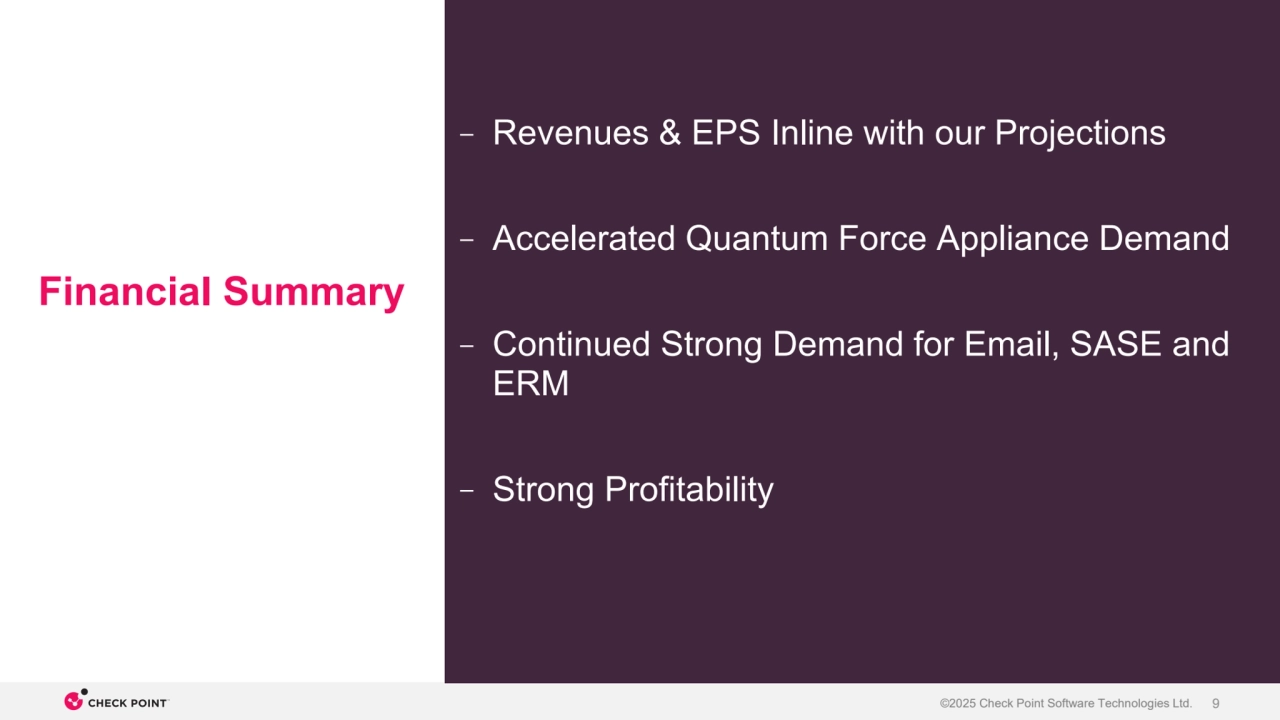
- 9. ©2025 Check Point Software Technologies Ltd. 9 – Revenues & EPS Inline with our Projections – Accelerated Quantum Force Appliance Demand – Continued Strong Demand for Email, SASE and ERM – Strong Profitability Financial Summary
- 10. ©2025 Check Point Software Technologies Ltd. ©2025 Check Point Software Technologies Ltd. 10 Business Outlook
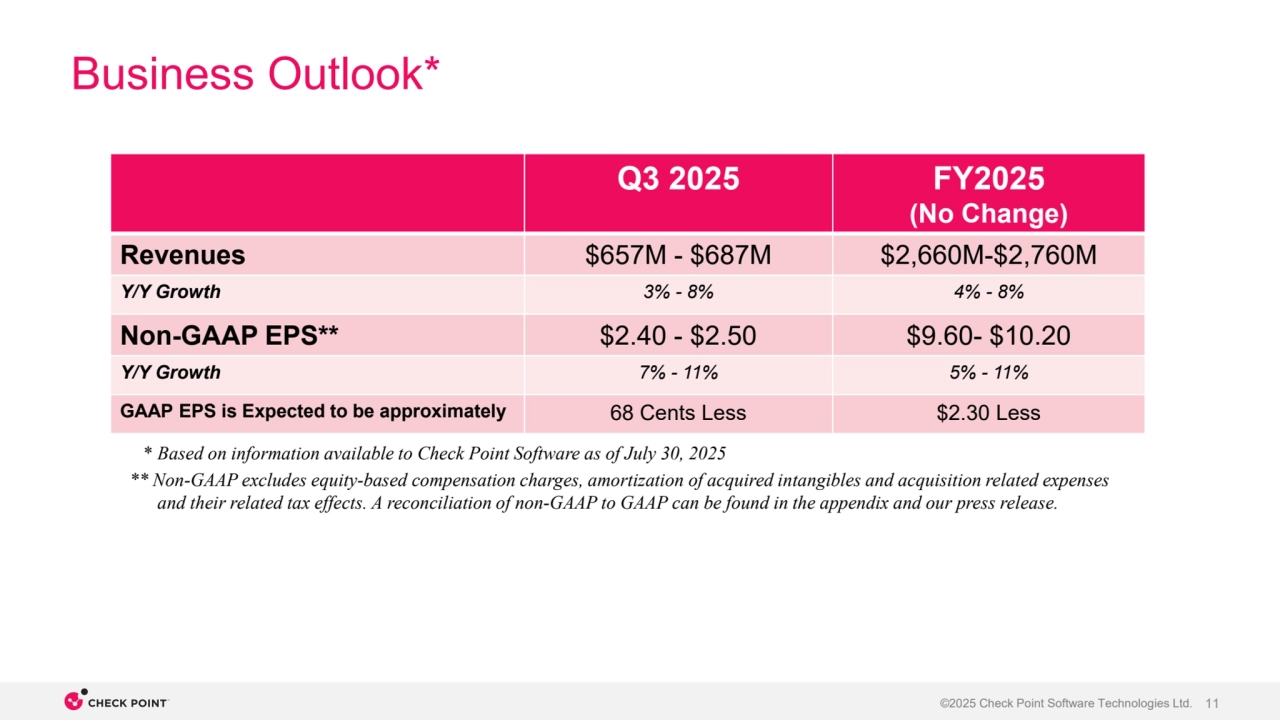
- 11. ©2025 Check Point Software Technologies Ltd. 11 Business Outlook* Q3 2025 FY2025 (No Change) Revenues $657M - $687M $2,660M-$2,760M Y/Y Growth 3% - 8% 4% - 8% Non-GAAP EPS** $2.40 - $2.50 $9.60- $10.20 Y/Y Growth 7% - 11% 5% - 11% GAAP EPS is Expected to be approximately 68 Cents Less $2.30 Less * Based on information available to Check Point Software as of July 30, 2025 ** Non-GAAP excludes equity-based compensation charges, amortization of acquired intangibles and acquisition related expenses and their related tax effects. A reconciliation of non-GAAP to GAAP can be found in the appendix and our press release.
- 12. ©2025 Check Point Software Technologies Ltd. 12 Q&A Session
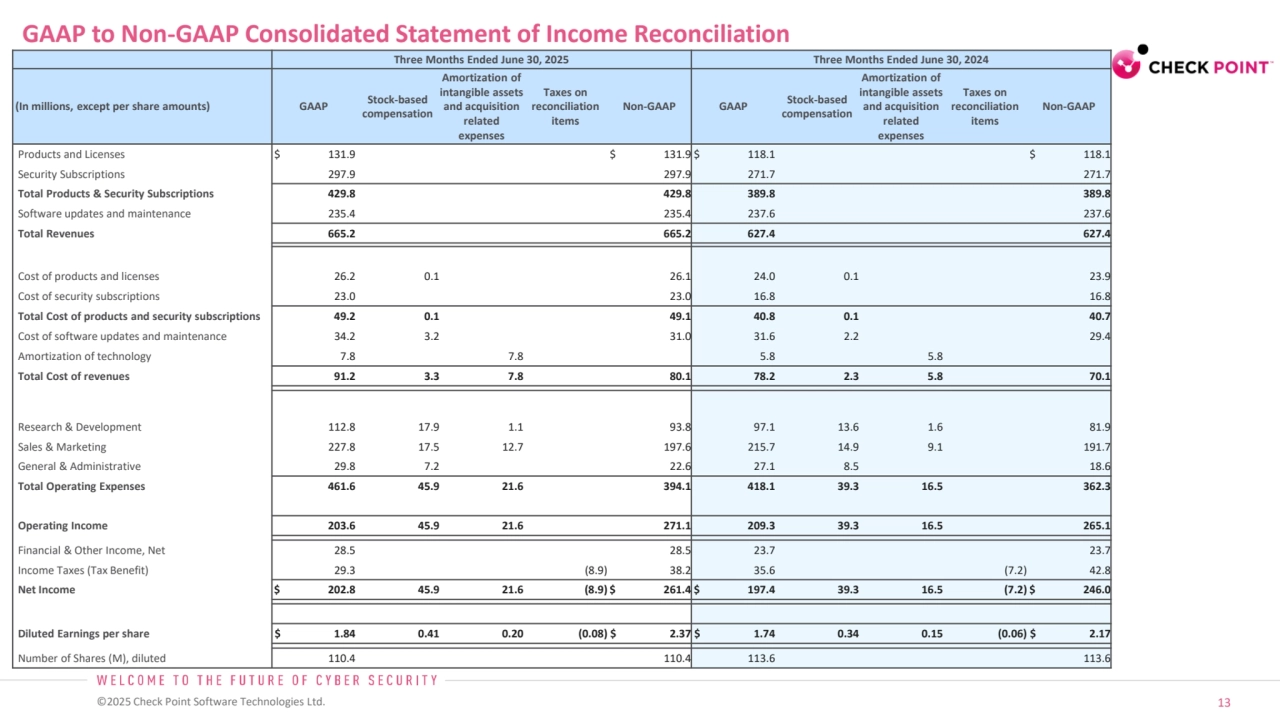
- 13. ©2025 Check Point Software Technologies Ltd. 13 GAAP to Non-GAAP Consolidated Statement of Income Reconciliation Three Months Ended June 30, 2025 Three Months Ended June 30, 2024 (In millions, except per share amounts) GAAP Stock-based compensation Amortization of intangible assets and acquisition related expenses Taxes on reconciliation items Non-GAAP GAAP Stock-based compensation Amortization of intangible assets and acquisition related expenses Taxes on reconciliation items Non-GAAP Products and Licenses $ 131.9 $ 131.9 $ 118.1 $ 118.1 Security Subscriptions 297.9 297.9 271.7 271.7 Total Products & Security Subscriptions 429.8 429.8 389.8 389.8 Software updates and maintenance 235.4 235.4 237.6 237.6 Total Revenues 665.2 665.2 627.4 627.4 Cost of products and licenses 26.2 0.1 26.1 24.0 0.1 23.9 Cost of security subscriptions 23.0 23.0 16.8 16.8 Total Cost of products and security subscriptions 49.2 0.1 49.1 40.8 0.1 40.7 Cost of software updates and maintenance 34.2 3.2 31.0 31.6 2.2 29.4 Amortization of technology 7.8 7.8 5.8 5.8 Total Cost of revenues 91.2 3.3 7.8 80.1 78.2 2.3 5.8 70.1 Research & Development 112.8 17.9 1.1 93.8 97.1 13.6 1.6 81.9 Sales & Marketing 227.8 17.5 12.7 197.6 215.7 14.9 9.1 191.7 General & Administrative 29.8 7.2 22.6 27.1 8.5 18.6 Total Operating Expenses 461.6 45.9 21.6 394.1 418.1 39.3 16.5 362.3 Operating Income 203.6 45.9 21.6 271.1 209.3 39.3 16.5 265.1 Financial & Other Income, Net 28.5 28.5 23.7 23.7 Income Taxes (Tax Benefit) 29.3 (8.9) 38.2 35.6 (7.2) 42.8 Net Income $ 202.8 45.9 21.6 (8.9) $ 261.4 $ 197.4 39.3 16.5 (7.2) $ 246.0 Diluted Earnings per share $ 1.84 0.41 0.20 (0.08) $ 2.37 $ 1.74 0.34 0.15 (0.06) $ 2.17 Number of Shares (M), diluted 110.4 110.4 113.6 113.6
- 14. ©2025 Check Point Software Technologies Ltd. 14 GAAP to Non-GAAP Consolidated Statement of Income Reconciliation Six Months Ended June 30, 2025 Six Months Ended June 30, 2024 (In millions, except per share amounts) GAAP Stock-based compensation Amortization of intangible assets and acquisition related expenses Taxes on reconciliation items Non-GAAP GAAP Stock-based compensation Amortization of intangible assets and acquisition related expenses Taxes on reconciliation items Non-GAAP Products and Licenses $ 246.0 $ 246.0 $ 218.4 $ 218.4 Security Subscriptions 588.5 588.5 535.1 535.1 Total Products & Security Subscriptions 834.5 834.5 753.5 753.5 Software updates and maintenance 468.5 468.5 472.7 472.7 Total Revenues 1,303.0 1,303.0 1,226.2 1,226.2 Cost of products and licenses 49.2 0.2 49.0 43.9 0.2 43.7 Cost of security subscriptions 44.4 44.4 33.3 33.3 Total Cost of products and security subscriptions 93.6 0.2 93.4 77.2 0.2 77.0 Cost of software updates and maintenance 66.3 5.3 61.0 60.3 4.4 55.9 Amortization of technology 15.4 15.4 11.6 11.6 Total Cost of revenues 175.3 5.5 15.4 154.4 149.1 4.6 11.6 132.9 Research & Development 214.9 32.6 2.6 179.7 196.3 28.3 3.2 164.8 Sales & Marketing 453.2 32.1 25.5 395.6 421.9 30.8 18.2 372.9 General & Administrative 60.5 16.9 43.6 55.7 17.2 38.5 Total Operating Expenses 903.9 87.1 43.5 773.3 823.0 80.9 33.0 709.1 Operating Income 399.1 87.1 43.5 529.7 403.2 80.9 33.0 517.1 Financial & Other Income, Net 55.8 55.8 46.3 46.3 Income Taxes (Tax Benefit) 61.2 (16.7) 77.9 68.2 (14.7) 82.9 Net Income $ 393.7 87.1 43.5 (16.7) $ 507.6 $ 381.3 80.9 33.0 (14.7) $ 480.5 Diluted Earnings per share $ 3.55 0.78 0.40 (0.15) $ 4.58 $ 3.34 0.70 0.30 (0.13) $ 4.21 Number of Shares (M), diluted 110.9 110.9 114.2 114.2