Chevron's Financial Highlights Q2 2025
 AI Summary
Key Insights
- [object Object]
- [object Object]
- [object Object]
- [object Object]
- [object Object]


Chevron's Financial Highlights Q2 2025
- 1. © 2025 Chevron Bakken Second quarter 2025 earnings call August 1, 2025
- 2. © 2025 Chevron 2 CAUTIONARY STATEMENTS RELEVANT TO FORWARD-LOOKING INFORMATION FOR THE PURPOSE OF “SAFE HARBOR” PROVISIONS OF THE PRIVATE SECURITIES LITIGATION REFORM ACT OF 1995 This presentation contains forward-looking images and statements relating to Chevron’s operations, assets, and strategy that are based on management’s current expectations, estimates, and projections about the petroleum, chemicals, and other energy-related industries. Words or phrases such as “anticipates,” “expects,” “intends,” “plans,” “targets,” “advances,” “commits,” “drives,” “aims,” “forecasts,” “projects,” “believes,” “approaches,” “seeks,” “schedules,” “estimates,” “positions,” “pursues,” “progress,” “design,” “enable,” “may,” “can,” “could,” “should,” “will,” “budgets,” “outlook,” “trends,” “guidance,” “focus,” “on track,” “trajectory,” “goals,” “objectives,” “strategies,” “opportunities,” “poised,” “potential,” “ambitions,” “future,” “aspires” and similar expressions, and variations or negatives of these words, are intended to identify such forward looking statements, but not all forward-looking statements include such words. These statements are not guarantees of future performance and are subject to numerous risks, uncertainties and other factors, many of which are beyond the company’s control and are difficult to predict. Therefore, actual outcomes and results may differ materially from what is expressed or forecasted in such forward-looking statements. The reader should not place undue reliance on these forward-looking statements, which speak only as of the date of this document. Unless legally required, Chevron undertakes no obligation to update publicly any forward-looking statements, whether as a result of new information, future events or otherwise. Among the important factors that could cause actual results to differ materially from those in the forward-looking statements are: changing crude oil and natural gas prices and demand for the company’s products, and production curtailments due to market conditions; crude oil production quotas or other actions that might be imposed by the Organization of Petroleum Exporting Countries and other producing countries; technological advancements; changes to government policies in the countries in which the company operates; public health crises, such as pandemics and epidemics, and any related government policies and actions; disruptions in the company’s global supply chain, including supply chain constraints and escalation of the cost of goods and services; changing economic, regulatory and political environments in the various countries in which the company operates; general domestic and international economic, market and political conditions, including the conflict between Russia and Ukraine, the conflict in the Middle East and the global response to these hostilities; changing refining, marketing and chemicals margins; the company’s ability to realize anticipated cost savings and efficiencies associated with enterprise structural cost reduction initiatives; actions of competitors or regulators; timing of exploration expenses; changes in projected future cash flows; timing of crude oil liftings; uncertainties about the estimated quantities of crude oil, natural gas liquids and natural gas reserves; the competitiveness of alternate-energy sources or product substitutes; pace and scale of the development of large carbon capture and offset markets; the results of operations and financial condition of the company’s suppliers, vendors, partners and equity affiliates; the inability or failure of the company’s joint-venture partners to fund their share of operations and development activities; the potential failure to achieve expected net production from existing and future crude oil and natural gas development projects; potential delays in the development, construction or start-up of planned projects; the potential disruption or interruption of the company’s operations due to war, accidents, political events, civil unrest, severe weather, cyber threats, terrorist acts, or other natural or human causes beyond the company’s control; the potential liability for remedial actions or assessments under existing or future environmental regulations and litigation; significant operational, investment or product changes undertaken or required by existing or future environmental statutes and regulations, including international agreements and national or regional legislation and regulatory measures related to greenhouse gas emissions and climate change; the potential liability resulting from pending or future litigation; the company’s ability to successfully integrate the operations of the company and Hess Corporation and achieve the anticipated benefits and projected synergies from the transaction; the company’s future acquisitions or dispositions of assets or shares or the delay or failure of such transactions to close based on required closing conditions; the potential for gains and losses from asset dispositions or impairments; government mandated sales, divestitures, recapitalizations, taxes and tax audits, tariffs, sanctions, changes in fiscal terms or restrictions on scope of company operations; foreign currency movements compared with the U.S. dollar; higher inflation and related impacts; material reductions in corporate liquidity and access to debt markets; changes to the company’s capital allocation strategies; the effects of changed accounting rules under generally accepted accounting principles promulgated by rule-setting bodies; the company’s ability to identify and mitigate the risks and hazards inherent in operating in the global energy industry; and the factors set forth under the heading “Risk Factors” on pages 20 through 27 of the company’s 2024 Annual Report on Form 10-K and in subsequent filings with the U.S. Securities and Exchange Commission. Other unpredictable or unknown factors not discussed in this document could also have material adverse effects on forward-looking statements. As used in this presentation, the term “Chevron” and such terms as “the company,” “the corporation,” “our,” “we,” “us” and “its” may refer to Chevron Corporation, one or more of its consolidated subsidiaries, or to all of them taken as a whole. All of these terms are used for convenience only and are not intended as a precise description of any of the separate companies, each of which manages its own affairs. Terms such as “resources” may be used in this presentation to describe certain aspects of Chevron’s portfolio and oil and gas properties beyond the proved reserves. For definitions of, and further information regarding, this and other terms, see the “Glossary of Energy and Financial Terms” on pages 26 through 27 of Chevron’s 2024 Supplement to the Annual Report. This and other reports, publications, and data supplements, as well as a "Sensitivities and Forward Guidance" document that is updated quarterly, are available at chevron.com. This presentation is meant to be read in conjunction with the Second Quarter 2025 Transcript posted on Chevron.com under the headings “Investors,” “Events & Presentations.” Cautionary statement and additional information
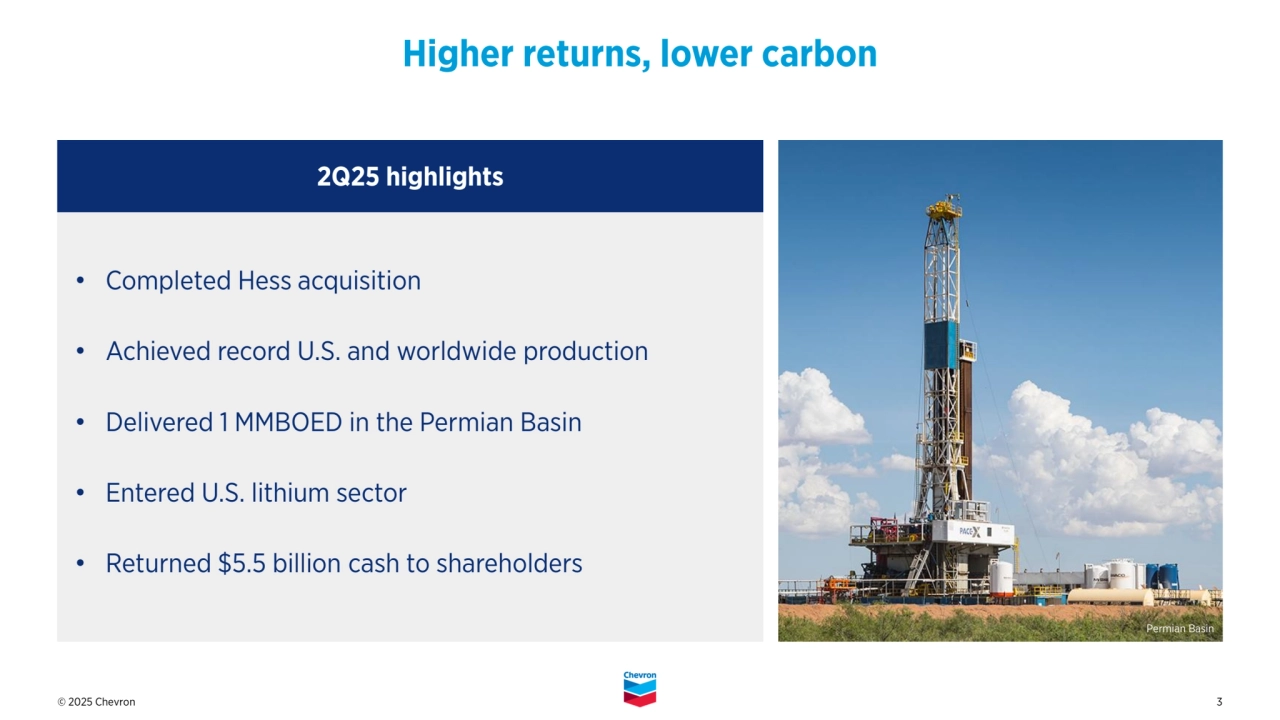
- 3. © 2025 Chevron 3 Higher returns, lower carbon 2Q25 highlights • Completed Hess acquisition • Achieved record U.S. and worldwide production • Delivered 1 MMBOED in the Permian Basin • Entered U.S. lithium sector • Returned $5.5 billion cash to shareholders Permian Basin
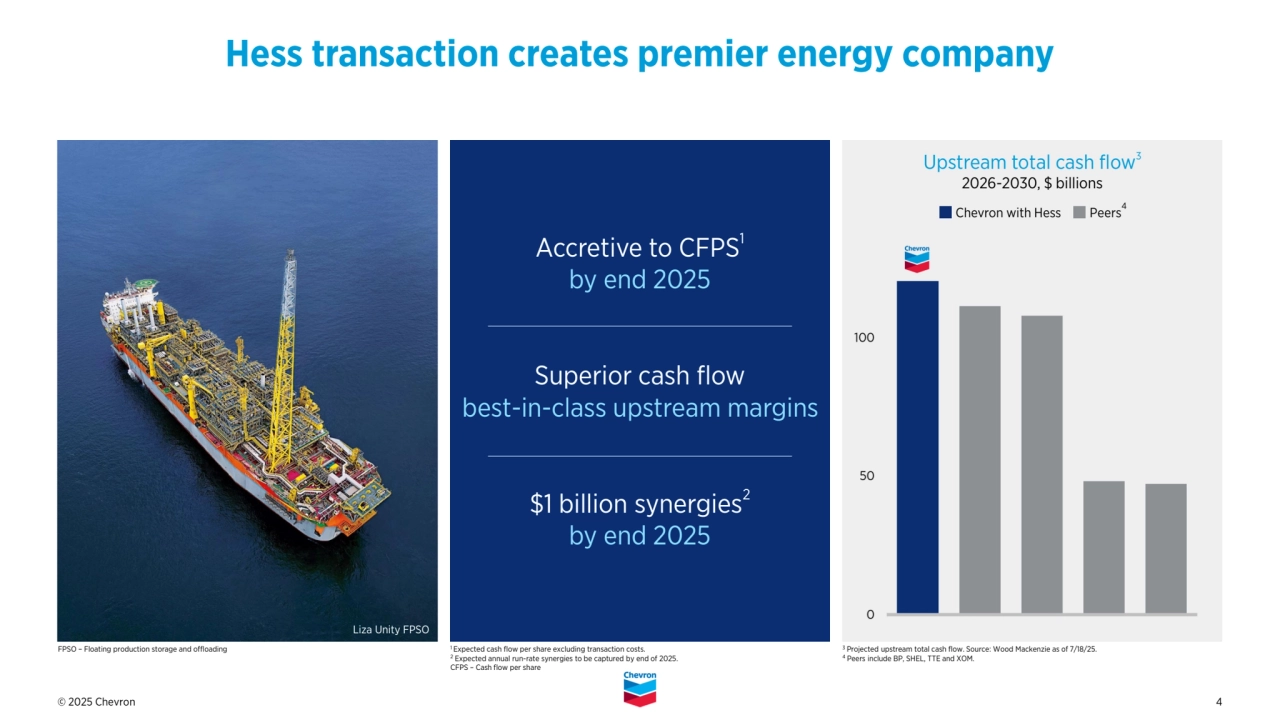
- 4. © 2025 Chevron 4 Accretive to CFPS1 by end 2025 Superior cash flow best-in-class upstream margins $1 billion synergies2 by end 2025 Hess transaction creates premier energy company Upstream total cash flow 3 2026-2030, $ billions Liza Unity FPSO Peers 4 Chevron with Hess 1 Expected cash flow per share excluding transaction costs. 2 Expected annual run-rate synergies to be captured by end of 2025. CFPS – Cash flow per share 3 Projected upstream total cash flow. Source: Wood Mackenzie as of 7/18/25. 4 Peers include BP, SHEL, TTE and XOM. FPSO – Floating production storage and offloading
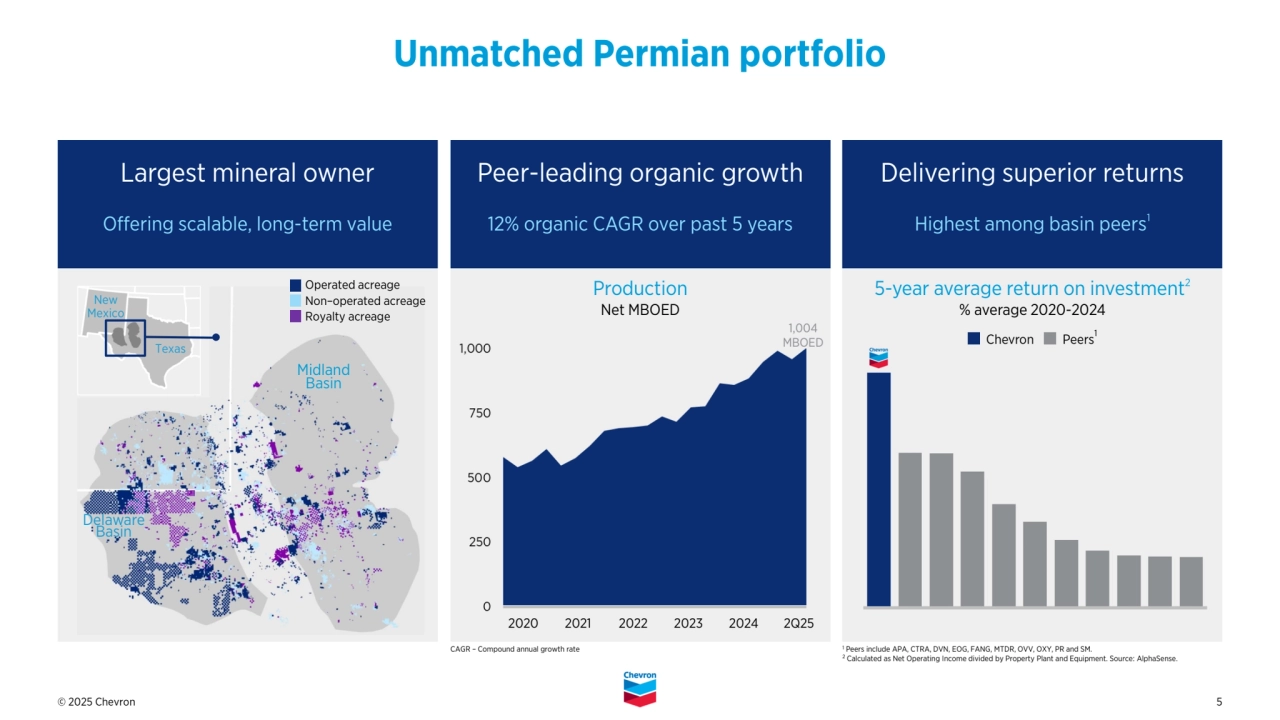
- 5. © 2025 Chevron 5 Peer-leading organic growth 12% organic CAGR over past 5 years Delivering superior returns Highest among basin peers 1 Unmatched Permian portfolio 5-year average return on investment 2 % average 2020-2024 Largest mineral owner Offering scalable, long-term value Production Net MBOED Delaware Basin Midland Basin Operated acreage Non–operated acreage Royalty acreage Texas New Mexico 1,004 MBOED Peers1 Chevron CAGR – Compound annual growth rate 1 Peers include APA, CTRA, DVN, EOG, FANG, MTDR, OVV, OXY, PR and SM. 2 Calculated as Net Operating Income divided by Property Plant and Equipment. Source: AlphaSense. 2020 2021 2022 2023 2024 2Q25
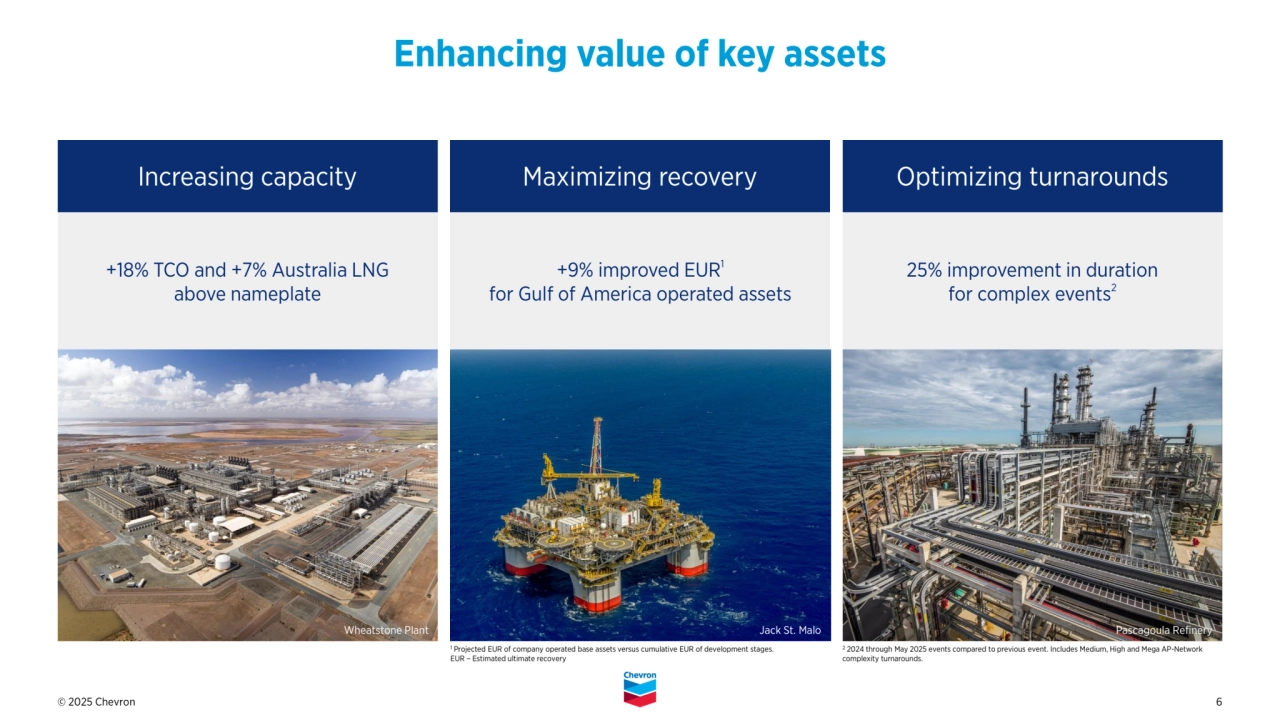
- 6. © 2025 Chevron 6 Enhancing value of key assets 25% improvement in duration for complex events 2 +9% improved EUR1 for Gulf of America operated assets +18% TCO and +7% Australia LNG above nameplate Increasing capacity Maximizing recovery Optimizing turnarounds 1 Projected EUR of company operated base assets versus cumulative EUR of development stages. EUR – Estimated ultimate recovery Jack St. Malo Pascagoula Refinery 2 2024 through May 2025 events compared to previous event. Includes Medium, High and Mega AP-Network complexity turnarounds. Wheatstone Plant
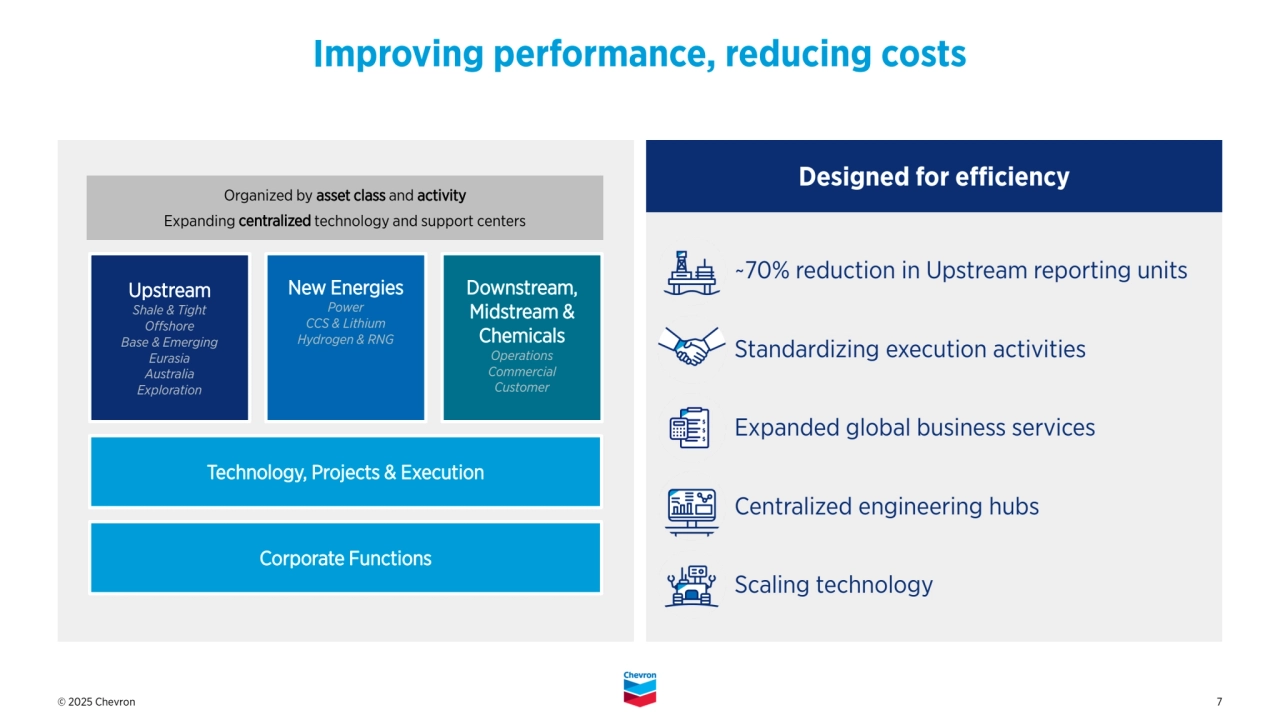
- 7. © 2025 Chevron 7 Improving performance, reducing costs ~70% reduction in Upstream reporting units Standardizing execution activities Expanded global business services Centralized engineering hubs Scaling technology Upstream Shale & Tight Offshore Base & Emerging Eurasia Australia Exploration Downstream, Midstream & Chemicals Operations Commercial Customer New Energies Power CCS & Lithium Hydrogen & RNG Technology, Projects & Execution Corporate Functions Designed for efficiency Organized by asset class and activity Expanding centralized technology and support centers
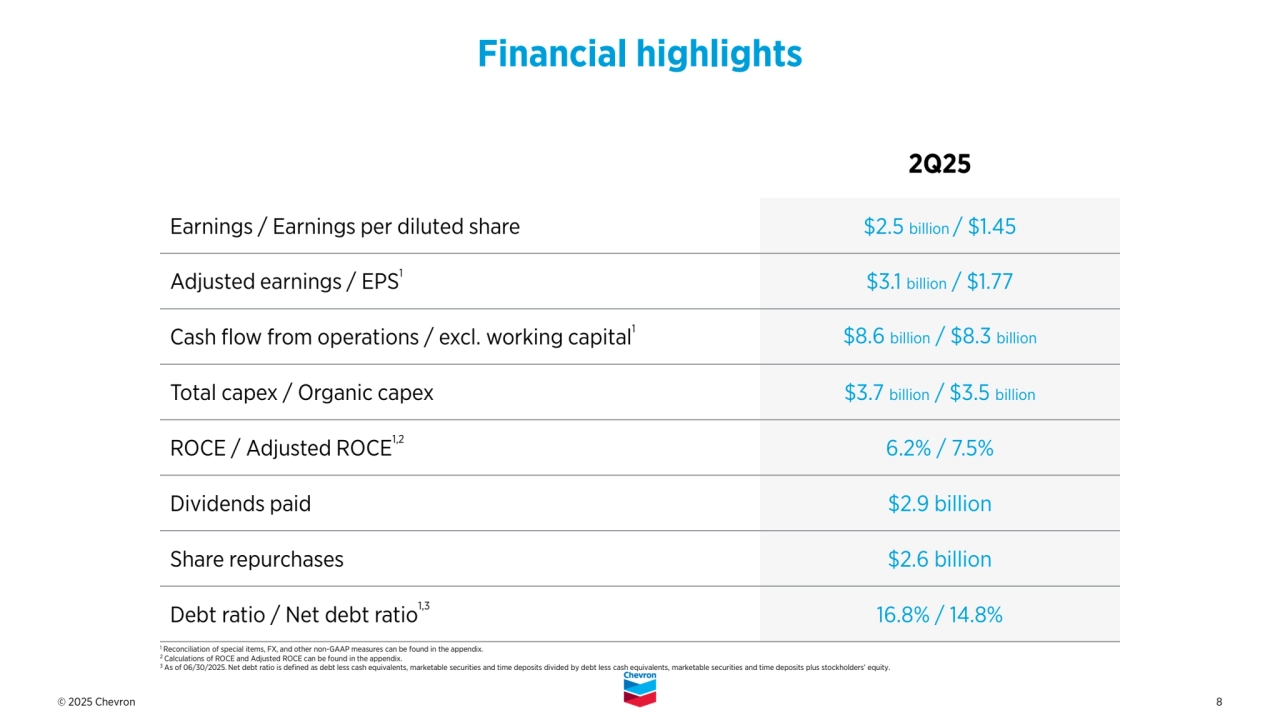
- 8. © 2025 Chevron 8 2Q25 Earnings / Earnings per diluted share $2.5 billion / $1.45 Adjusted earnings / EPS1$3.1 billion / $1.77 Cash flow from operations / excl. working capital1 $8.6 billion / $8.3 billion Total capex / Organic capex $3.7 billion / $3.5 billion ROCE / Adjusted ROCE1,2 6.2% / 7.5% Dividends paid $2.9 billion Share repurchases $2.6 billion Debt ratio / Net debt ratio1,3 16.8% / 14.8% Financial highlights 1 Reconciliation of special items, FX, and other non-GAAP measures can be found in the appendix. 2 Calculations of ROCE and Adjusted ROCE can be found in the appendix. 3 As of 06/30/2025. Net debt ratio is defined as debt less cash equivalents, marketable securities and time deposits divided by debt less cash equivalents, marketable securities and time deposits plus stockholders’ equity.
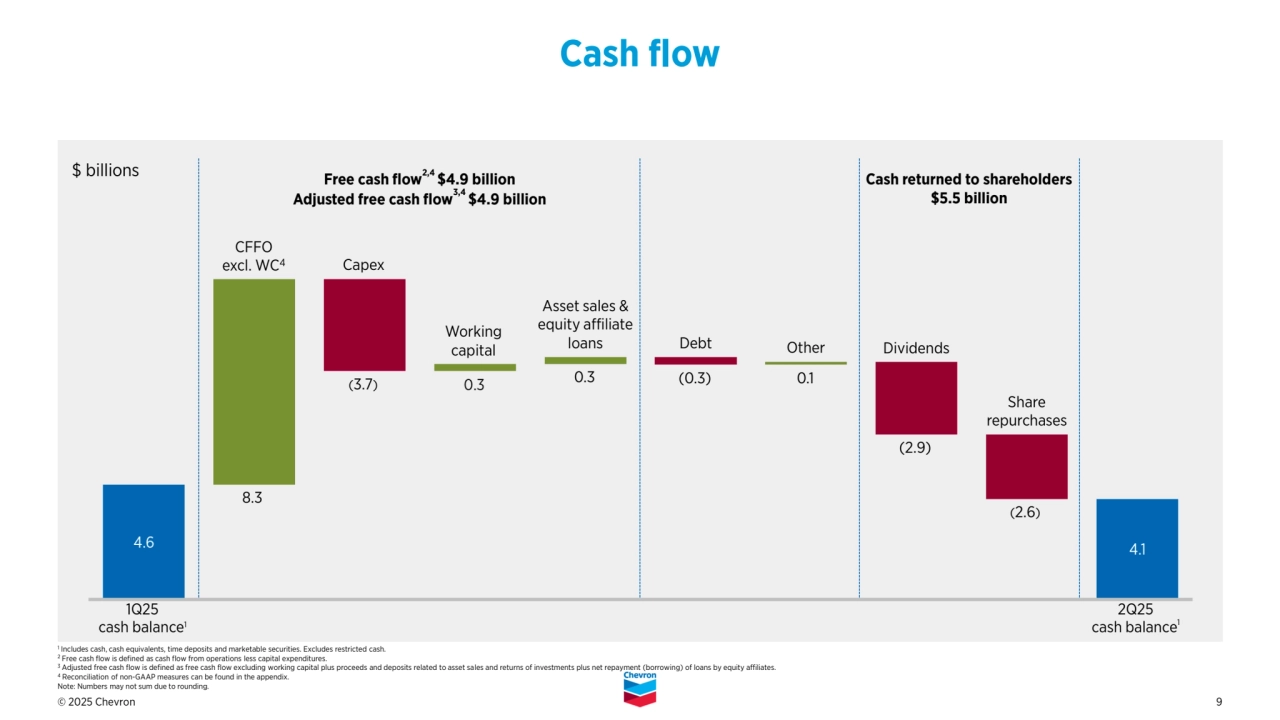
- 9. © 2025 Chevron 9 Cash flow 8.3 CFFO excl. WC4 Capex Debt Dividends Share repurchases Cash returned to shareholders $5.5 billion (3.7) (2.9) (2.6) Other Working capital 0.3 1 Includes cash, cash equivalents, time deposits and marketable securities. Excludes restricted cash. 2 Free cash flow is defined as cash flow from operations less capital expenditures. 3 Adjusted free cash flow is defined as free cash flow excluding working capital plus proceeds and deposits related to asset sales and returns of investments plus net repayment (borrowing) of loans by equity affiliates. 4 Reconciliation of non-GAAP measures can be found in the appendix. Note: Numbers may not sum due to rounding. 1Q25 cash balance1 (0.3) 0.1 Free cash flow2,4 $4.9 billion Adjusted free cash flow3,4 $4.9 billion 2Q25 cash balance 1 $ billions Asset sales & equity affiliate loans
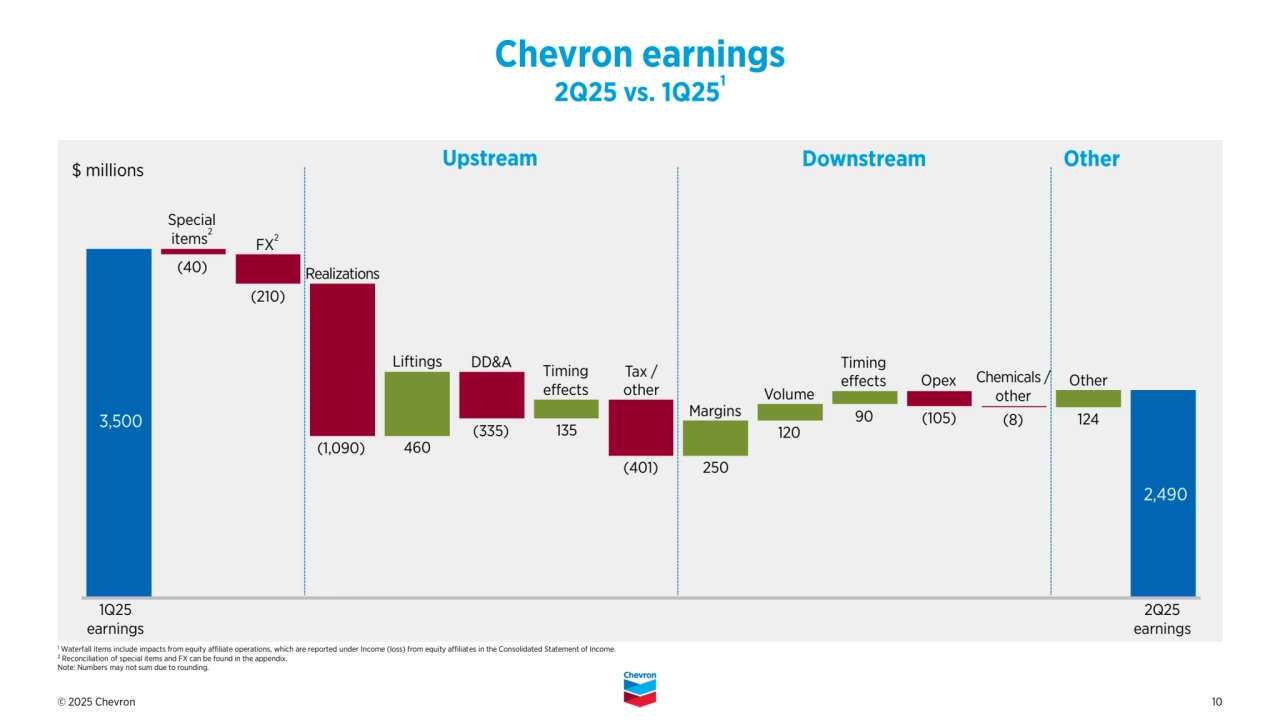
- 10. © 2025 Chevron 10 1 Waterfall items include impacts from equity affiliate operations, which are reported under Income (loss) from equity affiliates in the Consolidated Statement of Income. 2 Reconciliation of special items and FX can be found in the appendix. Note: Numbers may not sum due to rounding. Special items2 FX2 DD&A (210) (1,090) 460 Realizations (40) 124 Other 250 Liftings Chevron earnings 2Q25 vs. 1Q251 (335) Chemicals / other Margins 120 Volume Tax / other Upstream Downstream Other 1Q25 earnings 2Q25 earnings 135 Timing effects 90 Opex (105) (401) Timing effects $ millions (8)
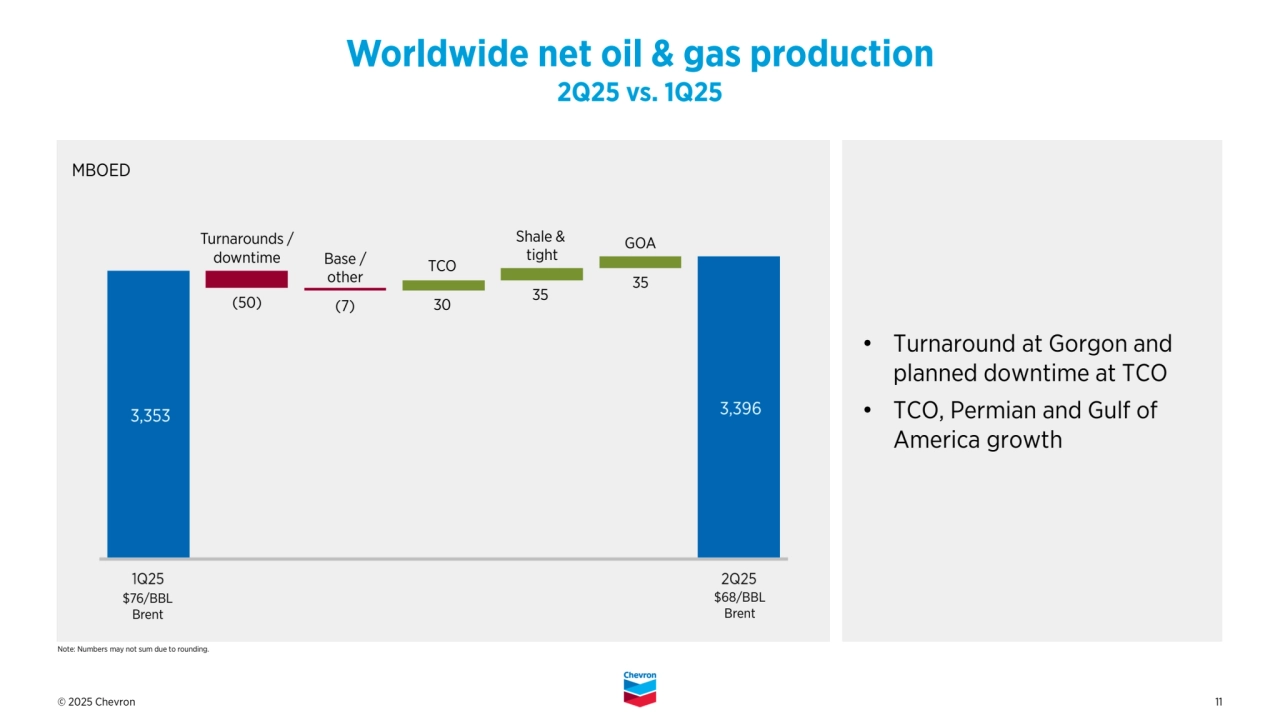
- 11. © 2025 Chevron 11 • Turnaround at Gorgon and planned downtime at TCO • TCO, Permian and Gulf of America growth Note: Numbers may not sum due to rounding. Base / other Shale & tight (50) $76/BBL Brent $68/BBL Brent 35 MBOED Worldwide net oil & gas production 2Q25 vs. 1Q25 35 TCO Turnarounds / downtime GOA (7) 30
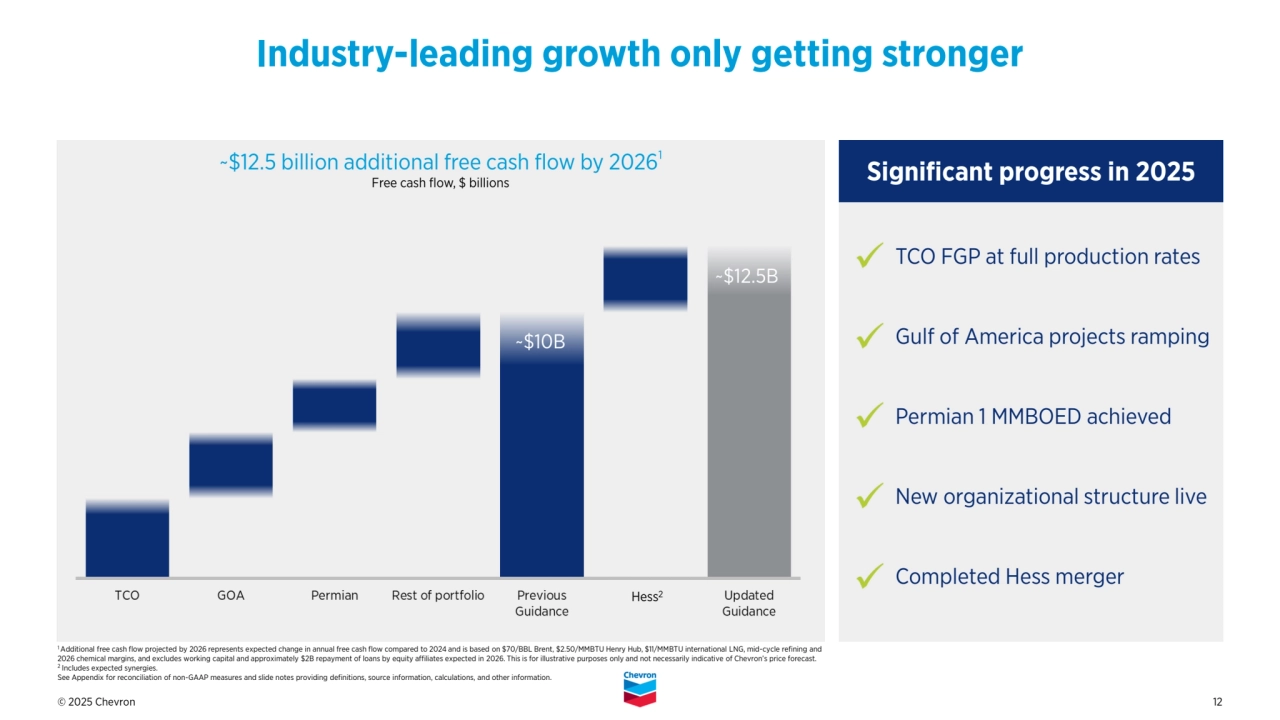
- 12. © 2025 Chevron 12 Industry-leading growth only getting stronger 1 Additional free cash flow projected by 2026 represents expected change in annual free cash flow compared to 2024 and is based on $70/BBL Brent, $2.50/MMBTU Henry Hub, $11/MMBTU international LNG, mid-cycle refining and 2026 chemical margins, and excludes working capital and approximately $2B repayment of loans by equity affiliates expected in 2026. This is for illustrative purposes only and not necessarily indicative of Chevron’s price forecast. 2 Includes expected synergies. See Appendix for reconciliation of non-GAAP measures and slide notes providing definitions, source information, calculations, and other information. ~$12.5 billion additional free cash flow by 20261 Free cash flow, $ billions ~$12.5B TCO FGP at full production rates Gulf of America projects ramping Permian 1 MMBOED achieved New organizational structure live Completed Hess merger Significant progress in 2025 ~$10B Hess2
- 13. © 2025 Chevron 13 questions answers
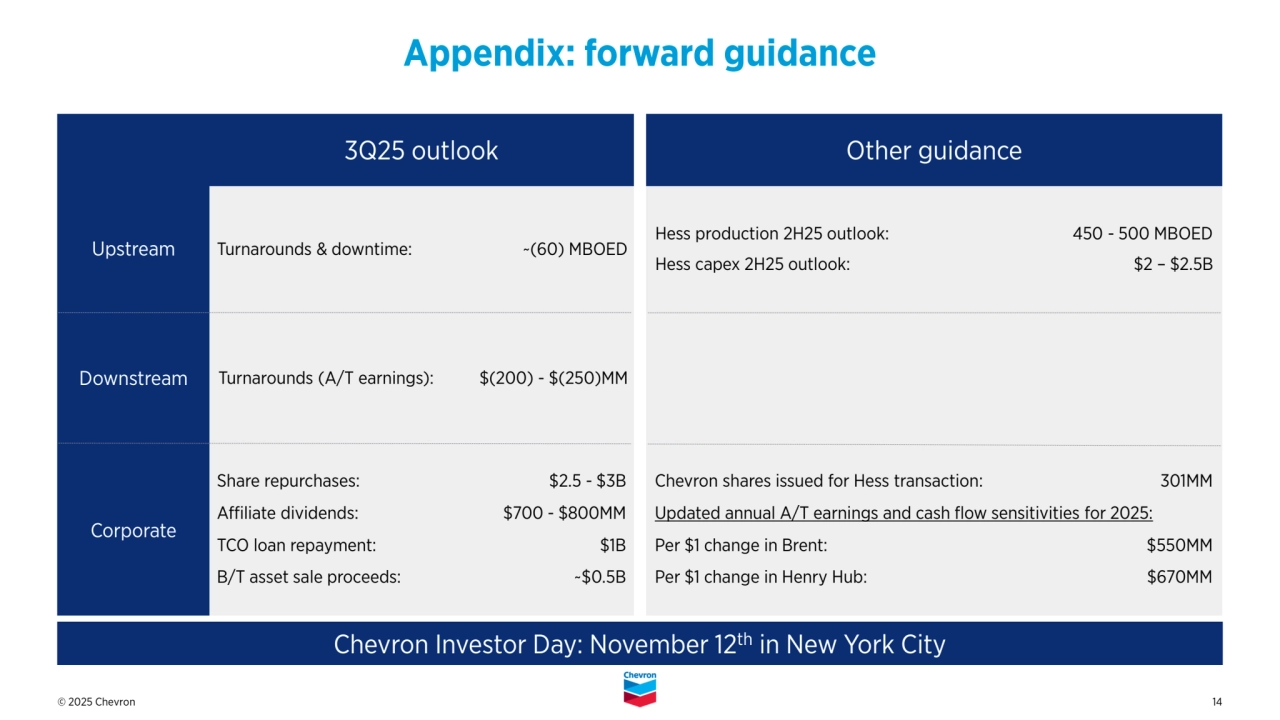
- 14. © 2025 Chevron 14 Upstream Appendix: forward guidance 3Q25 outlook Other guidance Turnarounds & downtime: ~(60) MBOED Downstream Corporate Chevron Investor Day: November 12th in New York City Chevron shares issued for Hess transaction: 301MM Updated annual A/T earnings and cash flow sensitivities for 2025: Per $1 change in Brent: $550MM Per $1 change in Henry Hub: $670MM Share repurchases: $2.5 - $3B Affiliate dividends: $700 - $800MM TCO loan repayment: $1B B/T asset sale proceeds: ~$0.5B Turnarounds (A/T earnings): $(200) - $(250)MM Hess production 2H25 outlook: 450 - 500 MBOED Hess capex 2H25 outlook: $2 – $2.5B
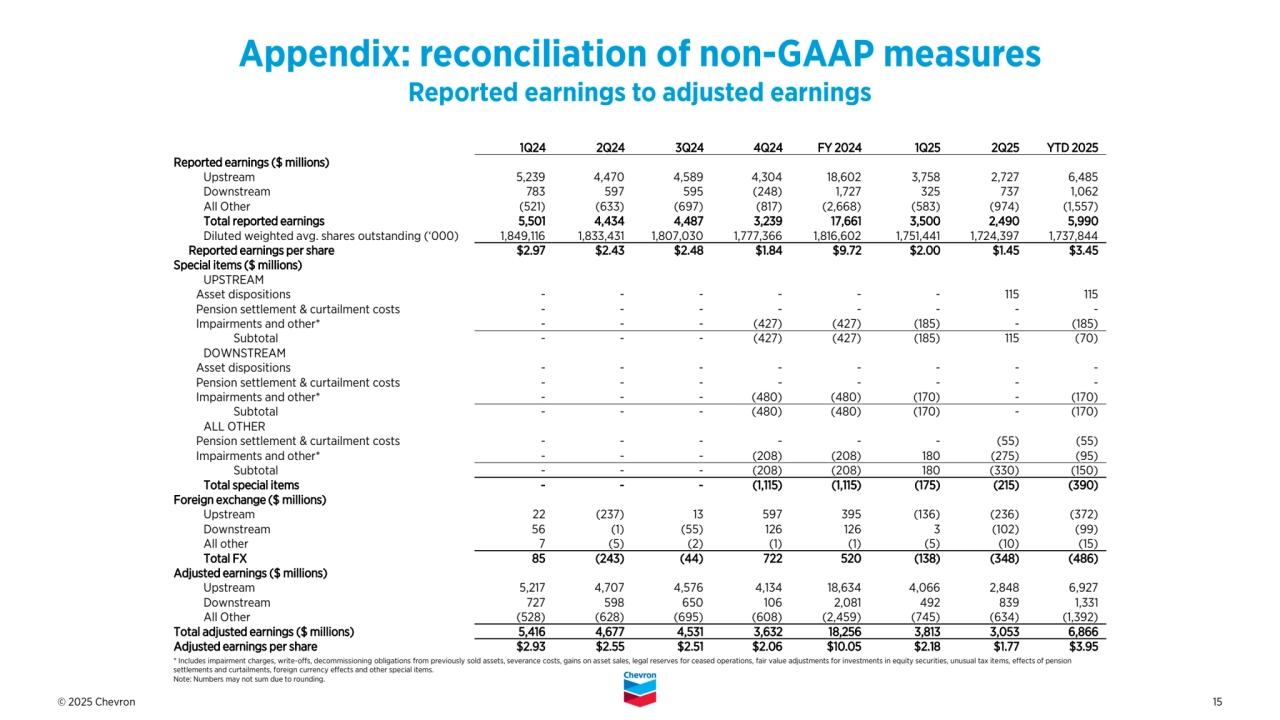
- 15. © 2025 Chevron 15 * Includes impairment charges, write-offs, decommissioning obligations from previously sold assets, severance costs, gains on asset sales, legal reserves for ceased operations, fair value adjustments for investments in equity securities, unusual tax items, effects of pension settlements and curtailments, foreign currency effects and other special items. Note: Numbers may not sum due to rounding. Appendix: reconciliation of non-GAAP measures Reported earnings to adjusted earnings 1Q24 2Q24 3Q24 4Q24 FY 2024 1Q25 2Q25 YTD 2025 Reported earnings ($ millions) Upstream 5,239 4,470 4,589 4,304 18,602 3,758 2,727 6,485 Downstream 783 597 595 (248) 1,727 325 737 1,062 All Other (521) (633) (697) (817) (2,668) (583) (974) (1,557) Total reported earnings 5,501 4,434 4,487 3,239 17,661 3,500 2,490 5,990 Diluted weighted avg. shares outstanding (‘000) 1,849,116 1,833,431 1,807,030 1,777,366 1,816,602 1,751,441 1,724,397 1,737,844 Reported earnings per share $2.97 $2.43 $2.48 $1.84 $9.72 $2.00 $1.45 $3.45 Special items ($ millions) UPSTREAM Asset dispositions - - - - - - 115 115 Pension settlement & curtailment costs - - - - - - - - Impairments and other* - - - (427) (427) (185) - (185) Subtotal - - - (427) (427) (185) 115 (70) DOWNSTREAM Asset dispositions - - - - - - - - Pension settlement & curtailment costs - - - - - - - - Impairments and other* - - - (480) (480) (170) - (170) Subtotal - - - (480) (480) (170) - (170) ALL OTHER Pension settlement & curtailment costs - - - - - - (55) (55) Impairments and other* - - - (208) (208) 180 (275) (95) Subtotal - - - (208) (208) 180 (330) (150) Total special items - - - (1,115) (1,115) (175) (215) (390) Foreign exchange ($ millions) Upstream 22 (237) 13 597 395 (136) (236) (372) Downstream 56 (1) (55) 126 126 3 (102) (99) All other 7 (5) (2) (1) (1) (5) (10) (15) Total FX 85 (243) (44) 722 520 (138) (348) (486) Adjusted earnings ($ millions) Upstream 5,217 4,707 4,576 4,134 18,634 4,066 2,848 6,927 Downstream 727 598 650 106 2,081 492 839 1,331 All Other (528) (628) (695) (608) (2,459) (745) (634) (1,392) Total adjusted earnings ($ millions) 5,416 4,677 4,531 3,632 18,256 3,813 3,053 6,866 Adjusted earnings per share $2.93 $2.55 $2.51 $2.06 $10.05 $2.18 $1.77 $3.95
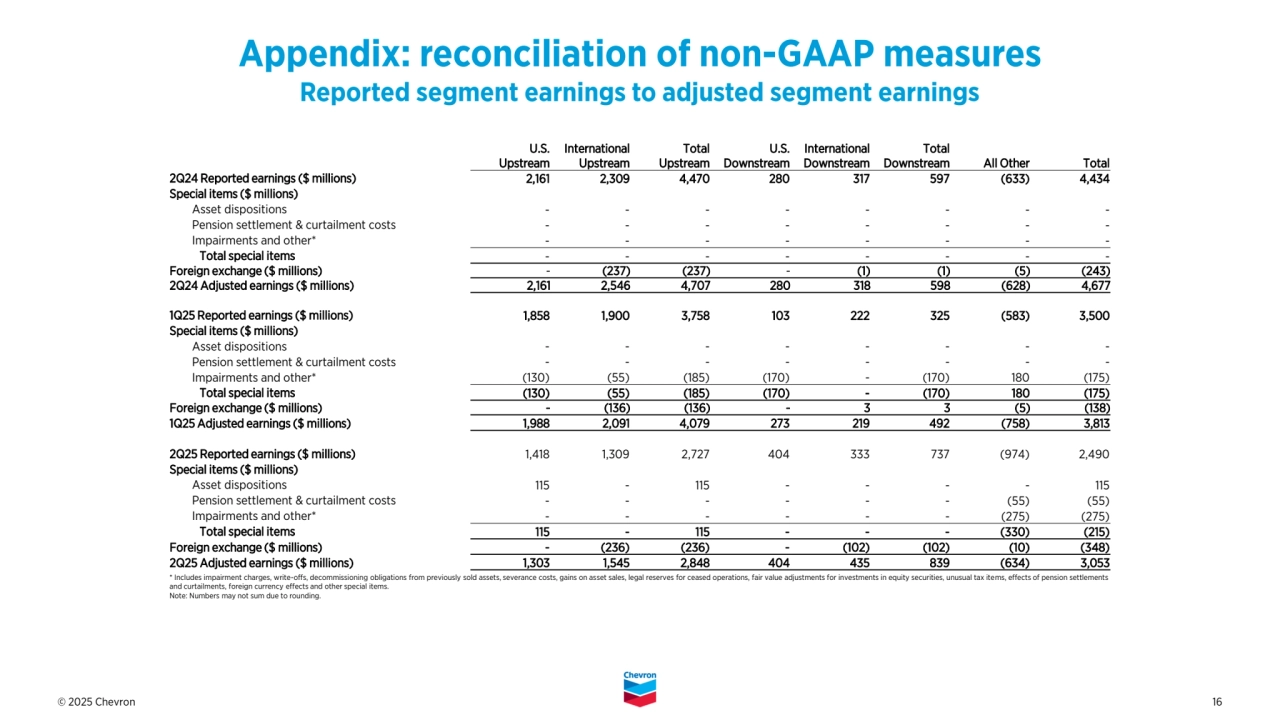
- 16. © 2025 Chevron 16 Appendix: reconciliation of non-GAAP measures Reported segment earnings to adjusted segment earnings * Includes impairment charges, write-offs, decommissioning obligations from previously sold assets, severance costs, gains on asset sales, legal reserves for ceased operations, fair value adjustments for investments in equity securities, unusual tax items, effects of pension settlements and curtailments, foreign currency effects and other special items. Note: Numbers may not sum due to rounding. U.S. Upstream International Upstream Total Upstream U.S. Downstream International Downstream Total Downstream All Other Total 2Q24 Reported earnings ($ millions) 2,161 2,309 4,470 280 317 597 (633) 4,434 Special items ($ millions) Asset dispositions - - - - - - - - Pension settlement & curtailment costs - - - - - - - - Impairments and other* - - - - - - - - Total special items - - - - - - - - Foreign exchange ($ millions) - (237) (237) - (1) (1) (5) (243) 2Q24 Adjusted earnings ($ millions) 2,161 2,546 4,707 280 318 598 (628) 4,677 1Q25 Reported earnings ($ millions) 1,858 1,900 3,758 103 222 325 (583) 3,500 Special items ($ millions) Asset dispositions - - - - - - - - Pension settlement & curtailment costs - - - - - - - - Impairments and other* (130) (55) (185) (170) - (170) 180 (175) Total special items (130) (55) (185) (170) - (170) 180 (175) Foreign exchange ($ millions) - (136) (136) - 3 3 (5) (138) 1Q25 Adjusted earnings ($ millions) 1,988 2,091 4,079 273 219 492 (758) 3,813 2Q25 Reported earnings ($ millions) 1,418 1,309 2,727 404 333 737 (974) 2,490 Special items ($ millions) Asset dispositions 115 - 115 - - - - 115 Pension settlement & curtailment costs - - - - - - (55) (55) Impairments and other* - - - - - - (275) (275) Total special items 115 - 115 - - - (330) (215) Foreign exchange ($ millions) - (236) (236) - (102) (102) (10) (348) 2Q25 Adjusted earnings ($ millions) 1,303 1,545 2,848 404 435 839 (634) 3,053
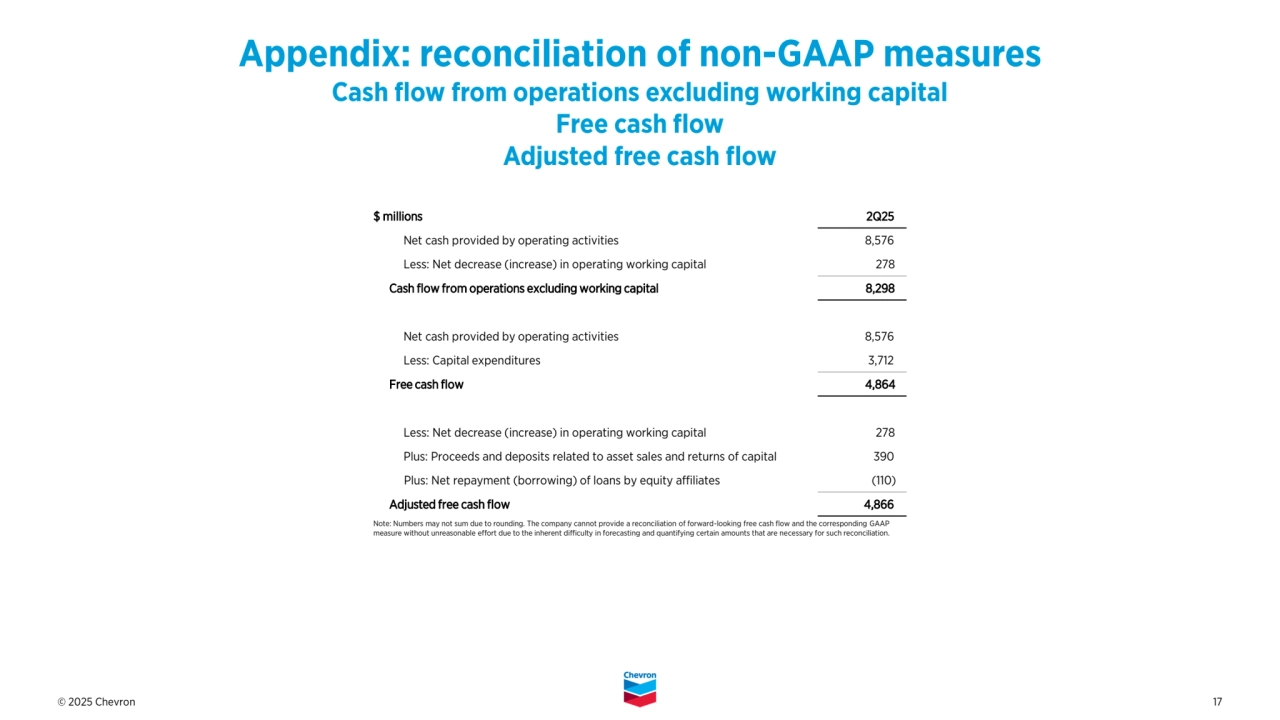
- 17. © 2025 Chevron 17 Appendix: reconciliation of non-GAAP measures Cash flow from operations excluding working capital Free cash flow Adjusted free cash flow Note: Numbers may not sum due to rounding. The company cannot provide a reconciliation of forward-looking free cash flow and the corresponding GAAP measure without unreasonable effort due to the inherent difficulty in forecasting and quantifying certain amounts that are necessary for such reconciliation. $ millions 2Q25 Net cash provided by operating activities 8,576 Less: Net decrease (increase) in operating working capital 278 Cash flow from operations excluding working capital 8,298 Net cash provided by operating activities 8,576 Less: Capital expenditures 3,712 Free cash flow 4,864 Less: Net decrease (increase) in operating working capital 278 Plus: Proceeds and deposits related to asset sales and returns of capital 390 Plus: Net repayment (borrowing) of loans by equity affiliates (110) Adjusted free cash flow 4,866
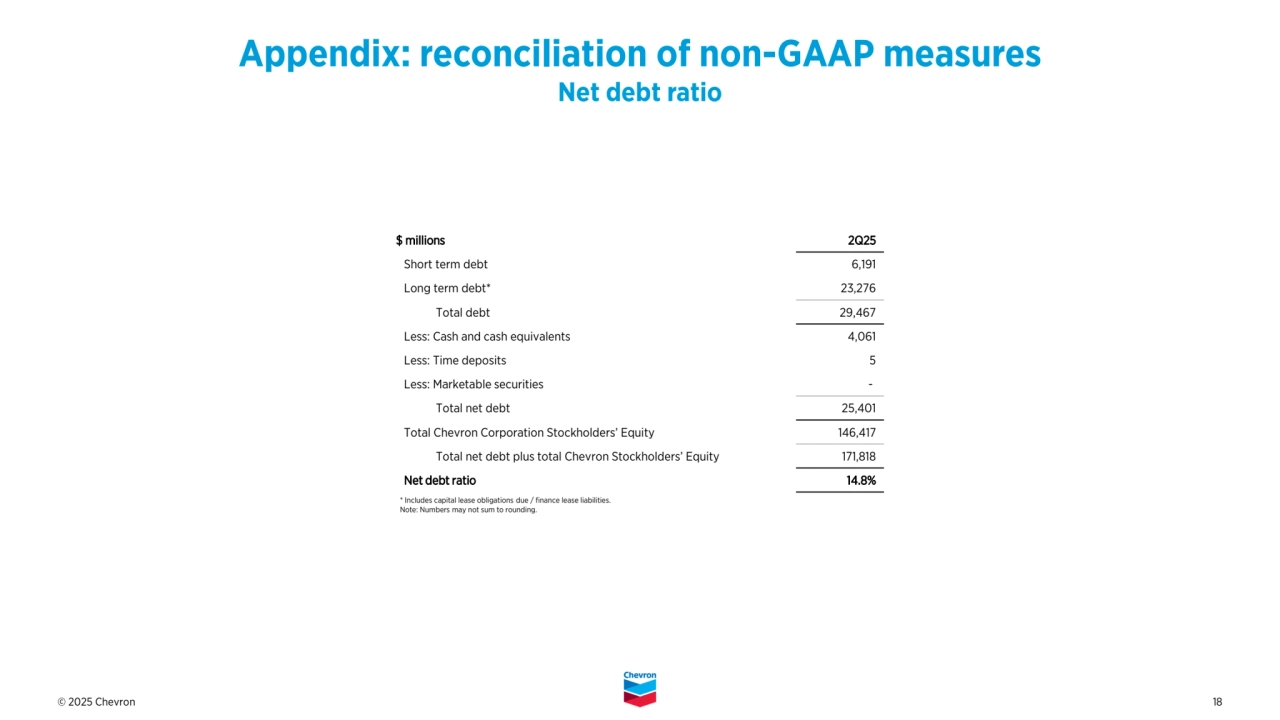
- 18. © 2025 Chevron 18 * Includes capital lease obligations due / finance lease liabilities. Note: Numbers may not sum to rounding. Appendix: reconciliation of non-GAAP measures Net debt ratio $ millions 2Q25 Short term debt 6,191 Long term debt* 23,276 Total debt 29,467 Less: Cash and cash equivalents 4,061 Less: Time deposits 5 Less: Marketable securities - Total net debt 25,401 Total Chevron Corporation Stockholders’ Equity 146,417 Total net debt plus total Chevron Stockholders’ Equity 171,818 Net debt ratio 14.8%
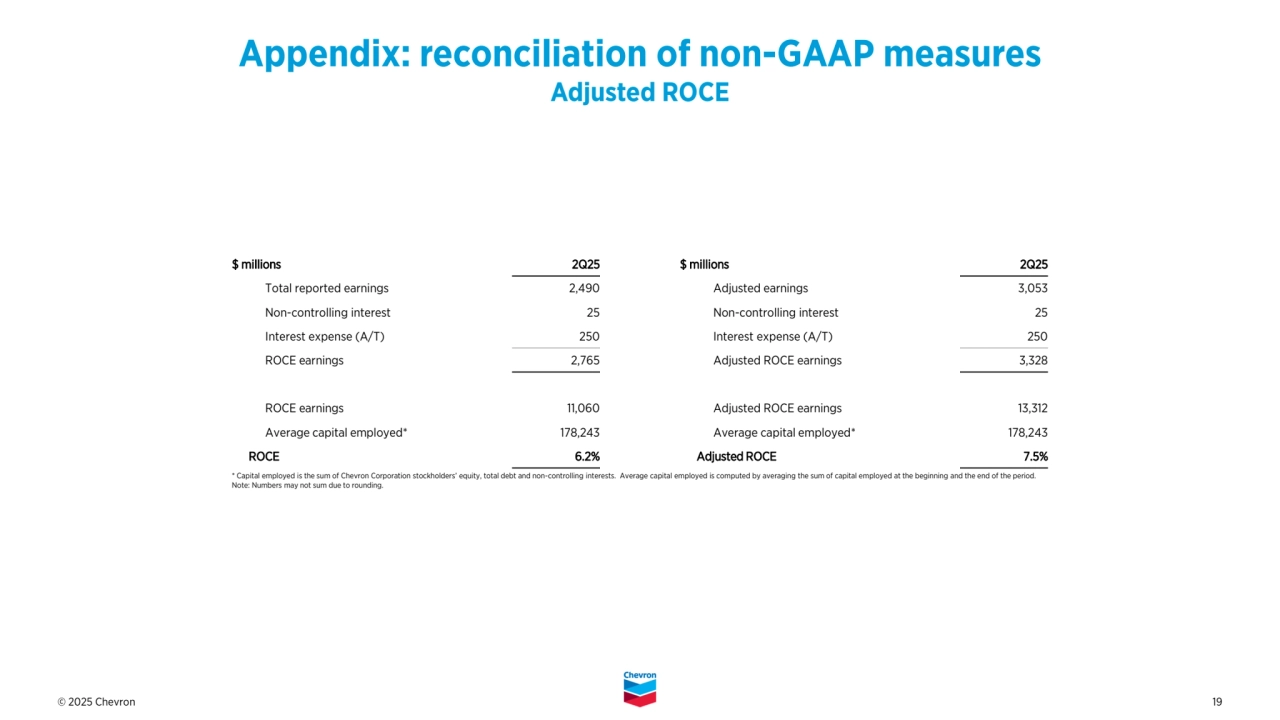
- 19. © 2025 Chevron 19 $ millions 2Q25 $ millions 2Q25 Total reported earnings 2,490 Adjusted earnings 3,053 Non-controlling interest 25 Non-controlling interest 25 Interest expense (A/T) 250 Interest expense (A/T) 250 ROCE earnings 2,765 Adjusted ROCE earnings 3,328 ROCE earnings 11,060 Adjusted ROCE earnings 13,312 Average capital employed* 178,243 Average capital employed* 178,243 ROCE 6.2% Adjusted ROCE 7.5% Appendix: reconciliation of non-GAAP measures Adjusted ROCE * Capital employed is the sum of Chevron Corporation stockholders’ equity, total debt and non-controlling interests. Average capital employed is computed by averaging the sum of capital employed at the beginning and the end of the period. Note: Numbers may not sum due to rounding.
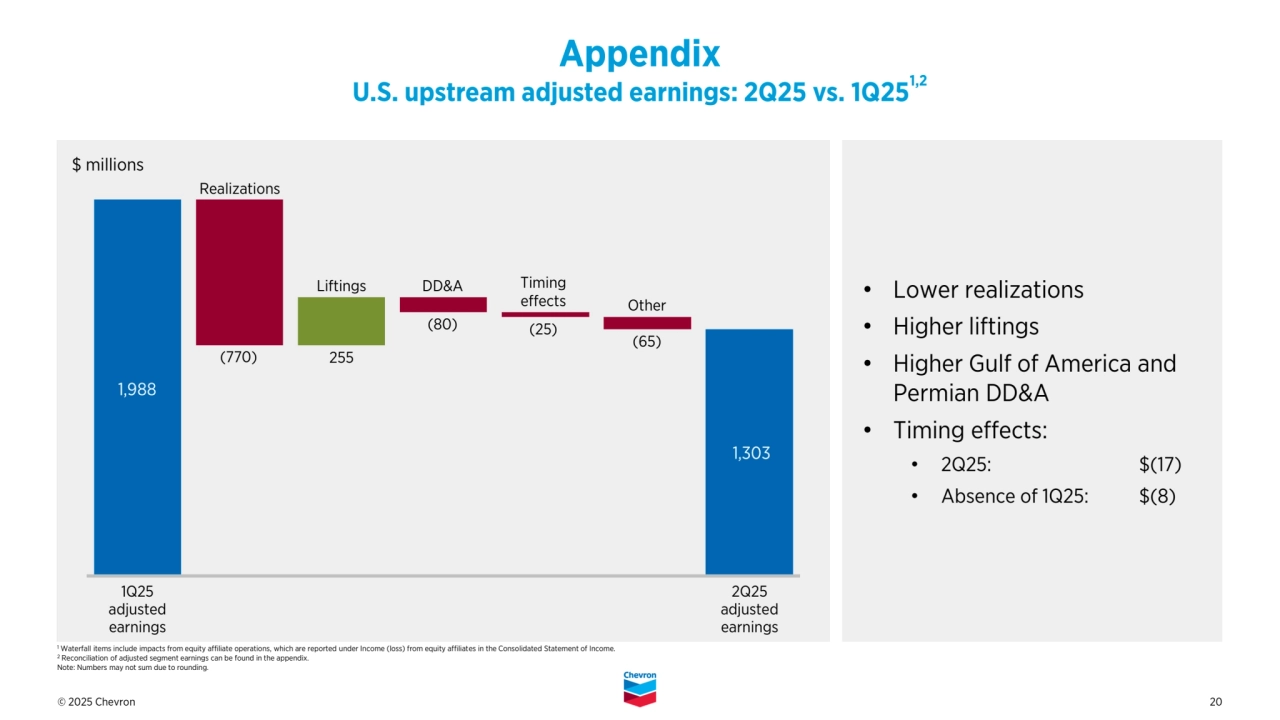
- 20. © 2025 Chevron 20 • Lower realizations • Higher liftings • Higher Gulf of America and Permian DD&A • Timing effects: • 2Q25: $(17) • Absence of 1Q25: $(8) Appendix U.S. upstream adjusted earnings: 2Q25 vs. 1Q251,2 (65) (25) Liftings Other 255 DD&A (80) Timing effects 1 Waterfall items include impacts from equity affiliate operations, which are reported under Income (loss) from equity affiliates in the Consolidated Statement of Income. 2 Reconciliation of adjusted segment earnings can be found in the appendix. Note: Numbers may not sum due to rounding. Realizations (770) $ millions 1Q25 adjusted earnings 2Q25 adjusted earnings
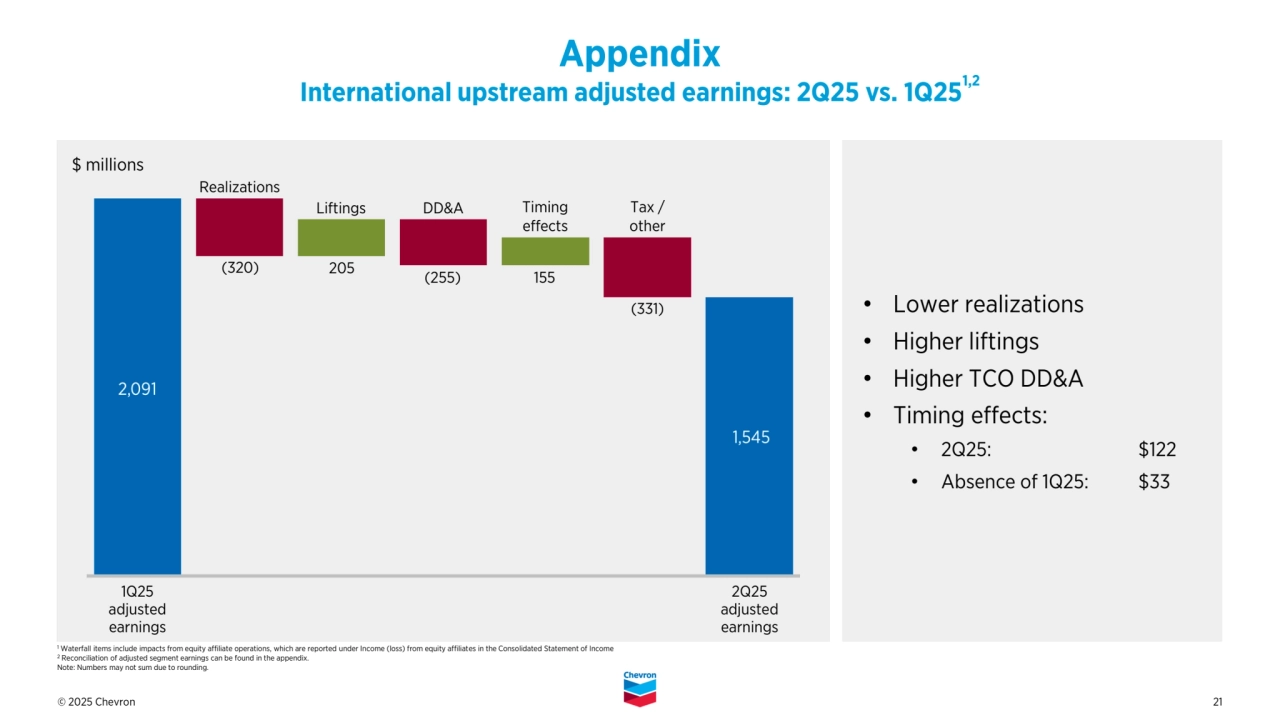
- 21. © 2025 Chevron 21 • Lower realizations • Higher liftings • Higher TCO DD&A • Timing effects: • 2Q25: $122 • Absence of 1Q25: $33 Timing effects Realizations 205 DD&A 155 Appendix International upstream adjusted earnings: 2Q25 vs. 1Q251,2 $ millions (320) (331) Tax / other Liftings (255) 1 Waterfall items include impacts from equity affiliate operations, which are reported under Income (loss) from equity affiliates in the Consolidated Statement of Income 2 Reconciliation of adjusted segment earnings can be found in the appendix. Note: Numbers may not sum due to rounding. 1Q25 adjusted earnings 2Q25 adjusted earnings
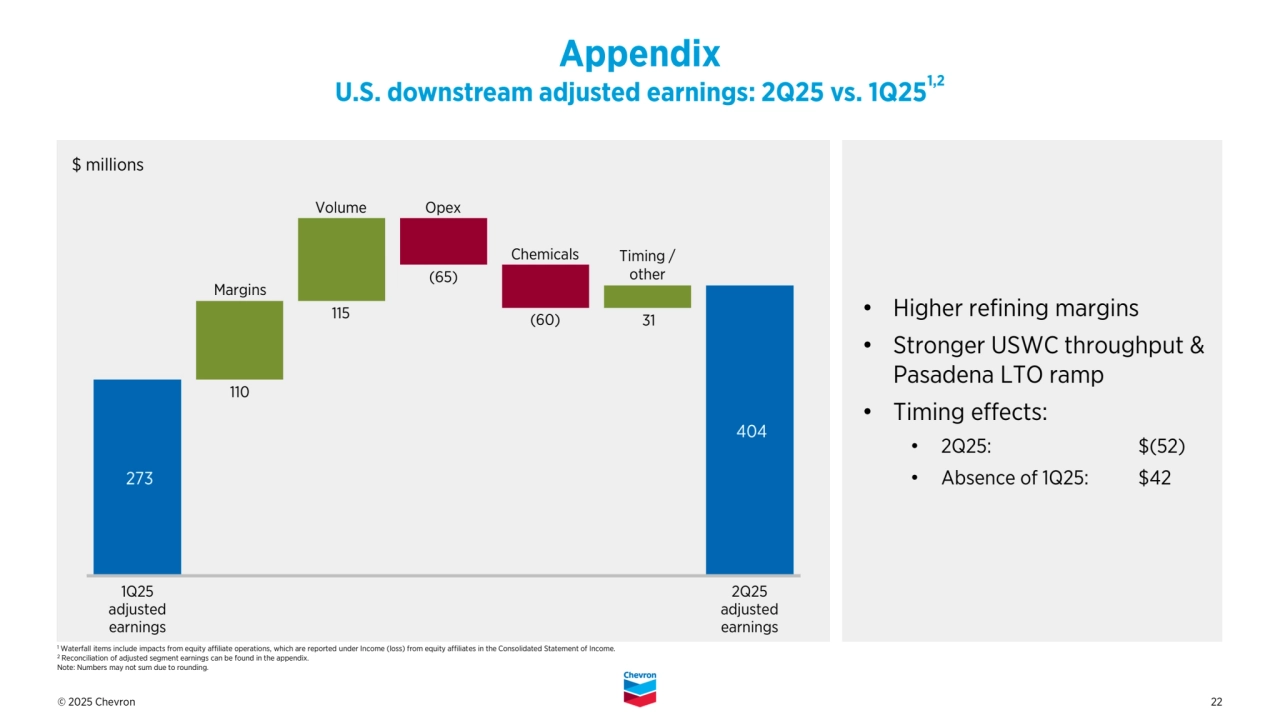
- 22. © 2025 Chevron 22 • Higher refining margins • Stronger USWC throughput & Pasadena LTO ramp • Timing effects: • 2Q25: $(52) • Absence of 1Q25: $42 Appendix U.S. downstream adjusted earnings: 2Q25 vs. 1Q251,2 Margins Volume (65) 1Q25 adjusted earnings 2Q25 adjusted earnings Timing / other $ millions 110 Opex 31 115 1 Waterfall items include impacts from equity affiliate operations, which are reported under Income (loss) from equity affiliates in the Consolidated Statement of Income. 2 Reconciliation of adjusted segment earnings can be found in the appendix. Note: Numbers may not sum due to rounding. Chemicals (60)
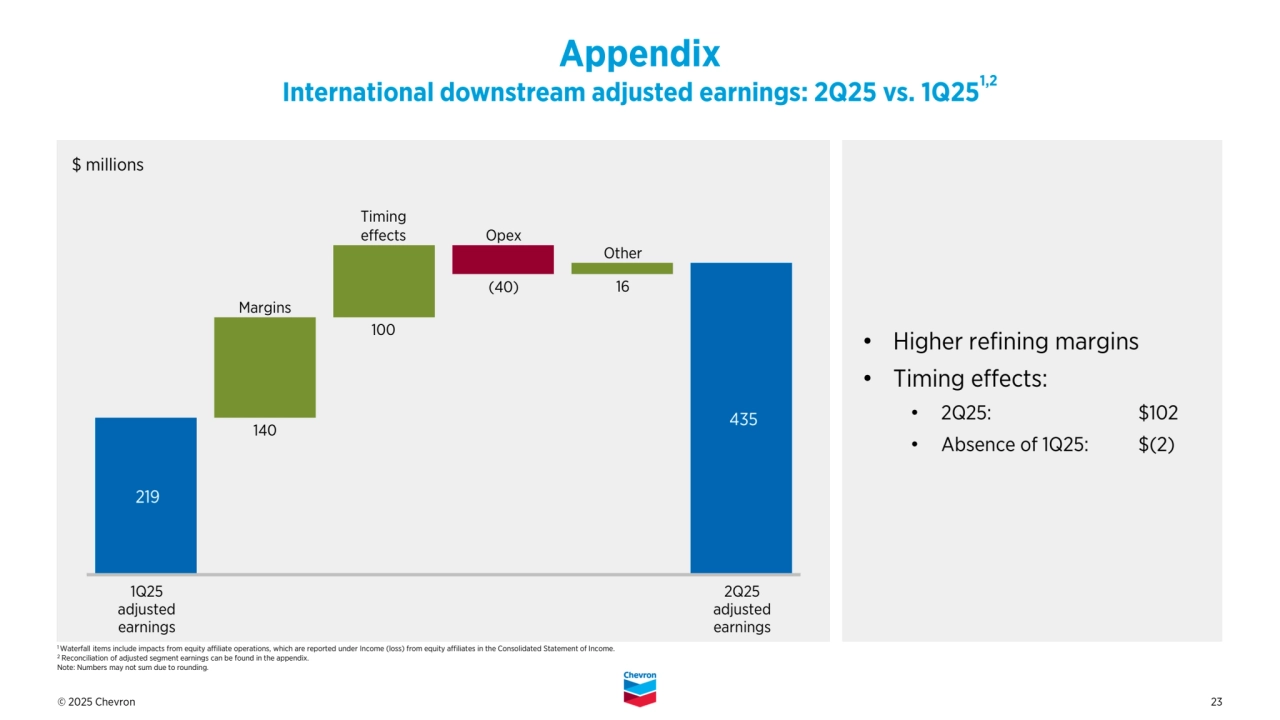
- 23. © 2025 Chevron 23 Appendix International downstream adjusted earnings: 2Q25 vs. 1Q251,2 Margins Timing effects 1Q25 adjusted earnings 2Q25 adjusted earnings Other $ millions 140 Opex 100 (40) • Higher refining margins • Timing effects: • 2Q25: $102 • Absence of 1Q25: $(2) 16 1 Waterfall items include impacts from equity affiliate operations, which are reported under Income (loss) from equity affiliates in the Consolidated Statement of Income. 2 Reconciliation of adjusted segment earnings can be found in the appendix. Note: Numbers may not sum due to rounding.
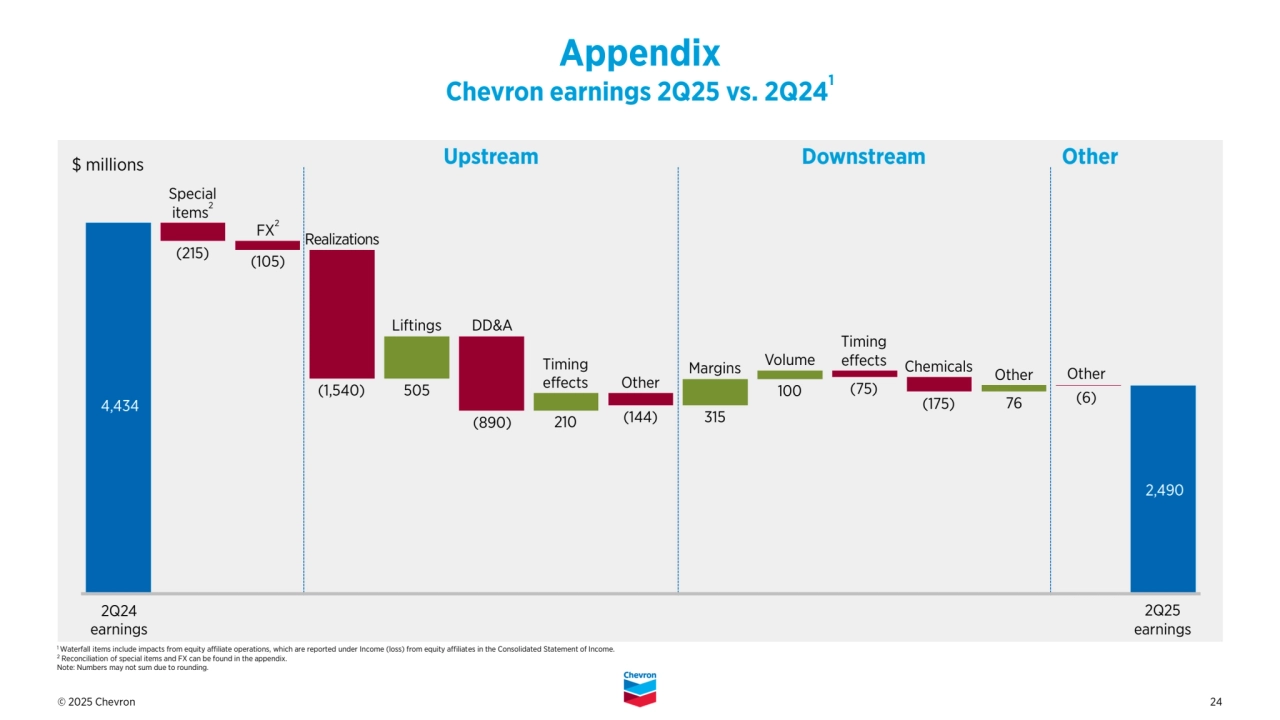
- 24. © 2025 Chevron 24 Special items2 FX2 DD&A (105) (1,540) 505 Realizations (215) (6) Other 315 Liftings Appendix Chevron earnings 2Q25 vs. 2Q241 (890) Other Margins 100 Volume 76 Other Upstream Downstream Other 2Q24 earnings 2Q25 earnings 210 Timing effects (75) Chemicals (175) (144) Timing effects 1 Waterfall items include impacts from equity affiliate operations, which are reported under Income (loss) from equity affiliates in the Consolidated Statement of Income. 2 Reconciliation of special items and FX can be found in the appendix. Note: Numbers may not sum due to rounding. $ millions
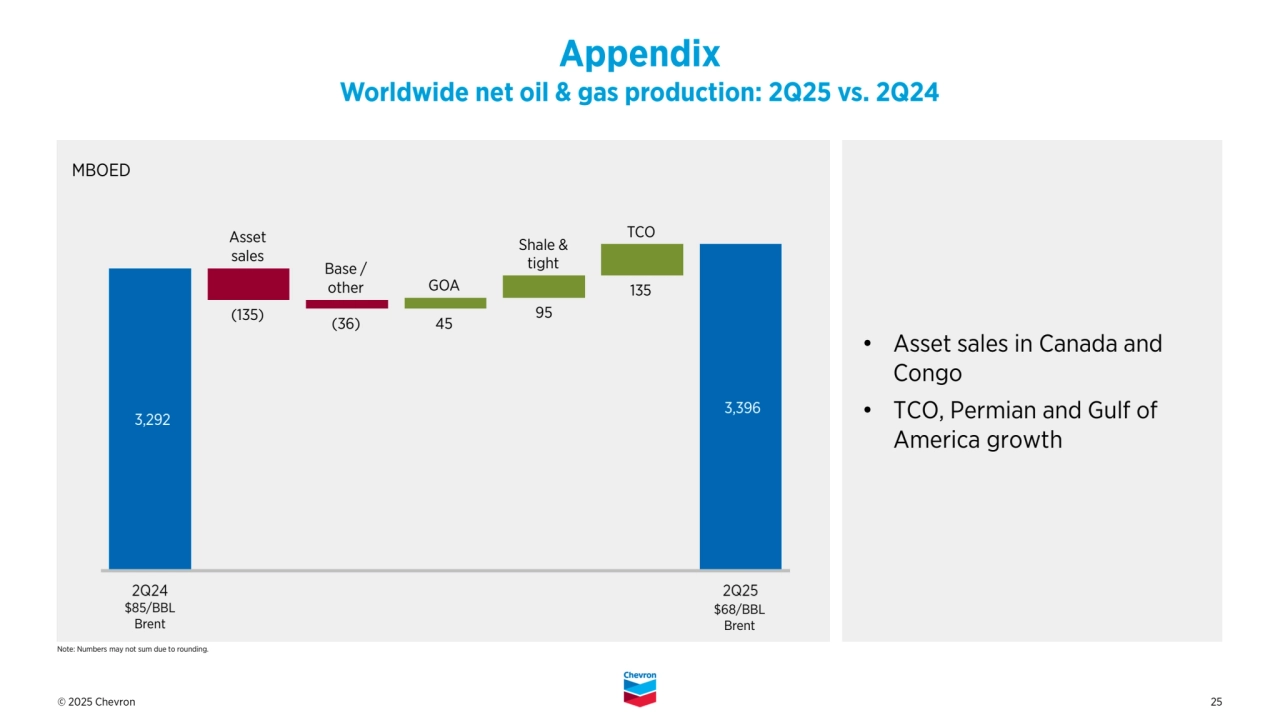
- 25. © 2025 Chevron 25 Appendix Worldwide net oil & gas production: 2Q25 vs. 2Q24 • Asset sales in Canada and Congo • TCO, Permian and Gulf of America growth Note: Numbers may not sum due to rounding. Shale & tight 95 (36) $85/BBL Brent $68/BBL Brent GOA 135 Base / other MBOED Asset sales (135) 45 TCO