CrowdStrike: Q2 FY25 Financial Results
 AI Summary
Key Insights
- 🚀 Strong Financial Performance: Achieved significant growth in ARR and revenue year-over-year.
- 🌐 AI-Native Platform: XDR platform drives market opportunity and enhances leadership.
- 🤝 Customer Adoption: Customers are increasingly embracing the Falcon platform, adopting more modules.
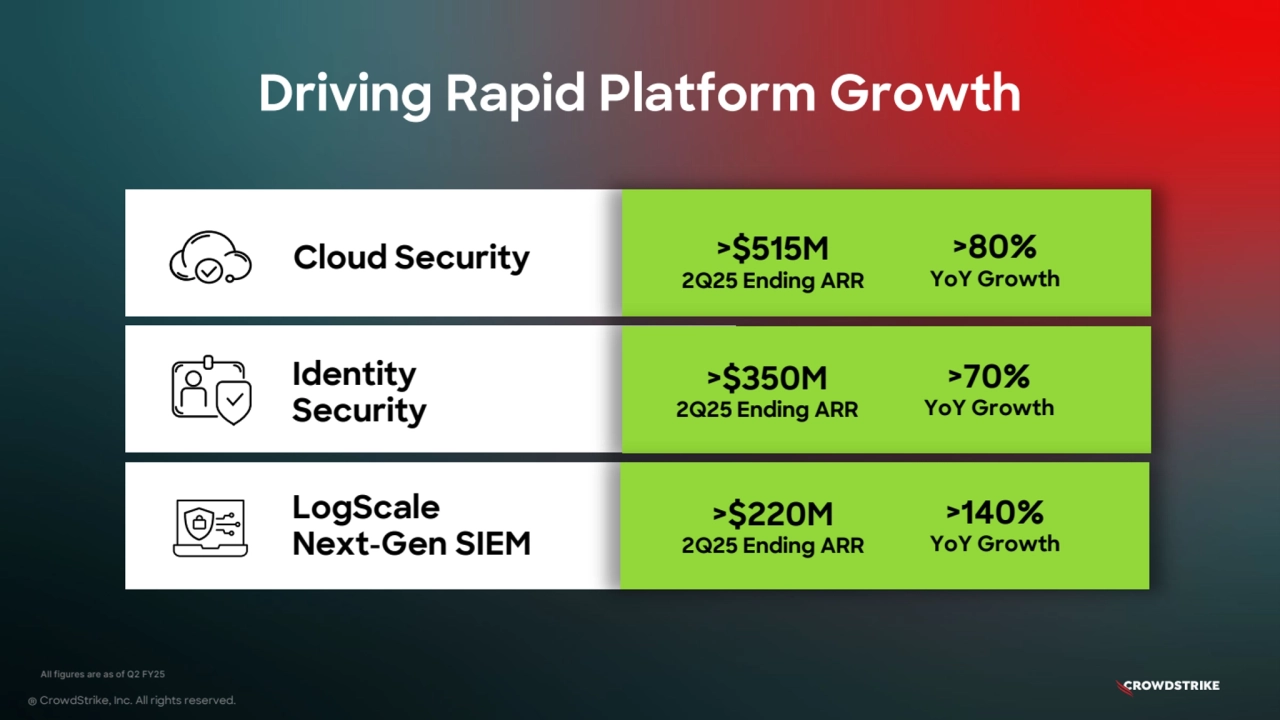
- 📈 Rapid Growth Businesses: Cloud, Identity, and LogScale drive platform growth.
- 💰 Financial Guidance: Provided guidance for Q3 FY2025 and full fiscal year FY2025, plus other financial metrics.


CrowdStrike: Q2 FY25 Financial Results
- 1. Financial Results Q2 FY 2025 ® CrowdStrike, Inc. All rights reserved.
- 2. Safe Harbor ® CrowdStrike, Inc. All rights reserved. This presentation includes express and implied “forward-looking statements”, including forward-looking statements within the meaning of the Private Securities Litigation Reform Act of 1995. Forward-looking statements include all statements that are not historical facts, and in some cases, can be identified by terms such as “anticipate,” “believe,” “can,” “continue,” “could,” “estimate,” “expect,” “intend,” “may,” “might,” “plan,” “potential,” “predict,” “project,” “should,” “will,” “would,” or the negative of these terms, and similar expressions that concern our expectations, strategy, plans or intentions. Forward-looking statements contained in this presentation include, but are not limited to, statements concerning our estimates of market size and opportunity, strategic plans or objectives, our growth prospects, projections (including our long-term model), the Channel File 291 Incident, our product roadmap and future initiatives, and the performance and benefits of our products. By their nature, these statements are subject to numerous risks and uncertainties, including factors beyond our control, that could cause actual results, performance or achievement to differ materially and adversely from those anticipated or implied in the statements. Such risks and uncertainties are described in the “Risk Factors” section of our most recent Form 10-K, most recent Form 10-Q, and subsequent filings with the Securities and Exchange Commission. Although our management believes that the expectations reflected in our statements are reasonable, we cannot guarantee that the future results, levels of activity, performance or events and circumstances described in the forward-looking statements will be achieved or occur. Recipients are cautioned not to place undue reliance on these forward-looking statements, which speak only as of the date such statements are made and should not be construed as statements of fact. Except to the extent required by federal securities laws, we undertake no obligation to update these forward-looking statements to reflect events or circumstances after the date hereof, or to reflect the occurrence of unanticipated events. Information in this presentation on new products, features, and functionality, including our expectations with respect to the development, release and timing thereof, is for informational purposes only and should not be relied upon. Certain information contained in this presentation and statements made orally during this presentation relate to or are based on studies, publications, surveys and other data obtained from third-party sources and CrowdStrike’s own internal estimates and research. While CrowdStrike believes these third-party studies, publications, surveys and other data to be reliable as of the date of this presentation, it has not independently verified, and makes no representations as to the adequacy, fairness, accuracy or completeness of, any information obtained from third-party sources. In addition, no independent source has evaluated the reasonableness or accuracy of CrowdStrike’s internal estimates or research and no reliance should be made on any information or statements made in this presentation relating to or based on such internal estimates and research.
- 3. Financial Information ® CrowdStrike, Inc. All rights reserved. Use of Non-GAAP Financial Measures In addition to our results determined in accordance with U.S. generally accepted accounting principles (“GAAP”), we believe non-GAAP measures used in this presentation, such as non-GAAP Gross Margins, non-GAAP Operating Expenses, and Free Cash Flow, are useful in evaluating our operating performance. We use such non-GAAP financial information to evaluate our ongoing operations and for internal planning and forecasting purposes. We believe that non-GAAP financial information, when taken collectively, may be helpful to investors because it provides consistency and comparability with past financial performance and facilitates period-to-period comparisons of operations, as these measures eliminate the effects of certain variables unrelated to our overall operating performance. Other companies, including companies in our industry, may calculate similarly titled non-GAAP measures differently or may use other measures to evaluate their performance, all of which could reduce the usefulness of our non-GAAP financial measures as tools for comparison. In addition, the utility of free cash flow as a measure of our financial performance and liquidity is limited as it does not represent the total increase or decrease in our cash balance for a given period. Investors are encouraged to review the related GAAP financial measures and the reconciliation of these non-GAAP financial measures to their most directly comparable GAAP financial measures and not rely on any single financial measure to evaluate our business. Please see the appendix included at the end of this presentation for a discussion of non-GAAP financial measures and a reconciliation of historical non-GAAP measures to historical GAAP measures. Our Fiscal Year Our fiscal year end is January 31, and our fiscal quarters end on April 30, July 31, October 31 and January 31. Our fiscal years ended January 31, 2023, 2024 and 2025 are referred to herein as fiscal 2023, 2024 and 2025 respectively.
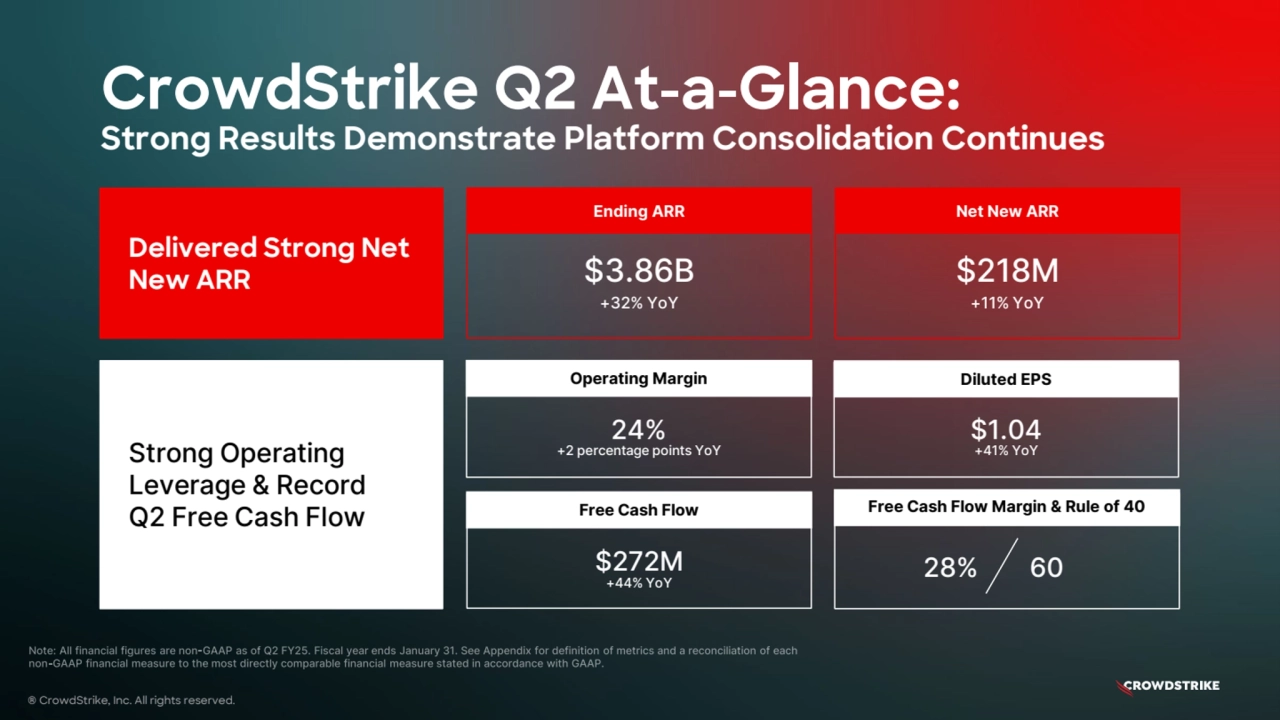
- 4. CrowdStrike Q2 At-a-Glance: Strong Results Demonstrate Platform Consolidation Continues Delivered Strong Net New ARR Strong Operating Leverage & Record Q2 Free Cash Flow Ending ARR $3.86B +32% YoY Net New ARR $218M +11% YoY 24% +2 percentage points YoY Operating Margin $1.04 +41% YoY Diluted EPS $272M +44% YoY Free Cash Flow Free Cash Flow Margin & Rule of 40 28% 60 ® CrowdStrike, Inc. All rights reserved.
- 5. Market Opportunity & Leadership ® CrowdStrike, Inc. All rights reserved.
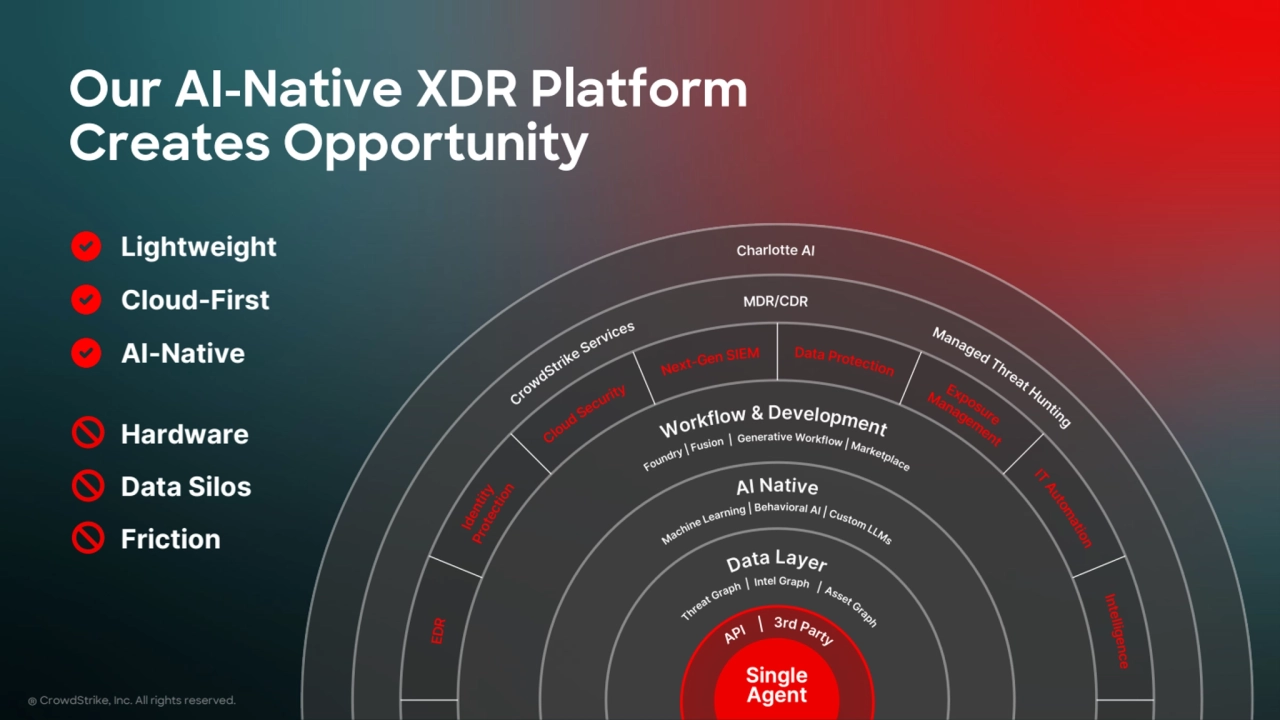
- 6. Lightweight Cloud-First AI-Native Hardware Data Silos Friction Our AI-Native XDR Platform Creates Opportunity ® CrowdStrike, Inc. All rights reserved.
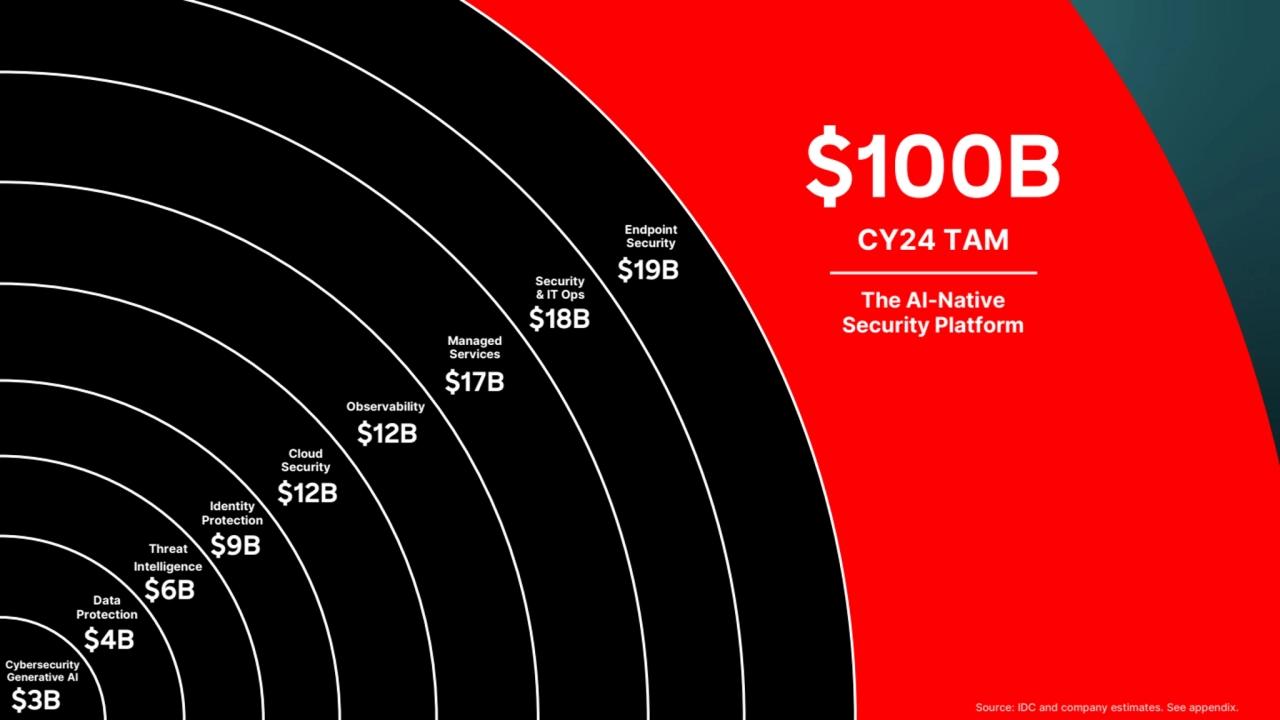
- 7. ©2023 CrowdStrike, Inc. All rights reserved. $19B Endpoint Security $18B Security & IT Ops $17B Managed Services $12B Observability $12B Cloud Security $9B Identity Protection Threat Intelligence $6B $4B Data Protection $3B Cybersecurity Generative AI CY25 TAM CY24 TAM $100B The AI-Native Security Platform Source: IDC and company estimates. See appendix.
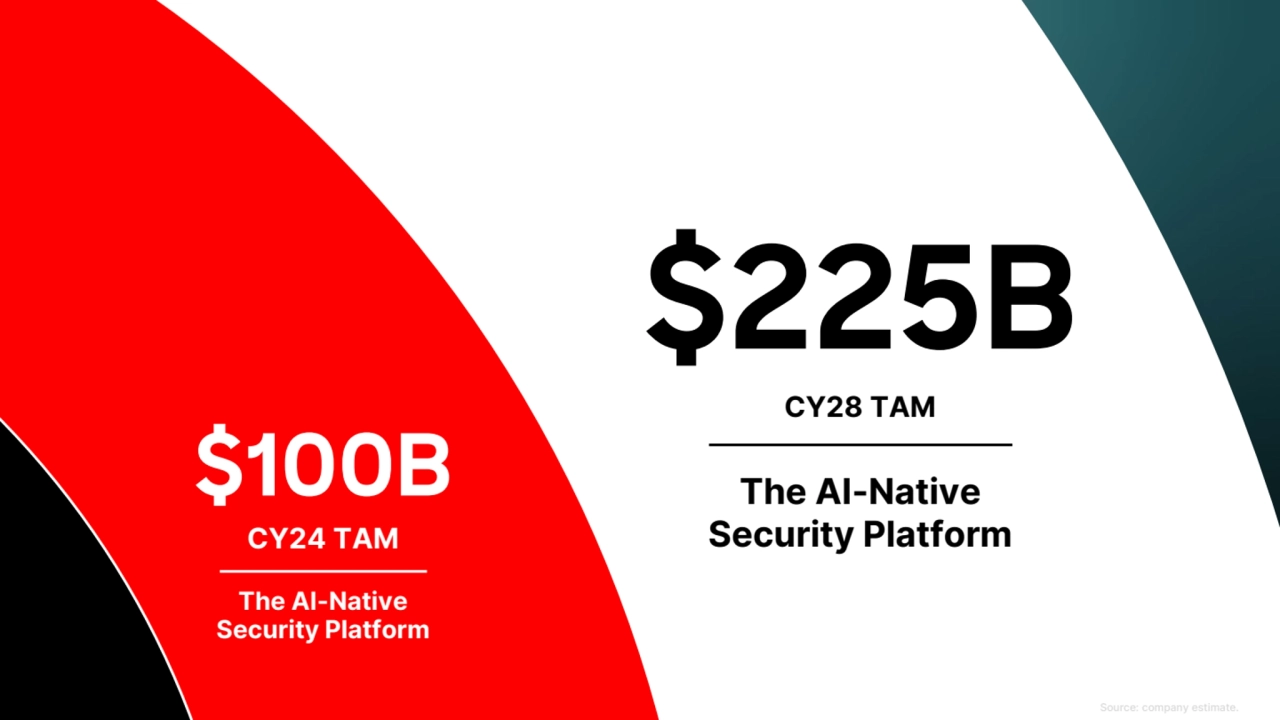
- 8. ©2023 CrowdStrike, Inc. All rights reserved. $225B The AI-Native Security Platform CY28 TAM CY24 TAM $100B The AI-Native Security Platform Source: company estimate.
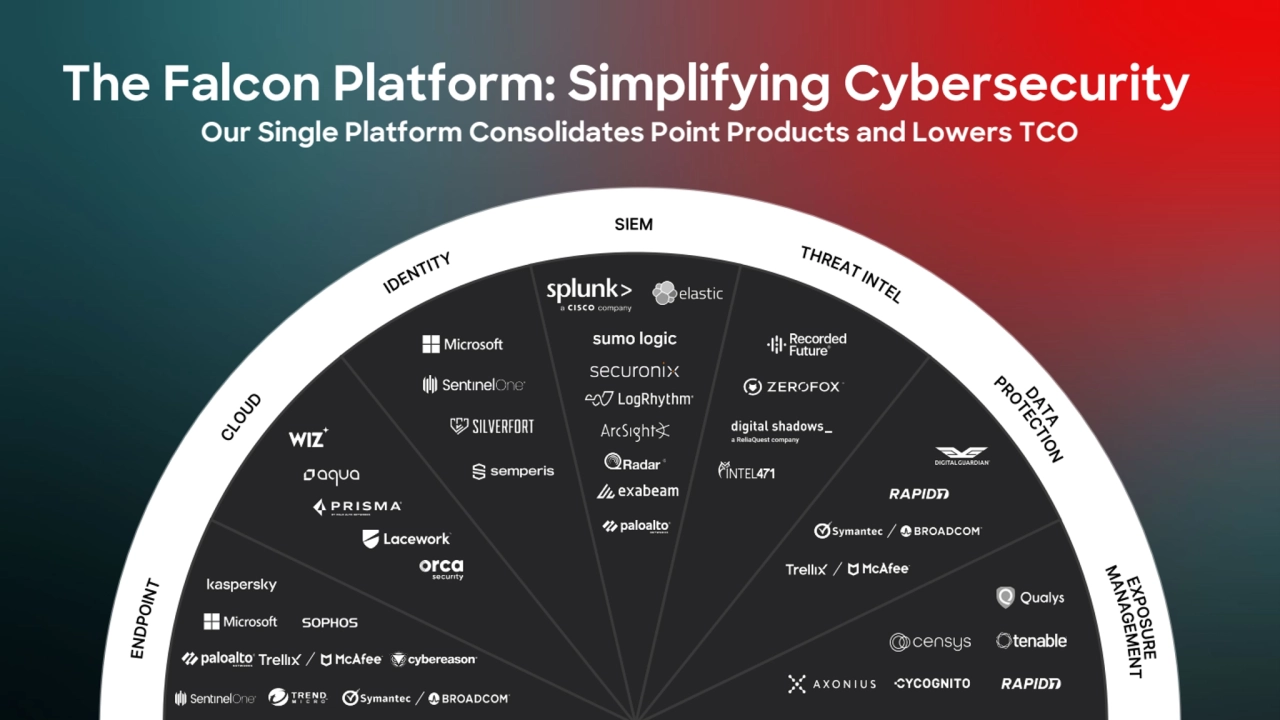
- 9. The Falcon Platform: Simplifying Cybersecurity Our Single Platform Consolidates Point Products and Lowers TCO
- 10. Platform Adoption ® CrowdStrike, Inc. All rights reserved.
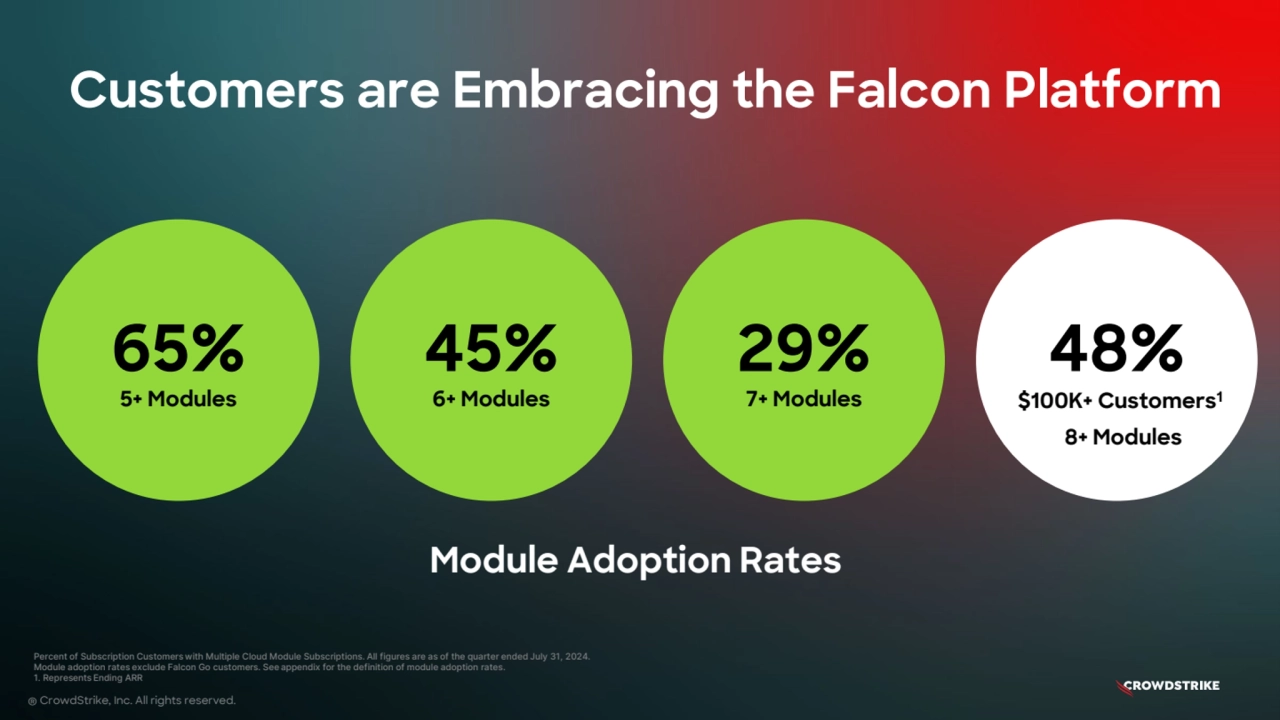
- 11. Customers are Embracing the Falcon Platform 65% 5+ Modules Percent of Subscription Customers with Multiple Cloud Module Subscriptions. All figures are as of the quarter ended July 31, 2024. Module adoption rates exclude Falcon Go customers. See appendix for the definition of module adoption rates. 1. Represents Ending ARR ® CrowdStrike, Inc. All rights reserved. 45% 6+ Modules 29% 7+ Modules 48% Module Adoption Rates $100K+ Customers1 8+ Modules
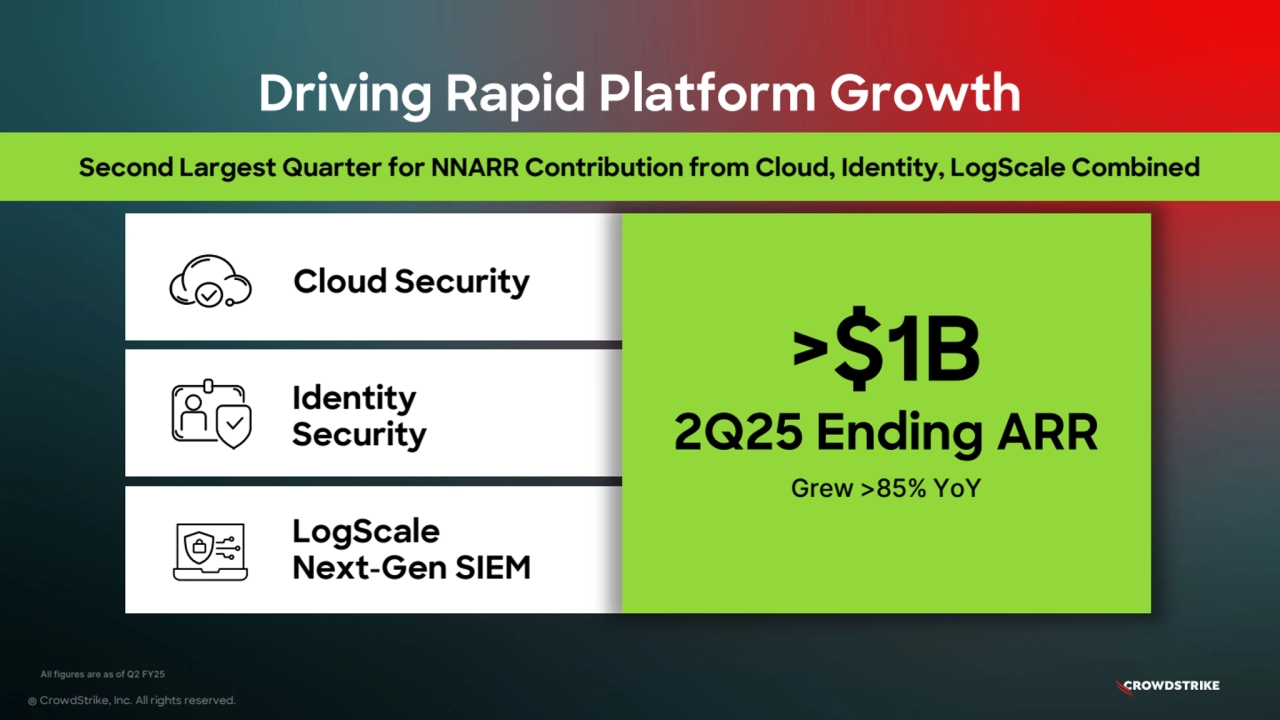
- 12. Driving Rapid Platform Growth ® CrowdStrike, Inc. All rights reserved. LogScale Next-Gen SIEM Cloud Security Identity Security >$1B 2Q25 Ending ARR All figures are as of Q2 FY25 Grew >85% YoY Second Largest Quarter for NNARR Contribution from Cloud, Identity, LogScale Combined
- 13. Driving Rapid Platform Growth ® CrowdStrike, Inc. All rights reserved. LogScale Next-Gen SIEM Cloud Security Identity Security All figures are as of Q2 FY25 >$515M 2Q25 Ending ARR >80% YoY Growth >$350M 2Q25 Ending ARR >70% YoY Growth >$220M 2Q25 Ending ARR >140% YoY Growth
- 14. Financial Overview ® CrowdStrike, Inc. All rights reserved.
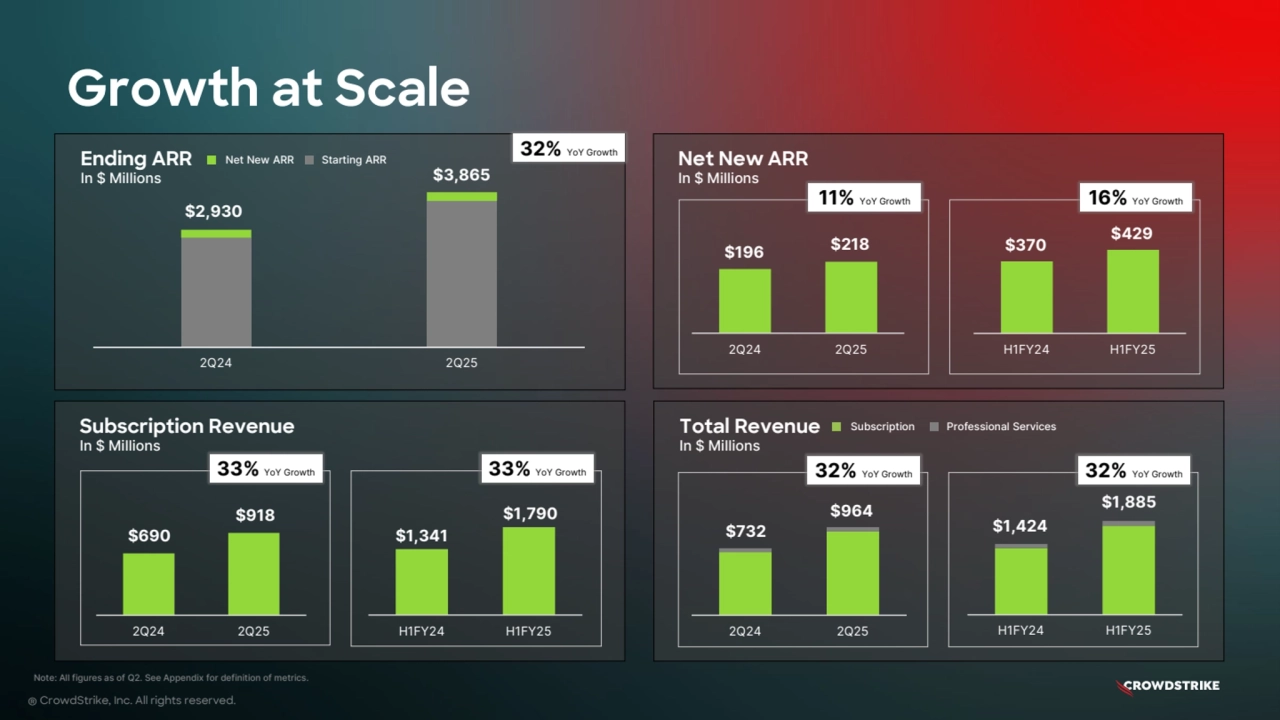
- 15. ® CrowdStrike, Inc. All rights reserved. Net New ARR In $ Millions Growth at Scale $370 $429 H1FY24 H1FY25 Ending ARR Net New ARR Starting ARR In $ Millions Subscription Revenue In $ Millions Total Revenue Subscription Professional Services In $ Millions $690 $918 2Q24 2Q25 $1,341 $1,790 H1FY24 H1FY25 $732 $964 2Q24 2Q25 $2,930 $3,865 2Q24 2Q25 11% YoY Growth 16% YoY Growth 33% YoY Growth 33% YoY Growth 32% YoY Growth $1,424 $1,885 H1FY24 H1FY25 32% YoY Growth Note: All figures as of Q2. See Appendix for definition of metrics. 32% YoY Growth $196 $218 2Q24 2Q25
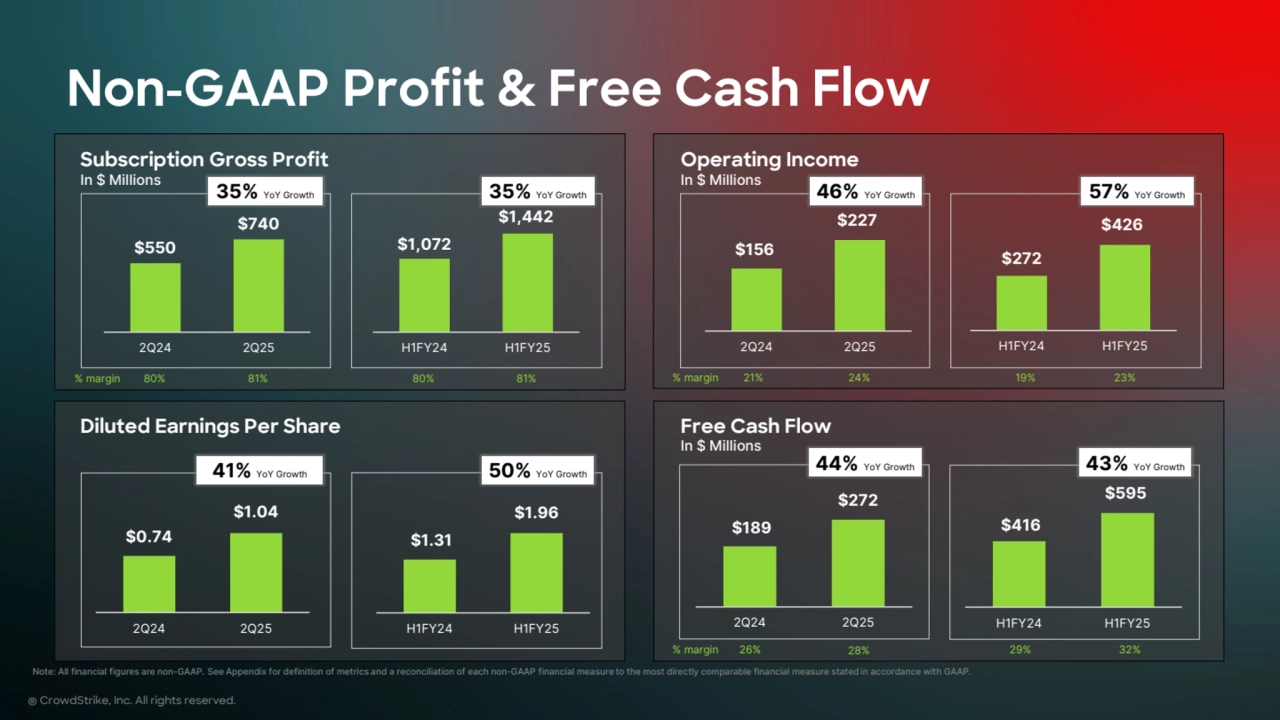
- 16. $0.74 $1.04 2Q24 2Q25 Note: All financial figures are non-GAAP. See Appendix for definition of metrics and a reconciliation of each non-GAAP financial measure to the most directly comparable financial measure stated in accordance with GAAP. ® CrowdStrike, Inc. All rights reserved. Subscription Gross Profit In $ Millions Non-GAAP Profit & Free Cash Flow Operating Income In $ Millions Diluted Earnings Per Share Free Cash Flow In $ Millions % margin 21% 24% 19% 23% $1.31 $1.96 H1FY24 H1FY25 $416 $595 H1FY24 H1FY25 % margin 26% 28% 29% 32% % margin 80% 81% 80% 81% $272 $426 H1FY24 H1FY25 41% YoY Growth 50% YoY Growth 46% YoY Growth 57% YoY Growth $1,072 $1,442 H1FY24 H1FY25 44% YoY Growth 43% YoY Growth 35% YoY Growth 35% YoY Growth $156 $227 2Q24 2Q25 $189 $272 2Q24 2Q25 $550 $740 2Q24 2Q25
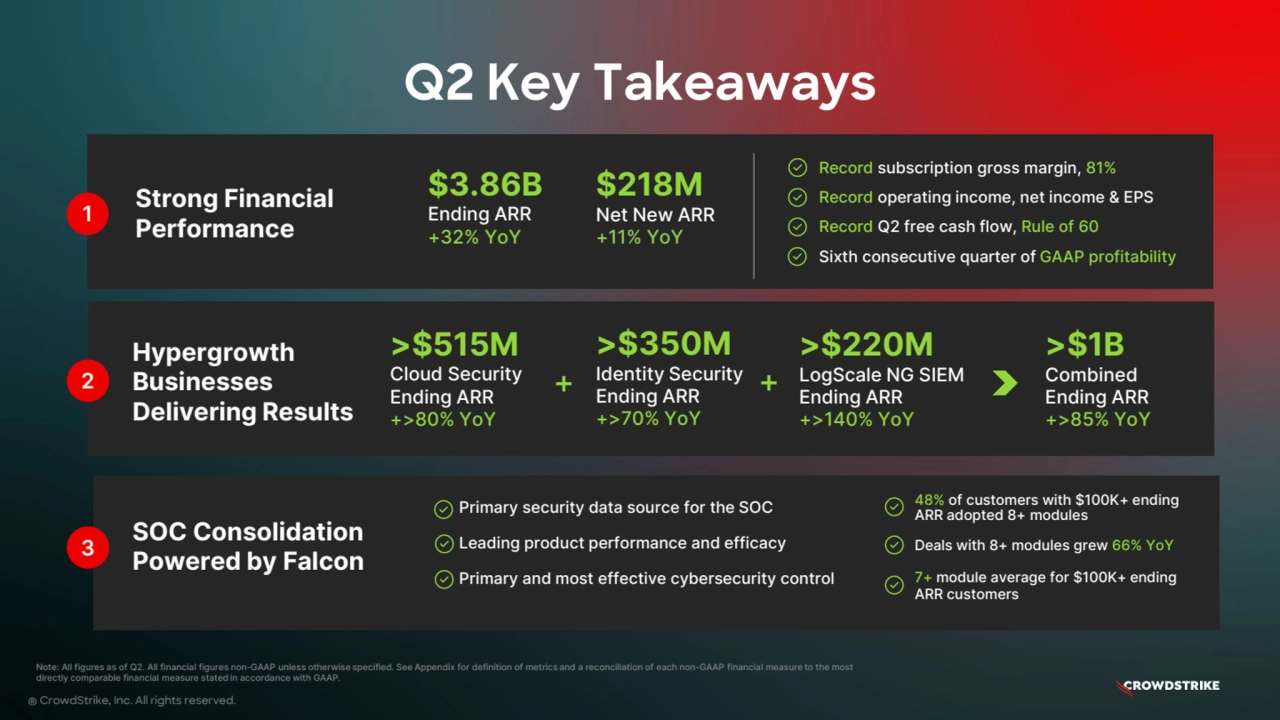
- 17. Q2 Key Takeaways ® CrowdStrike, Inc. All rights reserved. Strong Financial Performance 1 $3.86B Ending ARR +32% YoY 2 Hypergrowth Businesses Delivering Results 3 SOC Consolidation Powered by Falcon $218M Net New ARR +11% YoY Note: All figures as of Q2. All financial figures non-GAAP unless otherwise specified. See Appendix for definition of metrics and a reconciliation of each non-GAAP financial measure to the most directly comparable financial measure stated in accordance with GAAP. >$515M Cloud Security Ending ARR +>80% YoY >$350M Identity Security Ending ARR +>70% YoY >$220M LogScale NG SIEM Ending ARR +>140% YoY + + >$1B Combined Ending ARR +>85% YoY 48% of customers with $100K+ ending ARR adopted 8+ modules Deals with 8+ modules grew 66% YoY 7+ module average for $100K+ ending ARR customers Primary security data source for the SOC Leading product performance and efficacy Primary and most effective cybersecurity control Record operating income, net income & EPS Record Q2 free cash flow, Rule of 60 Sixth consecutive quarter of GAAP profitability Record subscription gross margin, 81%
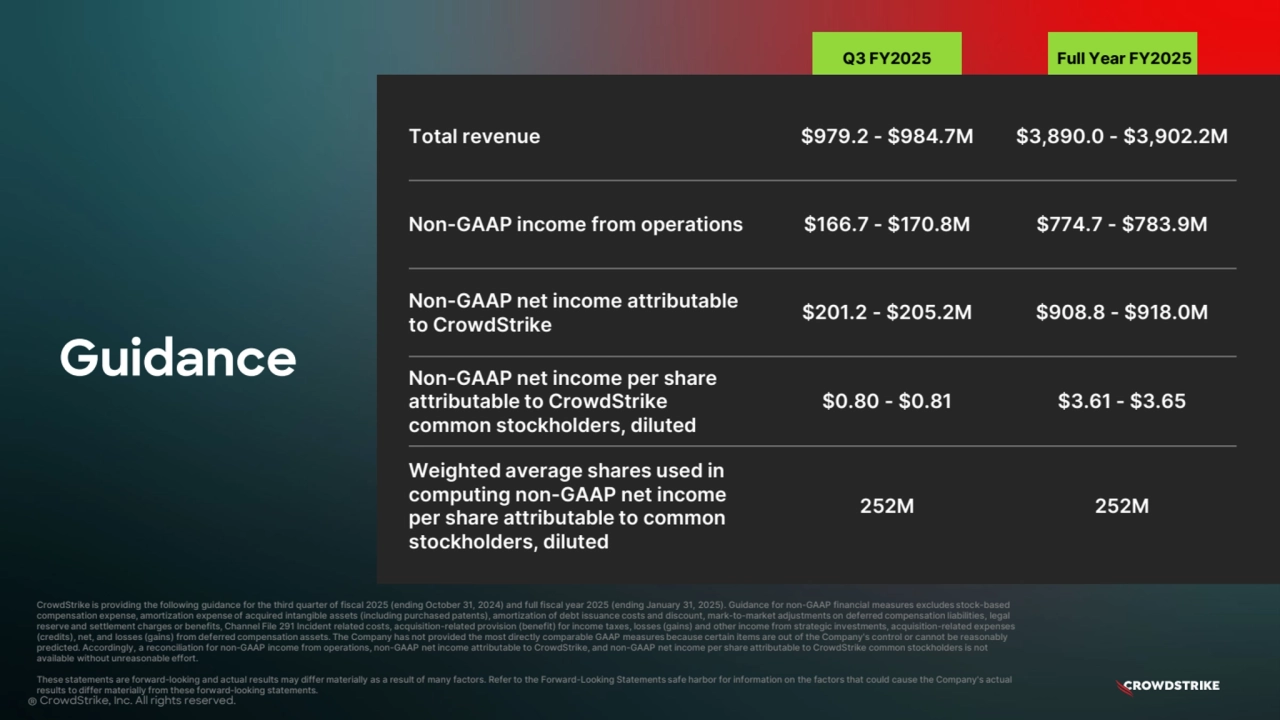
- 18. Q3 FY2025 Full Year FY2025 ® CrowdStrike, Inc. All rights reserved. Total revenue $979.2 - $984.7M $3,890.0 - $3,902.2M Non-GAAP income from operations $166.7 - $170.8M $774.7 - $783.9M Non-GAAP net income attributable to CrowdStrike $201.2 - $205.2M $908.8 - $918.0M Non-GAAP net income per share attributable to CrowdStrike common stockholders, diluted $0.80 - $0.81 $3.61 - $3.65 Weighted average shares used in computing non-GAAP net income per share attributable to common stockholders, diluted 252M 252M CrowdStrike is providing the following guidance for the third quarter of fiscal 2025 (ending October 31, 2024) and full fiscal year 2025 (ending January 31, 2025). Guidance for non-GAAP financial measures excludes stock-based compensation expense, amortization expense of acquired intangible assets (including purchased patents), amortization of debt issuance costs and discount, mark-to-market adjustments on deferred compensation liabilities, legal reserve and settlement charges or benefits, Channel File 291 Incident related costs, acquisition-related provision (benefit) for income taxes, losses (gains) and other income from strategic investments, acquisition-related expenses (credits), net, and losses (gains) from deferred compensation assets. The Company has not provided the most directly comparable GAAP measures because certain items are out of the Company's control or cannot be reasonably predicted. Accordingly, a reconciliation for non-GAAP income from operations, non-GAAP net income attributable to CrowdStrike, and non-GAAP net income per share attributable to CrowdStrike common stockholders is not available without unreasonable effort. These statements are forward-looking and actual results may differ materially as a result of many factors. Refer to the Forward-Looking Statements safe harbor for information on the factors that could cause the Company's actual results to differ materially from these forward-looking statements. Guidance
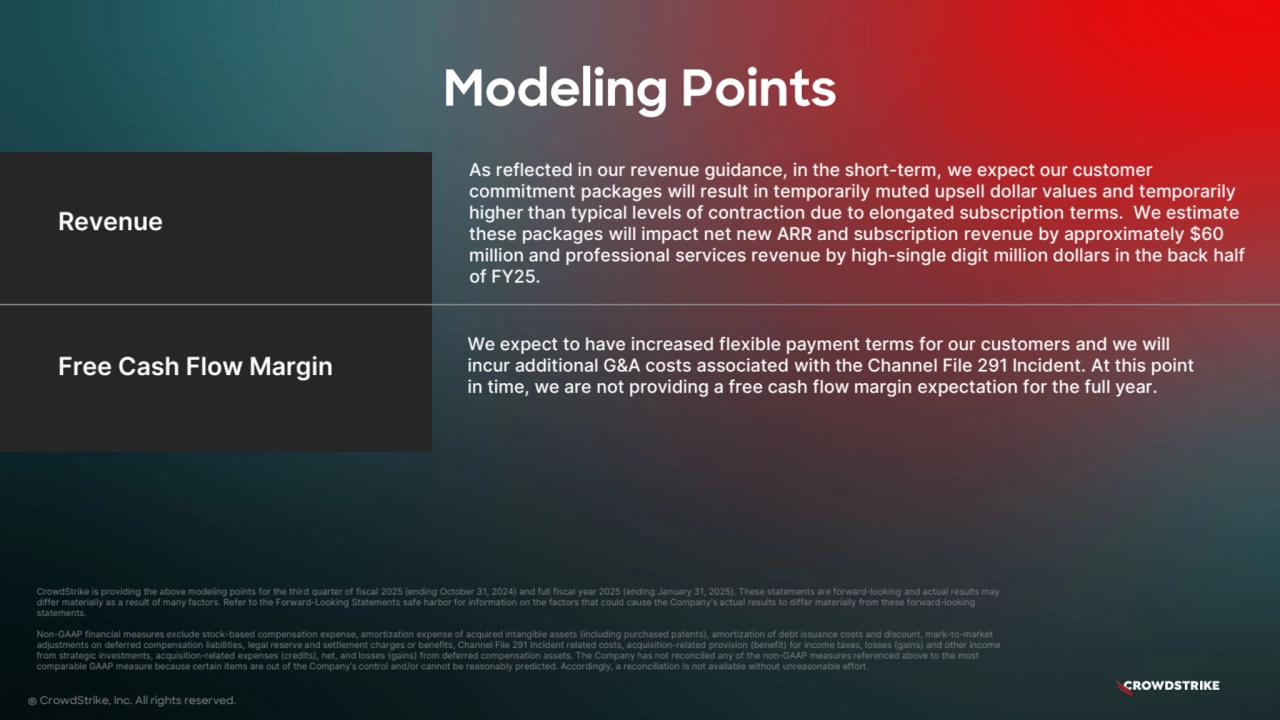
- 19. Revenue As reflected in our revenue guidance, in the short-term, we expect our customer commitment packages will result in temporarily muted upsell dollar values and temporarily higher than typical levels of contraction due to elongated subscription terms. We estimate these packages will impact net new ARR and subscription revenue by approximately $60 million and professional services revenue by high-single digit million dollars in the back half of FY25. We expect to have increased flexible payment terms for our customers and we will incur additional G&A costs associated with the Channel File 291 Incident. At this point in time, we are not providing a free cash flow margin expectation for the full year. Free Cash Flow Margin Modeling Points ® CrowdStrike, Inc. All rights reserved. CrowdStrike is providing the above modeling points for the third quarter of fiscal 2025 (ending October 31, 2024) and full fiscal year 2025 (ending January 31, 2025). These statements are forward-looking and actual results may differ materially as a result of many factors. Refer to the Forward-Looking Statements safe harbor for information on the factors that could cause the Company's actual results to differ materially from these forward-looking statements. Non-GAAP financial measures exclude stock-based compensation expense, amortization expense of acquired intangible assets (including purchased patents), amortization of debt issuance costs and discount, mark-to-market adjustments on deferred compensation liabilities, legal reserve and settlement charges or benefits, Channel File 291 Incident related costs, acquisition-related provision (benefit) for income taxes, losses (gains) and other income from strategic investments, acquisition-related expenses (credits), net, and losses (gains) from deferred compensation assets. The Company has not reconciled any of the non-GAAP measures referenced above to the most comparable GAAP measure because certain items are out of the Company’s control and/or cannot be reasonably predicted. Accordingly, a reconciliation is not available without unreasonable effort.
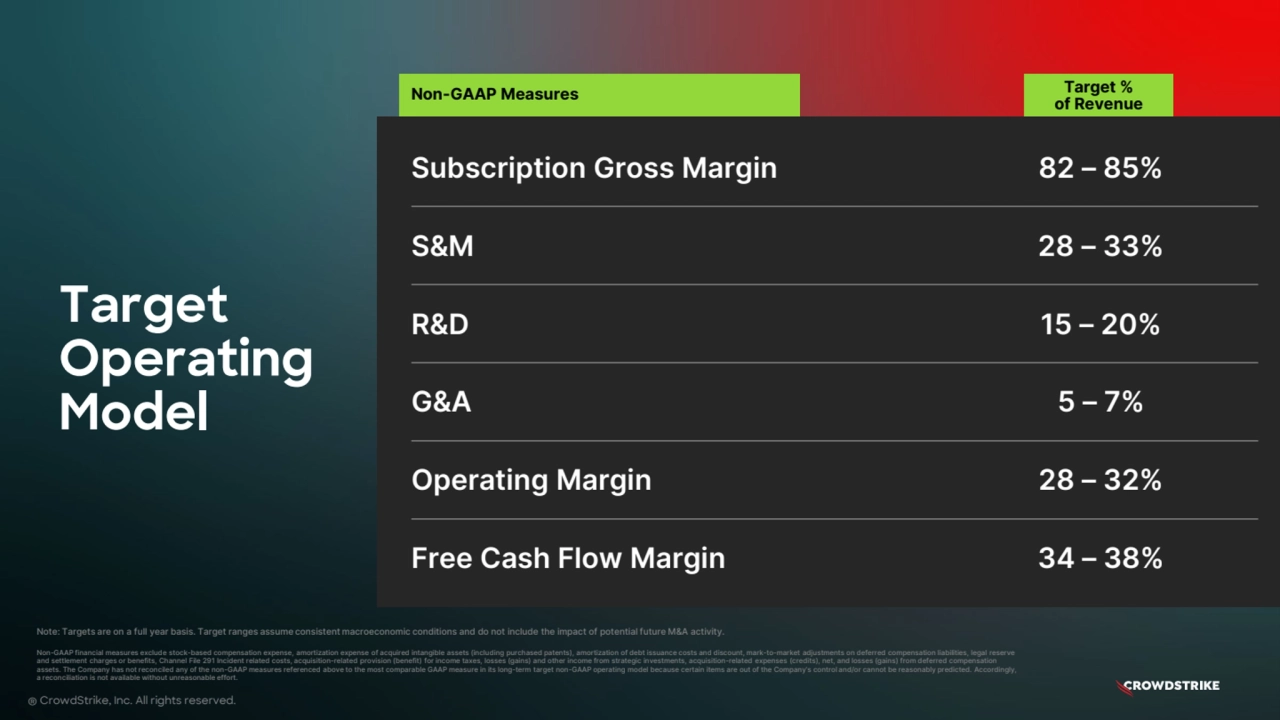
- 20. Target % of Revenue Target Operating Model Note: Targets are on a full year basis. Target ranges assume consistent macroeconomic conditions and do not include the impact of potential future M&A activity. Non-GAAP financial measures exclude stock-based compensation expense, amortization expense of acquired intangible assets (including purchased patents), amortization of debt issuance costs and discount, mark-to-market adjustments on deferred compensation liabilities, legal reserve and settlement charges or benefits, Channel File 291 Incident related costs, acquisition-related provision (benefit) for income taxes, losses (gains) and other income from strategic investments, acquisition-related expenses (credits), net, and losses (gains) from deferred compensation assets. The Company has not reconciled any of the non-GAAP measures referenced above to the most comparable GAAP measure in its long-term target non-GAAP operating model because certain items are out of the Company’s control and/or cannot be reasonably predicted. Accordingly, a reconciliation is not available without unreasonable effort. Subscription Gross Margin 82 – 85% S&M 28 – 33% R&D 15 – 20% G&A 5 – 7% Operating Margin 28 – 32% Free Cash Flow Margin 34 – 38% ® CrowdStrike, Inc. All rights reserved. Non-GAAP Measures
- 21. Appendix ® CrowdStrike, Inc. All rights reserved.
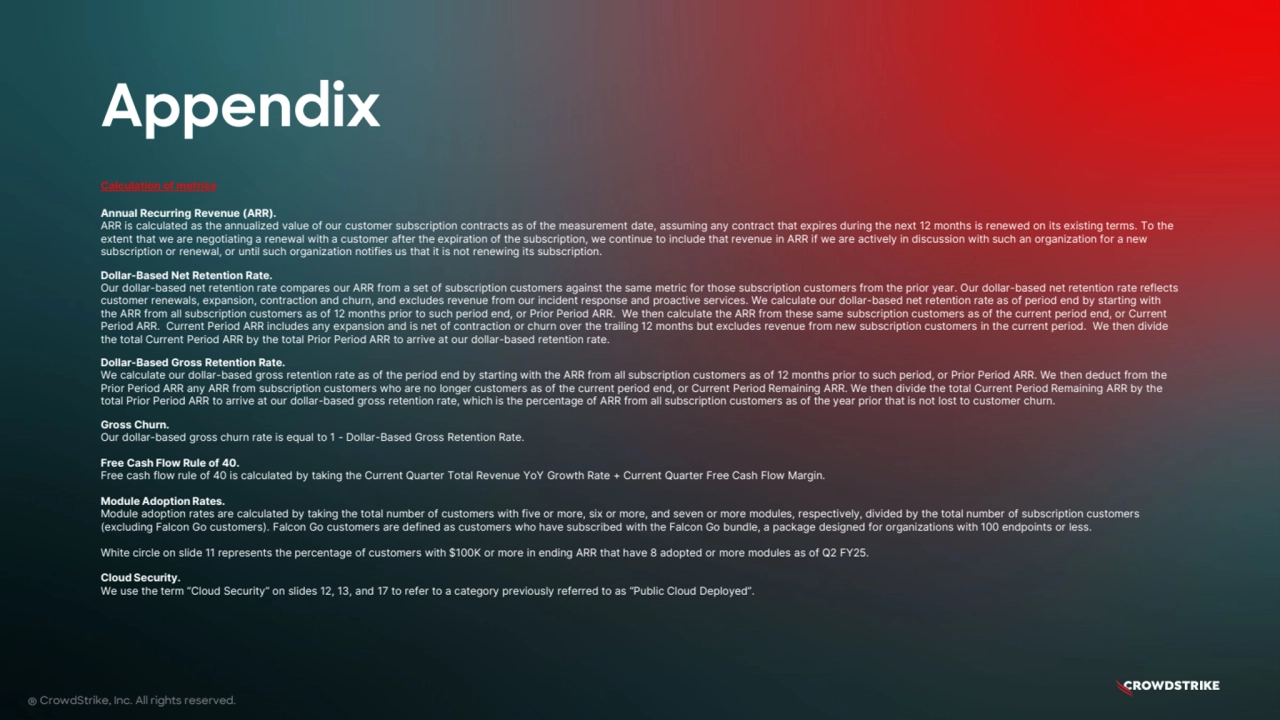
- 22. Appendix Calculation of metrics Annual Recurring Revenue (ARR). ARR is calculated as the annualized value of our customer subscription contracts as of the measurement date, assuming any contract that expires during the next 12 months is renewed on its existing terms. To the extent that we are negotiating a renewal with a customer after the expiration of the subscription, we continue to include that revenue in ARR if we are actively in discussion with such an organization for a new subscription or renewal, or until such organization notifies us that it is not renewing its subscription. Dollar-Based Net Retention Rate. Our dollar-based net retention rate compares our ARR from a set of subscription customers against the same metric for those subscription customers from the prior year. Our dollar-based net retention rate reflects customer renewals, expansion, contraction and churn, and excludes revenue from our incident response and proactive services. We calculate our dollar-based net retention rate as of period end by starting with the ARR from all subscription customers as of 12 months prior to such period end, or Prior Period ARR. We then calculate the ARR from these same subscription customers as of the current period end, or Current Period ARR. Current Period ARR includes any expansion and is net of contraction or churn over the trailing 12 months but excludes revenue from new subscription customers in the current period. We then divide the total Current Period ARR by the total Prior Period ARR to arrive at our dollar-based retention rate. Dollar-Based Gross Retention Rate. We calculate our dollar-based gross retention rate as of the period end by starting with the ARR from all subscription customers as of 12 months prior to such period, or Prior Period ARR. We then deduct from the Prior Period ARR any ARR from subscription customers who are no longer customers as of the current period end, or Current Period Remaining ARR. We then divide the total Current Period Remaining ARR by the total Prior Period ARR to arrive at our dollar-based gross retention rate, which is the percentage of ARR from all subscription customers as of the year prior that is not lost to customer churn. Gross Churn. Our dollar-based gross churn rate is equal to 1 - Dollar-Based Gross Retention Rate. Free Cash Flow Rule of 40. Free cash flow rule of 40 is calculated by taking the Current Quarter Total Revenue YoY Growth Rate + Current Quarter Free Cash Flow Margin. Module Adoption Rates. Module adoption rates are calculated by taking the total number of customers with five or more, six or more, and seven or more modules, respectively, divided by the total number of subscription customers (excluding Falcon Go customers). Falcon Go customers are defined as customers who have subscribed with the Falcon Go bundle, a package designed for organizations with 100 endpoints or less. White circle on slide 11 represents the percentage of customers with $100K or more in ending ARR that have 8 adopted or more modules as of Q2 FY25. Cloud Security. We use the term “Cloud Security” on slides 12, 13, and 17 to refer to a category previously referred to as “Public Cloud Deployed”. ® CrowdStrike, Inc. All rights reserved.
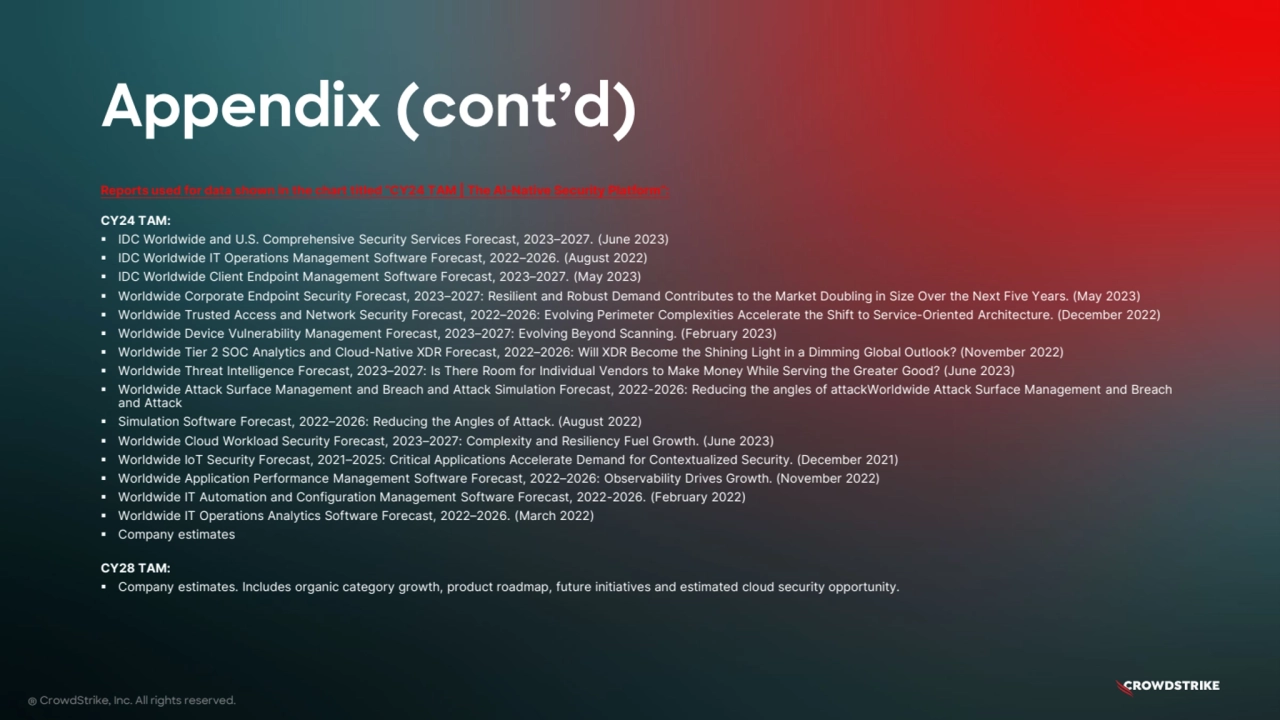
- 23. Reports used for data shown in the chart titled “CY24 TAM | The AI-Native Security Platform”: CY24 TAM: IDC Worldwide and U.S. Comprehensive Security Services Forecast, 2023–2027. (June 2023) IDC Worldwide IT Operations Management Software Forecast, 2022–2026. (August 2022) IDC Worldwide Client Endpoint Management Software Forecast, 2023–2027. (May 2023) Worldwide Corporate Endpoint Security Forecast, 2023–2027: Resilient and Robust Demand Contributes to the Market Doubling in Size Over the Next Five Years. (May 2023) Worldwide Trusted Access and Network Security Forecast, 2022–2026: Evolving Perimeter Complexities Accelerate the Shift to Service-Oriented Architecture. (December 2022) Worldwide Device Vulnerability Management Forecast, 2023–2027: Evolving Beyond Scanning. (February 2023) Worldwide Tier 2 SOC Analytics and Cloud-Native XDR Forecast, 2022–2026: Will XDR Become the Shining Light in a Dimming Global Outlook? (November 2022) Worldwide Threat Intelligence Forecast, 2023–2027: Is There Room for Individual Vendors to Make Money While Serving the Greater Good? (June 2023) Worldwide Attack Surface Management and Breach and Attack Simulation Forecast, 2022-2026: Reducing the angles of attackWorldwide Attack Surface Management and Breach and Attack Simulation Software Forecast, 2022–2026: Reducing the Angles of Attack. (August 2022) Worldwide Cloud Workload Security Forecast, 2023–2027: Complexity and Resiliency Fuel Growth. (June 2023) Worldwide IoT Security Forecast, 2021–2025: Critical Applications Accelerate Demand for Contextualized Security. (December 2021) Worldwide Application Performance Management Software Forecast, 2022–2026: Observability Drives Growth. (November 2022) Worldwide IT Automation and Configuration Management Software Forecast, 2022-2026. (February 2022) Worldwide IT Operations Analytics Software Forecast, 2022–2026. (March 2022) Company estimates CY28 TAM: Company estimates. Includes organic category growth, product roadmap, future initiatives and estimated cloud security opportunity. Appendix (cont’d) ® CrowdStrike, Inc. All rights reserved.
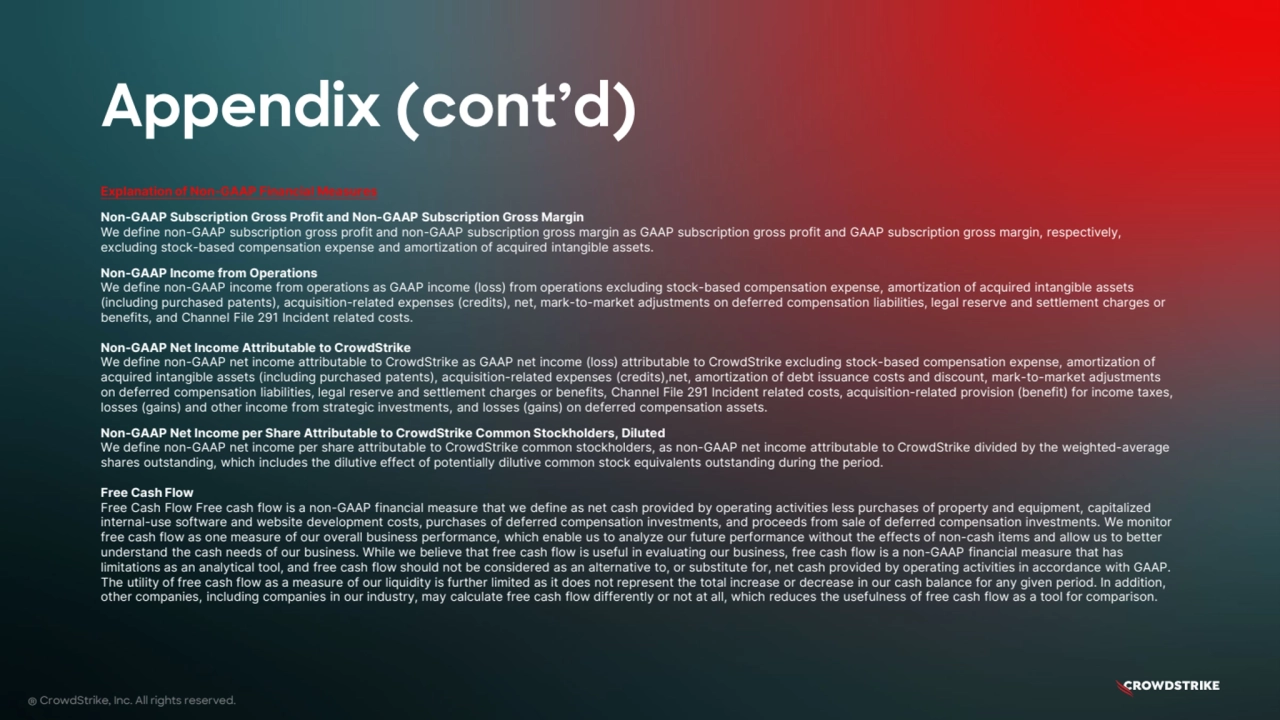
- 24. Appendix (cont’d) ® CrowdStrike, Inc. All rights reserved. Explanation of Non-GAAP Financial Measures Non-GAAP Subscription Gross Profit and Non-GAAP Subscription Gross Margin We define non-GAAP subscription gross profit and non-GAAP subscription gross margin as GAAP subscription gross profit and GAAP subscription gross margin, respectively, excluding stock-based compensation expense and amortization of acquired intangible assets. Non-GAAP Income from Operations We define non-GAAP income from operations as GAAP income (loss) from operations excluding stock-based compensation expense, amortization of acquired intangible assets (including purchased patents), acquisition-related expenses (credits), net, mark-to-market adjustments on deferred compensation liabilities, legal reserve and settlement charges or benefits, and Channel File 291 Incident related costs. Non-GAAP Net Income Attributable to CrowdStrike We define non-GAAP net income attributable to CrowdStrike as GAAP net income (loss) attributable to CrowdStrike excluding stock-based compensation expense, amortization of acquired intangible assets (including purchased patents), acquisition-related expenses (credits),net, amortization of debt issuance costs and discount, mark-to-market adjustments on deferred compensation liabilities, legal reserve and settlement charges or benefits, Channel File 291 Incident related costs, acquisition-related provision (benefit) for income taxes, losses (gains) and other income from strategic investments, and losses (gains) on deferred compensation assets. Non-GAAP Net Income per Share Attributable to CrowdStrike Common Stockholders, Diluted We define non-GAAP net income per share attributable to CrowdStrike common stockholders, as non-GAAP net income attributable to CrowdStrike divided by the weighted-average shares outstanding, which includes the dilutive effect of potentially dilutive common stock equivalents outstanding during the period. Free Cash Flow Free Cash Flow Free cash flow is a non-GAAP financial measure that we define as net cash provided by operating activities less purchases of property and equipment, capitalized internal-use software and website development costs, purchases of deferred compensation investments, and proceeds from sale of deferred compensation investments. We monitor free cash flow as one measure of our overall business performance, which enable us to analyze our future performance without the effects of non-cash items and allow us to better understand the cash needs of our business. While we believe that free cash flow is useful in evaluating our business, free cash flow is a non-GAAP financial measure that has limitations as an analytical tool, and free cash flow should not be considered as an alternative to, or substitute for, net cash provided by operating activities in accordance with GAAP. The utility of free cash flow as a measure of our liquidity is further limited as it does not represent the total increase or decrease in our cash balance for any given period. In addition, other companies, including companies in our industry, may calculate free cash flow differently or not at all, which reduces the usefulness of free cash flow as a tool for comparison.
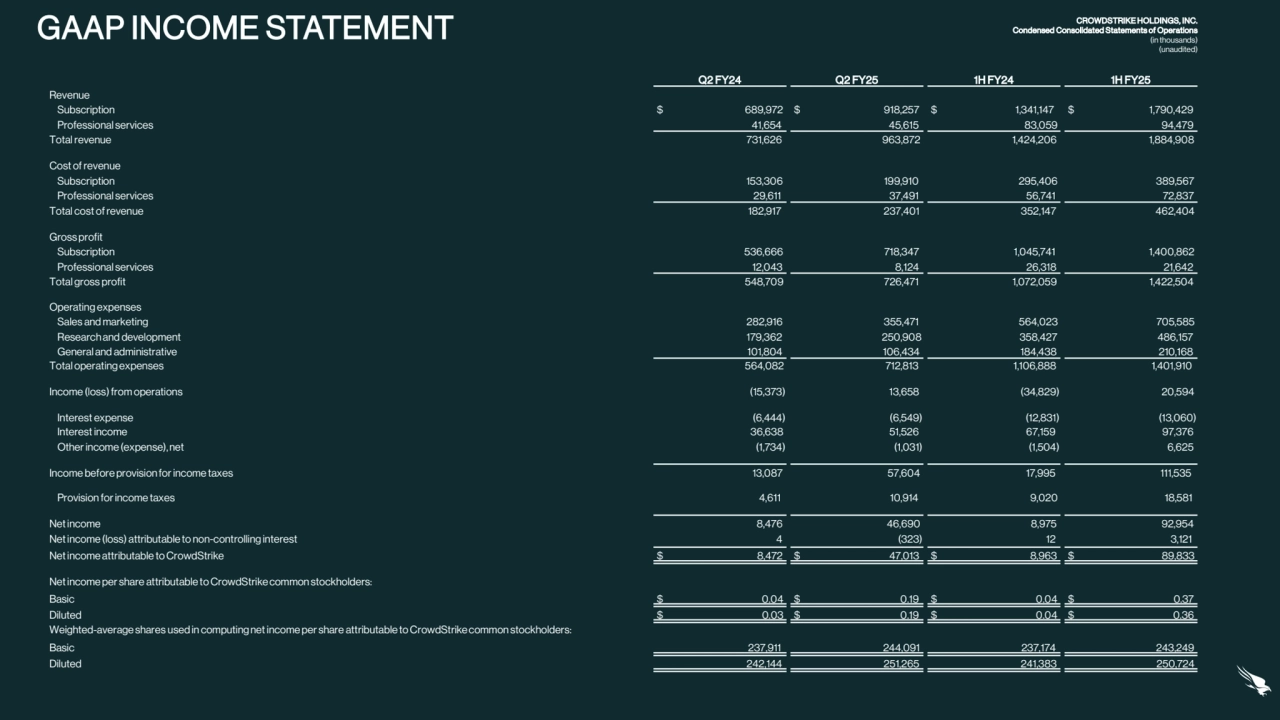
- 25. GAAP INCOME STATEMENT CROWDSTRIKE HOLDINGS, INC. Condensed Consolidated Statements of Operations (in thousands) (unaudited) Q2 FY24 Q2 FY25 1H FY24 1H FY25 Revenue Subscription $ 689,972 $ 918,257 $ 1,341,147 $ 1,790,429 Professional services 41,654 45,615 83,059 94,479 Total revenue 731,626 963,872 1,424,206 1,884,908 Cost of revenue Subscription 153,306 199,910 295,406 389,567 Professional services 29,611 37,491 56,741 72,837 Total cost of revenue 182,917 237,401 352,147 462,404 Gross profit Subscription 536,666 718,347 1,045,741 1,400,862 Professional services 12,043 8,124 26,318 21,642 Total gross profit 548,709 726,471 1,072,059 1,422,504 Operating expenses Sales and marketing 282,916 355,471 564,023 705,585 Research and development 179,362 250,908 358,427 486,157 General and administrative 101,804 106,434 184,438 210,168 Total operating expenses 564,082 712,813 1,106,888 1,401,910 Income (loss) from operations (15,373) 13,658 (34,829) 20,594 Interest expense (6,444) (6,549) (12,831) (13,060) Interest income 36,638 51,526 67,159 97,376 Other income (expense), net (1,734) (1,031) (1,504) 6,625 Income before provision for income taxes 13,087 57,604 17,995 111,535 Provision for income taxes 4,611 10,914 9,020 18,581 Net income 8,476 46,690 8,975 92,954 Net income (loss) attributable to non-controlling interest 4 (323) 12 3,121 Net income attributable to CrowdStrike $ 8,472 $ 47,013 $ 8,963 $ 89,833 Net income per share attributable to CrowdStrike common stockholders: Basic $ 0.04 $ 0.19 $ 0.04 $ 0.37 Diluted $ 0.03 $ 0.19 $ 0.04 $ 0.36 Weighted-average shares used in computing net income per share attributable to CrowdStrike common stockholders: Basic 237,911 244,091 237,174 243,249 Diluted 242,144 251,265 241,383 250,724
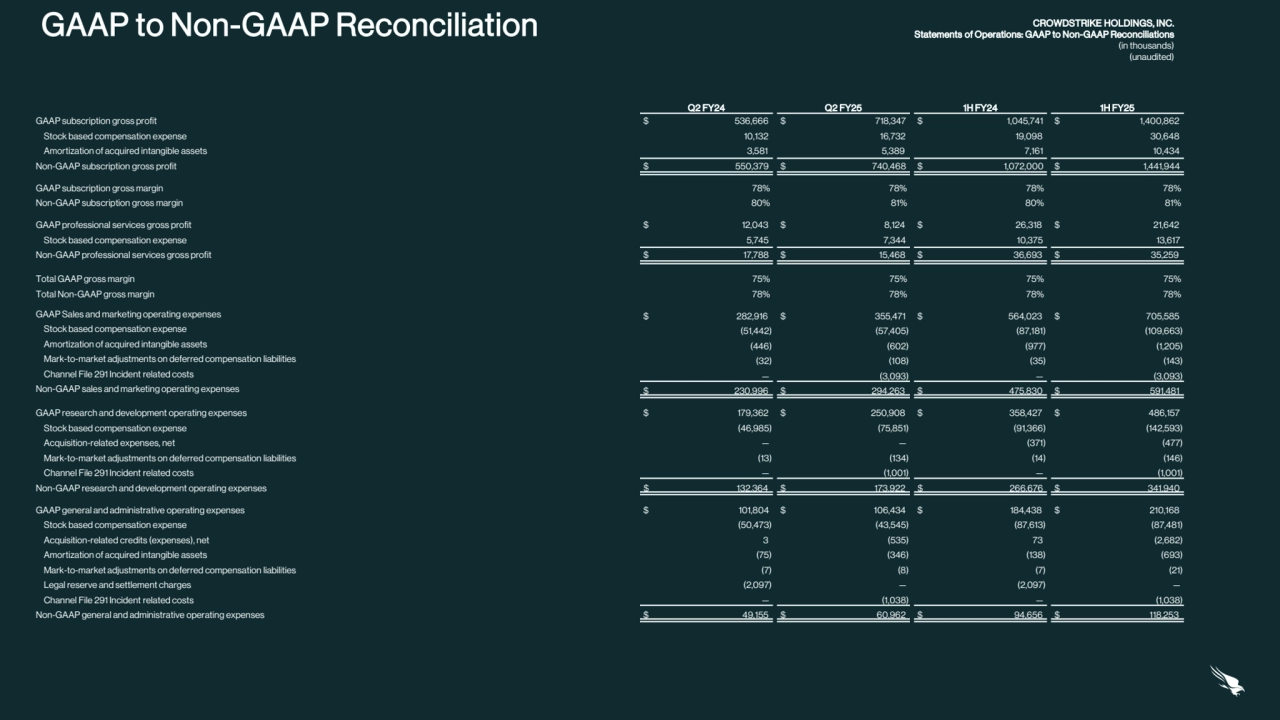
- 26. GAAP to Non-GAAP Reconciliation CROWDSTRIKE HOLDINGS, INC. Statements of Operations: GAAP to Non-GAAP Reconciliations (in thousands) (unaudited) Q2 FY24 Q2 FY25 1H FY24 1H FY25 GAAP subscription gross profit $ 536,666 $ 718,347 $ 1,045,741 $ 1,400,862 Stock based compensation expense 10,132 16,732 19,098 30,648 Amortization of acquired intangible assets 3,581 5,389 7,161 10,434 Non-GAAP subscription gross profit $ 550,379 $ 740,468 $ 1,072,000 $ 1,441,944 GAAP subscription gross margin 78% 78% 78% 78% Non-GAAP subscription gross margin 80% 81% 80% 81% GAAP professional services gross profit $ 12,043 $ 8,124 $ 26,318 $ 21,642 Stock based compensation expense 5,745 7,344 10,375 13,617 Non-GAAP professional services gross profit $ 17,788 $ 15,468 $ 36,693 $ 35,259 Total GAAP gross margin 75% 75% 75% 75% Total Non-GAAP gross margin 78% 78% 78% 78% GAAP Sales and marketing operating expenses $ 282,916 $ 355,471 $ 564,023 $ 705,585 Stock based compensation expense (51,442) (57,405) (87,181) (109,663) Amortization of acquired intangible assets (446) (602) (977) (1,205) Mark-to-market adjustments on deferred compensation liabilities (32) (108) (35) (143) Channel File 291 Incident related costs — (3,093) — (3,093) Non-GAAP sales and marketing operating expenses $ 230,996 $ 294,263 $ 475,830 $ 591,481 GAAP research and development operating expenses $ 179,362 $ 250,908 $ 358,427 $ 486,157 Stock based compensation expense (46,985) (75,851) (91,366) (142,593) Acquisition-related expenses, net — — (371) (477) Mark-to-market adjustments on deferred compensation liabilities (13) (134) (14) (146) Channel File 291 Incident related costs — (1,001) — (1,001) Non-GAAP research and development operating expenses $ 132,364 $ 173,922 $ 266,676 $ 341,940 GAAP general and administrative operating expenses $ 101,804 $ 106,434 $ 184,438 $ 210,168 Stock based compensation expense (50,473) (43,545) (87,613) (87,481) Acquisition-related credits (expenses), net 3 (535) 73 (2,682) Amortization of acquired intangible assets (75) (346) (138) (693) Mark-to-market adjustments on deferred compensation liabilities (7) (8) (7) (21) Legal reserve and settlement charges (2,097) — (2,097) — Channel File 291 Incident related costs — (1,038) — (1,038) Non-GAAP general and administrative operating expenses $ 49,155 $ 60,962 $ 94,656 $ 118,253
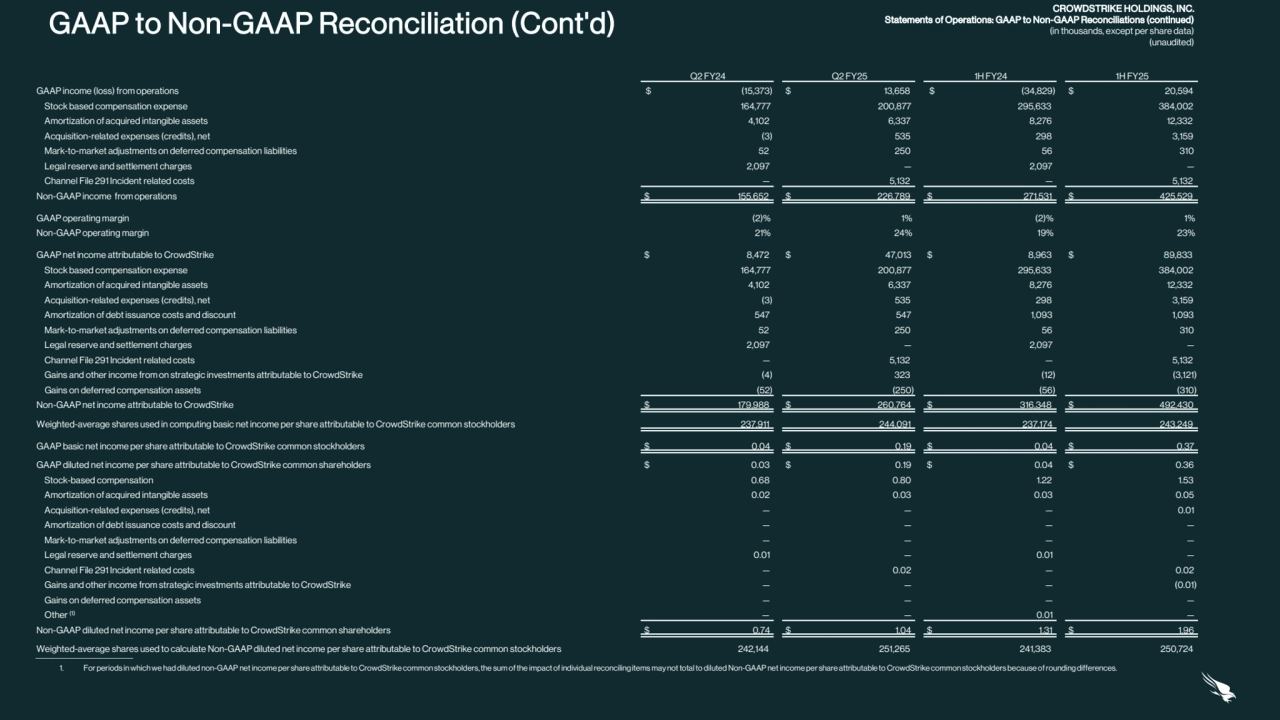
- 27. CROWDSTRIKE HOLDINGS, INC. Statements of Operations: GAAP to Non-GAAP Reconciliations (continued) (in thousands, except per share data) (unaudited) Q2 FY24 Q2 FY25 1H FY24 1H FY25 GAAP income (loss) from operations $ (15,373) $ 13,658 $ (34,829) $ 20,594 Stock based compensation expense 164,777 200,877 295,633 384,002 Amortization of acquired intangible assets 4,102 6,337 8,276 12,332 Acquisition-related expenses (credits), net (3) 535 298 3,159 Mark-to-market adjustments on deferred compensation liabilities 52 250 56 310 Legal reserve and settlement charges 2,097 — 2,097 — Channel File 291 Incident related costs — 5,132 — 5,132 Non-GAAP income from operations $ 155,652 $ 226,789 $ 271,531 $ 425,529 GAAP operating margin (2)% 1% (2)% 1% Non-GAAP operating margin 21% 24% 19% 23% GAAP net income attributable to CrowdStrike $ 8,472 $ 47,013 $ 8,963 $ 89,833 Stock based compensation expense 164,777 200,877 295,633 384,002 Amortization of acquired intangible assets 4,102 6,337 8,276 12,332 Acquisition-related expenses (credits), net (3) 535 298 3,159 Amortization of debt issuance costs and discount 547 547 1,093 1,093 Mark-to-market adjustments on deferred compensation liabilities 52 250 56 310 Legal reserve and settlement charges 2,097 — 2,097 — Channel File 291 Incident related costs — 5,132 — 5,132 Gains and other income from on strategic investments attributable to CrowdStrike (4) 323 (12) (3,121) Gains on deferred compensation assets (52) (250) (56) (310) Non-GAAP net income attributable to CrowdStrike $ 179,988 $ 260,764 $ 316,348 $ 492,430 Weighted-average shares used in computing basic net income per share attributable to CrowdStrike common stockholders 237,911 244,091 237,174 243,249 GAAP basic net income per share attributable to CrowdStrike common stockholders $ 0.04 $ 0.19 $ 0.04 $ 0.37 GAAP diluted net income per share attributable to CrowdStrike common shareholders $ 0.03 $ 0.19 $ 0.04 $ 0.36 Stock-based compensation 0.68 0.80 1.22 1.53 Amortization of acquired intangible assets 0.02 0.03 0.03 0.05 Acquisition-related expenses (credits), net — — — 0.01 Amortization of debt issuance costs and discount — — — — Mark-to-market adjustments on deferred compensation liabilities — — — — Legal reserve and settlement charges 0.01 — 0.01 — Channel File 291 Incident related costs — 0.02 — 0.02 Gains and other income from strategic investments attributable to CrowdStrike — — — (0.01) Gains on deferred compensation assets — — — — Other (1) — — 0.01 — Non-GAAP diluted net income per share attributable to CrowdStrike common shareholders $ 0.74 $ 1.04 $ 1.31 $ 1.96 Weighted-average shares used to calculate Non-GAAP diluted net income per share attributable to CrowdStrike common stockholders 242,144 251,265 241,383 250,724 _____________________________ 1. For periods in which we had diluted non-GAAP net income per share attributable to CrowdStrike common stockholders, the sum of the impact of individual reconciling items may not total to diluted Non-GAAP net income per share attributable to CrowdStrike common stockholders because of rounding differences. GAAP to Non-GAAP Reconciliation (Cont'd)
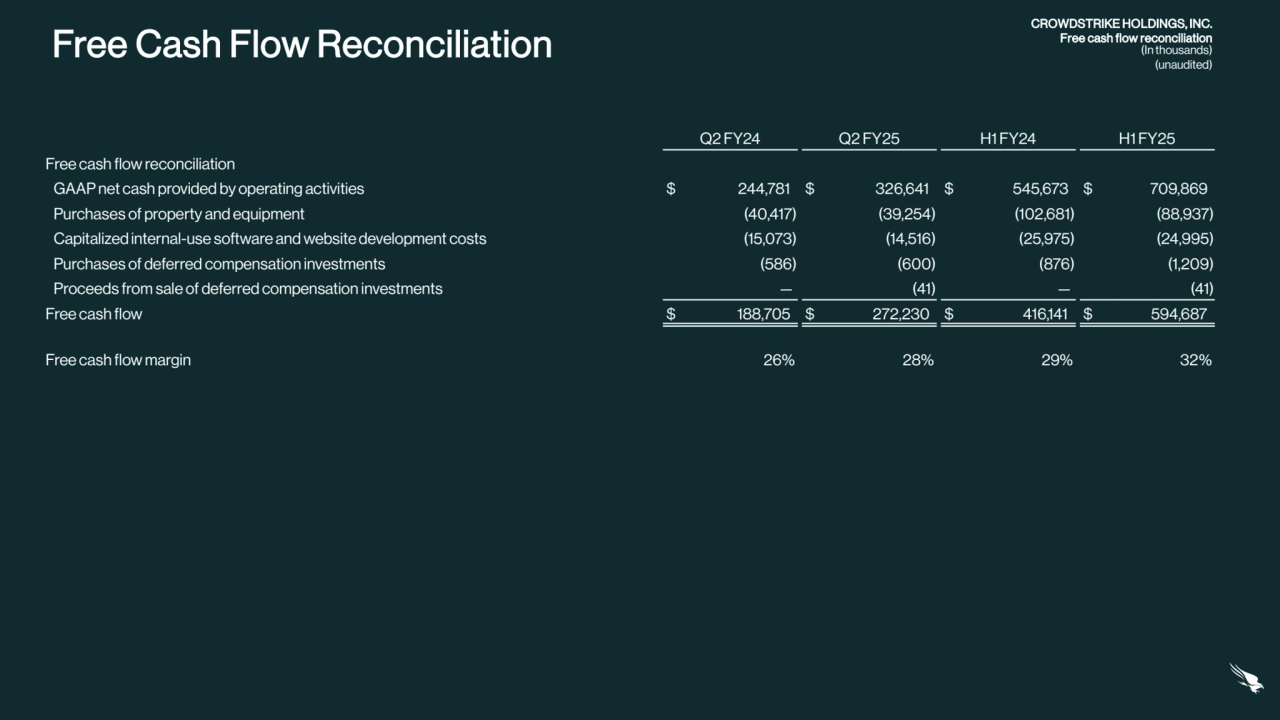
- 28. Free Cash Flow Reconciliation CROWDSTRIKE HOLDINGS, INC. Free cash flow reconciliation (In thousands) (unaudited) Q2 FY24 Q2 FY25 H1 FY24 H1 FY25 Free cash flow reconciliation GAAP net cash provided by operating activities $ 244,781 $ 326,641 $ 545,673 $ 709,869 Purchases of property and equipment (40,417) (39,254) (102,681) (88,937) Capitalized internal-use software and website development costs (15,073) (14,516) (25,975) (24,995) Purchases of deferred compensation investments (586) (600) (876) (1,209) Proceeds from sale of deferred compensation investments — (41) — (41) Free cash flow $ 188,705 $ 272,230 $ 416,141 $ 594,687 Free cash flow margin 26% 28% 29% 32%
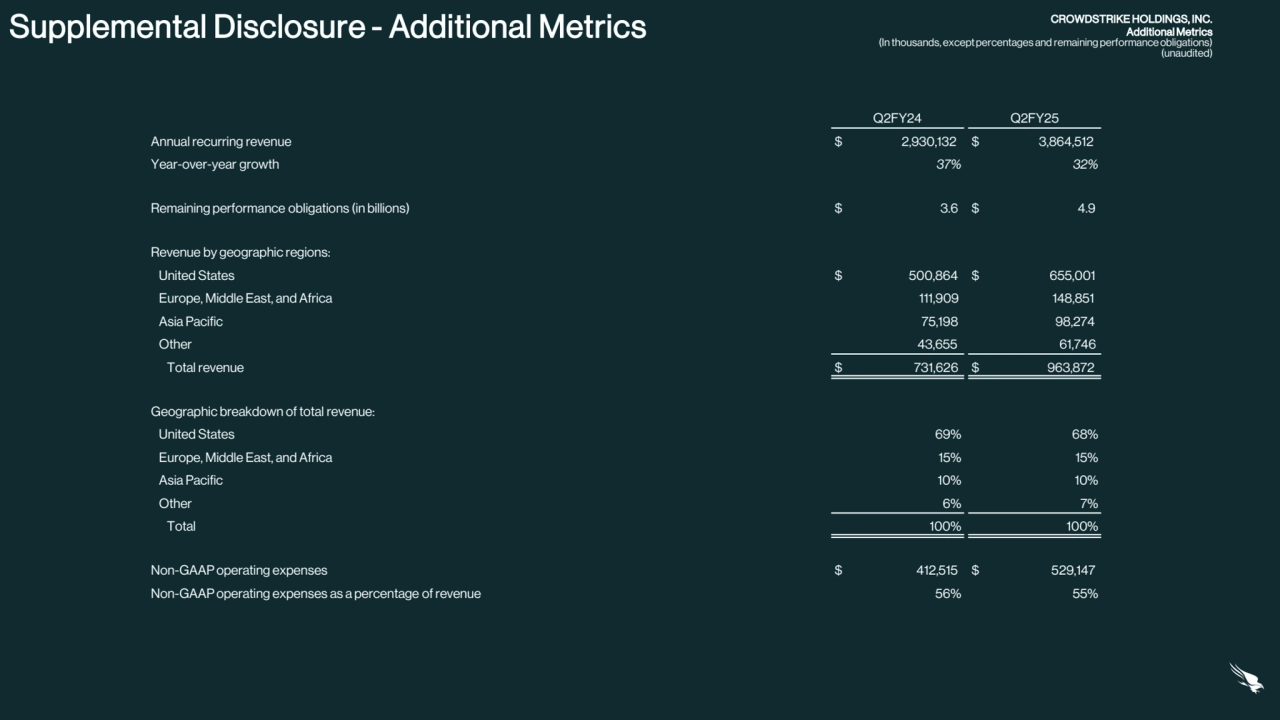
- 29. Supplemental Disclosure - Additional Metrics CROWDSTRIKE HOLDINGS, INC. Additional Metrics (In thousands, except percentages and remaining performance obligations) (unaudited) Q2FY24 Q2FY25 Annual recurring revenue $ 2,930,132 $ 3,864,512 Year-over-year growth 37% 32% Remaining performance obligations (in billions) $ 3.6 $ 4.9 Revenue by geographic regions: United States $ 500,864 $ 655,001 Europe, Middle East, and Africa 111,909 148,851 Asia Pacific 75,198 98,274 Other 43,655 61,746 Total revenue $ 731,626 $ 963,872 Geographic breakdown of total revenue: United States 69% 68% Europe, Middle East, and Africa 15% 15% Asia Pacific 10% 10% Other 6% 7% Total 100% 100% Non-GAAP operating expenses $ 412,515 $ 529,147 Non-GAAP operating expenses as a percentage of revenue 56% 55%