Delivering Ford+ Q2 2025 Earnings
 AI Summary
Key Insights
- [object Object]
- [object Object]
- [object Object]
- [object Object]
- [object Object]


Delivering Ford+ Q2 2025 Earnings
- 1. Delivering Ford + Q2 2025 Earnings 2025 Ford Ranger PHEV
- 2. Contents Delivering Ford+ Page 3 -5 Q2 Results Page 6 Year-to-Date Results Page 7 Financials Page 9 - 17 2025 Guidance Page 19 - 20 Appendix Page 22 - 34 2025 Ford Capri 2
- 3. Safe Harbor Statement And Disclosures This presentation includes financial measures calculated in accordance with Generally Accepted Accounting Principles (“GAAP”) and non-GAAP financial measures. The non-GAAP financial measures are intended to be considered supplemental information to their comparable GAAP financial measures. The non-GAAP financial measures are reconciled to the most comparable GAAP financial measures in the Appendix to this presentation. This presentation includes forward-looking statements. Forward-looking statements are based on expectations, forecasts, and assumptions by our management and involve a number of risks, uncertainties, and other factors that could cause actual results to differ materially from those stated. For a discussion of these risks, uncertainties, and other factors, please see the “Cautionary Note on Forward-Looking Statements” in this presentation and “Item 1A. Risk Factors” in our Annual Report on Form 10-K for the year ended December 31, 2024, as updated by subsequent Quarterly Reports on Form 10-Q and Current Reports on Form 8-K. Forward-Looking Statements GAAP & Non-GAAP Financial Measures Calculated results may not sum due to rounding. N/M denotes “Not Meaningful.” All variances are year-over-year unless otherwise noted. Visit ford.com for vehicle information. Additional Information The guidance is based on our expectations and best estimates as of July 30, 2025, and assumes no material change to our current assumptions for inflation, logistics issues, production, or macroeconomic conditions. Moreover, our guidance has not factored in any new policy changes by the administration in the United States, including future or revised tariffs, that have not been announced or tariffs or other policy changes that may be announced by other governments after July 30, 2025. CY 2025 Guidance 3
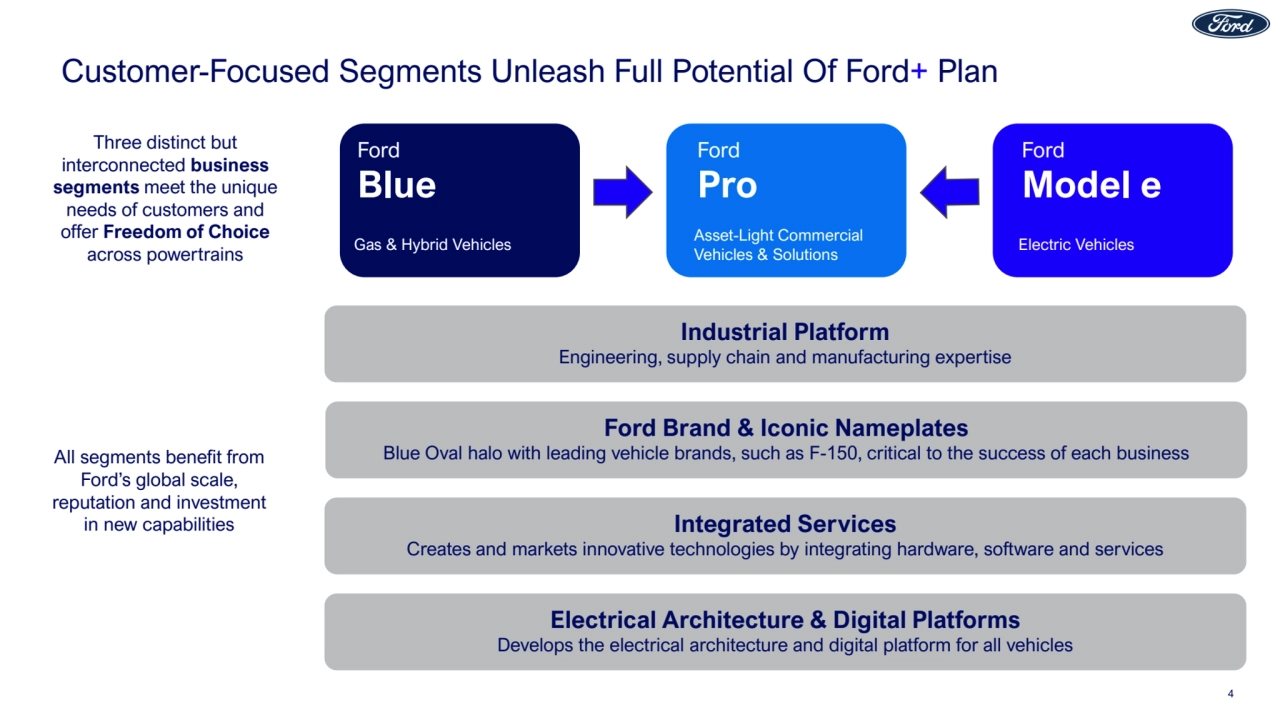
- 4. Customer-Focused Segments Unleash Full Potential Of Ford+ Plan Electrical Architecture & Digital Platforms Develops the electrical architecture and digital platform for all vehicles Integrated Services Creates and markets innovative technologies by integrating hardware, software and services Industrial Platform Engineering, supply chain and manufacturing expertise Three distinct but interconnected business segments meet the unique needs of customers and offer Freedom of Choice across powertrains All segments benefit from Ford’s global scale, reputation and investment in new capabilities Ford Model e Ford Pro Ford Blue Gas & Hybrid Vehicles Ford Pro Asset-Light Commercial Vehicles & Solutions Ford Model e Electric Vehicles Ford Brand & Iconic Nameplates Blue Oval halo with leading vehicle brands, such as F-150, critical to the success of each business 4
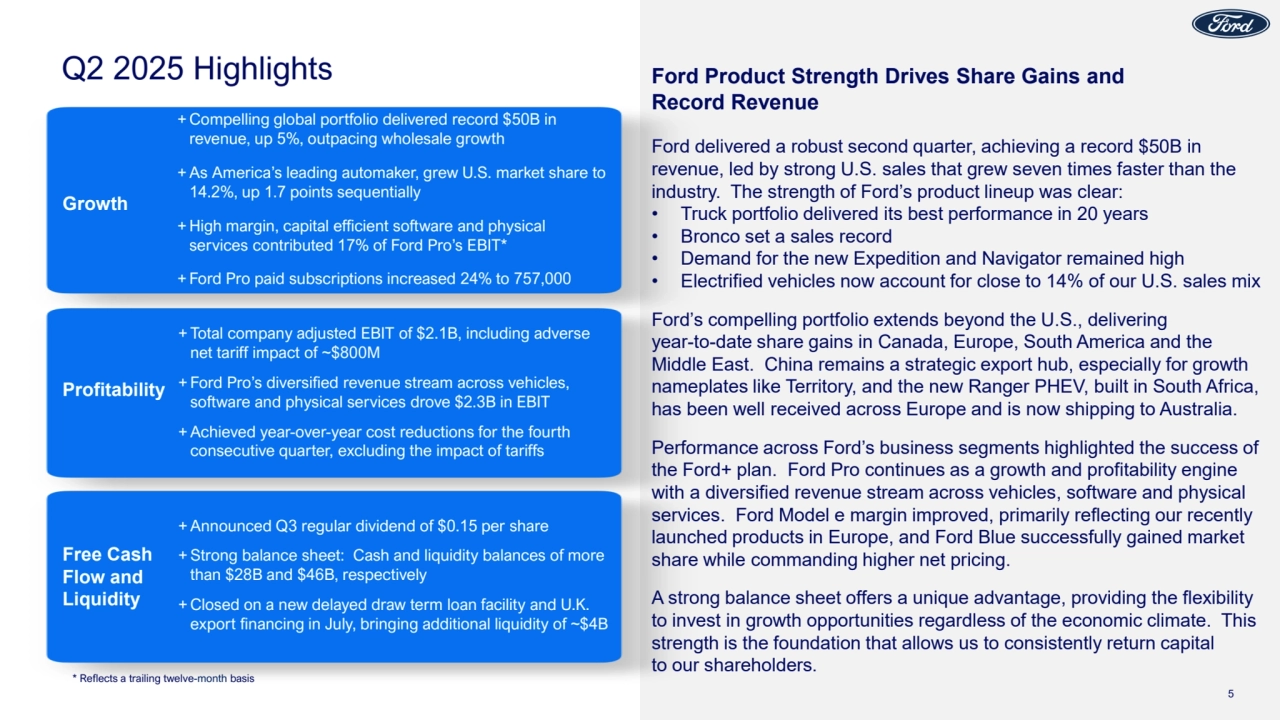
- 5. Q2 2025 Highlights + Compelling global portfolio delivered record $50B in revenue, up 5%, outpacing wholesale growth +As America’s leading automaker, grew U.S. market share to 14.2%, up 1.7 points sequentially +High margin, capital efficient software and physical services contributed 17% of Ford Pro’s EBIT* + Ford Pro paid subscriptions increased 24% to 757,000 Growth + Total company adjusted EBIT of $2.1B, including adverse net tariff impact of ~$800M + Ford Pro’s diversified revenue stream across vehicles, software and physical services drove $2.3B in EBIT +Achieved year-over-year cost reductions for the fourth consecutive quarter, excluding the impact of tariffs Profitability +Announced Q3 regular dividend of $0.15 per share + Strong balance sheet: Cash and liquidity balances of more than $28B and $46B, respectively + Closed on a new delayed draw term loan facility and U.K. export financing in July, bringing additional liquidity of ~$4B Free Cash Flow and Liquidity Ford Product Strength Drives Share Gains and Record Revenue Ford delivered a robust second quarter, achieving a record $50B in revenue, led by strong U.S. sales that grew seven times faster than the industry. The strength of Ford’s product lineup was clear: • Truck portfolio delivered its best performance in 20 years • Bronco set a sales record • Demand for the new Expedition and Navigator remained high • Electrified vehicles now account for close to 14% of our U.S. sales mix Ford’s compelling portfolio extends beyond the U.S., delivering year-to-date share gains in Canada, Europe, South America and the Middle East. China remains a strategic export hub, especially for growth nameplates like Territory, and the new Ranger PHEV, built in South Africa, has been well received across Europe and is now shipping to Australia. Performance across Ford’s business segments highlighted the success of the Ford+ plan. Ford Pro continues as a growth and profitability engine with a diversified revenue stream across vehicles, software and physical services. Ford Model e margin improved, primarily reflecting our recently launched products in Europe, and Ford Blue successfully gained market share while commanding higher net pricing. A strong balance sheet offers a unique advantage, providing the flexibility to invest in growth opportunities regardless of the economic climate. This strength is the foundation that allows us to consistently return capital to our shareholders. 5 * Reflects a trailing twelve-month basis
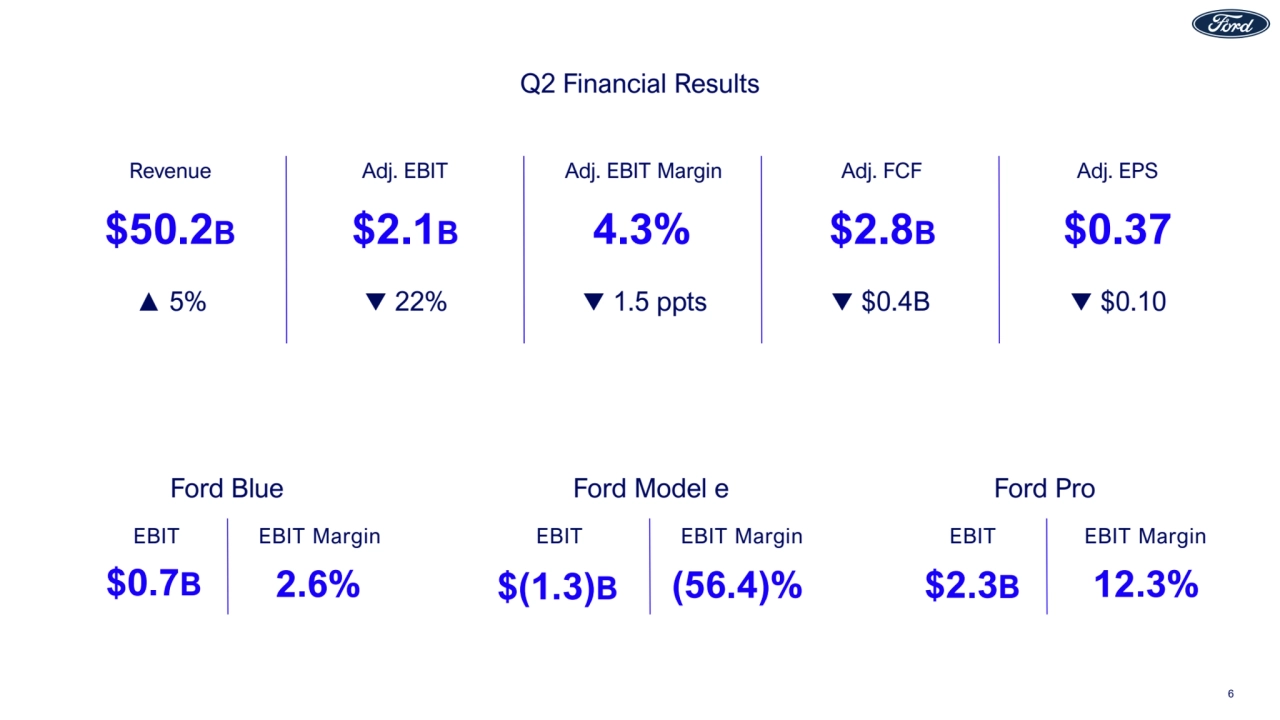
- 6. Revenue $50.2B ▲ 5% Adj. EBIT $2.1B 22% Adj. EBIT Margin 4.3% 1.5 ppts Adj. FCF $2.8B $0.4B Adj. EPS $0.37 $0.10 Q2 Financial Results $0.7B EBIT 2.6% EBIT Margin $(1.3)B EBIT (56.4)% EBIT Margin $2.3B EBIT 12.3% EBIT Margin Ford Blue Ford Model e Ford Pro 6
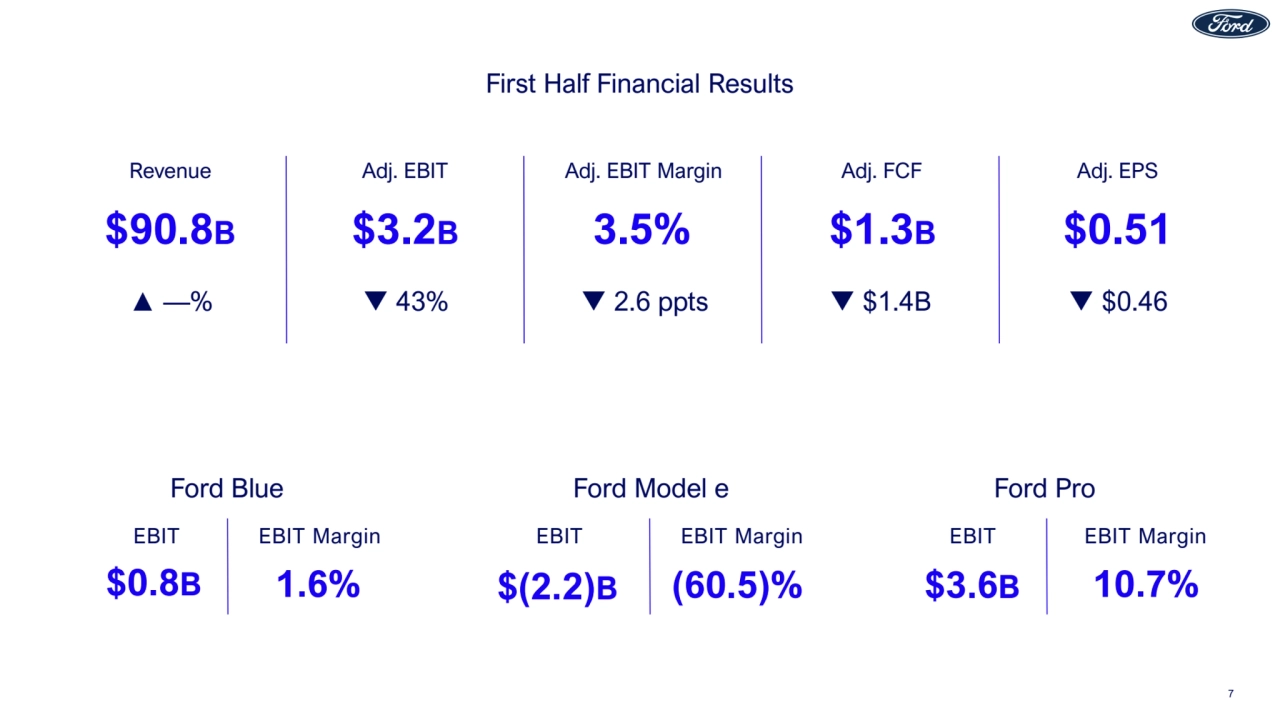
- 7. Revenue $90.8B ▲ —% Adj. EBIT $3.2B 43% Adj. EBIT Margin 3.5% 2.6 ppts Adj. FCF $1.3B $1.4B Adj. EPS $0.51 $0.46 First Half Financial Results $0.8B EBIT 1.6% EBIT Margin $(2.2)B EBIT (60.5)% EBIT Margin $3.6B EBIT 10.7% EBIT Margin Ford Blue Ford Model e Ford Pro 7
- 8. Financials 2025 Ford F-150 Lobo
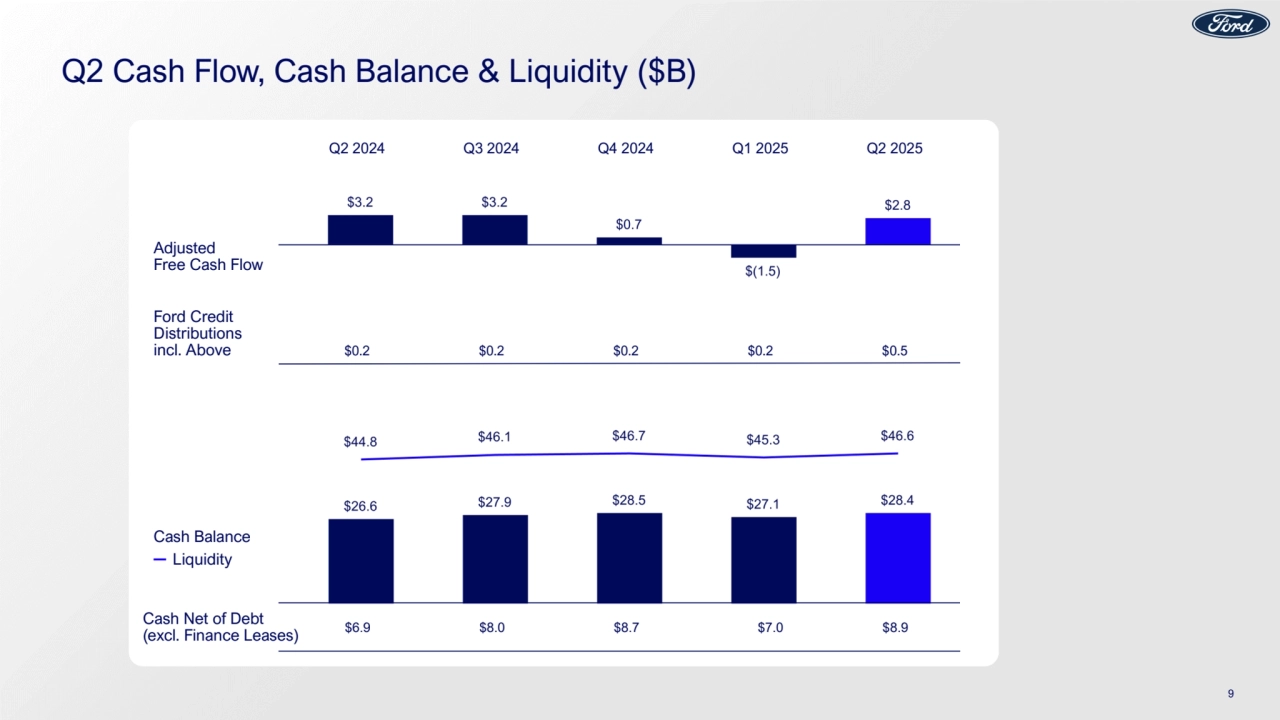
- 9. Q2 Cash Flow, Cash Balance & Liquidity ($B) Adjusted Free Cash Flow Cash Balance Liquidity Cash Net of Debt (excl. Finance Leases) $6.9 $8.0 $8.7 $7.0 $8.9 Ford Credit Distributions incl. Above $0.2 $0.2 $0.2 $0.2 $0.5 Q2 2024 Q3 2024 Q4 2024 Q1 2025 Q2 2025 9
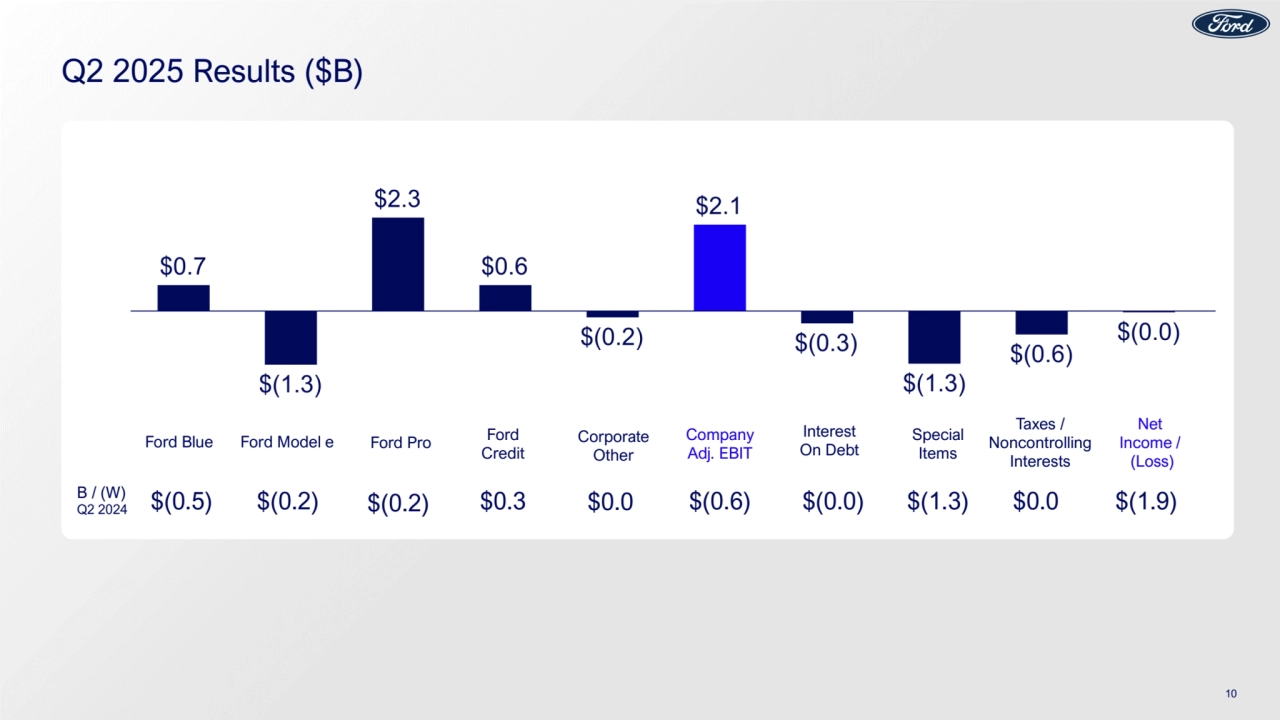
- 10. Q2 2025 Results ($B) available to invest in growth $(0.2) Strong cash and liquidity Ford Blue Ford Pro Net Income / (Loss) Company Adj. EBIT Corporate Other Interest On Debt Special Items Taxes / Noncontrolling Interests Ford Model e Ford Credit B / (W) Q2 2024 $(0.5) $(0.2) $0.3 $0.0 $(0.6) $(0.0) $(1.3) $0.0 $(1.9) 10
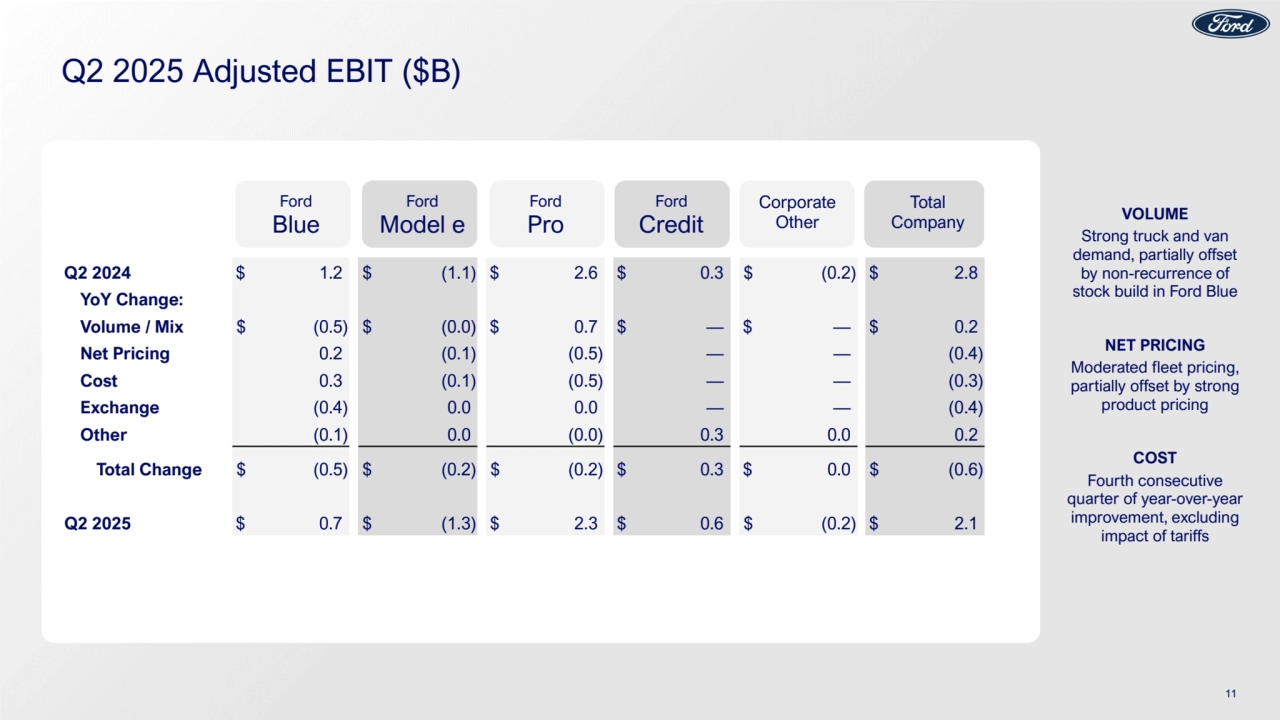
- 11. Q2 2025 Adjusted EBIT ($B) 11 Q2 2024 $ 1.2 $ (1.1) $ 2.6 $ 0.3 $ (0.2) $ 2.8 YoY Change: Volume / Mix $ (0.5) $ (0.0) $ 0.7 $ — $ — $ 0.2 Net Pricing 0.2 (0.1) (0.5) — — (0.4) Cost 0.3 (0.1) (0.5) — — (0.3) Exchange (0.4) 0.0 0.0 — — (0.4) Other (0.1) 0.0 (0.0) 0.3 0.0 0.2 Total Change $ (0.5) $ (0.2) $ (0.2) $ 0.3 $ 0.0 $ (0.6) Q2 2025 $ 0.7 $ (1.3) $ 2.3 $ 0.6 $ (0.2) $ 2.1 Ford VOLUME Strong truck and van demand, partially offset by non-recurrence of stock build in Ford Blue NET PRICING Moderated fleet pricing, partially offset by strong product pricing COST Fourth consecutive quarter of year-over-year improvement, excluding impact of tariffs Ford Blue Ford Model e Ford Pro Ford Credit Corporate Other Total Company
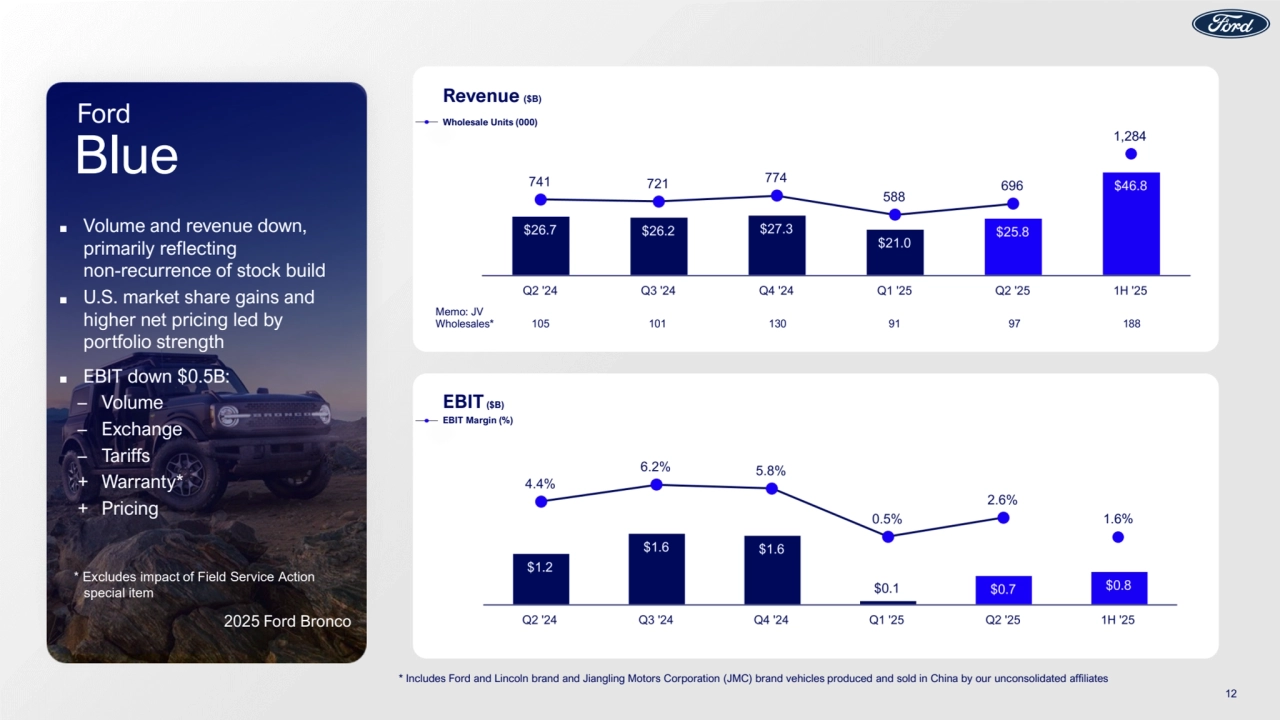
- 12. 12 * Includes Ford and Lincoln brand and Jiangling Motors Corporation (JMC) brand vehicles produced and sold in China by our unconsolidated affiliates EBIT($B) EBIT Margin (%) Revenue ($B) Wholesale Units (000) ■ Volume and revenue up 3% and 8%, respectively ■ EBIT up $0.6B: + Volume / mix + Commodities – Higher warranty – Material cost ■ Healthy profit outside of North America: Strong product portfolio and benefits of restructuring Memo: JV Wholesales* 105 101 130 91 97 188 Ford Everest XLT Blue Ford ■ Volume and revenue down, primarily reflecting non-recurrence of stock build ■ U.S. market share gains and higher net pricing led by portfolio strength ■ EBIT down $0.5B: – Volume – Exchange – Tariffs + Warranty* + Pricing 2025 Ford Bronco 1,284 1.6% * Excludes impact of Field Service Action special item
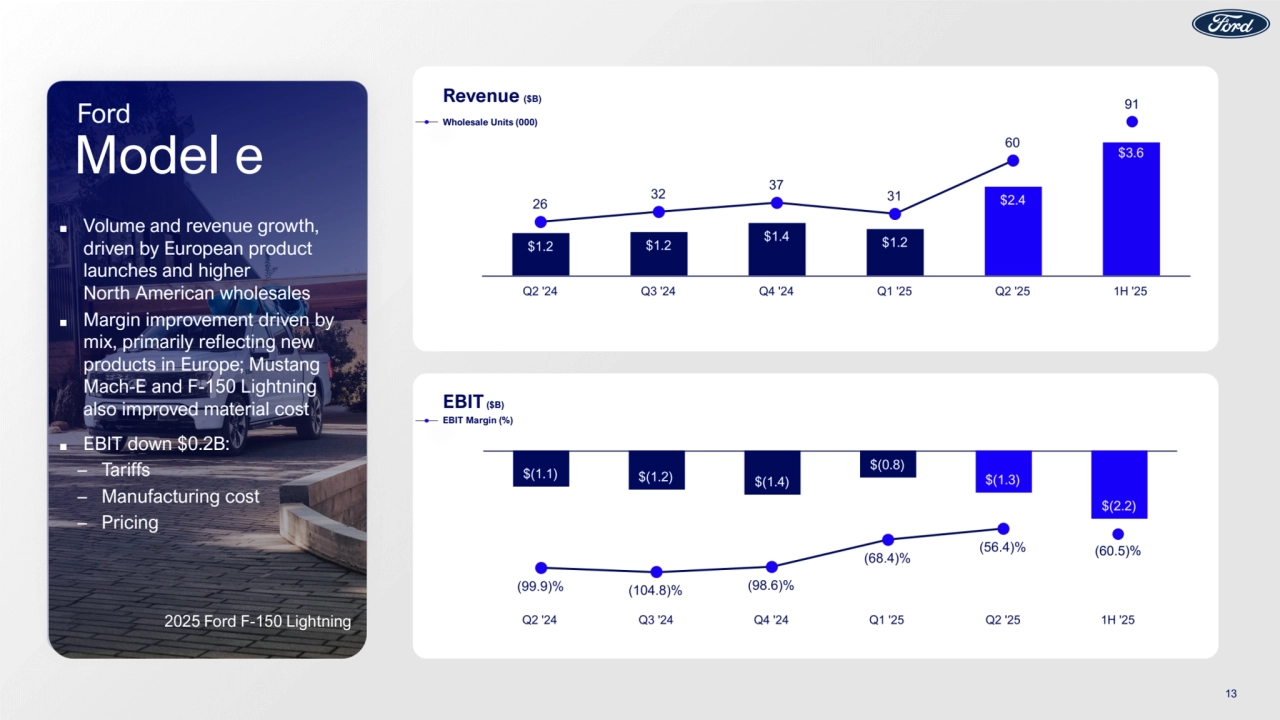
- 13. EBIT($B) EBIT Margin (%) Revenue ($B) Wholesale Units (000) 13 Ford F-150 Lightning Model e Ford ■ Volume and revenue growth, driven by European product launches and higher North American wholesales ■ Margin improvement driven by mix, primarily reflecting new products in Europe; Mustang Mach-E and F-150 Lightning also improved material cost ■ EBIT down $0.2B: – Tariffs – Manufacturing cost – Pricing 2025 Ford F-150 Lightning (60.5)% 91
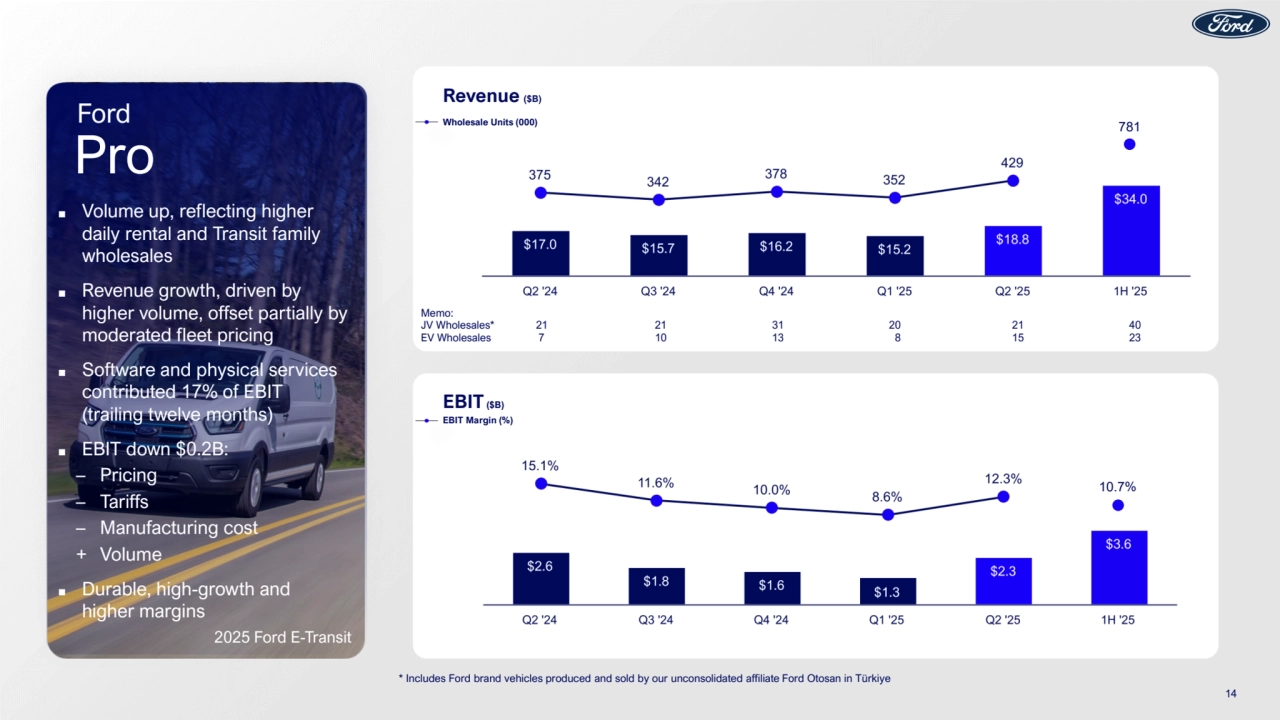
- 14. 14 * Includes Ford brand vehicles produced and sold by our unconsolidated affiliate Ford Otosan in Türkiye Revenue ($B) Wholesale Units (000) EBIT($B) EBIT Margin (%) Ford Super Duty Super Cab Memo: JV Wholesales* 21 21 31 20 21 40 EV Wholesales 7 10 13 8 15 23 Pro Ford ■ Volume up, reflecting higher daily rental and Transit family wholesales ■ Revenue growth, driven by higher volume, offset partially by moderated fleet pricing ■ Software and physical services contributed 17% of EBIT (trailing twelve months) ■ EBIT down $0.2B: – Pricing – Tariffs – Manufacturing cost + Volume ■ Durable, high-growth and higher margins 2025 Ford E-Transit 781 10.7%
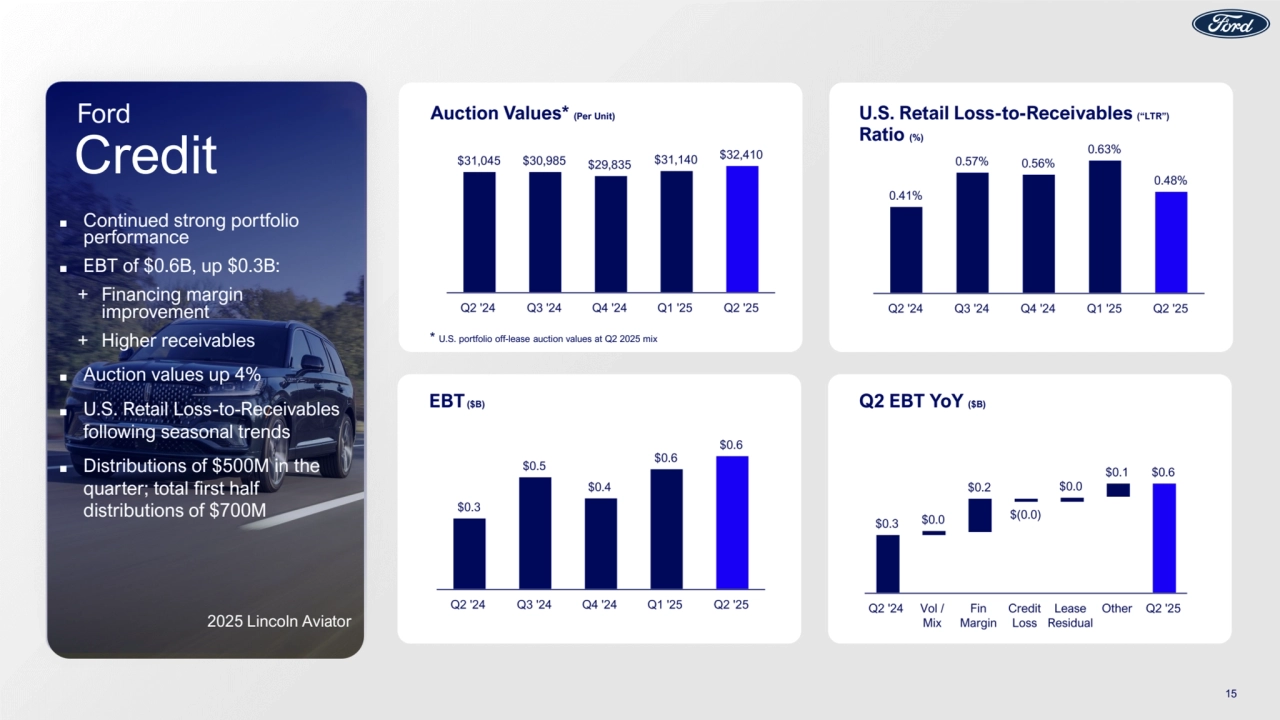
- 15. EBT($B) Q2 EBT YoY ($B) Auction Values* (Per Unit) U.S. Retail Loss-to-Receivables (“LTR”) Ratio (%) 15 * U.S. portfolio off-lease auction values at Q2 2025 mix Credit Ford ■ Continued strong portfolio performance ■ EBT of $0.6B, up $0.3B: + Financing margin improvement + Higher receivables ■ Auction values up 4% ■ U.S. Retail Loss-to-Receivables following seasonal trends ■ Distributions of $500M in the quarter; total first half distributions of $700M 2025 Lincoln Aviator
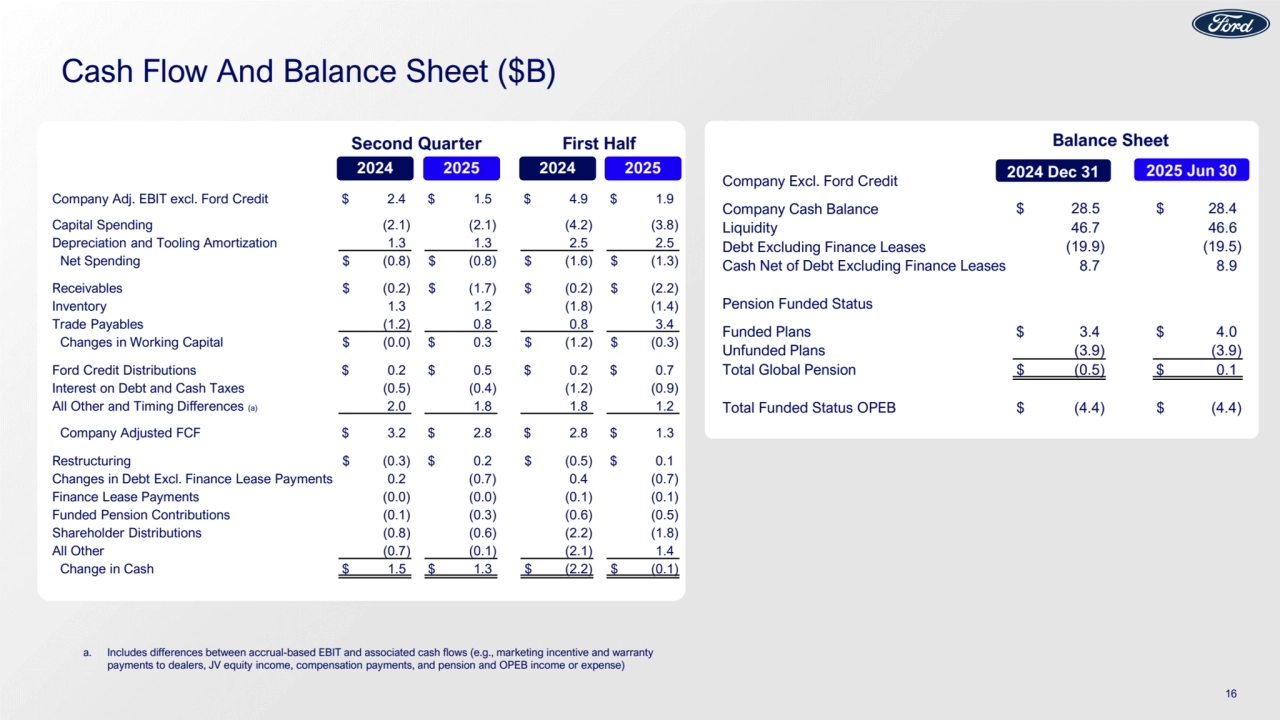
- 16. Cash Flow And Balance Sheet ($B) a. Includes differences between accrual-based EBIT and associated cash flows (e.g., marketing incentive and warranty payments to dealers, JV equity income, compensation payments, and pension and OPEB income or expense) Balance Sheet 16 2024 Dec 31 2025 Jun 30 Company Adj. EBIT excl. Ford Credit $ 2.4 $ 1.5 $ 4.9 $ 1.9 Capital Spending (2.1) (2.1) (4.2) (3.8) Depreciation and Tooling Amortization 1.3 1.3 2.5 2.5 Net Spending $ (0.8) $ (0.8) $ (1.6) $ (1.3) Receivables $ (0.2) $ (1.7) $ (0.2) $ (2.2) Inventory 1.3 1.2 (1.8) (1.4) Trade Payables (1.2) 0.8 0.8 3.4 Changes in Working Capital $ (0.0) $ 0.3 $ (1.2) $ (0.3) Ford Credit Distributions $ 0.2 $ 0.5 $ 0.2 $ 0.7 Interest on Debt and Cash Taxes (0.5) (0.4) (1.2) (0.9) All Other and Timing Differences (a) 2.0 1.8 1.8 1.2 Company Adjusted FCF $ 3.2 $ 2.8 $ 2.8 $ 1.3 Restructuring $ (0.3) $ 0.2 $ (0.5) $ 0.1 Changes in Debt Excl. Finance Lease Payments 0.2 (0.7) 0.4 (0.7) Finance Lease Payments (0.0) (0.0) (0.1) (0.1) Funded Pension Contributions (0.1) (0.3) (0.6) (0.5) Shareholder Distributions (0.8) (0.6) (2.2) (1.8) All Other (0.7) (0.1) (2.1) 1.4 Change in Cash $ 1.5 $ 1.3 $ (2.2) $ (0.1) Company Excl. Ford Credit Company Cash Balance $ 28.5 $ 28.4 Liquidity 46.7 46.6 Debt Excluding Finance Leases (19.9) (19.5) Cash Net of Debt Excluding Finance Leases 8.7 8.9 Pension Funded Status Funded Plans $ 3.4 $ 4.0 Unfunded Plans (3.9) (3.9) Total Global Pension $ (0.5) $ 0.1 Total Funded Status OPEB $ (4.4) $ (4.4) Second Quarter 2024 2025 First Half 2024 2025
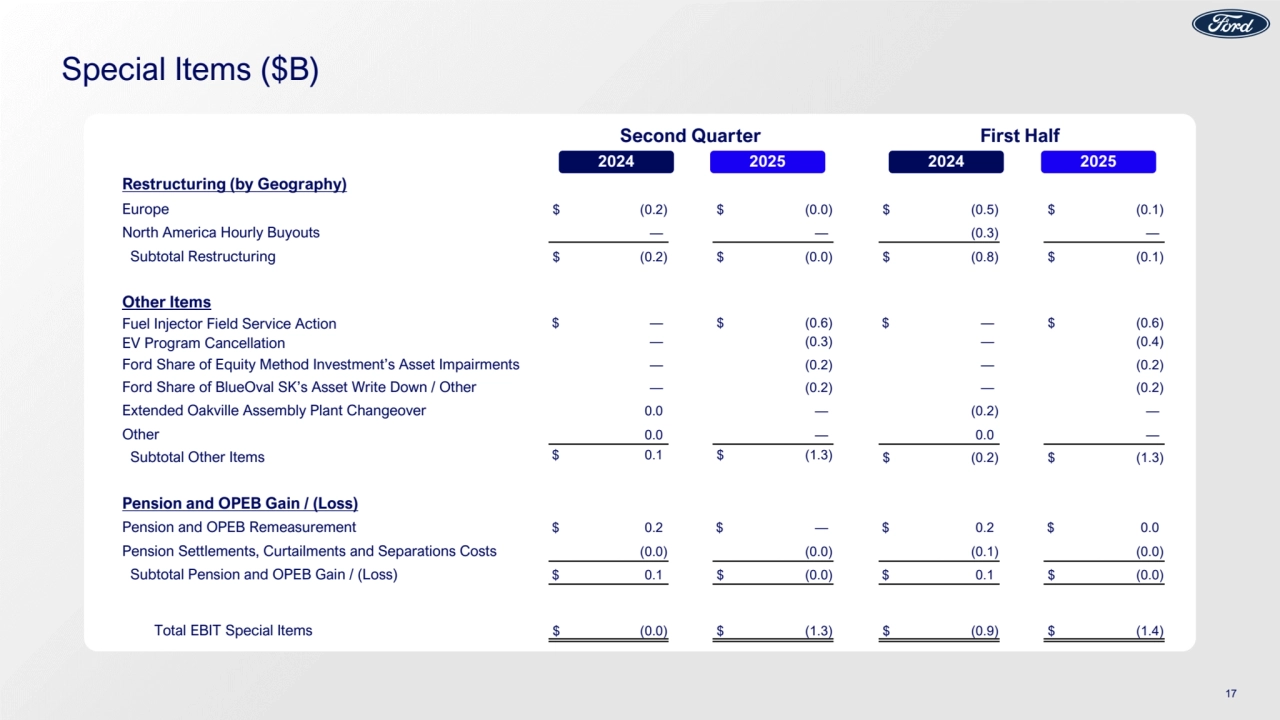
- 17. Special Items ($B) 17 2024 2025 Restructuring (by Geography) Europe $ (0.2) $ (0.0) $ (0.5) $ (0.1) North America Hourly Buyouts — — (0.3) — Subtotal Restructuring $ (0.2) $ (0.0) $ (0.8) $ (0.1) Other Items Fuel Injector Field Service Action $ — $ (0.6) $ — $ (0.6) EV Program Cancellation — (0.3) — (0.4) Ford Share of Equity Method Investment’s Asset Impairments — (0.2) — (0.2) Ford Share of BlueOval SK’s Asset Write Down / Other — (0.2) — (0.2) Extended Oakville Assembly Plant Changeover 0.0 — (0.2) — Other 0.0 — 0.0 — Subtotal Other Items $ 0.1 $ (1.3) $ (0.2) $ (1.3) Pension and OPEB Gain / (Loss) Pension and OPEB Remeasurement $ 0.2 $ — $ 0.2 $ 0.0 Pension Settlements, Curtailments and Separations Costs (0.0) (0.0) (0.1) (0.0) Subtotal Pension and OPEB Gain / (Loss) $ 0.1 $ (0.0) $ 0.1 $ (0.0) Total EBIT Special Items $ (0.0) $ (1.3) $ (0.9) $ (1.4) Second Quarter 2024 2025 First Half
- 18. 2025 Guidance 2026 Ford Explorer Tremor
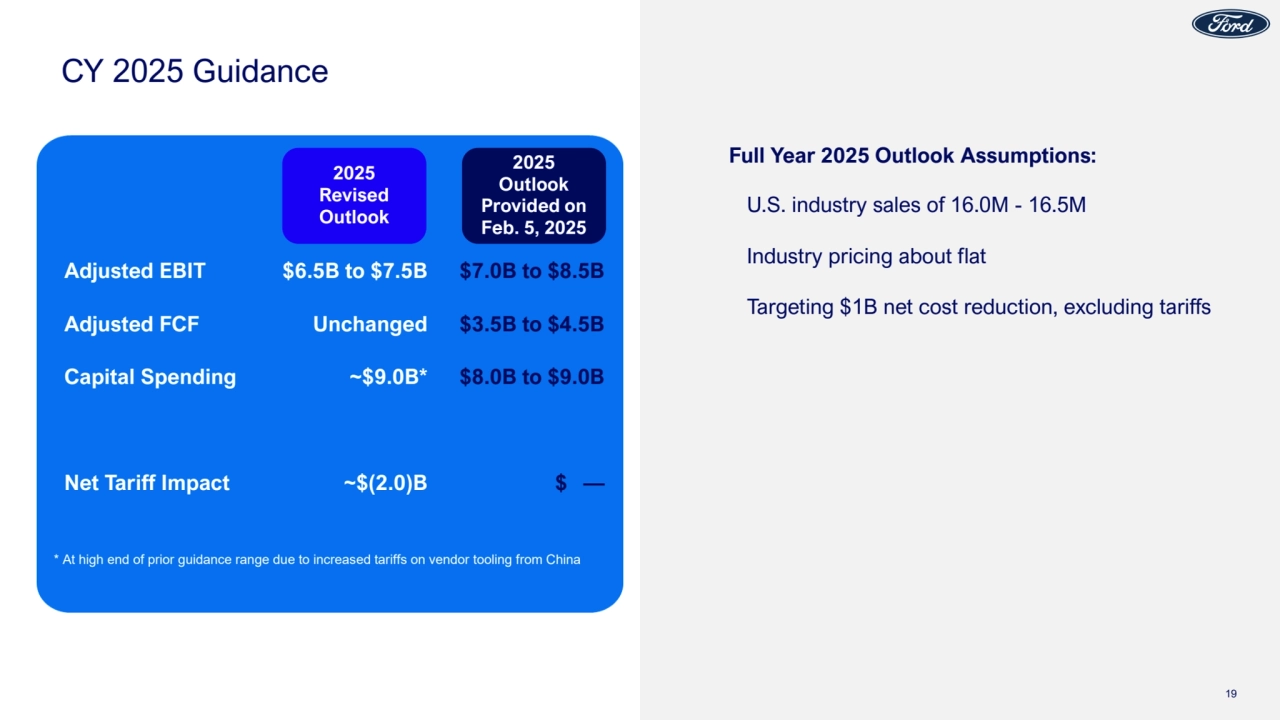
- 19. CY 2025 Guidance Adjusted EBIT $6.5B to $7.5B $7.0B to $8.5B Adjusted FCF Unchanged $3.5B to $4.5B Capital Spending ~$9.0B* $8.0B to $9.0B Net Tariff Impact ~$(2.0)B $ — 2025 Revised Outlook 2025 Outlook Provided on Feb. 5, 2025 19 Full Year 2025 Outlook Assumptions: U.S. industry sales of 16.0M - 16.5M Industry pricing about flat Targeting $1B net cost reduction, excluding tariffs * At high end of prior guidance range due to increased tariffs on vendor tooling from China
- 20. Cautionary Note On Forward-Looking Statements Statements included or incorporated by reference herein may constitute “forward-looking statements” within the meaning of the Private Securities Litigation Reform Act of 1995. Forward-looking statements are based on expectations, forecasts, and assumptions by our management and involve a number of risks, uncertainties, and other factors that could cause actual results to differ materially from those stated, including, without limitation: • Ford’s long-term success depends on delivering the Ford+ plan, including improving cost and competitiveness; • Ford’s vehicles could be affected by defects that result in recall campaigns, increased warranty costs, or delays in new model launches, and the time it takes to improve the quality of our vehicles and services and reduce the costs associated therewith could continue to have an adverse effect on our business; • Ford is highly dependent on its suppliers to deliver components in accordance with Ford’s production schedule and specifications, and a shortage of or inability to timely acquire key components or raw materials can disrupt Ford’s production of vehicles; • Ford’s production, as well as Ford’s suppliers’ production, and/or the ability to deliver products to consumers could be disrupted by labor issues, public health issues, natural or man-made disasters, adverse effects of climate change, financial distress, production difficulties, capacity limitations, or other factors; • Ford may not realize the anticipated benefits of existing or pending strategic alliances, joint ventures, acquisitions, divestitures, or business strategies or the benefits may take longer than expected to materialize; • Ford may not realize the anticipated benefits of restructuring actions and such actions may cause Ford to incur significant charges, disrupt our operations, or harm our reputation; • Failure to develop and deploy secure digital services that appeal to customers and grow our subscription rates could have a negative impact on Ford’s business; • Ford’s ability to maintain a competitive cost structure could be affected by labor or other constraints; • Ford’s ability to attract, develop, grow, support, and reward talent is critical to its success and competitiveness; • Operational information systems, security systems, vehicles, and services could be affected by cybersecurity incidents, ransomware attacks, and other disruptions and impact Ford, Ford Credit, their suppliers, and dealers; • To facilitate access to the raw materials and other components necessary for the production of electric vehicles, Ford has entered into and may, in the future, enter into multi-year commitments to raw material and other suppliers that subject Ford to risks associated with lower future demand for such items as well as costs that fluctuate and are difficult to accurately forecast; • With a global footprint and supply chain, Ford’s results and operations could be adversely affected by economic or geopolitical developments, including protectionist trade policies such as tariffs, or other events; • Ford’s new and existing products and digital, software, and physical services are subject to market acceptance and face significant competition from existing and new entrants in the automotive and digital and software services industries, and Ford’s reputation may be harmed based on positions it takes or if it is unable to achieve the initiatives it has announced; • Ford may face increased price competition for its products and services, including pricing pressure resulting from industry excess capacity, currency fluctuations, competitive actions, or economic or other factors, particularly for electric vehicles; • Inflationary pressure and fluctuations in commodity and energy prices, foreign currency exchange rates, interest rates, and market value of Ford or Ford Credit’s investments, including marketable securities, can have a significant effect on results; • Ford’s results are dependent on sales of larger, more profitable vehicles, particularly in the United States; • Industry sales volume can be volatile and could decline if there is a financial crisis, recession, public health emergency, or significant geopolitical event; • The impact of government incentives on Ford’s business could be significant, and Ford’s receipt of government incentives could be subject to reduction, termination, or clawback; • Ford and Ford Credit’s access to debt, securitization, or derivative markets around the world at competitive rates or in sufficient amounts could be affected by credit rating downgrades, market volatility, market disruption, regulatory requirements, asset portfolios, or other factors; • Ford Credit could experience higher-than-expected credit losses, lower-than-anticipated residual values, or higher-than-expected return volumes for leased vehicles; • Economic and demographic experience for pension and OPEB plans (e.g., discount rates or investment returns) could be worse than Ford has assumed; • Pension and other postretirement liabilities could adversely affect Ford’s liquidity and financial condition; • Ford and Ford Credit could experience unusual or significant litigation, governmental investigations, or adverse publicity arising out of alleged defects in products, services, perceived environmental impacts, or otherwise; • Ford may need to substantially modify its product plans and facilities to comply with safety, emissions, fuel economy, autonomous driving technology, environmental, and other regulations; • Ford and Ford Credit could be affected by the continued development of more stringent privacy, data use, data protection, data access, and artificial intelligence laws and regulations as well as consumers’ heightened expectations to safeguard their personal information; and • Ford Credit could be subject to new or increased credit regulations, consumer protection regulations, or other regulations. We cannot be certain that any expectation, forecast, or assumption made in preparing forward-looking statements will prove accurate, or that any projection will be realized. It is to be expected that there may be differences between projected and actual results. Our forward-looking statements speak only as of the date of their initial issuance, and we do not undertake, and expressly disclaim to the extent permitted by law, any obligation to update or revise publicly any forward-looking statement, whether as a result of new information, future events, or otherwise. For additional discussion, see “Item 1A. Risk Factors” in our Annual Report on Form 10-K for the year ended December 31, 2024, as updated by our subsequent Quarterly Reports on Form 10-Q and Current Reports on Form 8-K. 20
- 21. Super Mustang Mach-E Built to compete at Pike’s Peak International Hill Climb Appendix
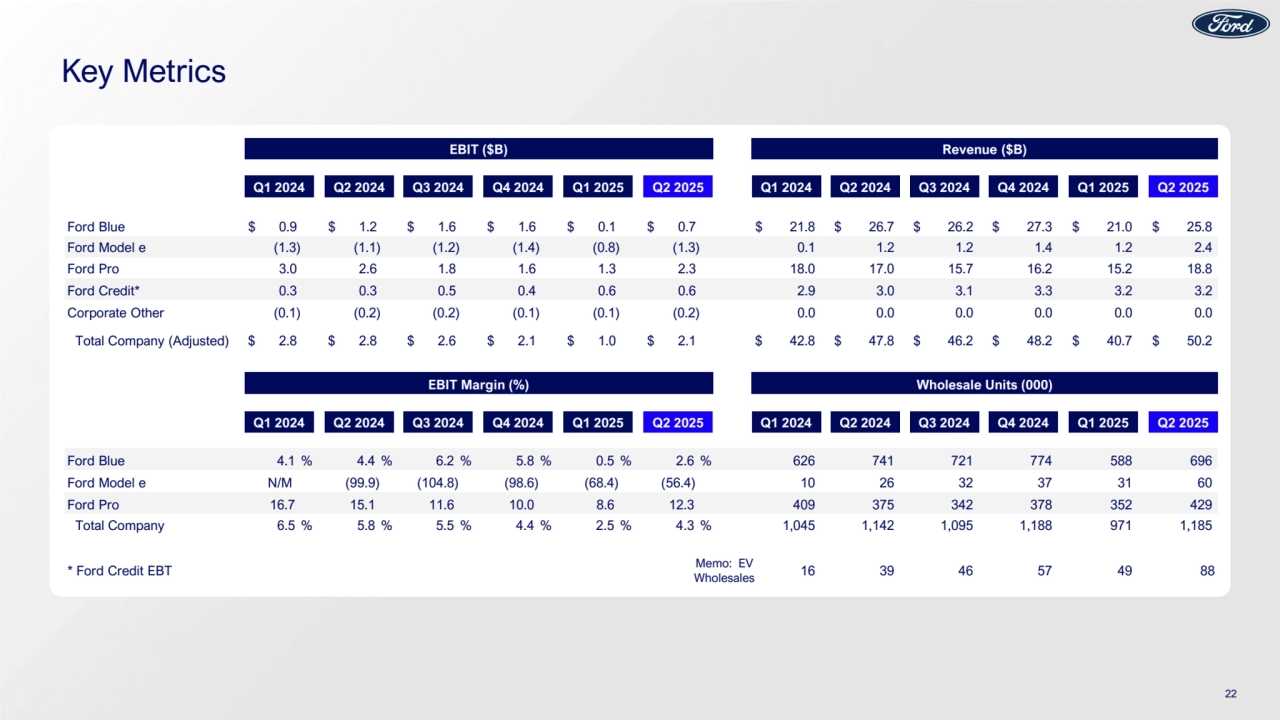
- 22. Key Metrics EBIT ($B) Revenue ($B) Q1 2024 Q2 2024 Q3 2024 Q4 2024 Q1 2025 Q2 2025 Q1 2024 Q2 2024 Q3 2024 Q4 2024 Q1 2025 Q2 2025 Ford Blue $ 0.9 $ 1.2 $ 1.6 $ 1.6 $ 0.1 $ 0.7 $ 21.8 $ 26.7 $ 26.2 $ 27.3 $ 21.0 $ 25.8 Ford Model e (1.3) (1.1) (1.2) (1.4) (0.8) (1.3) 0.1 1.2 1.2 1.4 1.2 2.4 Ford Pro 3.0 2.6 1.8 1.6 1.3 2.3 18.0 17.0 15.7 16.2 15.2 18.8 Ford Credit* 0.3 0.3 0.5 0.4 0.6 0.6 2.9 3.0 3.1 3.3 3.2 3.2 Corporate Other (0.1) (0.2) (0.2) (0.1) (0.1) (0.2) 0.0 0.0 0.0 0.0 0.0 0.0 Total Company (Adjusted) $ 2.8 $ 2.8 $ 2.6 $ 2.1 $ 1.0 $ 2.1 $ 42.8 $ 47.8 $ 46.2 $ 48.2 $ 40.7 $ 50.2 EBIT Margin (%) Wholesale Units (000) Q1 2024 Q2 2024 Q3 2024 Q4 2024 Q1 2025 Q2 2025 Q1 2024 Q2 2024 Q3 2024 Q4 2024 Q1 2025 Q2 2025 Ford Blue 4.1 % 4.4 % 6.2 % 5.8 % 0.5 % 2.6 % 626 741 721 774 588 696 Ford Model e N/M (99.9) (104.8) (98.6) (68.4) (56.4) 10 26 32 37 31 60 Ford Pro 16.7 15.1 11.6 10.0 8.6 12.3 409 375 342 378 352 429 Total Company 6.5 % 5.8 % 5.5 % 4.4 % 2.5 % 4.3 % 1,045 1,142 1,095 1,188 971 1,185 * Ford Credit EBT 16 39 46 57 49 88 Memo: EV Wholesales 22
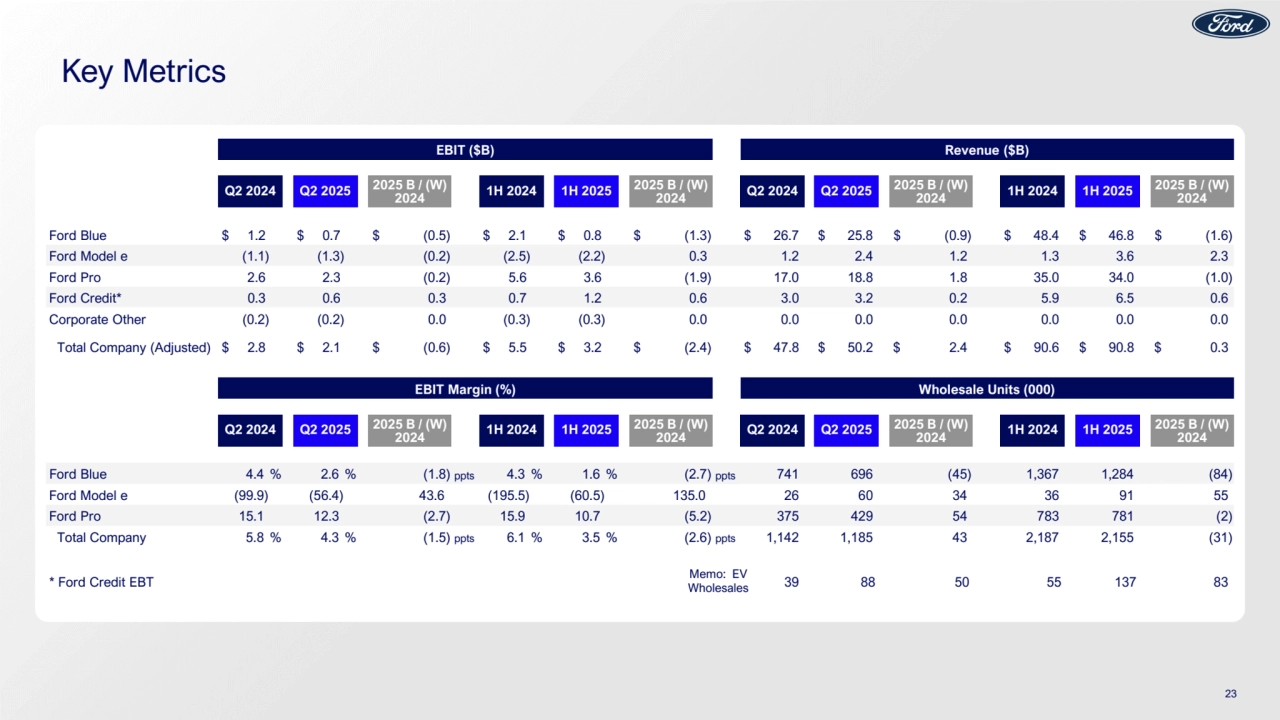
- 23. Key Metrics EBIT ($B) Revenue ($B) Q2 2024 Q2 2025 2025 B / (W) 2024 1H 2024 1H 2025 2025 B / (W) 2024 Q2 2024 Q2 2025 2025 B / (W) 2024 1H 2024 1H 2025 2025 B / (W) 2024 Ford Blue $ 1.2 $ 0.7 $ (0.5) $ 2.1 $ 0.8 $ (1.3) $ 26.7 $ 25.8 $ (0.9) $ 48.4 $ 46.8 $ (1.6) Ford Model e (1.1) (1.3) (0.2) (2.5) (2.2) 0.3 1.2 2.4 1.2 1.3 3.6 2.3 Ford Pro 2.6 2.3 (0.2) 5.6 3.6 (1.9) 17.0 18.8 1.8 35.0 34.0 (1.0) Ford Credit* 0.3 0.6 0.3 0.7 1.2 0.6 3.0 3.2 0.2 5.9 6.5 0.6 Corporate Other (0.2) (0.2) 0.0 (0.3) (0.3) 0.0 0.0 0.0 0.0 0.0 0.0 0.0 Total Company (Adjusted) $ 2.8 $ 2.1 $ (0.6) $ 5.5 $ 3.2 $ (2.4) $ 47.8 $ 50.2 $ 2.4 $ 90.6 $ 90.8 $ 0.3 EBIT Margin (%) Wholesale Units (000) Q2 2024 Q2 2025 2025 B / (W) 2024 1H 2024 1H 2025 2025 B / (W) 2024 Q2 2024 Q2 2025 2025 B / (W) 2024 1H 2024 1H 2025 2025 B / (W) 2024 Ford Blue 4.4 % 2.6 % (1.8) ppts 4.3 % 1.6 % (2.7) ppts 741 696 (45) 1,367 1,284 (84) Ford Model e (99.9) (56.4) 43.6 (195.5) (60.5) 135.0 26 60 34 36 91 55 Ford Pro 15.1 12.3 (2.7) 15.9 10.7 (5.2) 375 429 54 783 781 (2) Total Company 5.8 % 4.3 % (1.5) ppts 6.1 % 3.5 % (2.6) ppts 1,142 1,185 43 2,187 2,155 (31) * Ford Credit EBT 39 88 50 55 137 83 Memo: EV Wholesales 23
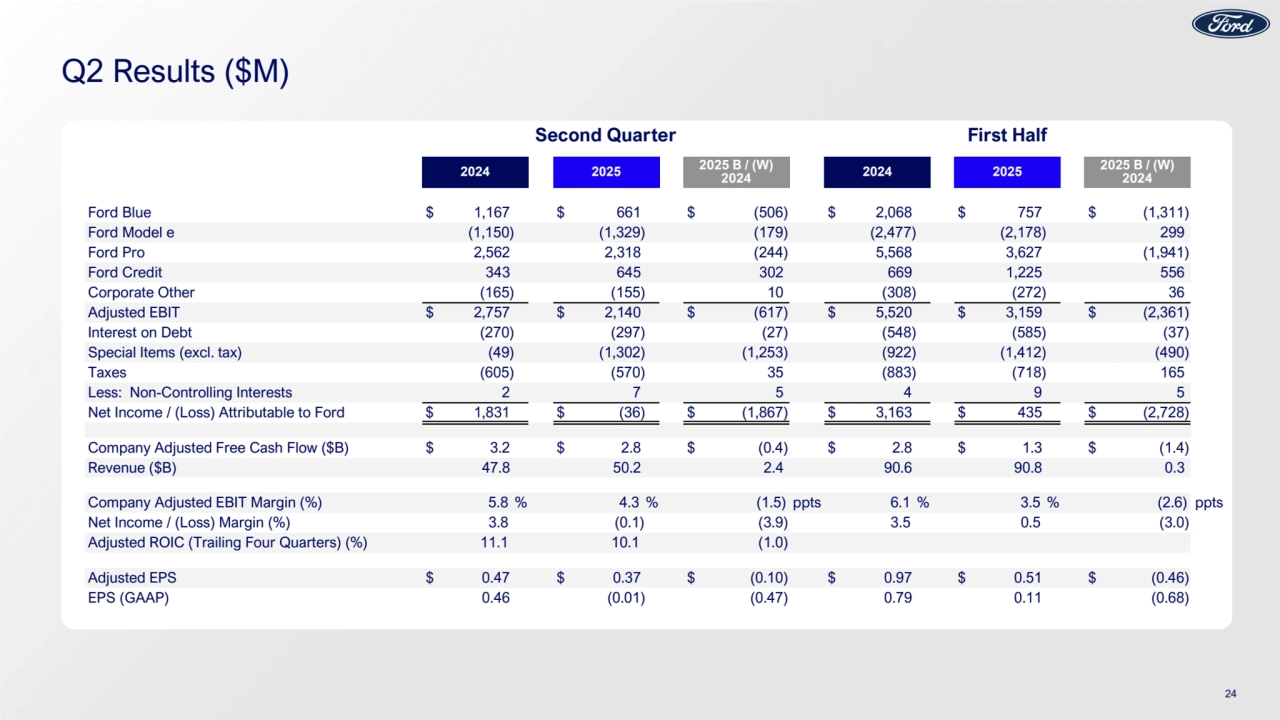
- 24. Q2 Results ($M) Second Quarter First Half 2024 2025 2025 B / (W) 2024 2024 2025 2025 B / (W) 2024 Ford Blue $ 1,167 $ 661 $ (506) $ 2,068 $ 757 $ (1,311) Ford Model e (1,150) (1,329) (179) (2,477) (2,178) 299 Ford Pro 2,562 2,318 (244) 5,568 3,627 (1,941) Ford Credit 343 645 302 669 1,225 556 Corporate Other (165) (155) 10 (308) (272) 36 Adjusted EBIT $ 2,757 $ 2,140 $ (617) $ 5,520 $ 3,159 $ (2,361) Interest on Debt (270) (297) (27) (548) (585) (37) Special Items (excl. tax) (49) (1,302) (1,253) (922) (1,412) (490) Taxes (605) (570) 35 (883) (718) 165 Less: Non-Controlling Interests 2 7 5 4 9 5 Net Income / (Loss) Attributable to Ford $ 1,831 $ (36) $ (1,867) $ 3,163 $ 435 $ (2,728) Company Adjusted Free Cash Flow ($B) $ 3.2 $ 2.8 $ (0.4) $ 2.8 $ 1.3 $ (1.4) Revenue ($B) 47.8 50.2 2.4 90.6 90.8 0.3 Company Adjusted EBIT Margin (%) 5.8 % 4.3 % (1.5) ppts 6.1 % 3.5 % (2.6) ppts Net Income / (Loss) Margin (%) 3.8 (0.1) (3.9) 3.5 0.5 (3.0) Adjusted ROIC (Trailing Four Quarters) (%) 11.1 10.1 (1.0) Adjusted EPS $ 0.47 $ 0.37 $ (0.10) $ 0.97 $ 0.51 $ (0.46) EPS (GAAP) 0.46 (0.01) (0.47) 0.79 0.11 (0.68) 24
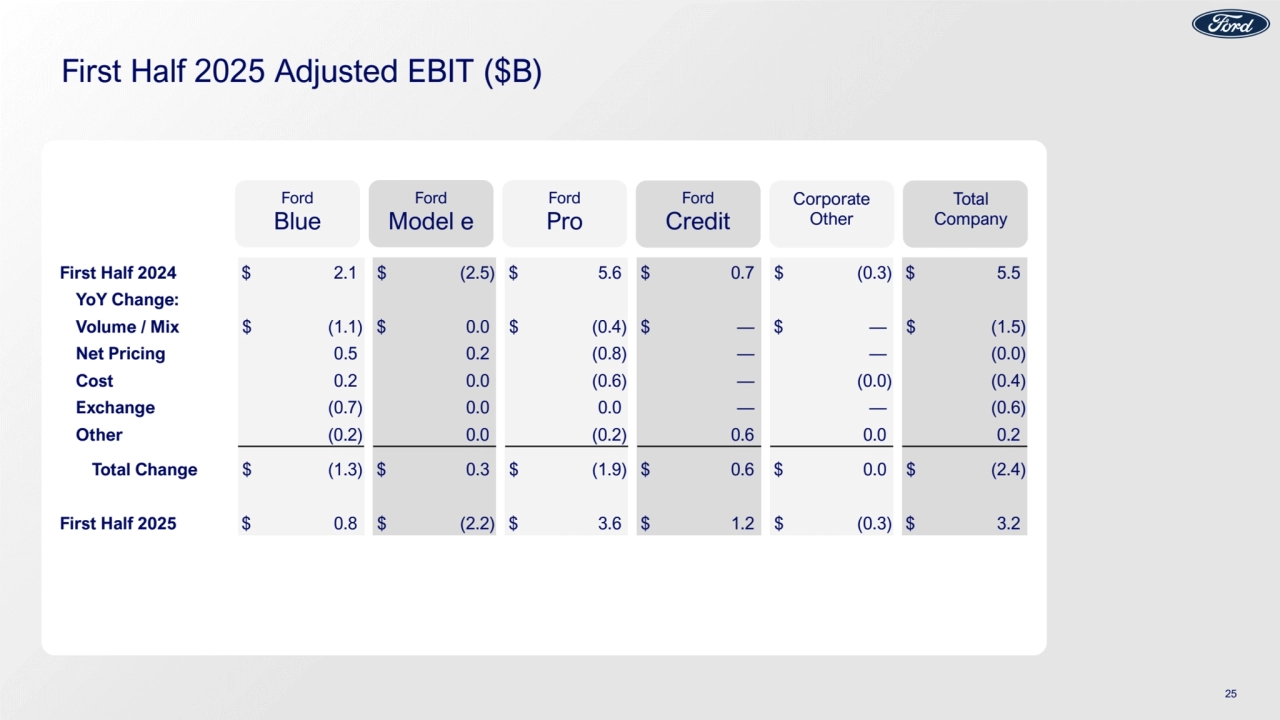
- 25. First Half 2025 Adjusted EBIT ($B) First Half 2024 $ 2.1 $ (2.5) $ 5.6 $ 0.7 $ (0.3) $ 5.5 YoY Change: Volume / Mix $ (1.1) $ 0.0 $ (0.4) $ — $ — $ (1.5) Net Pricing 0.5 0.2 (0.8) — — (0.0) Cost 0.2 0.0 (0.6) — (0.0) (0.4) Exchange (0.7) 0.0 0.0 — — (0.6) Other (0.2) 0.0 (0.2) 0.6 0.0 0.2 Total Change $ (1.3) $ 0.3 $ (1.9) $ 0.6 $ 0.0 $ (2.4) First Half 2025 $ 0.8 $ (2.2) $ 3.6 $ 1.2 $ (0.3) $ 3.2 Ford Blue Ford Pro Ford Credit Corporate Other Total Company Ford Model e 25
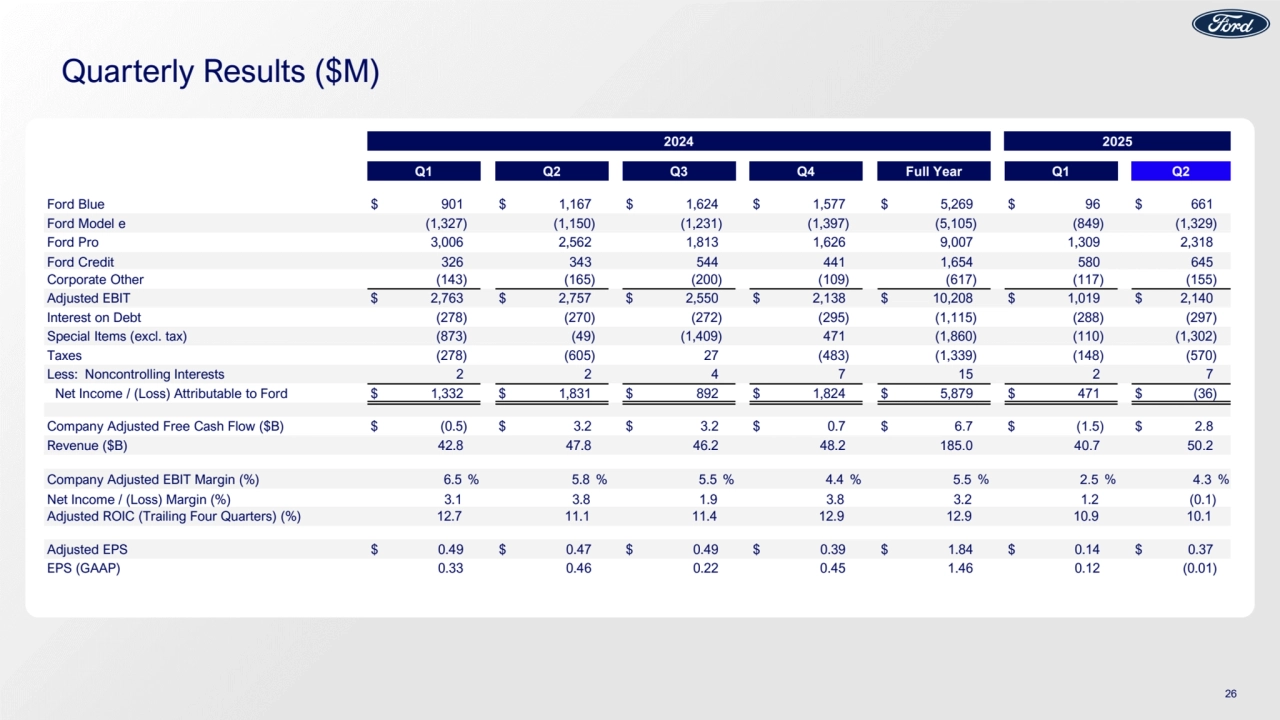
- 26. Quarterly Results ($M) 2024 2025 Q1 Q2 Q3 Q4 Full Year Q1 Q2 Ford Blue $ 901 $ 1,167 $ 1,624 $ 1,577 $ 5,269 $ 96 $ 661 Ford Model e (1,327) (1,150) (1,231) (1,397) (5,105) (849) (1,329) Ford Pro 3,006 2,562 1,813 1,626 9,007 1,309 2,318 Ford Credit 326 343 544 441 1,654 580 645 Corporate Other (143) (165) (200) (109) (617) (117) (155) Adjusted EBIT $ 2,763 $ 2,757 $ 2,550 $ 2,138 $ 10,208 $ 1,019 $ 2,140 Interest on Debt (278) (270) (272) (295) (1,115) (288) (297) Special Items (excl. tax) (873) (49) (1,409) 471 (1,860) (110) (1,302) Taxes (278) (605) 27 (483) (1,339) (148) (570) Less: Noncontrolling Interests 2 2 4 7 15 2 7 Net Income / (Loss) Attributable to Ford $ 1,332 $ 1,831 $ 892 $ 1,824 $ 5,879 $ 471 $ (36) Company Adjusted Free Cash Flow ($B) $ (0.5) $ 3.2 $ 3.2 $ 0.7 $ 6.7 $ (1.5) $ 2.8 Revenue ($B) 42.8 47.8 46.2 48.2 185.0 40.7 50.2 Company Adjusted EBIT Margin (%) 6.5 % 5.8 % 5.5 % 4.4 % 5.5 % 2.5 % 4.3 % Net Income / (Loss) Margin (%) 3.1 3.8 1.9 3.8 3.2 1.2 (0.1) Adjusted ROIC (Trailing Four Quarters) (%) 12.7 11.1 11.4 12.9 12.9 10.9 10.1 Adjusted EPS $ 0.49 $ 0.47 $ 0.49 $ 0.39 $ 1.84 $ 0.14 $ 0.37 EPS (GAAP) 0.33 0.46 0.22 0.45 1.46 0.12 (0.01) 26
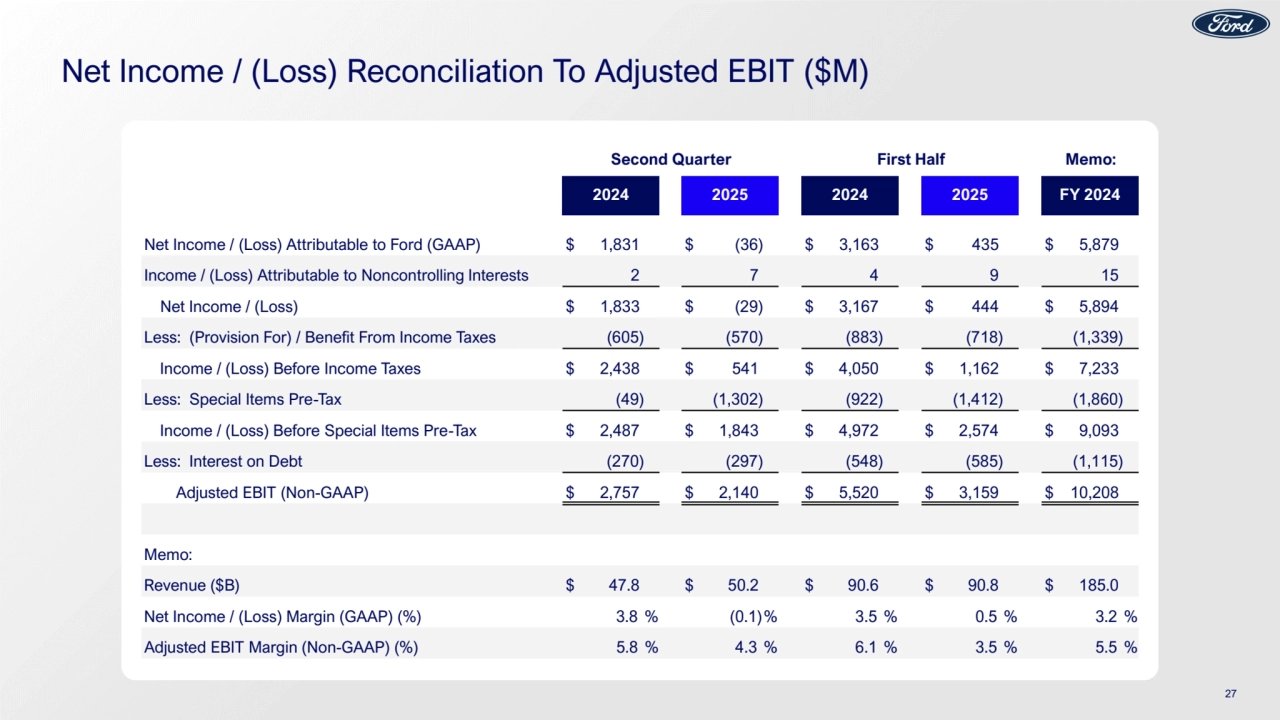
- 27. Net Income / (Loss) Reconciliation To Adjusted EBIT ($M) Second Quarter First Half Memo: 2024 2025 2024 2025 FY 2024 Net Income / (Loss) Attributable to Ford (GAAP) $ 1,831 $ (36) $ 3,163 $ 435 $ 5,879 Income / (Loss) Attributable to Noncontrolling Interests 2 7 4 9 15 Net Income / (Loss) $ 1,833 $ (29) $ 3,167 $ 444 $ 5,894 Less: (Provision For) / Benefit From Income Taxes (605) (570) (883) (718) (1,339) Income / (Loss) Before Income Taxes $ 2,438 $ 541 $ 4,050 $ 1,162 $ 7,233 Less: Special Items Pre-Tax (49) (1,302) (922) (1,412) (1,860) Income / (Loss) Before Special Items Pre-Tax $ 2,487 $ 1,843 $ 4,972 $ 2,574 $ 9,093 Less: Interest on Debt (270) (297) (548) (585) (1,115) Adjusted EBIT (Non-GAAP) $ 2,757 $ 2,140 $ 5,520 $ 3,159 $ 10,208 Memo: Revenue ($B) $ 47.8 $ 50.2 $ 90.6 $ 90.8 $ 185.0 Net Income / (Loss) Margin (GAAP) (%) 3.8 % (0.1)% 3.5 % 0.5 % 3.2 % Adjusted EBIT Margin (Non-GAAP) (%) 5.8 % 4.3 % 6.1 % 3.5 % 5.5 % 27
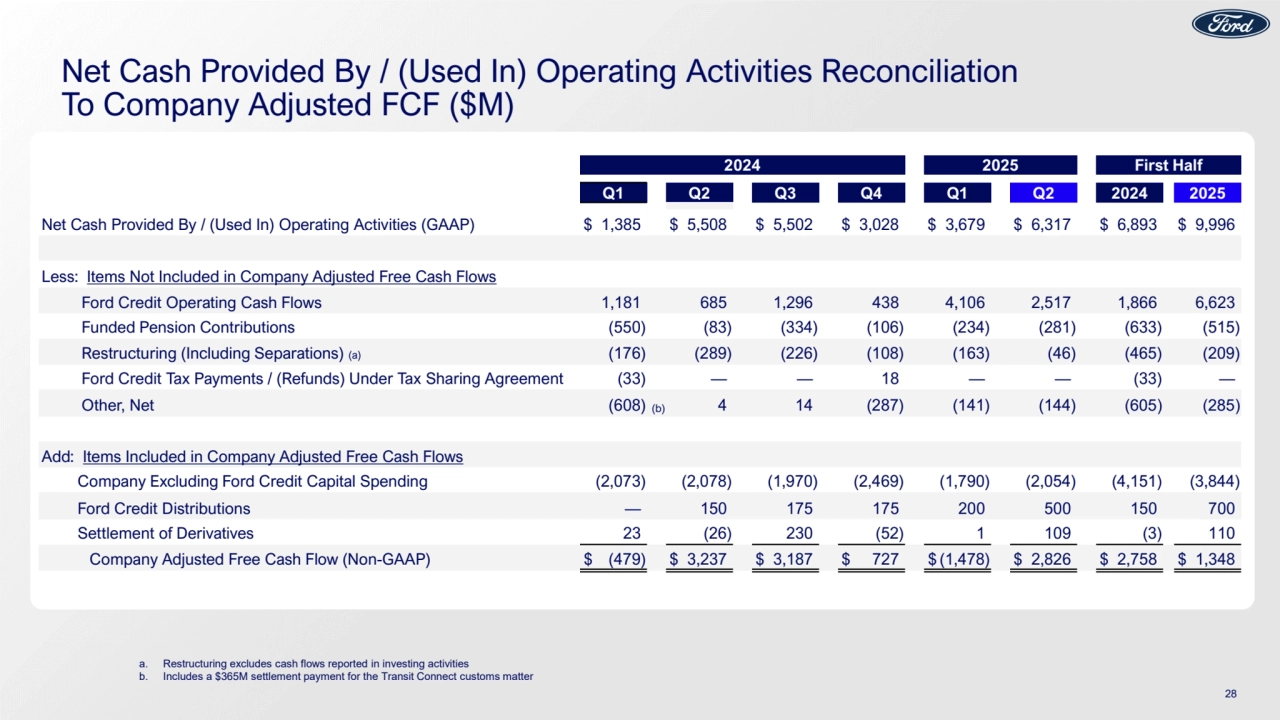
- 28. Net Cash Provided By / (Used In) Operating Activities Reconciliation To Company Adjusted FCF ($M) a. Restructuring excludes cash flows reported in investing activities b. Includes a $365M settlement payment for the Transit Connect customs matter 2024 2025 First Half Q1 Q2 Q3 Q4 Q1 Q2 2024 2025 Net Cash Provided By / (Used In) Operating Activities (GAAP) $ 1,385 $ 5,508 $ 5,502 $ 3,028 $ 3,679 $ 6,317 $ 6,893 $ 9,996 Less: Items Not Included in Company Adjusted Free Cash Flows Ford Credit Operating Cash Flows 1,181 685 1,296 438 4,106 2,517 1,866 6,623 Funded Pension Contributions (550) (83) (334) (106) (234) (281) (633) (515) Restructuring (Including Separations) (a) (176) (289) (226) (108) (163) (46) (465) (209) Ford Credit Tax Payments / (Refunds) Under Tax Sharing Agreement (33) — — 18 — — (33) — Other, Net (608) (b) 4 14 (287) (141) (144) (605) (285) Add: Items Included in Company Adjusted Free Cash Flows Company Excluding Ford Credit Capital Spending (2,073) (2,078) (1,970) (2,469) (1,790) (2,054) (4,151) (3,844) Ford Credit Distributions — 150 175 175 200 500 150 700 Settlement of Derivatives 23 (26) 230 (52) 1 109 (3) 110 Company Adjusted Free Cash Flow (Non-GAAP) $ (479) $ 3,237 $ 3,187 $ 727 $ (1,478) $ 2,826 $ 2,758 $ 1,348 28
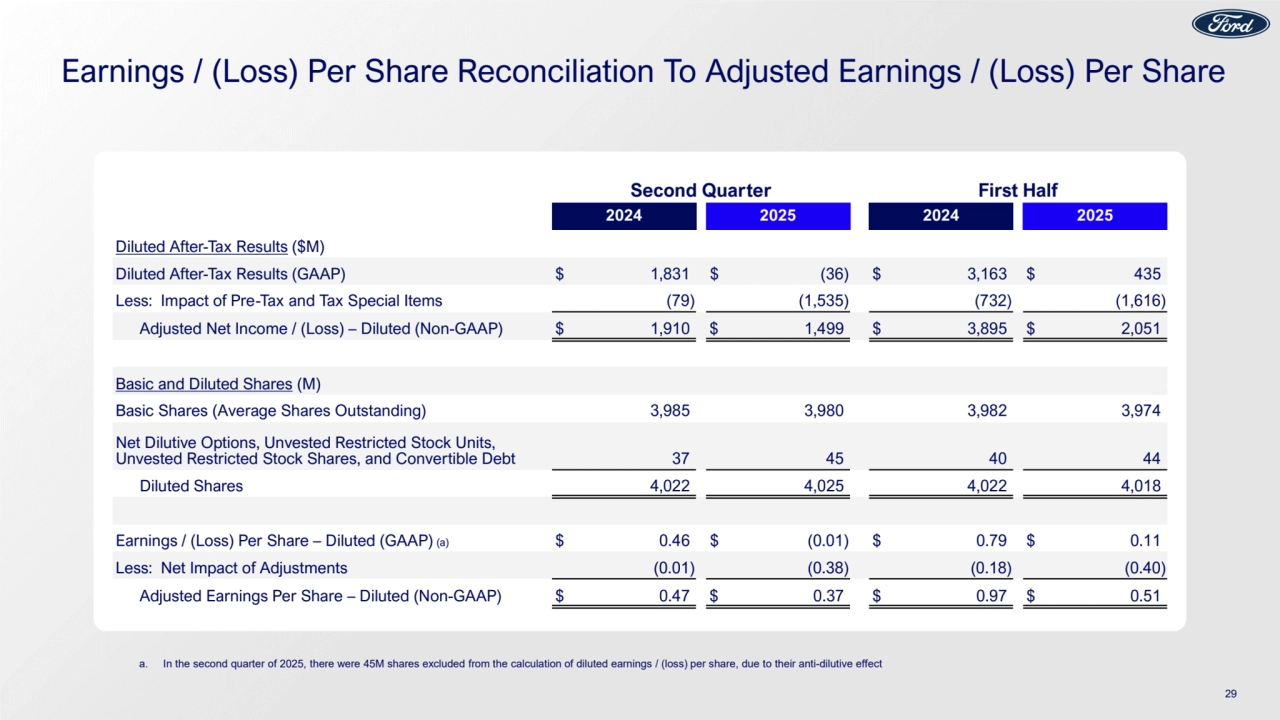
- 29. Earnings / (Loss) Per Share Reconciliation To Adjusted Earnings / (Loss) Per Share Second Quarter First Half 2024 2025 2024 2025 Diluted After-Tax Results ($M) Diluted After-Tax Results (GAAP) $ 1,831 $ (36) $ 3,163 $ 435 Less: Impact of Pre-Tax and Tax Special Items (79) (1,535) (732) (1,616) Adjusted Net Income / (Loss) – Diluted (Non-GAAP) $ 1,910 $ 1,499 $ 3,895 $ 2,051 Basic and Diluted Shares (M) Basic Shares (Average Shares Outstanding) 3,985 3,980 3,982 3,974 Net Dilutive Options, Unvested Restricted Stock Units, Unvested Restricted Stock Shares, and Convertible Debt 37 45 40 44 Diluted Shares 4,022 4,025 4,022 4,018 Earnings / (Loss) Per Share – Diluted (GAAP) (a) $ 0.46 $ (0.01) $ 0.79 $ 0.11 Less: Net Impact of Adjustments (0.01) (0.38) (0.18) (0.40) Adjusted Earnings Per Share – Diluted (Non-GAAP) $ 0.47 $ 0.37 $ 0.97 $ 0.51 29 a. In the second quarter of 2025, there were 45M shares excluded from the calculation of diluted earnings / (loss) per share, due to their anti-dilutive effect
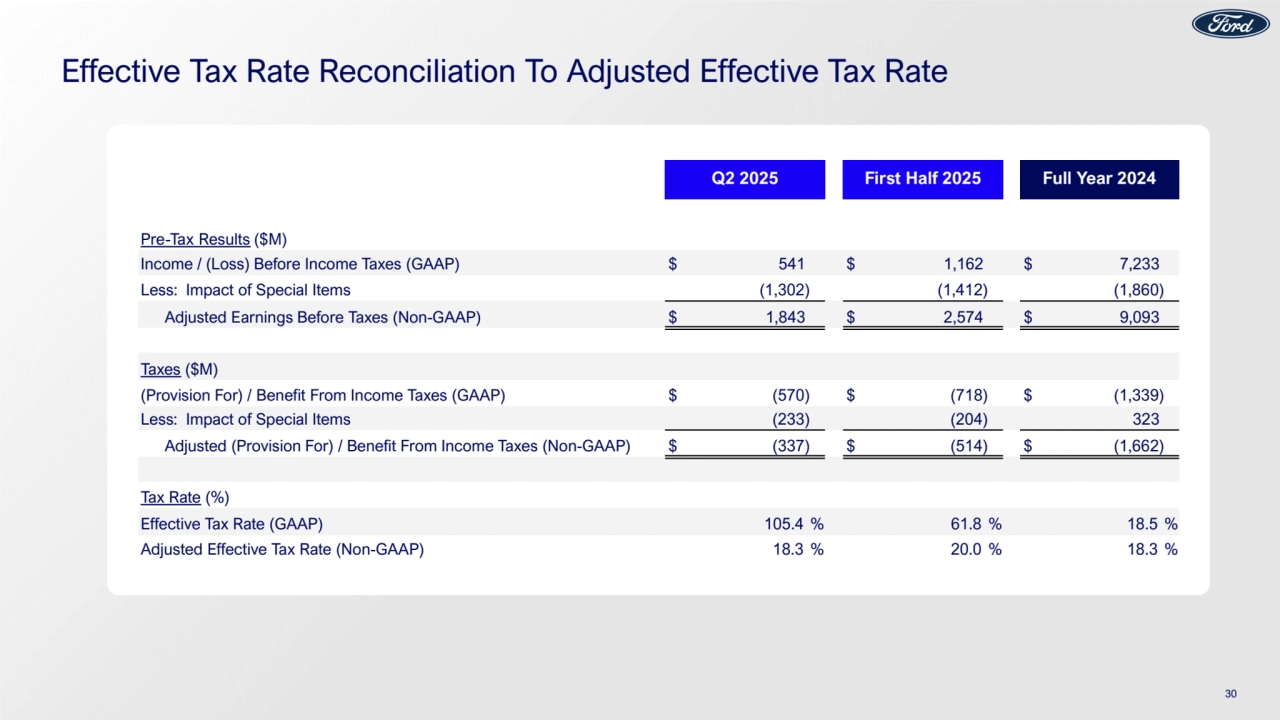
- 30. Effective Tax Rate Reconciliation To Adjusted Effective Tax Rate Q2 2025 First Half 2025 Full Year 2024 Pre-Tax Results ($M) Income / (Loss) Before Income Taxes (GAAP) $ 541 $ 1,162 $ 7,233 Less: Impact of Special Items (1,302) (1,412) (1,860) Adjusted Earnings Before Taxes (Non-GAAP) $ 1,843 $ 2,574 $ 9,093 Taxes ($M) (Provision For) / Benefit From Income Taxes (GAAP) $ (570) $ (718) $ (1,339) Less: Impact of Special Items (233) (204) 323 Adjusted (Provision For) / Benefit From Income Taxes (Non-GAAP) $ (337) $ (514) $ (1,662) Tax Rate (%) Effective Tax Rate (GAAP) 105.4 % 61.8 % 18.5 % Adjusted Effective Tax Rate (Non-GAAP) 18.3 % 20.0 % 18.3 % 30
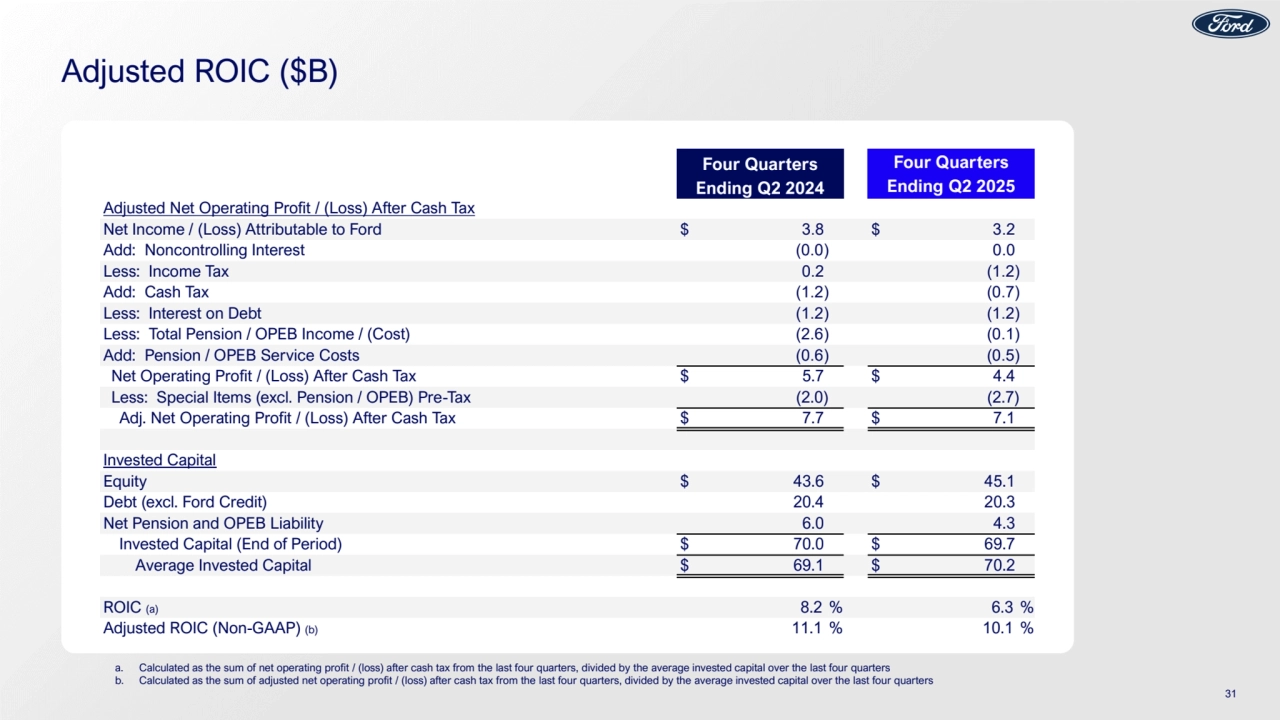
- 31. Adjusted ROIC ($B) Four Quarters Ending Q2 2024 Four Quarters Ending Q2 2025 Adjusted Net Operating Profit / (Loss) After Cash Tax Net Income / (Loss) Attributable to Ford $ 3.8 $ 3.2 Add: Noncontrolling Interest (0.0) 0.0 Less: Income Tax 0.2 (1.2) Add: Cash Tax (1.2) (0.7) Less: Interest on Debt (1.2) (1.2) Less: Total Pension / OPEB Income / (Cost) (2.6) (0.1) Add: Pension / OPEB Service Costs (0.6) (0.5) Net Operating Profit / (Loss) After Cash Tax $ 5.7 $ 4.4 Less: Special Items (excl. Pension / OPEB) Pre-Tax (2.0) (2.7) Adj. Net Operating Profit / (Loss) After Cash Tax $ 7.7 $ 7.1 Invested Capital Equity $ 43.6 $ 45.1 Debt (excl. Ford Credit) 20.4 20.3 Net Pension and OPEB Liability 6.0 4.3 Invested Capital (End of Period) $ 70.0 $ 69.7 Average Invested Capital $ 69.1 $ 70.2 ROIC (a) 8.2 % 6.3 % Adjusted ROIC (Non-GAAP) (b) 11.1 % 10.1 % a. Calculated as the sum of net operating profit / (loss) after cash tax from the last four quarters, divided by the average invested capital over the last four quarters b. Calculated as the sum of adjusted net operating profit / (loss) after cash tax from the last four quarters, divided by the average invested capital over the last four quarters 31
- 32. Non-GAAP Financial Measures That Supplement GAAP Measures We use both GAAP and non-GAAP financial measures for operational and financial decision making, and to assess Company and segment business performance. The non-GAAP measures listed below are intended to be considered by users as supplemental information to their equivalent GAAP measures, to aid investors in better understanding our financial results. We believe that these non-GAAP measures provide useful perspective on underlying operating results and trends, and a means to compare our period-over-period results. These non-GAAP measures should not be considered as a substitute for, or superior to, measures of financial performance prepared in accordance with GAAP. These non-GAAP measures may not be the same as similarly titled measures used by other companies due to possible differences in method and in items or events being adjusted. + Company Adjusted EBIT (Most Comparable GAAP Measure: Net income / (Loss) attributable to Ford) – Earnings Before Interest and Taxes (EBIT) excludes interest on debt (excluding Ford Credit Debt), taxes and pre-tax special items. This non-GAAP measure is useful to management and investors because it focuses on underlying operating results and trends, and improves comparability of our period-over-period results. Our management excludes special items from its review of the results of the operating segments for purposes of measuring segment profitability and allocating resources. Pre-tax special items consist of (i) pension and OPEB remeasurement gains and losses, (ii) significant personnel expenses, supplier- and dealer-related costs, and facility-related charges stemming from our efforts to match production capacity and cost structure to market demand and changing model mix, and (iii) other items that we do not generally consider to be indicative of earnings from ongoing operating activities. When we provide guidance for adjusted EBIT, we do not provide guidance on a net income basis because the GAAP measure will include potentially significant special items that have not yet occurred and are difficult to predict with reasonable certainty, including gains and losses on pension and OPEB remeasurements and on investments in equity securities. + Company Adjusted EBIT Margin (Most Comparable GAAP Measure: Company Net Income / (Loss) Margin) – Company Adjusted EBIT Margin is Company Adjusted EBIT divided by Company revenue. This non-GAAP measure is useful to management and investors because it allows users to evaluate our operating results aligned with industry reporting. + Adjusted Earnings / (Loss) Per Share (Most Comparable GAAP Measure: Earnings / (Loss) Per Share) – Measure of Company’s diluted net earnings / (loss) per share adjusted for impact of pre-tax special items (described above), tax special items and restructuring impacts in noncontrolling interests. The measure provides investors with useful information to evaluate performance of our business excluding items not indicative of earnings from ongoing operating activities. When we provide guidance for adjusted earnings / (loss) per share, we do not provide guidance on an earnings / (loss) per share basis because the GAAP measure will include potentially significant special items that have not yet occurred and are difficult to predict with reasonable certainty prior to year-end, including pension and OPEB remeasurement gains and losses. + Adjusted Effective Tax Rate (Most Comparable GAAP Measure: Effective Tax Rate) – Measure of Company’s tax rate excluding pre-tax special items (described above) and tax special items. The measure provides an ongoing effective rate which investors find useful for historical comparisons and for forecasting. When we provide guidance for adjusted effective tax rate, we do not provide guidance on an effective tax rate basis because the GAAP measure will include potentially significant special items that have not yet occurred and are difficult to predict with reasonable certainty prior to year-end, including pension and OPEB remeasurement gains and losses. 32
- 33. Non-GAAP Financial Measures That Supplement GAAP Measures + Company Adjusted Free Cash Flow (FCF) (Most Comparable GAAP Measure: Net Cash Provided By / (Used In) Operating Activities) – Measure of Company’s operating cash flow excluding Ford Credit’s operating cash flows. The measure contains elements management considers operating activities, including Company excluding Ford Credit capital spending, Ford Credit distributions to its parent, and settlement of derivatives. The measure excludes cash outflows for funded pension contributions, restructuring actions, and other items that are considered operating cash flows under GAAP. This measure is useful to management and investors because it is consistent with management’s assessment of the Company’s operating cash flow performance. When we provide guidance for Company Adjusted FCF, we do not provide guidance for net cash provided by / (used in) operating activities because the GAAP measure will include items that are difficult to quantify or predict with reasonable certainty, including cash flows related to the Company's exposures to foreign currency exchange rates and certain commodity prices (separate from any related hedges), Ford Credit's operating cash flows, and cash flows related to special items, including separation payments, each of which individually or in the aggregate could have a significant impact to our net cash provided by / (used in) our operating activities. + Adjusted ROIC – Calculated as the sum of adjusted net operating profit / (loss) after-cash tax from the last four quarters, divided by the average invested capital over the last four quarters. This calculation provides management and investors with useful information to evaluate the Company’s after-cash tax operating return on its invested capital for the period presented. Adjusted net operating profit / (loss) after-cash tax measures operating results less special items, interest on debt (excluding Ford Credit Debt), and certain pension / OPEB costs. Average invested capital is the sum of average balance sheet equity, debt (excluding Ford Credit Debt), and net pension / OPEB liability. 33
- 34. Definitions And Calculations Wholesale Units and Revenue • Wholesale unit volumes include all Ford and Lincoln badged units (whether produced by Ford or by an unconsolidated affiliate) that are sold to dealerships or others, units manufactured by Ford that are sold to other manufacturers, units distributed by Ford for other manufacturers, and local brand units produced by our China joint venture, Jiangling Motors Corporation, Ltd. (“JMC”), that are sold to dealerships or others. Vehicles sold to daily rental car companies that are subject to a guaranteed repurchase option (i.e., rental repurchase), as well as other sales of finished vehicles for which the recognition of revenue is deferred (e.g., consignments), also are included in wholesale unit volumes. Revenue from certain vehicles in wholesale unit volumes (specifically, Ford badged vehicles produced and distributed by our unconsolidated affiliates, as well as JMC brand vehicles) are not included in our revenue. Excludes transactions between Ford Blue, Ford Model e, and Ford Pro segments. Industry Volume and Market Share • Industry volume and market share are based, in part, on estimated vehicle registrations; includes medium and heavy duty trucks SAAR • SAAR means seasonally adjusted annual rate Company Cash • Company cash includes cash, cash equivalents, marketable securities and restricted cash (including cash held for sale); excludes Ford Credit’s cash, cash equivalents, marketable securities and restricted cash Market Factors • Volume and Mix – primarily measures EBIT variance from changes in wholesale unit volumes (at prior-year average contribution margin per unit) driven by changes in industry volume, market share, and dealer stocks, as well as the EBIT variance resulting from changes in product mix, including mix among vehicle lines and mix of trim levels and options within a vehicle line • Net Pricing – primarily measures EBIT variance driven by changes in wholesale unit prices to dealers and marketing incentive programs such as rebate programs, low-rate financing offers, special lease offers and stock adjustments on dealer inventory • Market Factors exclude the impact of unconsolidated affiliate wholesale units Earnings Before Taxes (EBT) • Reflects income before income taxes Software and Physical Services ▪ Includes software, extended service contracts, parts and accessories, and other services 34
- 35. 2025 Ford F-350 Super Duty Platinum Plus Delivering Ford+ Q2 2025 Earnings