Etsy's Q2 2025 Performance Review
 AI Summary
Key Insights
- 📈 Financial Highlights: Q2 2025 GMS at $2.8B, revenue at $673M, and adjusted EBITDA at $169M.
- 🤝 Customer Flywheel: Focus on personalized on-site experiences and leveraging AI and LLMs.
- 📱 App Growth: Etsy app grew Y/Y and now represents approximately 45% of total GMS.
- 🤖 AI Integration: Etsy is positioned as a top retail ecommerce recipient of agentic chatbot traffic.
- 🎯 Q3 2025 Guidance: Expecting GMS to range from $2.6B to $2.7B and an adjusted EBITDA margin of ~25%.


Etsy's Q2 2025 Performance Review
- 1. July 30, 2025 Q2 2025 Financial Results 1
- 2. 2 This presentation contains forward-looking statements within the meaning of the federal securities laws. Forward-looking statements include but are not limited to statements relating to: our financial guidance for the third quarter of 2025 and underlying assumptions; our customer relationship flywheel; the impact of AI, ML, and LLMs; our ability to become a leader in agentic shopping; our product development investments and marketing initiatives; the impact of our investment in our app; the updates to our Insider beta program; the impact of our new ranking and recommendation models; the strength of our financial foundation; our resiliency and ability to provide a dependable place to buy and sell; our ability to reignite Etsy marketplace growth; our ability to tailor buyer engagement and retention strategies; the impact of personalized browsing, discovery, and buyer experiences; expected changes in our brand media mix; our approach through 2025 and beyond; and the success of our capital light business model. Forward-looking statements include all statements that are not historical facts. In some cases, forward-looking statements can be identified by terms such as “aim,” “anticipate,” “believe,” “could,” “enable,” “estimate,” “expect,” “goal,” “intend,” “may,” “optimistic,” “outlook,” “plan,” “potential,” “should,” “target,” “will,” or similar expressions and derivative forms and/or the negatives of those words. Forward-looking statements involve substantial risks and uncertainties that may cause actual results to differ materially from those that we expect. These risks and uncertainties include but are not limited to: (1) macroeconomic, geopolitical, and other events outside of our control; (2) the level of demand for our services or products sold in our marketplaces; (3) the importance to our success of the trustworthiness of our marketplaces and our ability to attract and retain active and engaged communities of buyers and sellers; (4) any real or perceived inaccuracies in our operational metrics; (5) if we or our third-party providers are unable to protect against technology vulnerabilities, service interruptions, security breaches, or other cyber incidents; (6) our dependence on continued and unimpeded access to third-party services, platforms, and infrastructure; (7) operational and compliance risks related to our payments systems; (8) the global scope of our business; (9) our ability to recruit and retain employees; (10) our ability to compete effectively; (11) our ability to enhance our current offerings and develop new offerings to respond to the changing needs of sellers and buyers; (12) risks related to our environmental, social, and governance activities and disclosures; (13) barriers to international trade and our efforts to grow our markets globally; (14) acquisitions, dispositions, or strategic partnerships that may prove unsuccessful or divert management attention; (15) our ability to deal effectively with fraud or other illegal activity; (16) the impact of artificial intelligence on our business and industry; and (17) litigation and evolving global legal and regulatory requirements, including privacy and data protection laws, tax laws, product liability laws, laws regulating speech and platform moderation, antitrust laws, and intellectual property and counterfeiting regulations. These and other risks and uncertainties are more fully described in our filings with the Securities and Exchange Commission, including in the section entitled “Risk Factors” in our most recent Quarterly Report on Form 10-Q, and subsequent reports that we file with the Securities and Exchange Commission. Moreover, we operate in a very competitive and rapidly changing environment. New risks emerge from time to time. It is not possible for our management to predict all risks, nor can we assess the impact of all factors on our business or the extent to which any factor, or combination of factors, may cause actual results to differ materially from those contained in any forward-looking statements we may make. In light of these risks, uncertainties, and assumptions, we cannot guarantee future results, levels of activity, performance, achievements, or events and circumstances reflected in the forward-looking statements will occur. Forward-looking statements represent our beliefs and assumptions only as of the date hereof. We disclaim any obligation to update forward-looking statements. Forward-looking Statements This presentation is a high-level summary of our Q2 2025 financial results. For more information please refer to our press release dated July 30, 2025 and filings with the SEC. Please see the appendix for a reconciliation of the non-GAAP financial measures used in this presentation to their respective most directly comparable financial measures, where available, calculated in accordance with GAAP. For information about how we define active buyers, new buyers, reactivated buyers, repeat buyers and habitual buyers, see our most recent Annual Report on Form 10-K.
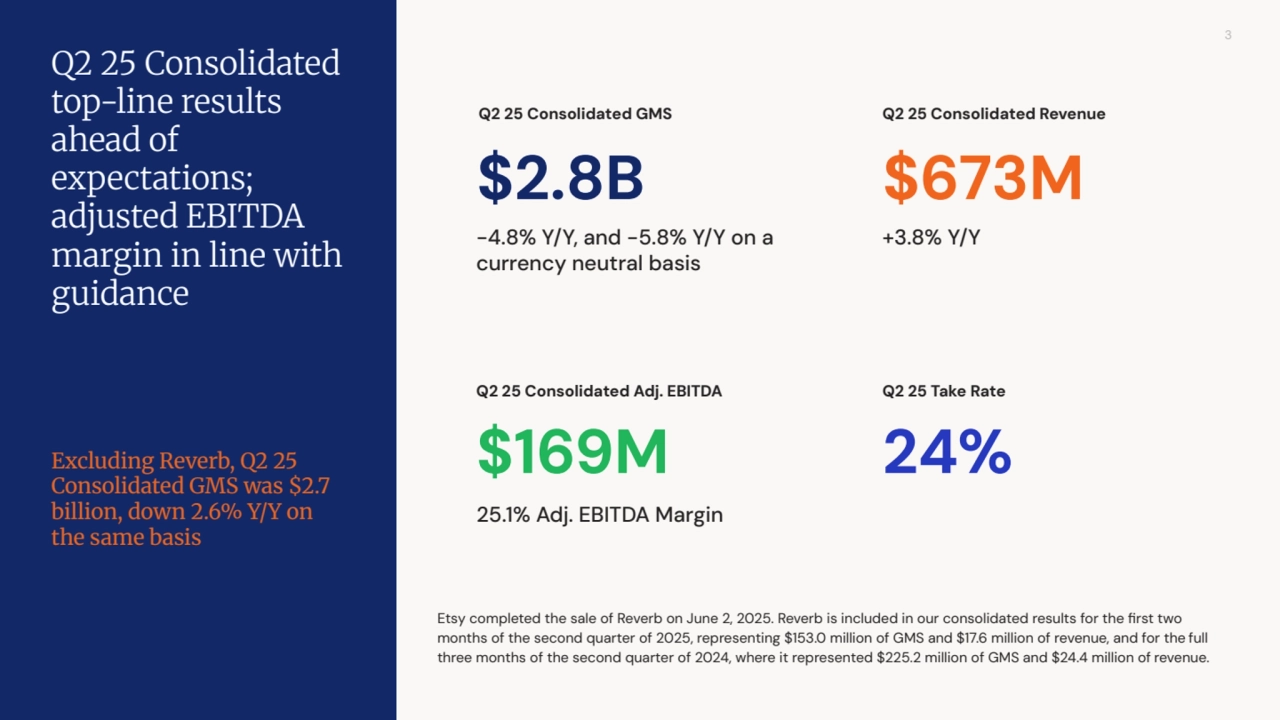
- 3. 3 Etsy completed the sale of Reverb on June 2, 2025. Reverb is included in our consolidated results for the first two months of the second quarter of 2025, representing $153.0 million of GMS and $17.6 million of revenue, and for the full three months of the second quarter of 2024, where it represented $225.2 million of GMS and $24.4 million of revenue. $2.8B Q2 25 Consolidated top-line results ahead of expectations; adjusted EBITDA margin in line with guidance Q2 25 Consolidated GMS -4.8% Y/Y, and -5.8% Y/Y on a currency neutral basis $169M Q2 25 Consolidated Adj. EBITDA 25.1% Adj. EBITDA Margin $673M Q2 25 Consolidated Revenue +3.8% Y/Y Excluding Reverb, Q2 25 Consolidated GMS was $2.7 billion, down 2.6% Y/Y on the same basis 24% Q2 25 Take Rate
- 4. 4 Evolve our surfaces to become more browsable Capture vastly more + enriched data about consumers’ interests, inclinations, identities and habits Build more powerful models leveraging LLMs Create more personalized on-site experiences Generate more personalized marketing Creating a powerful customer relationship flywheel
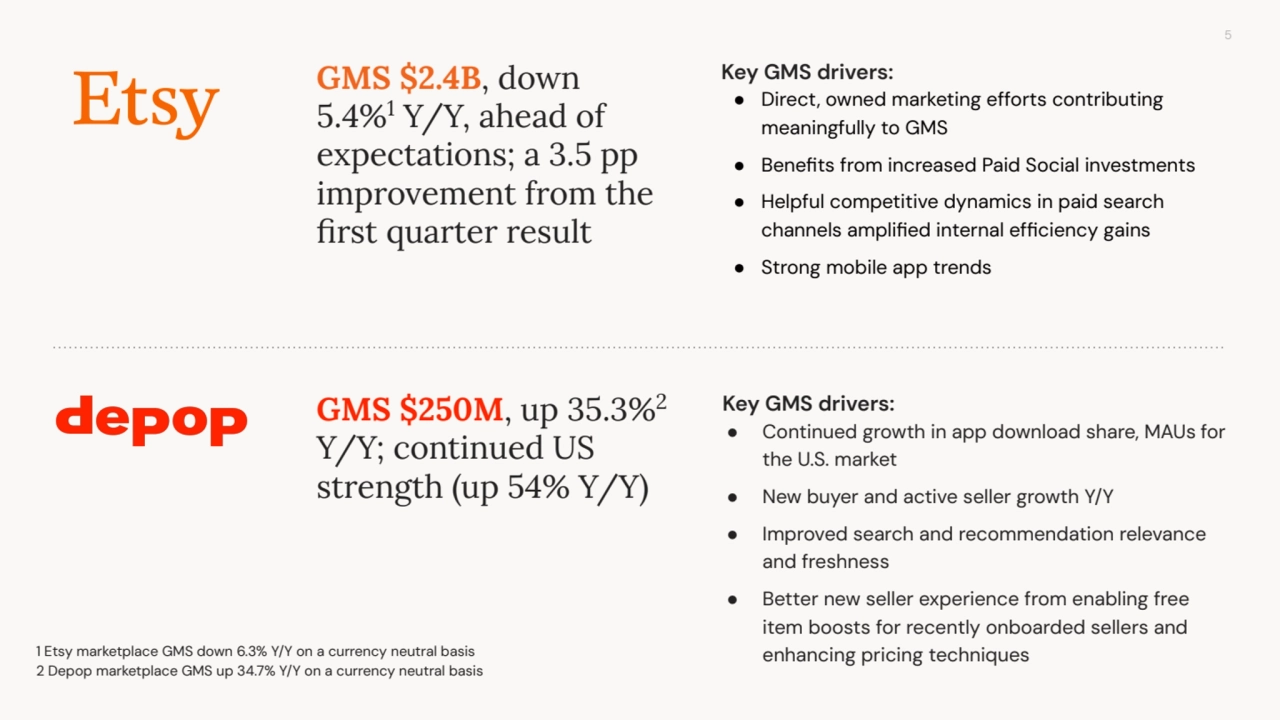
- 5. 5 GMS $250M, up 35.3%2 Y/Y; continued US strength (up 54% Y/Y) GMS $2.4B, down 5.4%1 Y/Y, ahead of expectations; a 3.5 pp improvement from the first quarter result 1 Etsy marketplace GMS down 6.3% Y/Y on a currency neutral basis 2 Depop marketplace GMS up 34.7% Y/Y on a currency neutral basis Key GMS drivers: ● Direct, owned marketing efforts contributing meaningfully to GMS ● Benefits from increased Paid Social investments ● Helpful competitive dynamics in paid search channels amplified internal efficiency gains ● Strong mobile app trends Key GMS drivers: ● Continued growth in app download share, MAUs for the U.S. market ● New buyer and active seller growth Y/Y ● Improved search and recommendation relevance and freshness ● Better new seller experience from enabling free item boosts for recently onboarded sellers and enhancing pricing techniques
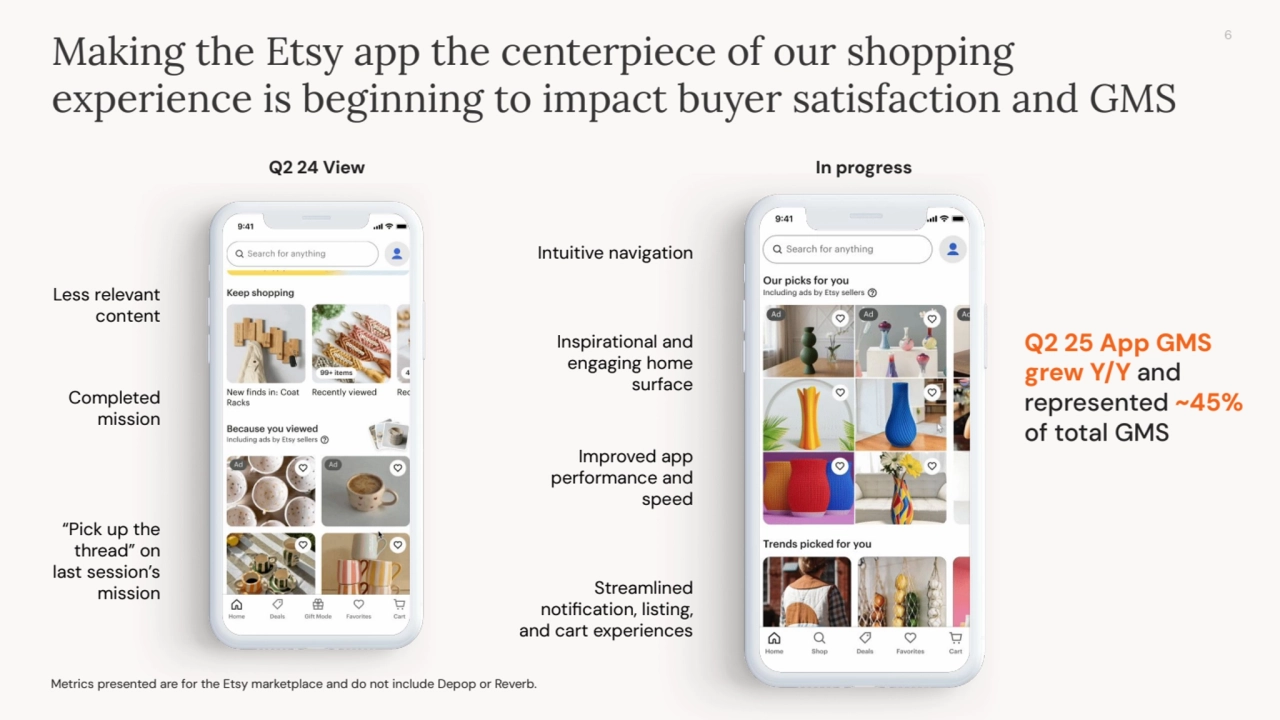
- 6. 6 Less relevant content Completed mission “Pick up the thread” on last session’s mission Inspirational and engaging home surface Making the Etsy app the centerpiece of our shopping experience is beginning to impact buyer satisfaction and GMS Q2 25 App GMS grew Y/Y and represented ~45% of total GMS Metrics presented are for the Etsy marketplace and do not include Depop or Reverb. Q2 24 View In progress Improved app performance and speed Streamlined notification, listing, and cart experiences Intuitive navigation
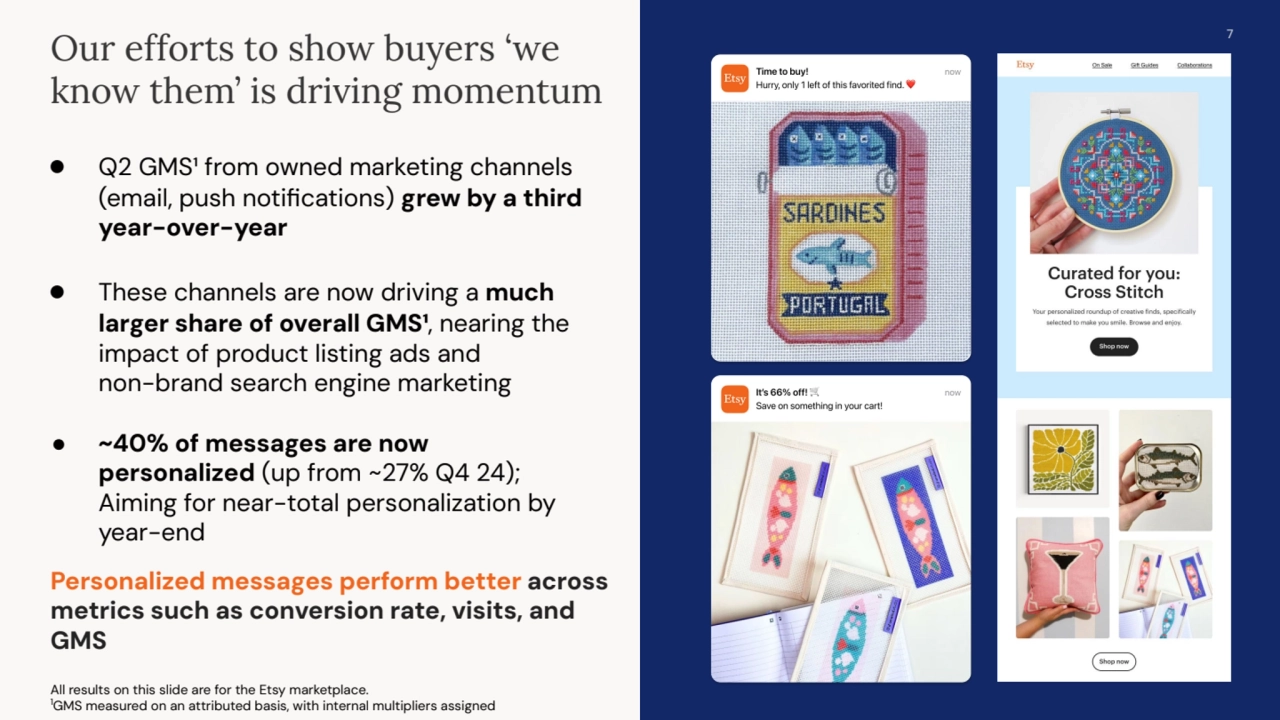
- 7. 7 Our efforts to show buyers ‘we know them’ is driving momentum ● Q2 GMS¹ from owned marketing channels (email, push notifications) grew by a third year-over-year ● These channels are now driving a much larger share of overall GMS¹, nearing the impact of product listing ads and non-brand search engine marketing ● ~40% of messages are now personalized (up from ~27% Q4 24); Aiming for near-total personalization by year-end Personalized messages perform better across metrics such as conversion rate, visits, and GMS All results on this slide are for the Etsy marketplace. 1GMS measured on an attributed basis, with internal multipliers assigned
- 8. 8 Making continued progress in AI for Search, and positioning Etsy to be a leader in Agentic Shopping Etsy identified as a top retail ecommerce recipient of agentic chatbot traffic1 1 Similarweb, "Top Recipients of AI Chatbot Traffic: Traffic driven by AI chatbot prompts, Worldwide", May 2025. (Similarweb offers estimated data derived from various third party sources, and is not a direct traffic measurement tool.) Etsy integrates seamless product discovery with Apple’s Visual Intelligence
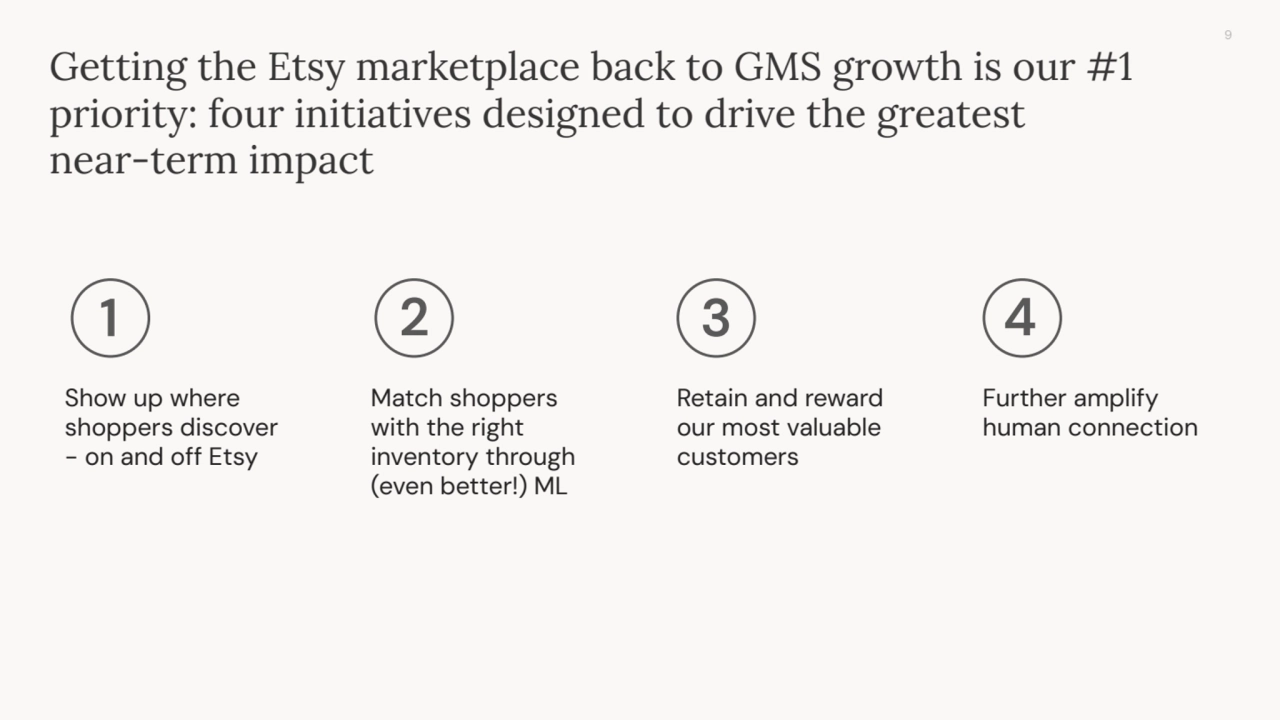
- 9. 9 Getting the Etsy marketplace back to GMS growth is our #1 priority: four initiatives designed to drive the greatest near-term impact Further amplify human connection Match shoppers with the right inventory through (even better!) ML Show up where shoppers discover - on and off Etsy Retain and reward our most valuable customers 1 2 3 4
- 10. 10 Show up where shoppers discover - on and off Etsy Combining our strong ROI-first mindset with an audience-first approach by: Low funnel, product-focused Mid funnel, consideration-focused Creator and Influencer Programs ● Ramping down spend on linear TV ● Accelerating social investment on certain platforms ● Streaming now the core of our brand media approach ● Improving app usability and discovery 1 …to help more people explore and be inspired by all that Etsy has to offer
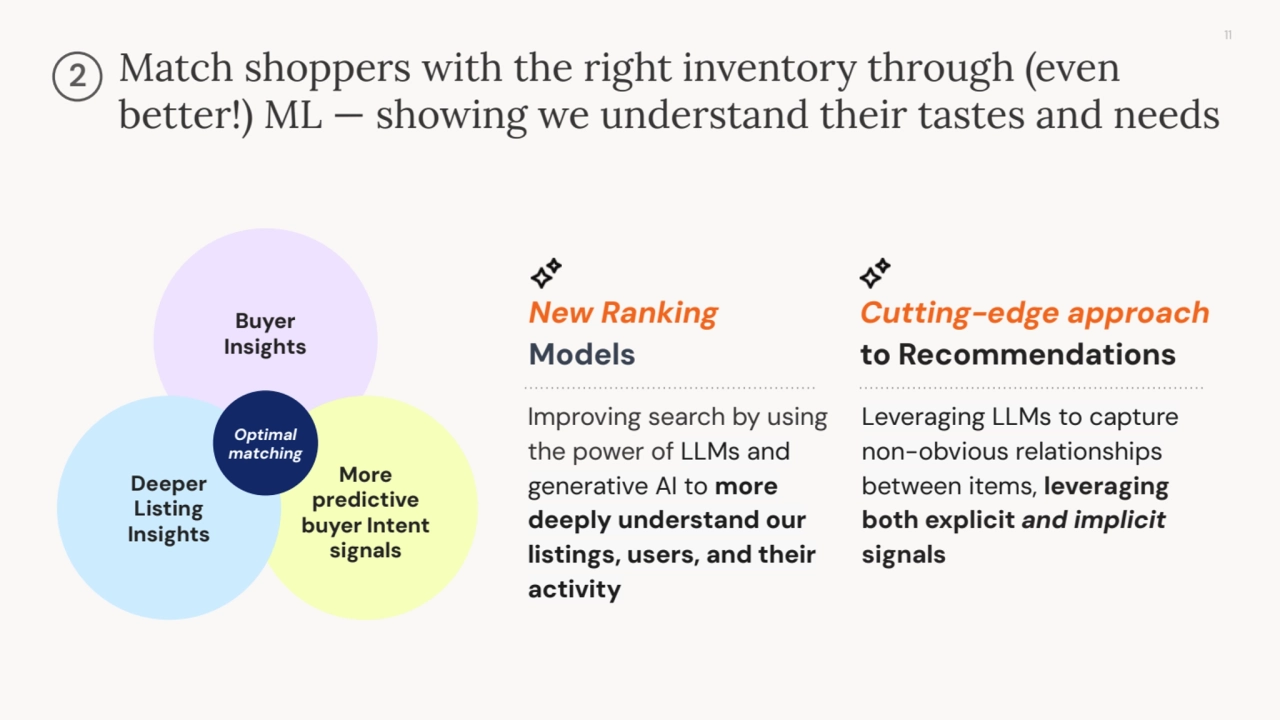
- 11. 11 Match shoppers with the right inventory through (even better!) ML — showing we understand their tastes and needs Buyer Insights More predictive buyer Intent signals Deeper Listing Insights Optimal matching 2 Improving search by using the power of LLMs and generative AI to more deeply understand our listings, users, and their activity Leveraging LLMs to capture non-obvious relationships between items, leveraging both explicit and implicit signals New Ranking Models Cutting-edge approach to Recommendations
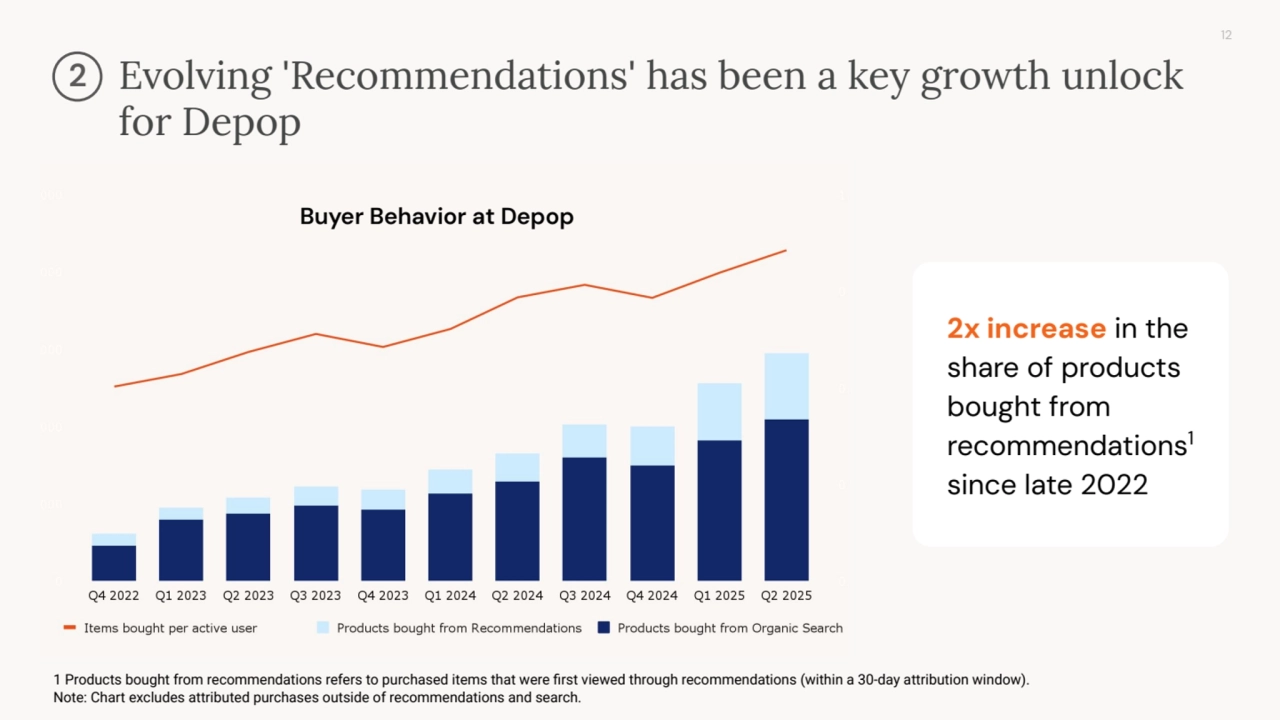
- 12. 12 Evolving 'Recommendations' has been a key growth unlock for Depop 2 2x increase in the share of products bought from recommendations1 since late 2022 1 Products bought from recommendations refers to purchased items that were first viewed through recommendations (within a 30-day attribution window). Note: Chart excludes attributed purchases outside of recommendations and search. Buyer Behavior at Depop
- 13. 13 Retain and reward our most valuable customers with a portfolio of tactics, including… Setup & Nudges Getting buyers to take key actions helps us serve them better - and increases lifetime value Simpler Selling Launched ‘quick actions’ in Shop Manager and improved Sell on Etsy app latency Rewards & Premium Programs Evolving our Etsy Insider beta program… and more Continued opportunity to drive app downloads We made it easy for sellers to see what's new from Etsy with our first-ever spring bundle release By Holiday 2025, Etsy Insider beta program will be expanded to include top buyers, and we’ll test new features and updated benefits 3 Imagery from slide 12 of marketing all hands
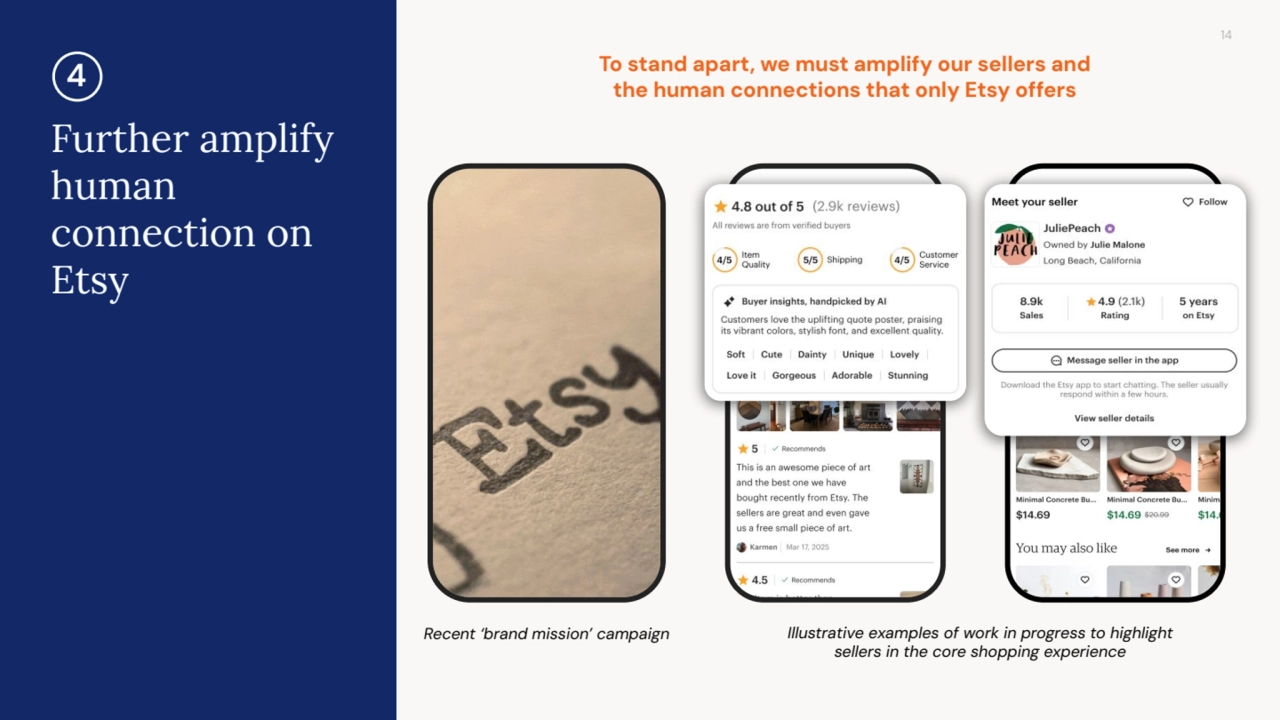
- 14. 14 Illustrative examples of work in progress to highlight sellers in the core shopping experience To stand apart, we must amplify our sellers and the human connections that only Etsy offers Further amplify human connection on Etsy Recent ‘brand mission’ campaign 4
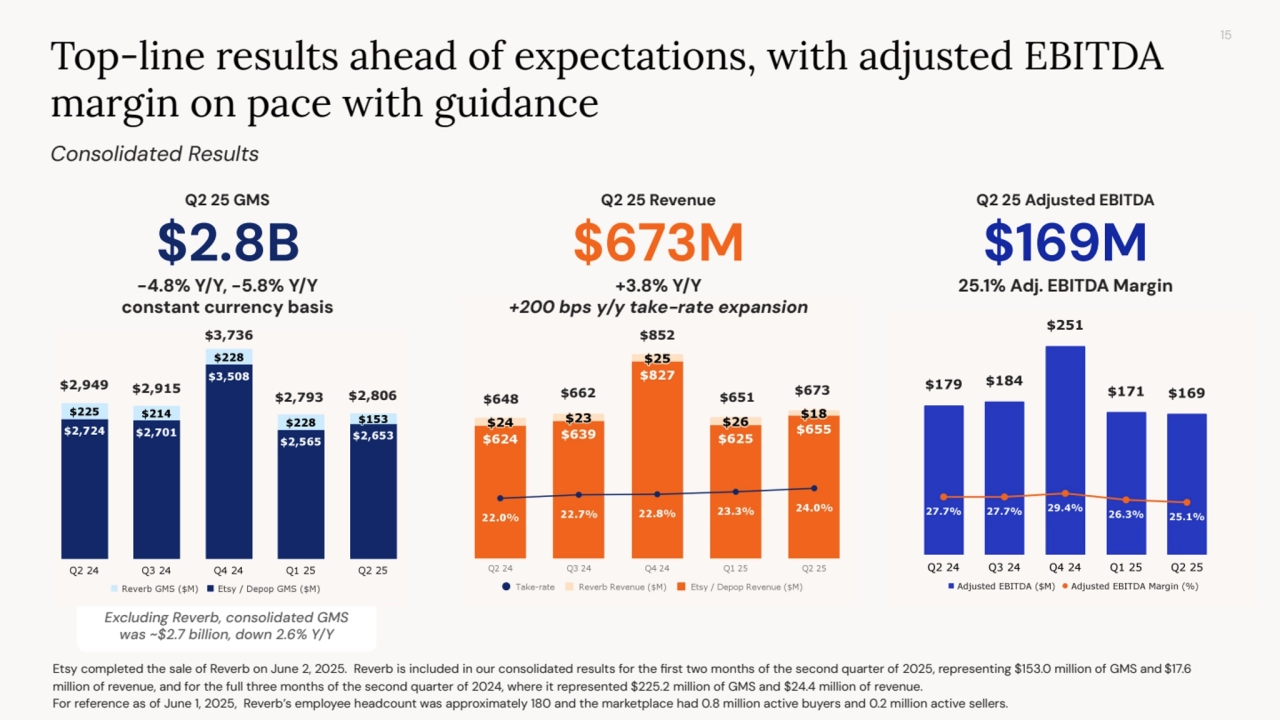
- 15. 15 -4.8% Y/Y, -5.8% Y/Y constant currency basis $2.8B Q2 25 GMS $169M Q2 25 Adjusted EBITDA 25.1% Adj. EBITDA Margin $673M Q2 25 Revenue Consolidated Results Top-line results ahead of expectations, with adjusted EBITDA margin on pace with guidance Excluding Reverb, consolidated GMS was ~$2.7 billion, down 2.6% Y/Y +3.8% Y/Y +200 bps y/y take-rate expansion Etsy completed the sale of Reverb on June 2, 2025. Reverb is included in our consolidated results for the first two months of the second quarter of 2025, representing $153.0 million of GMS and $17.6 million of revenue, and for the full three months of the second quarter of 2024, where it represented $225.2 million of GMS and $24.4 million of revenue. For reference as of June 1, 2025, Reverb’s employee headcount was approximately 180 and the marketplace had 0.8 million active buyers and 0.2 million active sellers. $648 $662 $852 $651 $673 $2,949 $2,915 $3,736 $2,793 $2,806
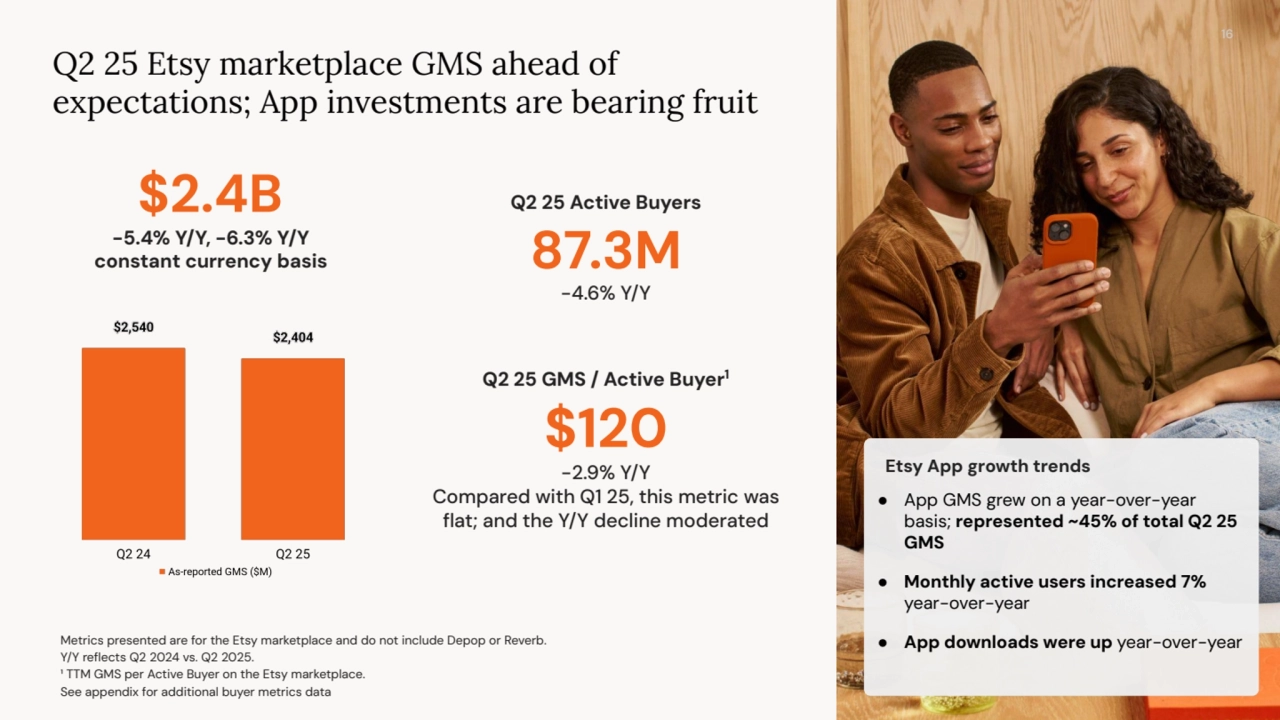
- 16. -5.4% Y/Y, -6.3% Y/Y constant currency basis $2.4B Q2 25 Etsy marketplace GMS ahead of expectations; App investments are bearing fruit Q2 25 Active Buyers 87.3M -4.6% Y/Y Q2 25 GMS / Active Buyer1 $120 -2.9% Y/Y Compared with Q1 25, this metric was flat; and the Y/Y decline moderated Metrics presented are for the Etsy marketplace and do not include Depop or Reverb. Y/Y reflects Q2 2024 vs. Q2 2025. ¹ TTM GMS per Active Buyer on the Etsy marketplace. See appendix for additional buyer metrics data ● App GMS grew on a year-over-year basis; represented ~45% of total Q2 25 GMS ● Monthly active users increased 7% year-over-year ● App downloads were up year-over-year Etsy App growth trends 16
- 17. 5.4M Active Etsy marketplace sellers ● Active seller count declined 18% Y/Y, a moderation in Y/Y decline from Q1 and flat sequentially ● The new seller set-up fee and stepped up enforcement actions have meaningfully slowed the onboarding of new sellers 17 Metrics presented are for the Etsy marketplace. Y/Y reflects Q2 2024 vs. Q2 2025. Active seller count is a TTM figure A higher % of current active sellers have made a sale in the last 12 months vs before the new fee AND: the number of new sellers who made a sale in Q2 25 improved on a Y/Y basis 17 A higher percentage of sellers are making sales on Etsy
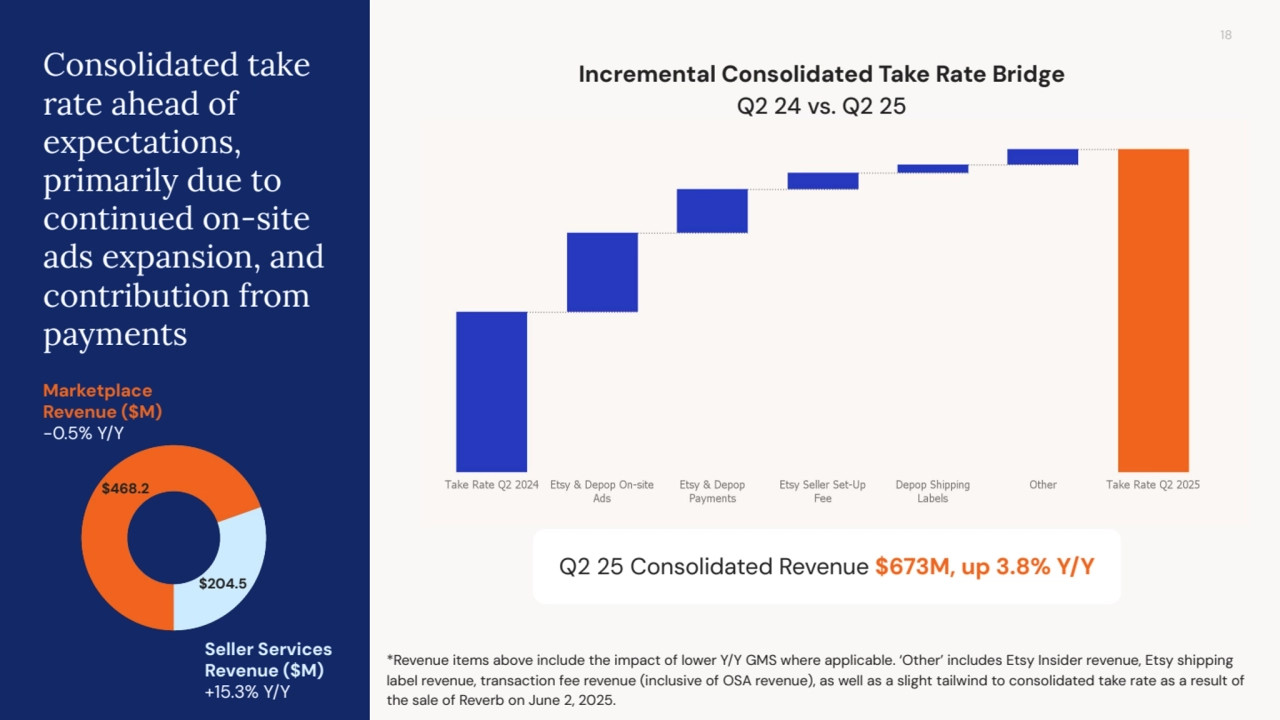
- 18. 18 *Revenue items above include the impact of lower Y/Y GMS where applicable. ‘Other’ includes Etsy Insider revenue, Etsy shipping label revenue, transaction fee revenue (inclusive of OSA revenue), as well as a slight tailwind to consolidated take rate as a result of the sale of Reverb on June 2, 2025. Consolidated take rate ahead of expectations, primarily due to continued on-site ads expansion, and contribution from payments Incremental Consolidated Take Rate Bridge Q2 24 vs. Q2 25 Seller Services Revenue ($M) +15.3% Y/Y Marketplace Revenue ($M) -0.5% Y/Y Q2 25 Consolidated Revenue $673M, up 3.8% Y/Y $468.2 $204.5
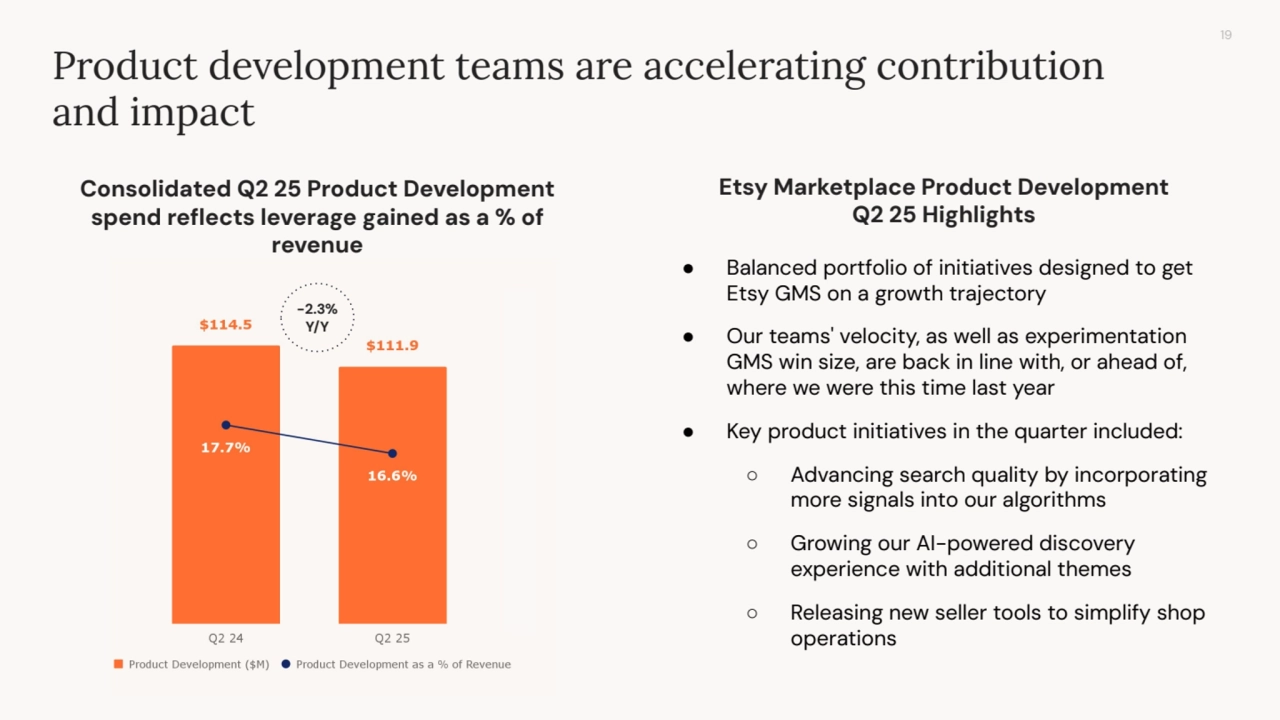
- 19. 19 Product development teams are accelerating contribution and impact Consolidated Q2 25 Product Development spend reflects leverage gained as a % of revenue Etsy Marketplace Product Development Q2 25 Highlights ● Balanced portfolio of initiatives designed to get Etsy GMS on a growth trajectory ● Our teams' velocity, as well as experimentation GMS win size, are back in line with, or ahead of, where we were this time last year ● Key product initiatives in the quarter included: ○ Advancing search quality by incorporating more signals into our algorithms ○ Growing our AI-powered discovery experience with additional themes ○ Releasing new seller tools to simplify shop operations -2.3% Y/Y
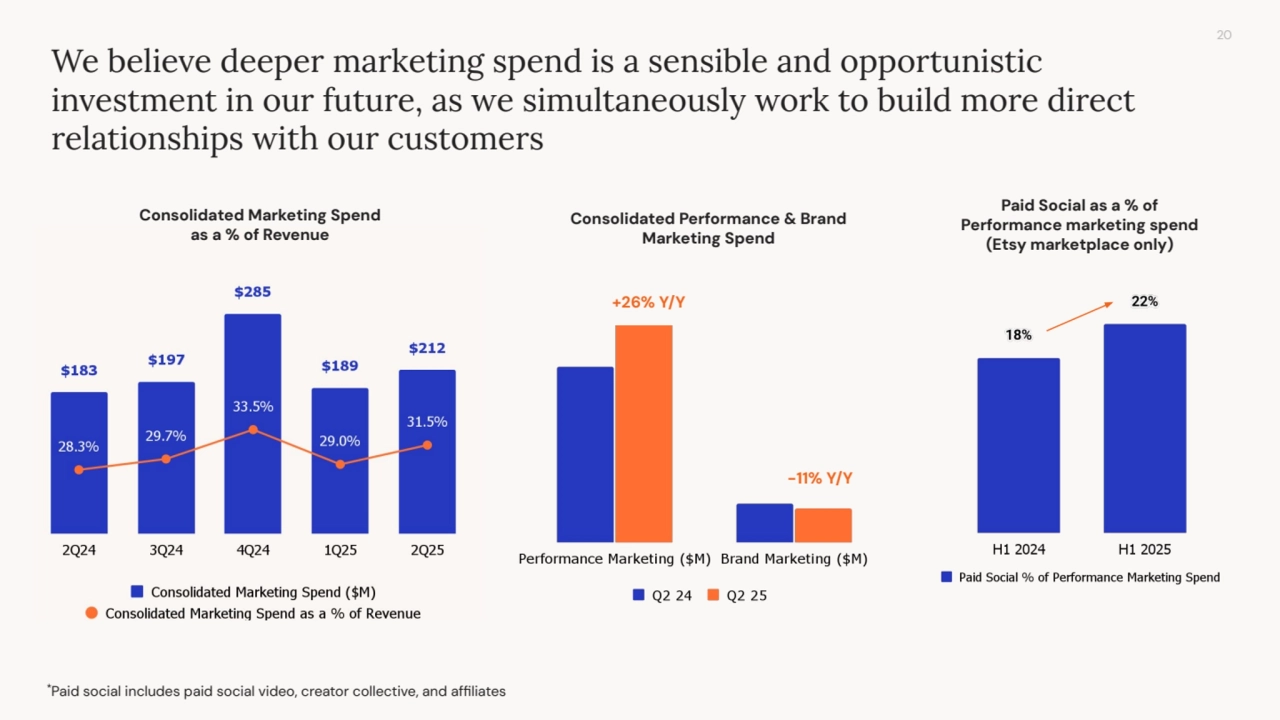
- 20. 20 Consolidated Performance & Brand Marketing Spend We believe deeper marketing spend is a sensible and opportunistic investment in our future, as we simultaneously work to build more direct relationships with our customers *Paid social includes paid social video, creator collective, and affiliates +26% Y/Y -11% Y/Y Consolidated Marketing Spend as a % of Revenue Paid Social as a % of Performance marketing spend (Etsy marketplace only)
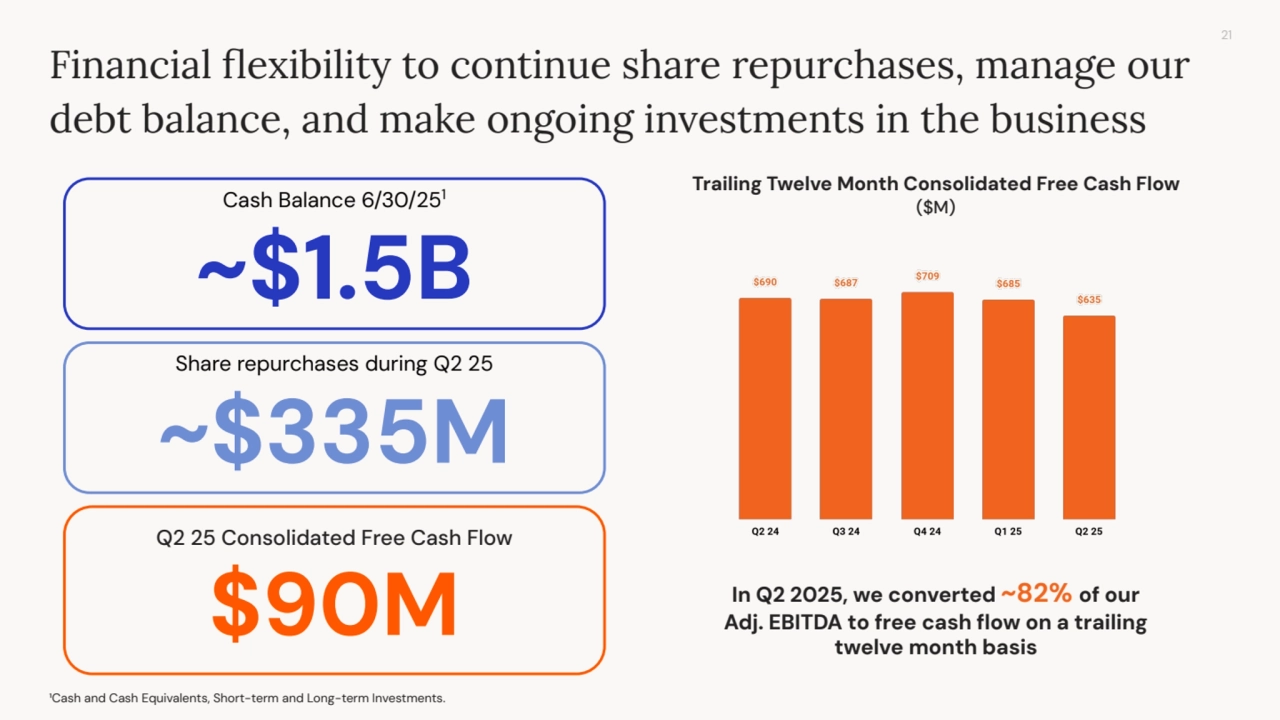
- 21. 21 Cash Balance 6/30/251 ~$1.5B Q2 25 Consolidated Free Cash Flow $90M ¹Cash and Cash Equivalents, Short-term and Long-term Investments. Financial flexibility to continue share repurchases, manage our debt balance, and make ongoing investments in the business Share repurchases during Q2 25 ~$335M Trailing Twelve Month Consolidated Free Cash Flow ($M) In Q2 2025, we converted ~82% of our Adj. EBITDA to free cash flow on a trailing twelve month basis
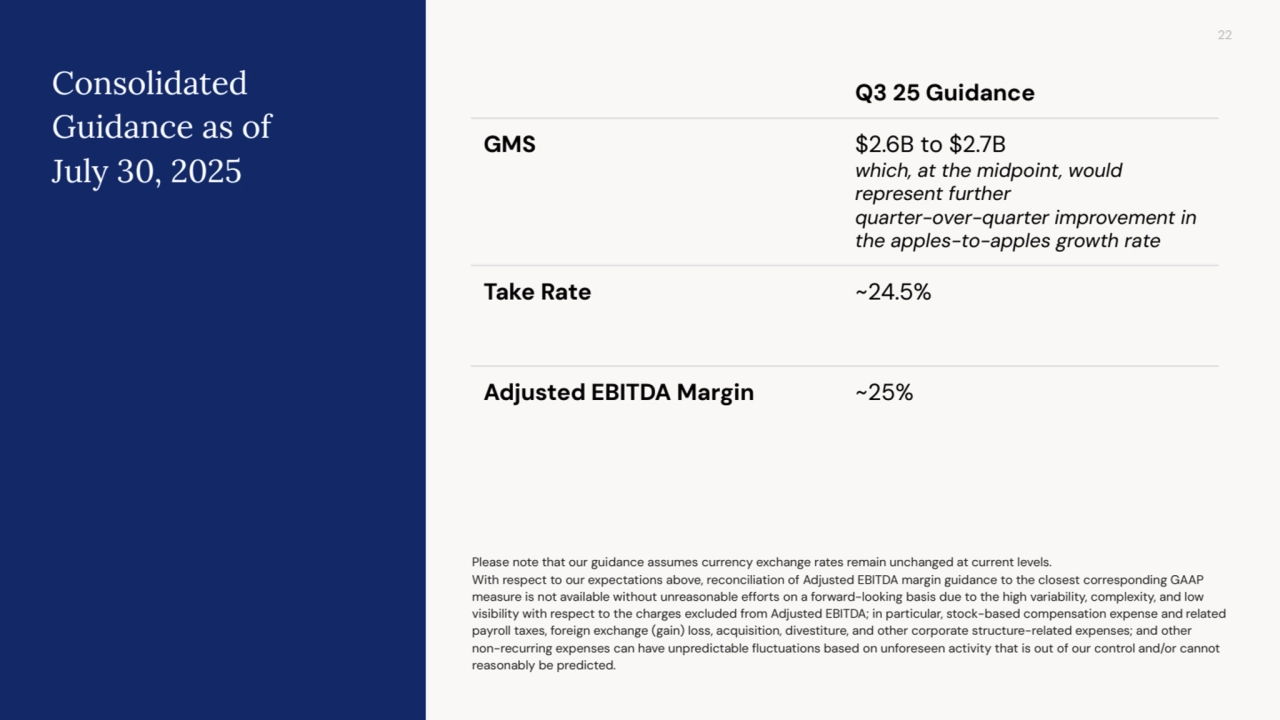
- 22. 22 Please note that our guidance assumes currency exchange rates remain unchanged at current levels. With respect to our expectations above, reconciliation of Adjusted EBITDA margin guidance to the closest corresponding GAAP measure is not available without unreasonable efforts on a forward-looking basis due to the high variability, complexity, and low visibility with respect to the charges excluded from Adjusted EBITDA; in particular, stock-based compensation expense and related payroll taxes, foreign exchange (gain) loss, acquisition, divestiture, and other corporate structure-related expenses; and other non-recurring expenses can have unpredictable fluctuations based on unforeseen activity that is out of our control and/or cannot reasonably be predicted. Q3 25 Guidance GMS $2.6B to $2.7B which, at the midpoint, would represent further quarter-over-quarter improvement in the apples-to-apples growth rate Take Rate ~24.5% Adjusted EBITDA Margin ~25% Consolidated Guidance as of July 30, 2025
- 23. Q&A
- 24. Appendix
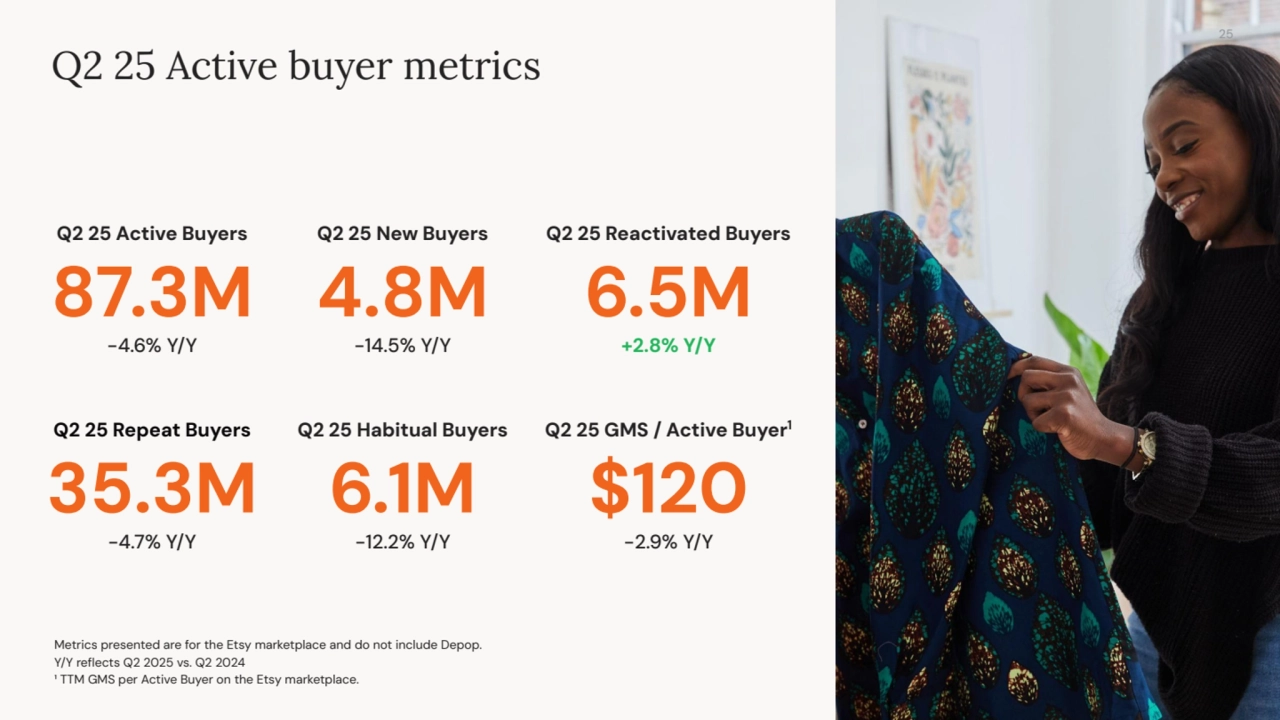
- 25. Q2 25 Active buyer metrics Metrics presented are for the Etsy marketplace and do not include Depop. Y/Y reflects Q2 2025 vs. Q2 2024 ¹ TTM GMS per Active Buyer on the Etsy marketplace. Q2 25 Habitual Buyers 6.1M -12.2% Y/Y Q2 25 New Buyers 4.8M -14.5% Y/Y Q2 25 Active Buyers 87.3M -4.6% Y/Y Q2 25 Reactivated Buyers 6.5M +2.8% Y/Y Q2 25 GMS / Active Buyer1 $120 -2.9% Y/Y Q2 25 Repeat Buyers 35.3M -4.7% Y/Y 25
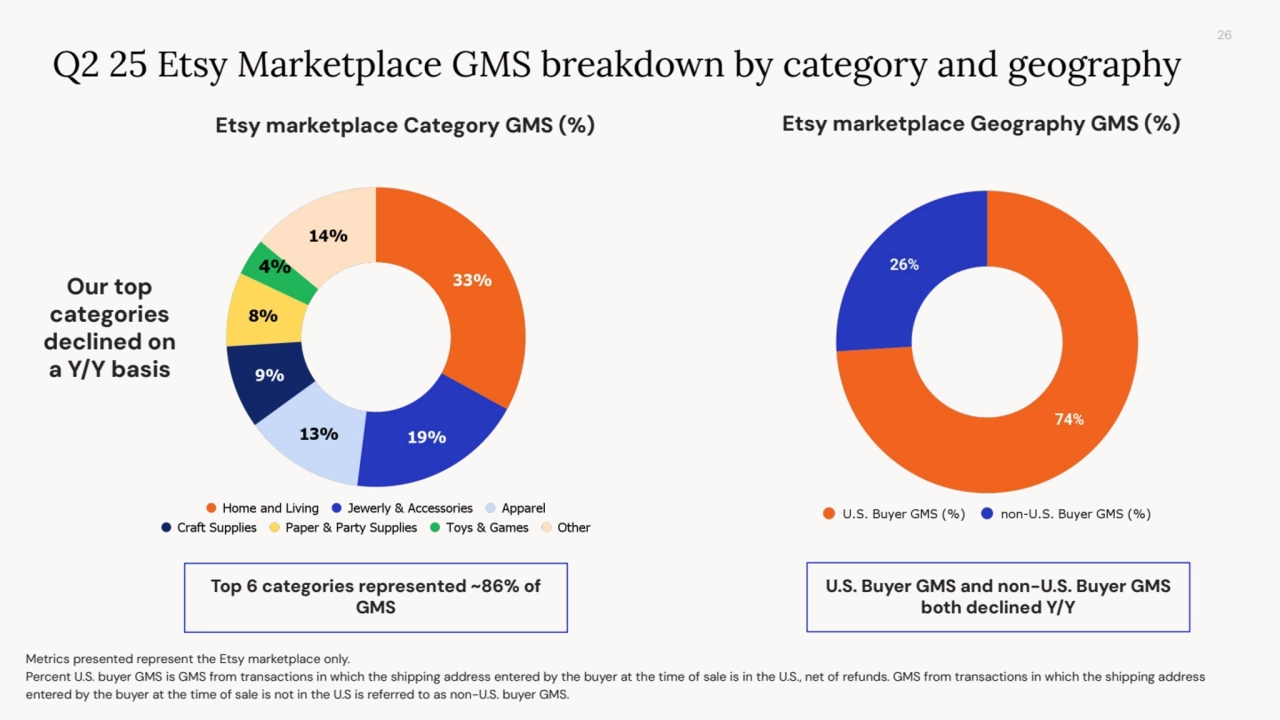
- 26. 26 Etsy marketplace Category GMS (%) Top 6 categories represented ~86% of GMS 4% Q2 25 Etsy Marketplace GMS breakdown by category and geography Etsy marketplace Geography GMS (%) Metrics presented represent the Etsy marketplace only. Percent U.S. buyer GMS is GMS from transactions in which the shipping address entered by the buyer at the time of sale is in the U.S., net of refunds. GMS from transactions in which the shipping address entered by the buyer at the time of sale is not in the U.S is referred to as non-U.S. buyer GMS. Our top categories declined on a Y/Y basis U.S. Buyer GMS and non-U.S. Buyer GMS both declined Y/Y
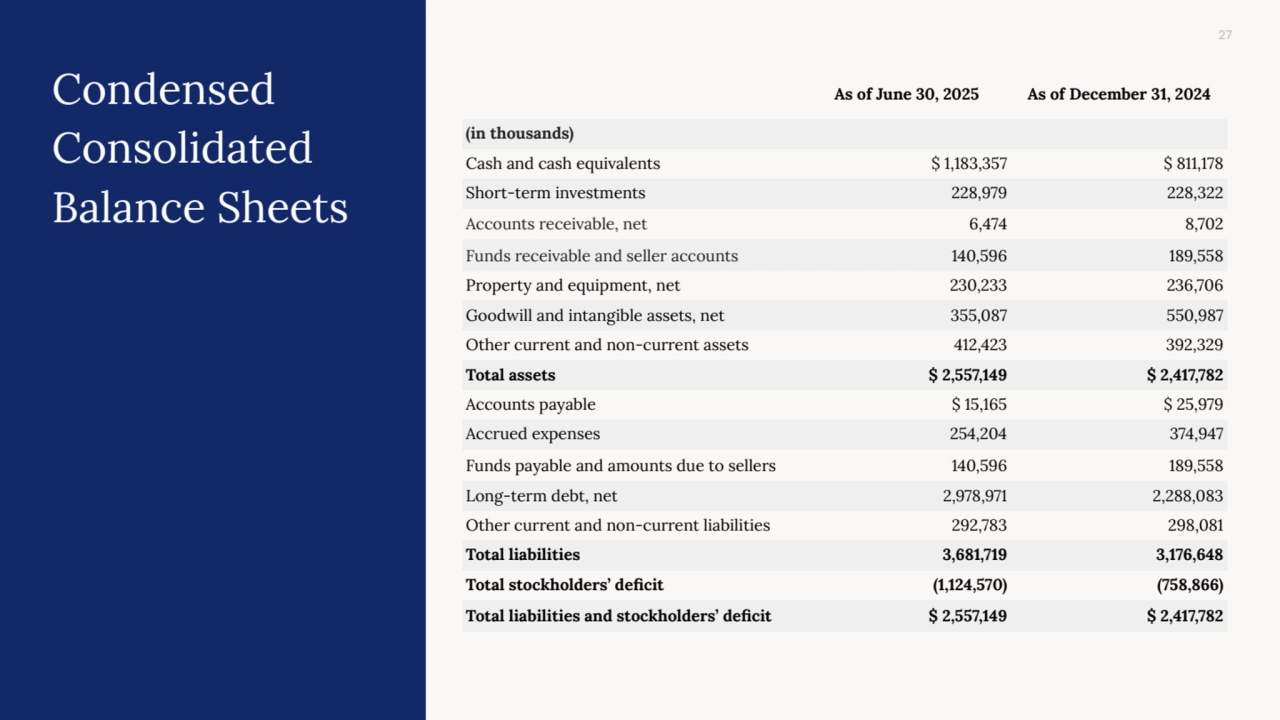
- 27. 27 Condensed Consolidated Balance Sheets As of June 30, 2025 As of December 31, 2024 (in thousands) Cash and cash equivalents $ 1,183,357 $ 811,178 Short-term investments 228,979 228,322 Accounts receivable, net 6,474 8,702 Funds receivable and seller accounts 140,596 189,558 Property and equipment, net 230,233 236,706 Goodwill and intangible assets, net 355,087 550,987 Other current and non-current assets 412,423 392,329 Total assets $ 2,557,149 $ 2,417,782 Accounts payable $ 15,165 $ 25,979 Accrued expenses 254,204 374,947 Funds payable and amounts due to sellers 140,596 189,558 Long-term debt, net 2,978,971 2,288,083 Other current and non-current liabilities 292,783 298,081 Total liabilities 3,681,719 3,176,648 Total stockholders’ deficit (1,124,570) (758,866) Total liabilities and stockholders’ deficit $ 2,557,149 $ 2,417,782
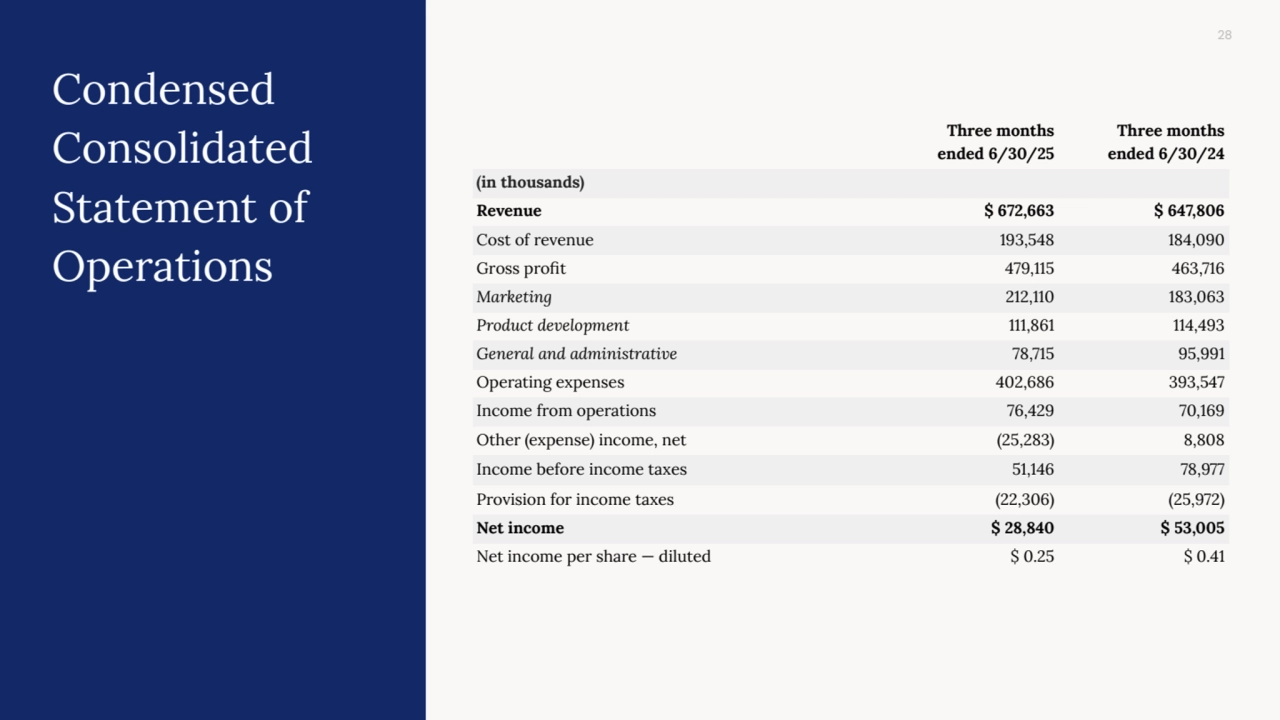
- 28. 28 Three months ended 6/30/25 Three months ended 6/30/24 (in thousands) Revenue $ 672,663 $ 647,806 Cost of revenue 193,548 184,090 Gross profit 479,115 463,716 Marketing 212,110 183,063 Product development 111,861 114,493 General and administrative 78,715 95,991 Operating expenses 402,686 393,547 Income from operations 76,429 70,169 Other (expense) income, net (25,283) 8,808 Income before income taxes 51,146 78,977 Provision for income taxes (22,306) (25,972) Net income $ 28,840 $ 53,005 Net income per share — diluted $ 0.25 $ 0.41 Condensed Consolidated Statement of Operations
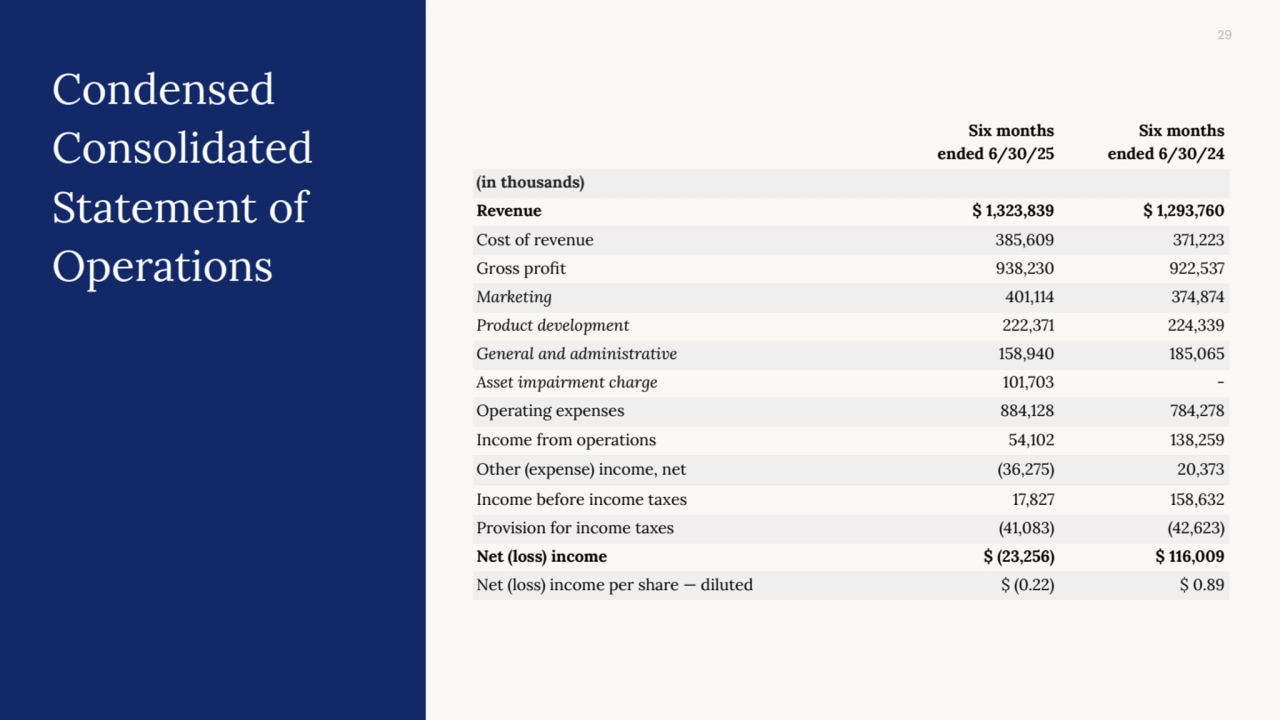
- 29. 29 Six months ended 6/30/25 Six months ended 6/30/24 (in thousands) Revenue $ 1,323,839 $ 1,293,760 Cost of revenue 385,609 371,223 Gross profit 938,230 922,537 Marketing 401,114 374,874 Product development 222,371 224,339 General and administrative 158,940 185,065 Asset impairment charge 101,703 - Operating expenses 884,128 784,278 Income from operations 54,102 138,259 Other (expense) income, net (36,275) 20,373 Income before income taxes 17,827 158,632 Provision for income taxes (41,083) (42,623) Net (loss) income $ (23,256) $ 116,009 Net (loss) income per share — diluted $ (0.22) $ 0.89 Condensed Consolidated Statement of Operations
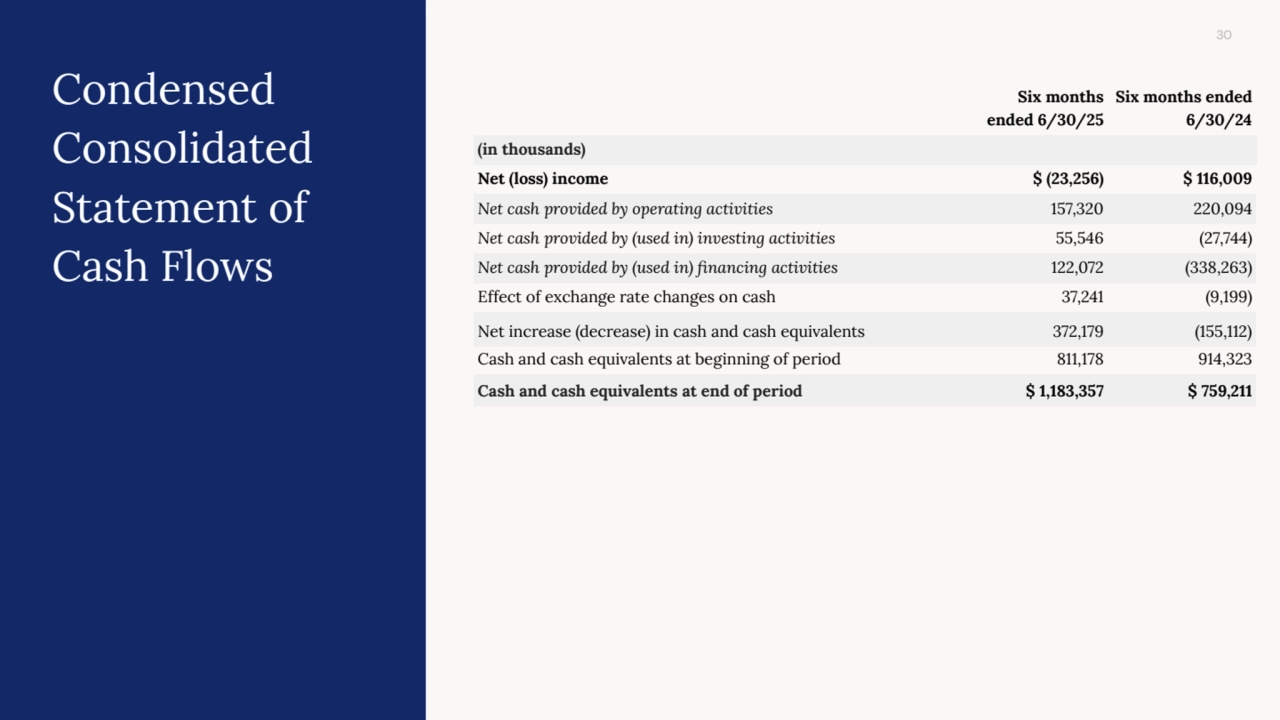
- 30. 30 Six months ended 6/30/25 Six months ended 6/30/24 (in thousands) Net (loss) income $ (23,256) $ 116,009 Net cash provided by operating activities 157,320 220,094 Net cash provided by (used in) investing activities 55,546 (27,744) Net cash provided by (used in) financing activities 122,072 (338,263) Effect of exchange rate changes on cash 37,241 (9,199) Net increase (decrease) in cash and cash equivalents 372,179 (155,112) Cash and cash equivalents at beginning of period 811,178 914,323 Cash and cash equivalents at end of period $ 1,183,357 $ 759,211 Condensed Consolidated Statement of Cash Flows
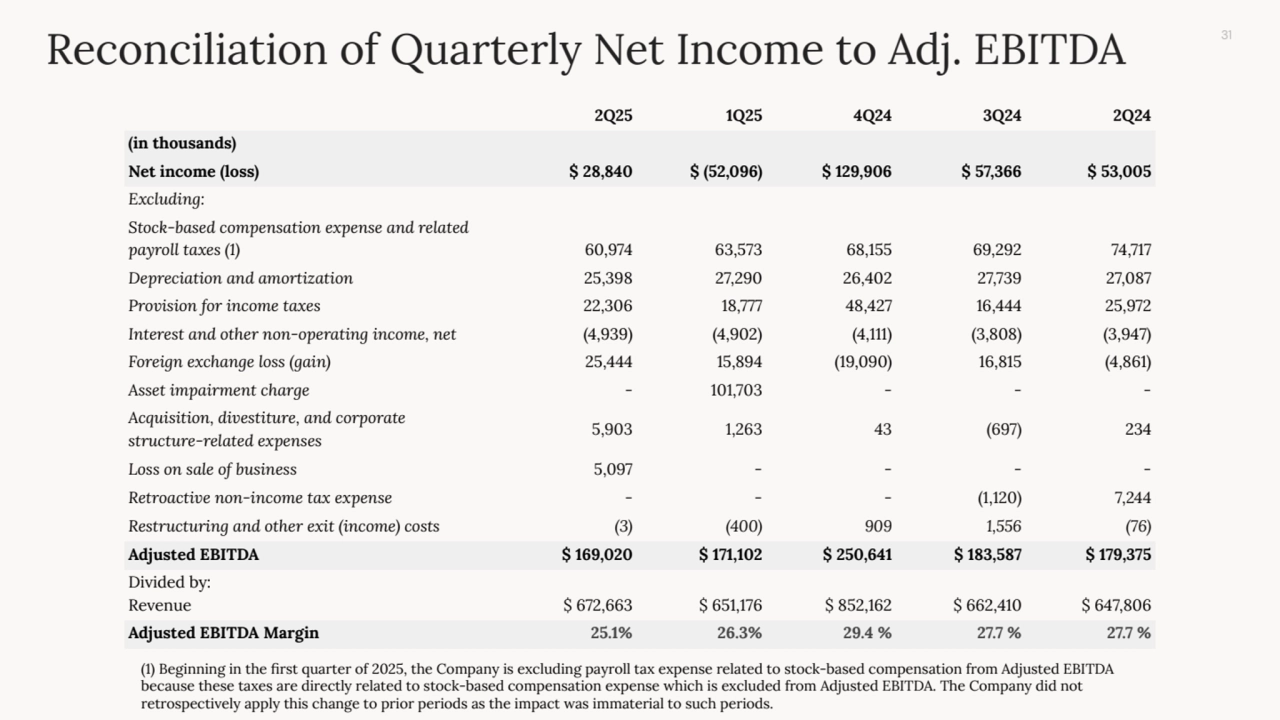
- 31. 31 Reconciliation of Quarterly Net Income to Adj. EBITDA 2Q25 1Q25 4Q24 3Q24 2Q24 (in thousands) Net income (loss) $ 28,840 $ (52,096) $ 129,906 $ 57,366 $ 53,005 Excluding: Stock-based compensation expense and related payroll taxes (1) 60,974 63,573 68,155 69,292 74,717 Depreciation and amortization 25,398 27,290 26,402 27,739 27,087 Provision for income taxes 22,306 18,777 48,427 16,444 25,972 Interest and other non-operating income, net (4,939) (4,902) (4,111) (3,808) (3,947) Foreign exchange loss (gain) 25,444 15,894 (19,090) 16,815 (4,861) Asset impairment charge - 101,703 - - - Acquisition, divestiture, and corporate structure-related expenses 5,903 1,263 43 (697) 234 Loss on sale of business 5,097 - - - - Retroactive non-income tax expense - - - (1,120) 7,244 Restructuring and other exit (income) costs (3) (400) 909 1,556 (76) Adjusted EBITDA $ 169,020 $ 171,102 $ 250,641 $ 183,587 $ 179,375 Divided by: Revenue $ 672,663 $ 651,176 $ 852,162 $ 662,410 $ 647,806 Adjusted EBITDA Margin 25.1% 26.3% 29.4 % 27.7 % 27.7 % (1) Beginning in the first quarter of 2025, the Company is excluding payroll tax expense related to stock-based compensation from Adjusted EBITDA because these taxes are directly related to stock-based compensation expense which is excluded from Adjusted EBITDA. The Company did not retrospectively apply this change to prior periods as the impact was immaterial to such periods.
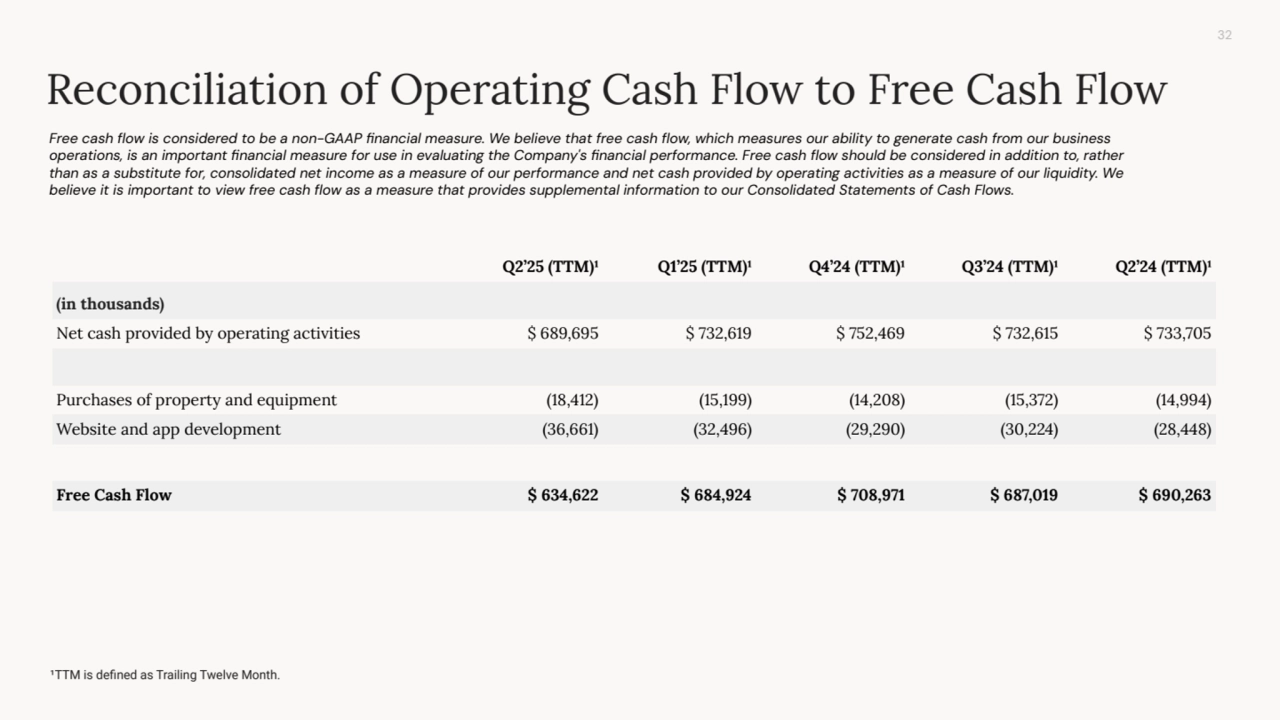
- 32. 32 Reconciliation of Operating Cash Flow to Free Cash Flow Free cash flow is considered to be a non-GAAP financial measure. We believe that free cash flow, which measures our ability to generate cash from our business operations, is an important financial measure for use in evaluating the Company's financial performance. Free cash flow should be considered in addition to, rather than as a substitute for, consolidated net income as a measure of our performance and net cash provided by operating activities as a measure of our liquidity. We believe it is important to view free cash flow as a measure that provides supplemental information to our Consolidated Statements of Cash Flows. ¹TTM is defined as Trailing Twelve Month. Q2’25 (TTM)¹ Q1’25 (TTM)¹ Q4’24 (TTM)¹ Q3’24 (TTM)¹ Q2’24 (TTM)¹ (in thousands) Net cash provided by operating activities $ 689,695 $ 732,619 $ 752,469 $ 732,615 $ 733,705 Purchases of property and equipment (18,412) (15,199) (14,208) (15,372) (14,994) Website and app development (36,661) (32,496) (29,290) (30,224) (28,448) Free Cash Flow $ 634,622 $ 684,924 $ 708,971 $ 687,019 $ 690,263
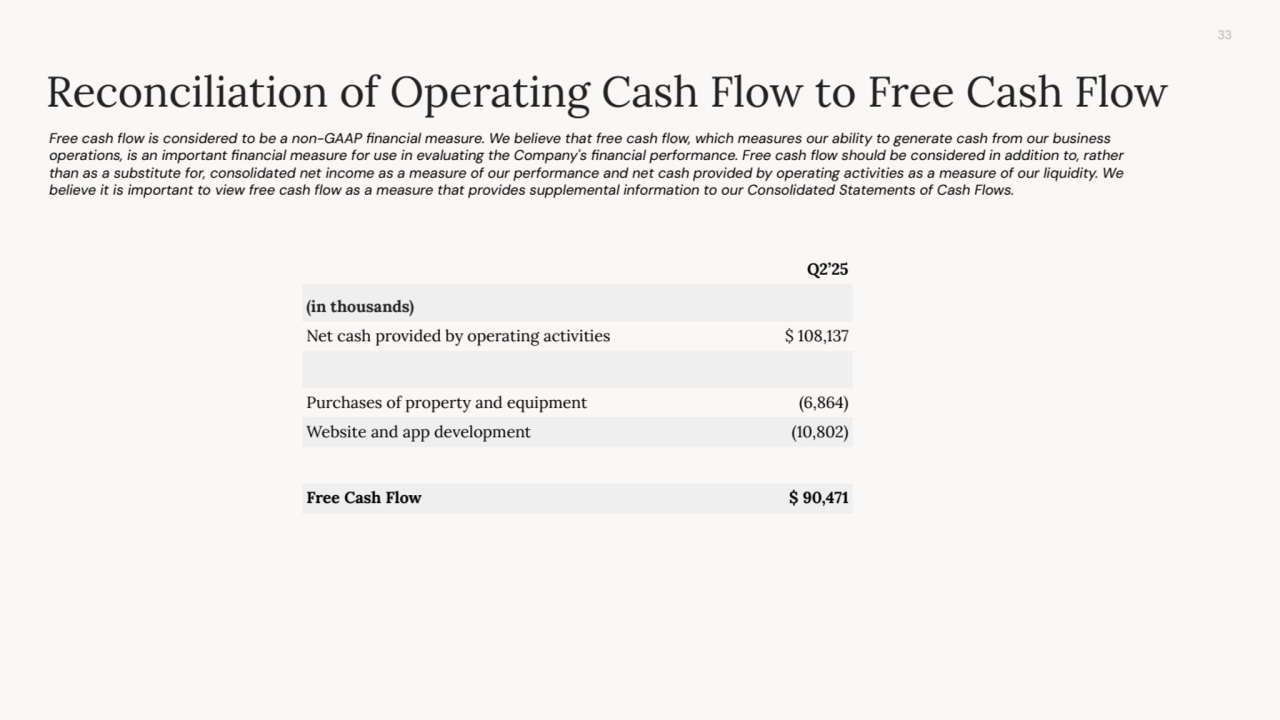
- 33. 33 Reconciliation of Operating Cash Flow to Free Cash Flow Free cash flow is considered to be a non-GAAP financial measure. We believe that free cash flow, which measures our ability to generate cash from our business operations, is an important financial measure for use in evaluating the Company's financial performance. Free cash flow should be considered in addition to, rather than as a substitute for, consolidated net income as a measure of our performance and net cash provided by operating activities as a measure of our liquidity. We believe it is important to view free cash flow as a measure that provides supplemental information to our Consolidated Statements of Cash Flows. Q2’25 (in thousands) Net cash provided by operating activities $ 108,137 Purchases of property and equipment (6,864) Website and app development (10,802) Free Cash Flow $ 90,471