FedEx Corp. Q4 2025 Earnings: Network Transformation and Fiscal Year Results
 AI Summary
Key Insights
- 📈 Financial Overview: FedEx reports Q4 and FY25 results, achieving earnings growth despite industry challenges.
- 🚚 Segment Performance: Transportation segment revenue and yield performance detailed for Federal Express and Freight.
- 🌐 Network Transformation: Advancements in Network 2.0 and European performance improvements are highlighted.
- 🎯 Strategic Priorities: Commercial priorities in healthcare, automotive, and small-medium business portfolios are outlined.
- 🔮 Future Outlook: FY26 considerations, capital allocation plans, and Q1 outlook are provided for investors.


FedEx Corp. Q4 2025 Earnings: Network Transformation and Fiscal Year Results
- 1. FedEx Corporation Fiscal Fourth Quarter 2025 Earnings June 24, 2025 2
- 2. VP of Investor Relations 3 Certain statements in this presentation may be considered forward-looking statements within the meaning of the Private Securities Litigation Reform Act, such as statements regarding expected cost savings, the optimization of our network through Network 2.0 and Tricolor, the planned tax-free spin-off of the FedEx Freight business into a new publicly traded company (the “FedEx Freight Spin-Off”), future financial targets, business strategies, management’s views with respect to future events and financial performance, and the assumptions underlying such expected cost savings, targets, strategies, and statements. Forward-looking statements include those preceded by, followed by or that include the words “will,” “may,” “could,” “would,” “should,” “believes,” “expects,” “forecasts,” “anticipates,” “plans,” “estimates,” “targets,” “projects,” “intends” or similar expressions. Such forward-looking statements are subject to risks, uncertainties and other factors which could cause actual results to differ materially from historical experience or from future results expressed or implied by such forward-looking statements. Potential risks and uncertainties include, but are not limited to, economic conditions in the global markets in which we operate; anti-trade measures and additional changes in international trade policies and relations; our ability to successfully implement our business strategies and global transformation program and network optimization initiatives, including Network 2.0 and Tricolor, effectively respond to changes in market dynamics, and achieve the anticipated benefits of such strategies and actions; our ability to achieve our cost reduction initiatives and financial performance goals; the timing and amount of any costs or benefits or any specific outcome, transaction, or change (of which there can be no assurance), or the terms, timing, and structure thereof, related to our global transformation program and other ongoing reviews and initiatives; a significant data breach or other disruption to our technology infrastructure; our ability to successfully implement the FedEx Freight Spin-Off, and achieve the anticipated benefits of such transaction; damage to our reputation or loss of brand equity; our ability to meet our labor and purchased transportation needs while controlling related costs; failure of third party service providers to perform as expected, or disruptions in our relationships with those providers or their provision of services to FedEx; the effect of any international conflicts or terrorist activities, including as a result of the current conflicts between Russia and Ukraine and in the Middle East; evolving or new U.S. domestic or international laws and government regulations, policies, and actions; changes in fuel prices or currency exchange rates, including significant increases in fuel prices as a result of the ongoing conflicts between Russia and Ukraine and in the Middle East and other geopolitical and regulatory developments; the effect of intense competition; our ability to match capacity to shifting volume levels; an increase in self-insurance accruals and expenses; failure to receive or collect expected insurance coverage; our ability to effectively operate, integrate, leverage, and grow acquired businesses and realize the anticipated benefits of acquisitions and other strategic transactions; noncash impairment charges related to our goodwill and certain deferred tax assets; the future rate of e-commerce growth; future guidance, regulations, interpretations, challenges, or judicial decisions related to our tax positions; labor-related disruptions; legal challenges or changes related to service providers contracted to conduct certain linehaul and pickup-and-delivery operations and the drivers providing services on their behalf and the coverage of U.S. employees at Federal Express Corporation under the Railway Labor Act of 1926, as amended; our ability to remove costs related to services provided to the U.S. Postal Service ("USPS") under the contract for Federal Express Corporation to provide the USPS domestic transportation services that expired in September 2024; our ability to quickly and effectively restore operations following adverse weather or a localized disaster or disturbance in a key geography; the effects of a widespread outbreak of an illness or any other communicable disease or public health crises; any liability resulting from and the costs of defending against litigation; our ability to achieve or demonstrate progress on our goal of carbon-neutral operations by 2040; and other factors which can be found in FedEx Corp.’s and its subsidiaries’ press releases and FedEx Corp.’s filings with the Securities and Exchange Commission, including our Annual Report on Form 10-K for the fiscal year ended May 31, 2024, and subsequently filed Quarterly Reports on Form 10-Q. Any forward-looking statement speaks only as of the date on which it is made. We do not undertake or assume any obligation to update or revise any forward-looking statement, whether as a result of new information, future events, or otherwise. FedEx reports its financial results in accordance with accounting principles generally accepted in the United States (“GAAP”). We have supplemented the reporting of our financial information determined in accordance with GAAP with certain non-GAAP (or “adjusted”) financial measures. Reconciliations of non-GAAP measures used in this presentation to the most directly comparable GAAP measures are included below under “Appendix.” The financial targets and outlook provided herein and discussed during this presentation assume the company’s current economic forecast and fuel price expectations, successful completion of planned stock repurchases, and no additional adverse economic, geopolitical or international trade-related developments. FedEx’s earnings per share and effective tax rate forecasts are based on current law and related regulations and guidance. This presentation should be reviewed in conjunction with our fourth quarter fiscal 2025 earnings release and webcast of the earnings presentation conference call, which are available on FedEx’s website at investors.fedex.com Forward-Looking Statements and Non-GAAP Financial Measures 4
- 3. President & CEO 5 • Grew Q4 adjusted operating income* despite an uncertain macroeconomic backdrop • Delivered on $2.2 billion of structural cost reductions through DRIVE, and as a result, achieved our two-year $4 billion DRIVE target • Advanced Network 2.0 and began optimizing larger U.S. markets • Lowered capital intensity and returned $4.3 billion in cash to stockholders • Leveraged the flexibility and responsiveness of our vast network to adapt to changing trade flows Key messages *Non-GAAP financial measure; see appendix for more information 6
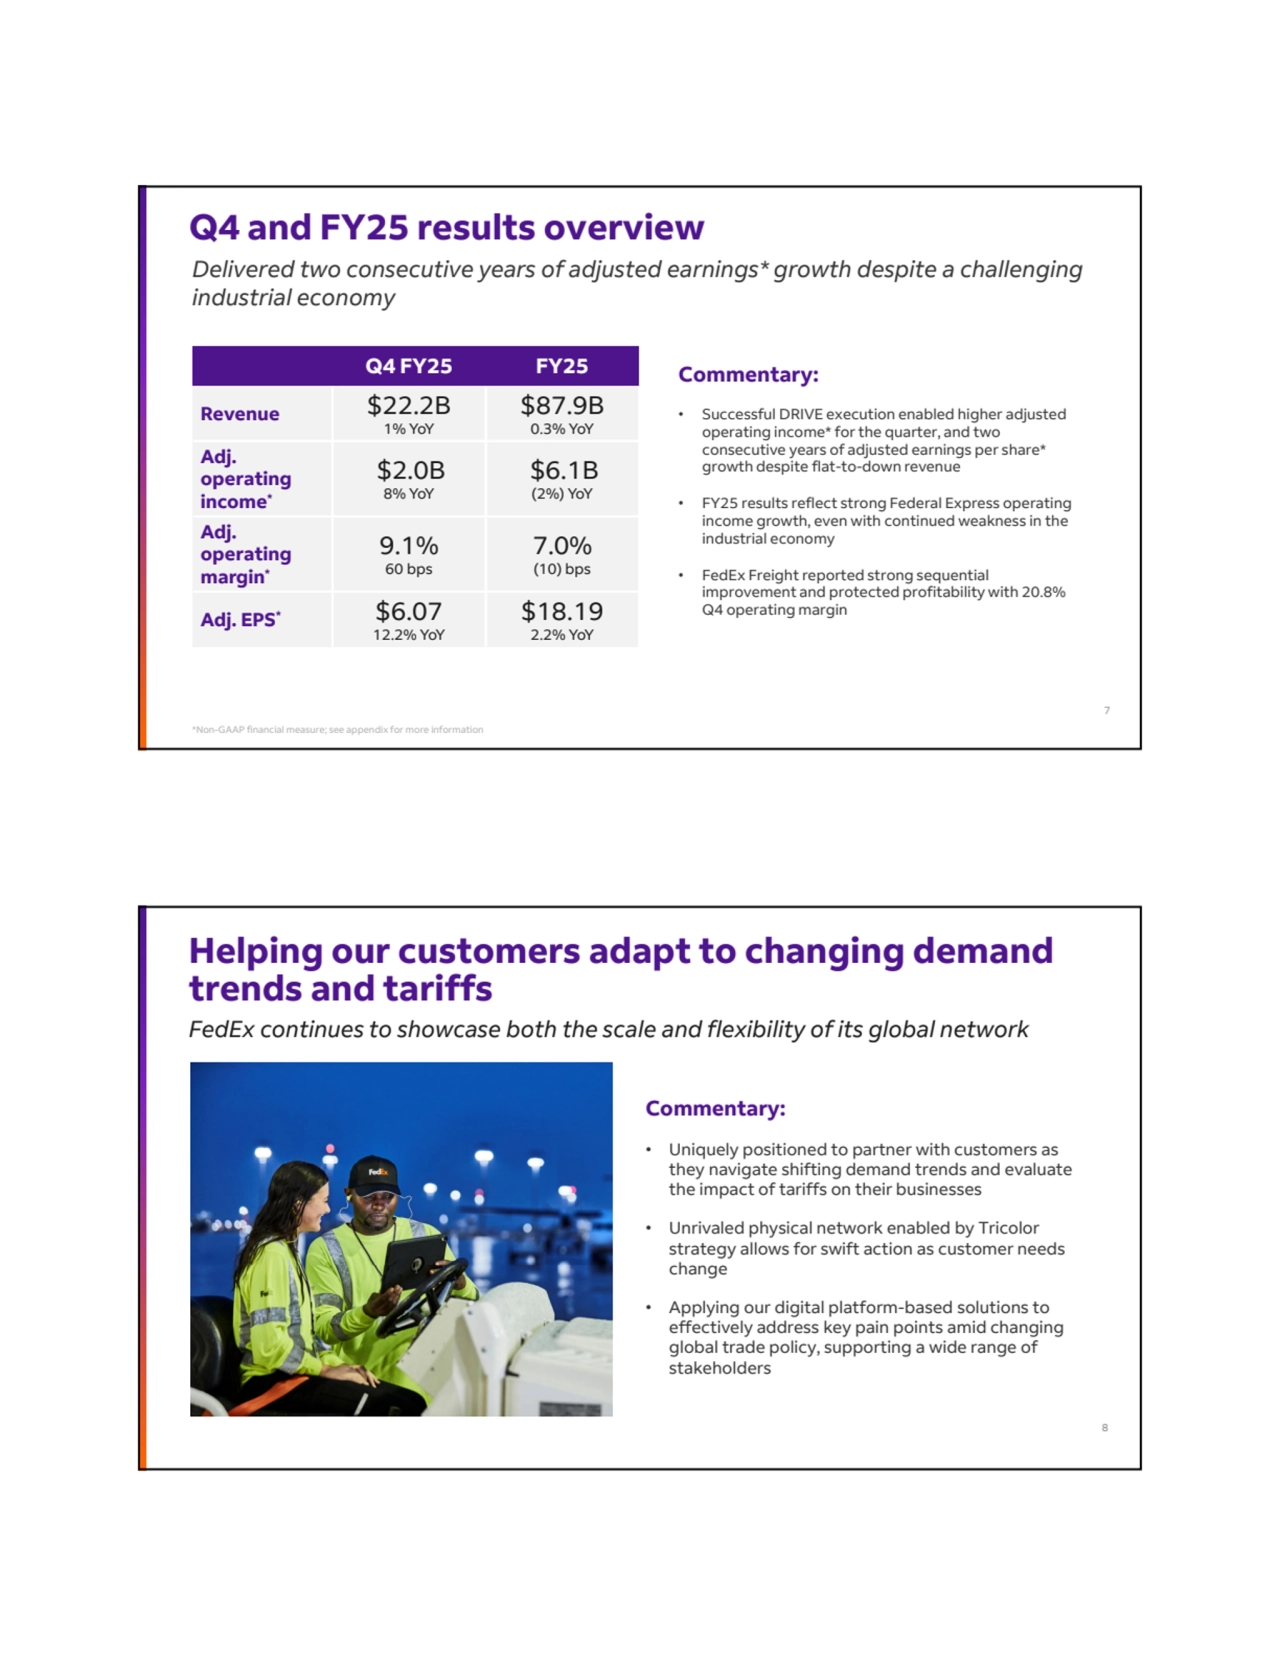
- 4. Commentary: • Successful DRIVE execution enabled higher adjusted operating income* for the quarter, and two consecutive years of adjusted earnings per share* growth despite flat-to-down revenue • FY25 results reflect strong Federal Express operating income growth, even with continued weakness in the industrial economy • FedEx Freight reported strong sequential improvement and protected profitability with 20.8% Q4 operating margin Q4 FY25 FY25 $87.9B 0.3% YoY $22.2B 1% YoY Revenue $6.1B (2%) YoY $2.0B 8% YoY Adj. operating income* 7.0% (10) bps 9.1% 60 bps Adj. operating margin* $18.19 2.2% YoY $6.07 12.2% YoY Adj. EPS* Q4 and FY25 results overview Delivered two consecutive years of adjusted earnings* growth despite a challenging industrial economy *Non-GAAP financial measure; see appendix for more information 7 Commentary: • Uniquely positioned to partner with customers as they navigate shifting demand trends and evaluate the impact of tariffs on their businesses • Unrivaled physical network enabled by Tricolor strategy allows for swift action as customer needs change • Applying our digital platform-based solutions to effectively address key pain points amid changing global trade policy, supporting a wide range of stakeholders Helping our customers adapt to changing demand trends and tariffs FedEx continues to showcase both the scale and flexibility of its global network 8
- 5. Advancing our network transformation Network 2.0 • Achieved full optimization in Canada and optimized 45 U.S. stations in Q4 • Implemented Network 2.0 in nearly 30 U.S. stations on June 1, with 33 more by end of June • Will exit June with roughly 2.5 million average daily volume flowing through Network 2.0-optimized stations Europe performance improvement • Achieved DRIVE-related savings target in Europe • Previously announced workforce reduction expected to lead to ~$150M of savings in FY27 • Better on-road productivity with sustained improvement in net service levels 9 9 10
- 6. 11 EVP & Chief Customer Officer 12
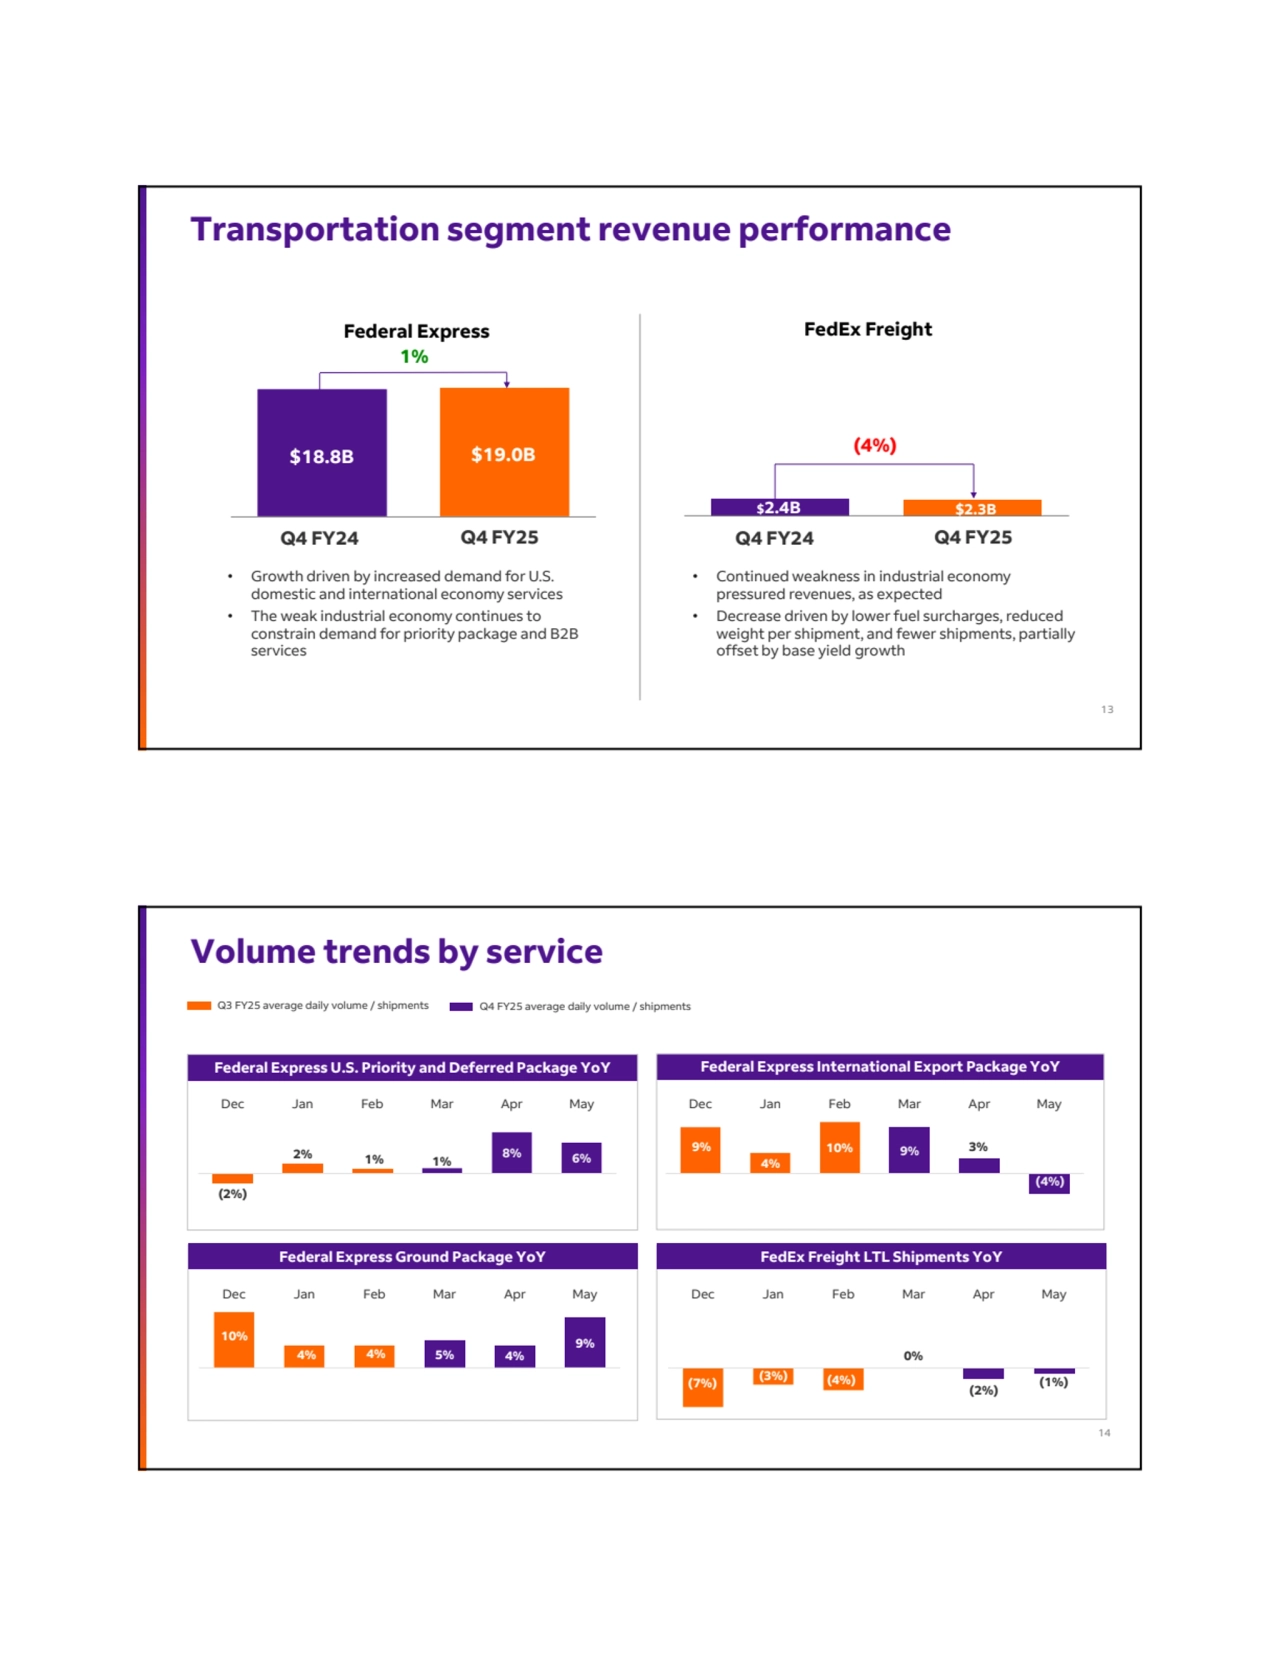
- 7. Transportation segment revenue performance Federal Express FedEx Freight • Growth driven by increased demand for U.S. domestic and international economy services • The weak industrial economy continues to constrain demand for priority package and B2B services $18.8B $19.0B Q4 FY24 1% $2.4B $2.3B (4%) Q4 FY25 Q4 FY25 Q4 FY24 • Continued weakness in industrial economy pressured revenues, as expected • Decrease driven by lower fuel surcharges, reduced weight per shipment, and fewer shipments, partially offset by base yield growth 13 Volume trends by service 10% 4% 4% 5% 4% 9% Dec Jan Feb Mar Apr May Federal Express Ground Package YoY (7%) (3%) (4%) 0% (2%) (1%) Dec Jan Feb Mar Apr May FedEx Freight LTL Shipments YoY (2%) 2% 1% 1% 8% 6% Dec Jan Feb Mar Apr May Federal Express U.S. Priority and Deferred Package YoY Federal Express International Export Package YoY Q3 FY25 average daily volume / shipments 9% 4% 10% 9% 3% (4%) Dec Jan Feb Mar Apr May Q4 FY25 average daily volume / shipments 14
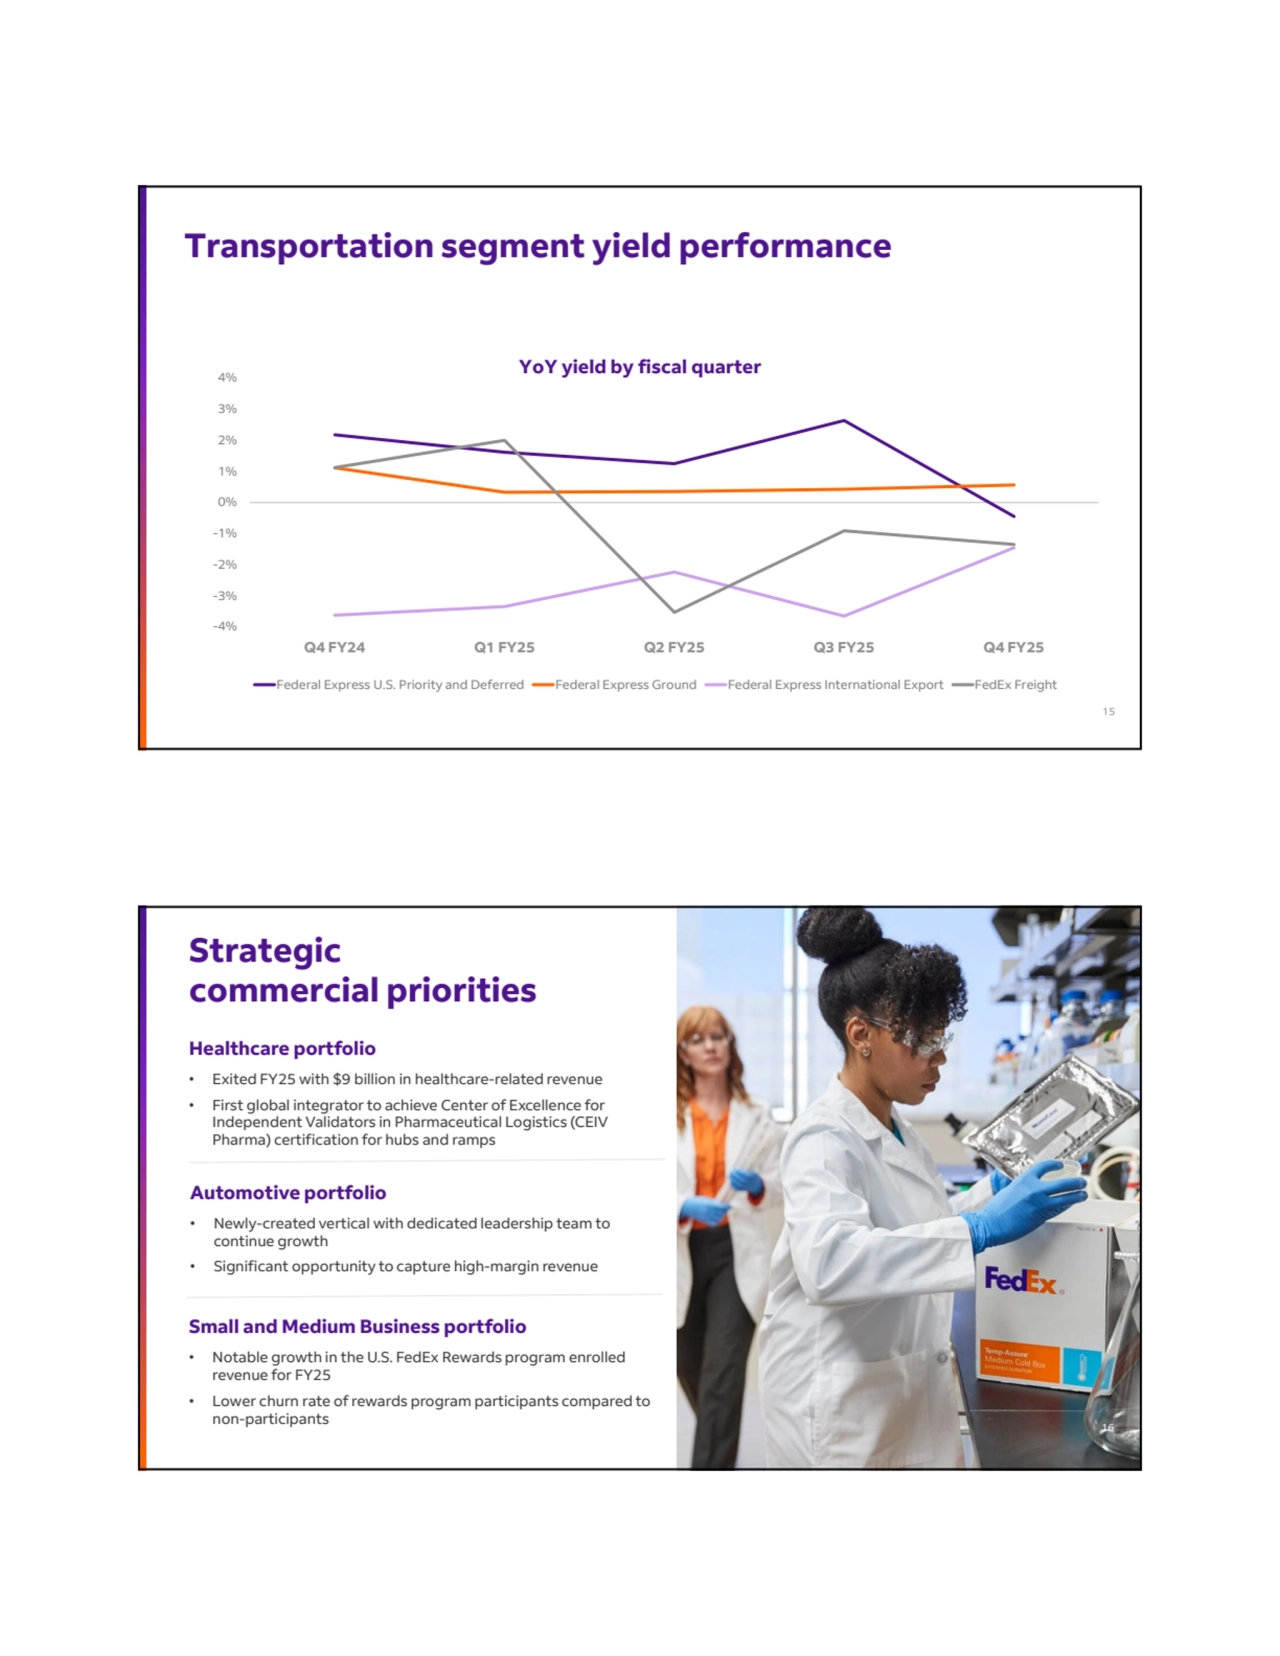
- 8. Transportation segment yield performance -4% -3% -2% -1% 0% 1% 2% 3% 4% Q4 FY24 Q1 FY25 Q2 FY25 Q3 FY25 Q4 FY25 Federal Express U.S. Priority and Deferred Federal Express Ground Federal Express International Export FedEx Freight YoY yield by fiscal quarter 15 Strategic commercial priorities Healthcare portfolio • Exited FY25 with $9 billion in healthcare-related revenue • First global integrator to achieve Center of Excellence for Independent Validators in Pharmaceutical Logistics (CEIV Pharma) certification for hubs and ramps Automotive portfolio • Newly-created vertical with dedicated leadership team to continue growth • Significant opportunity to capture high-margin revenue Small and Medium Business portfolio • Notable growth in the U.S. FedEx Rewards program enrolled revenue for FY25 • Lower churn rate of rewards program participants compared to non-participants 16
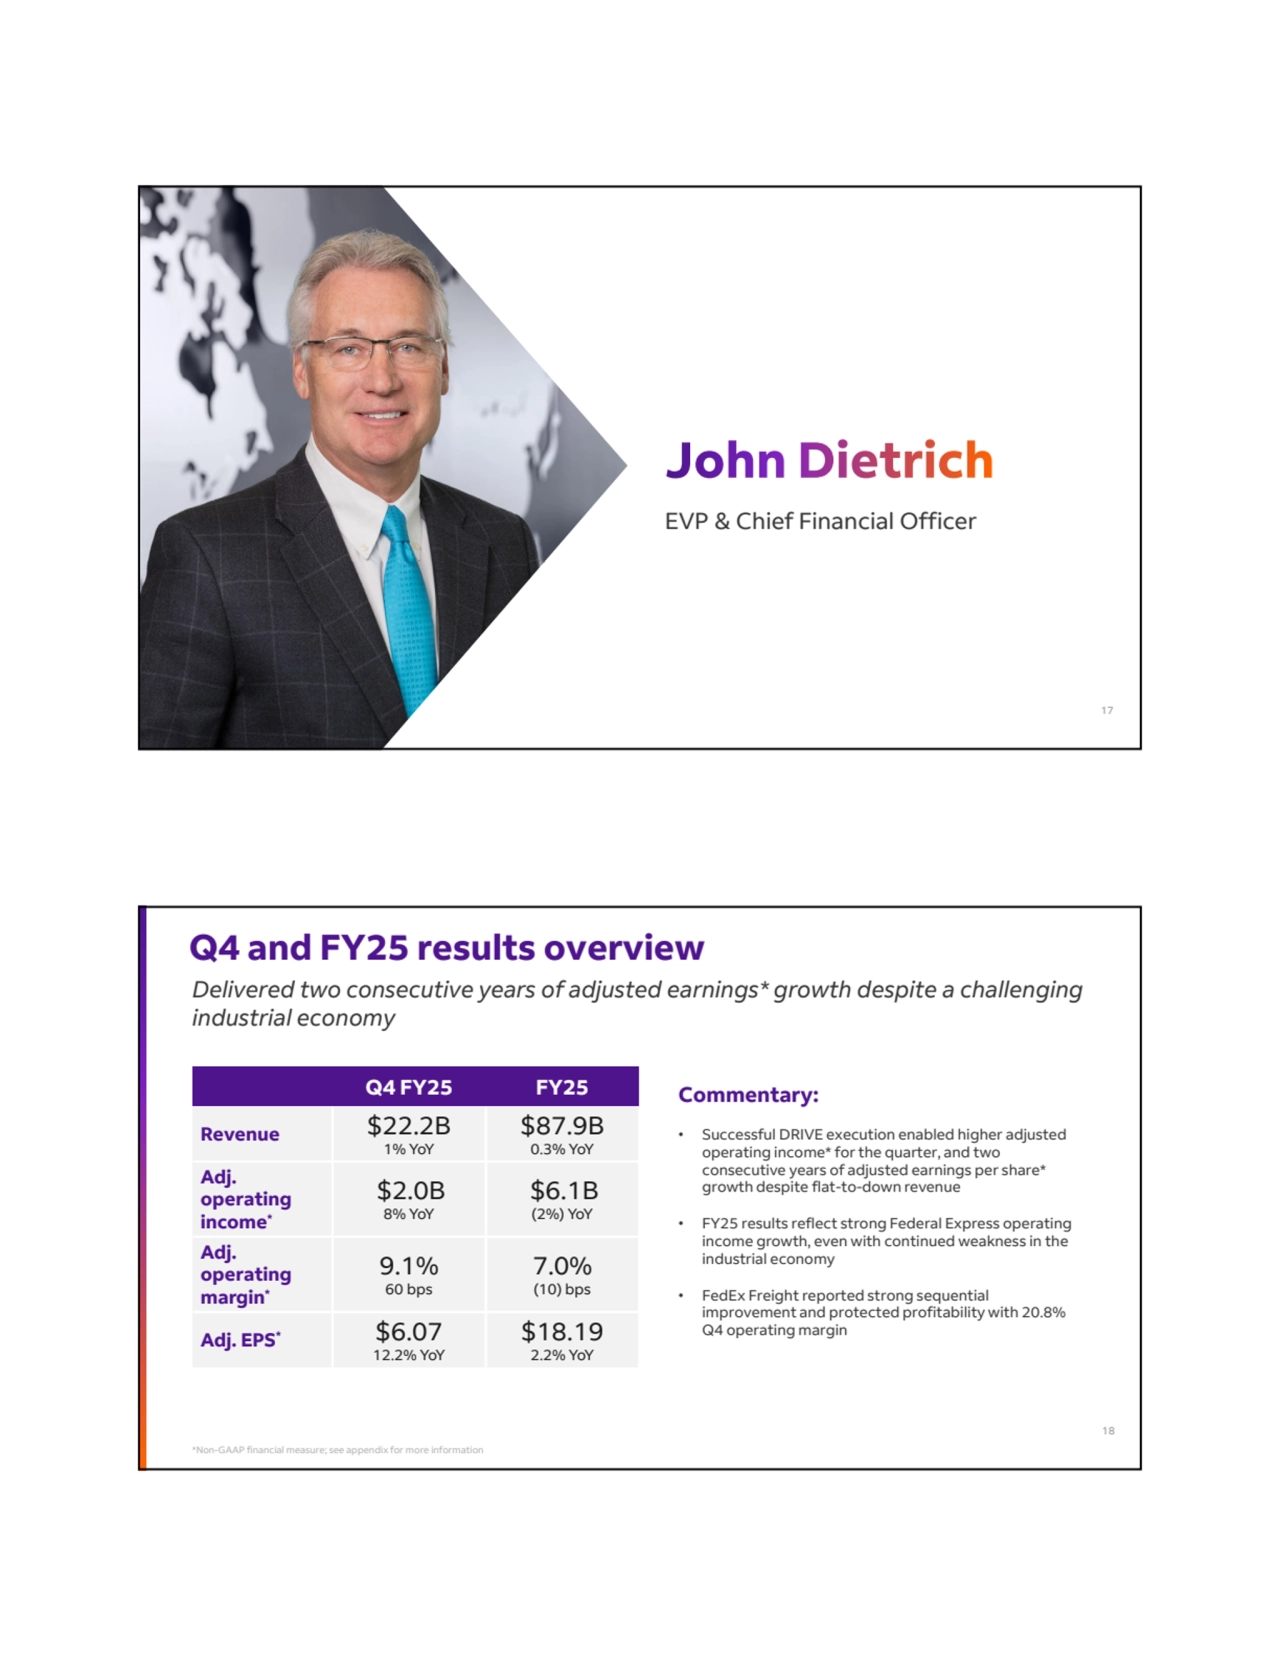
- 9. EVP & Chief Financial Officer 17 Commentary: • Successful DRIVE execution enabled higher adjusted operating income* for the quarter, and two consecutive years of adjusted earnings per share* growth despite flat-to-down revenue • FY25 results reflect strong Federal Express operating income growth, even with continued weakness in the industrial economy • FedEx Freight reported strong sequential improvement and protected profitability with 20.8% Q4 operating margin Q4 FY25 FY25 $87.9B 0.3% YoY $22.2B 1% YoY Revenue $6.1B (2%) YoY $2.0B 8% YoY Adj. operating income* 7.0% (10) bps 9.1% 60 bps Adj. operating margin* $18.19 2.2% YoY $6.07 12.2% YoY Adj. EPS* Q4 and FY25 results overview Delivered two consecutive years of adjusted earnings* growth despite a challenging industrial economy *Non-GAAP financial measure; see appendix for more information 18
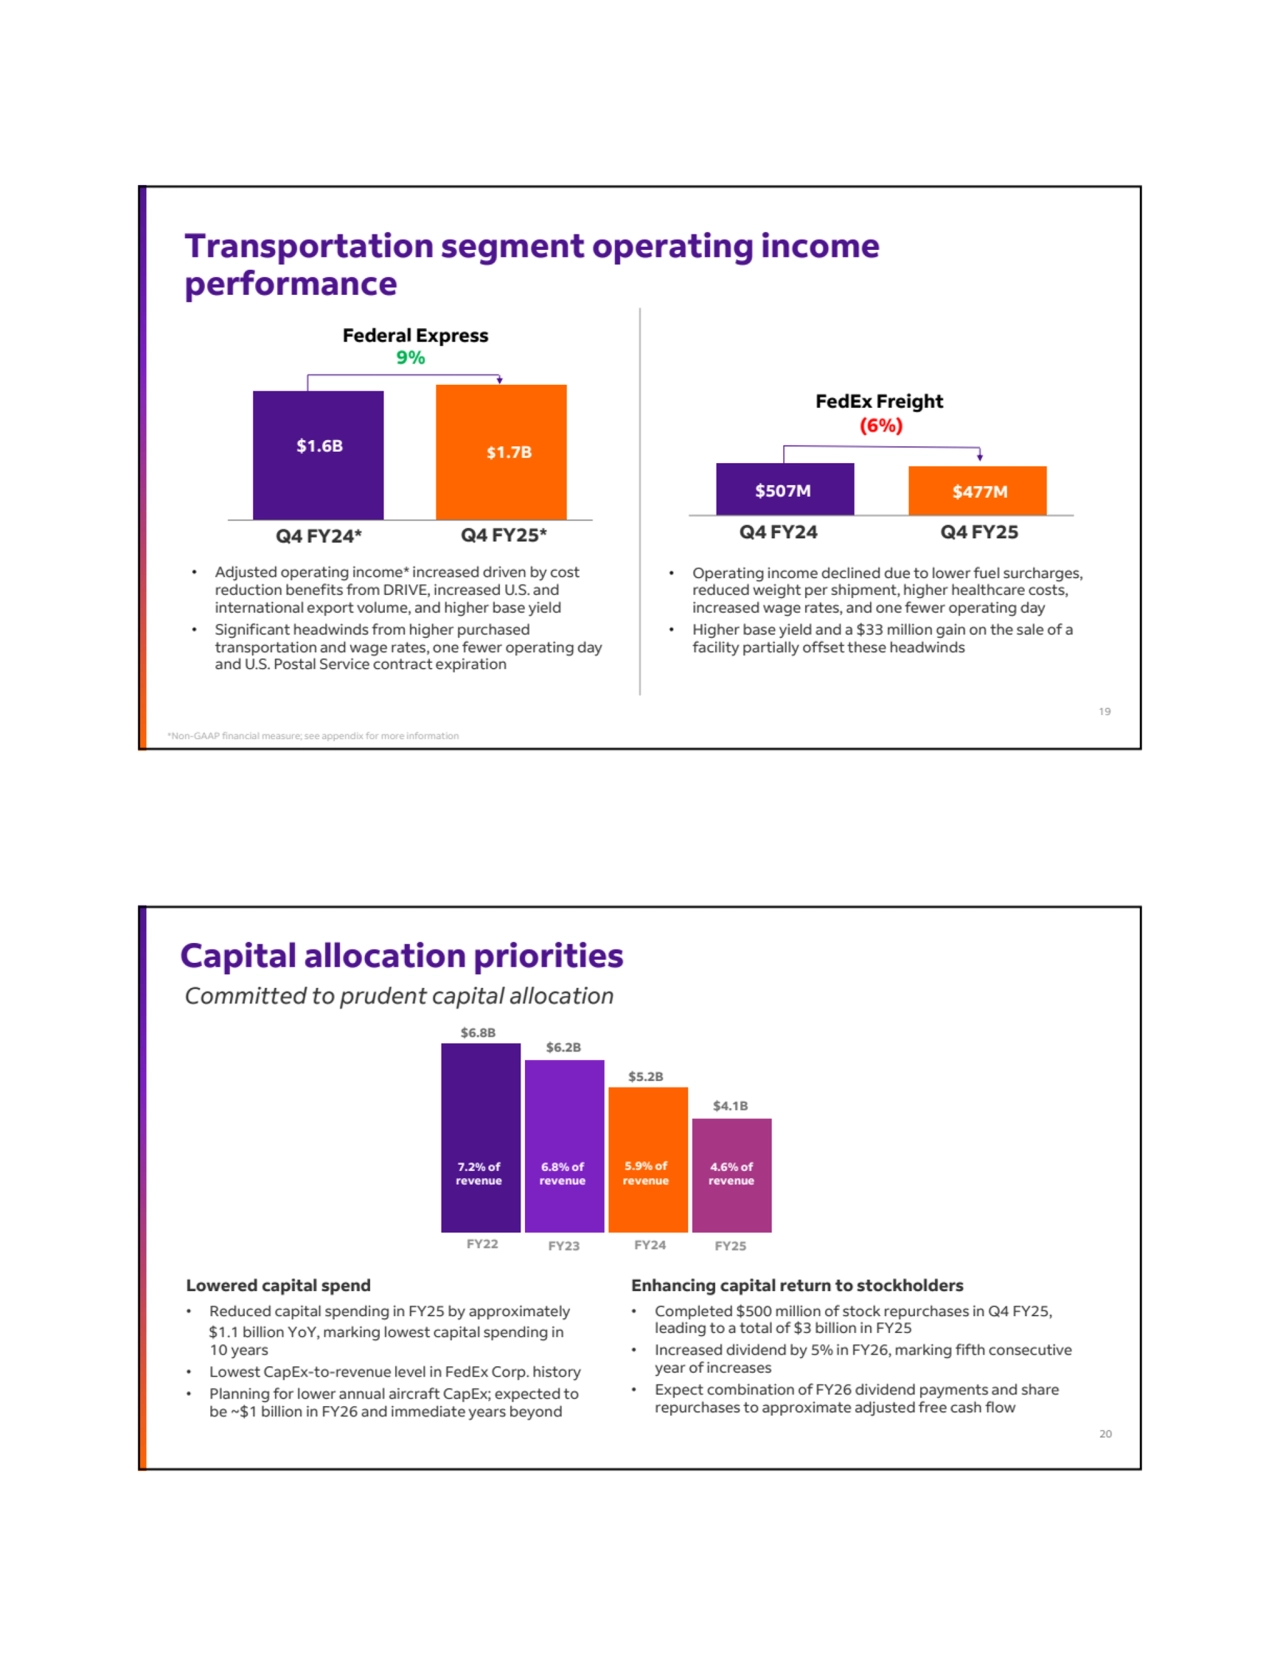
- 10. Transportation segment operating income performance *Non-GAAP financial measure; see appendix for more information Federal Express FedEx Freight • Adjusted operating income* increased driven by cost reduction benefits from DRIVE, increased U.S. and international export volume, and higher base yield • Significant headwinds from higher purchased transportation and wage rates, one fewer operating day and U.S. Postal Service contract expiration $1.6B $1.7B Q4 FY24* 9% $507M $477M (6%) • Operating income declined due to lower fuel surcharges, reduced weight per shipment, higher healthcare costs, increased wage rates, and one fewer operating day • Higher base yield and a $33 million gain on the sale of a facility partially offset these headwinds Q4 FY25* Q4 FY24 Q4 FY25 19 Capital allocation priorities Lowered capital spend • Reduced capital spending in FY25 by approximately $1.1 billion YoY, marking lowest capital spending in 10 years • Lowest CapEx-to-revenue level in FedEx Corp. history • Planning for lower annual aircraft CapEx; expected to be ~$1 billion in FY26 and immediate years beyond Enhancing capital return to stockholders • Completed $500 million of stock repurchases in Q4 FY25, leading to a total of $3 billion in FY25 • Increased dividend by 5% in FY26, marking fifth consecutive year of increases • Expect combination of FY26 dividend payments and share repurchases to approximate adjusted free cash flow Committed to prudent capital allocation 6.8% of revenue 5.9% of revenue 7.2% of revenue 4.6% of revenue FY22 FY23 FY24 FY25 $6.8B $6.2B $4.1B $5.2B 20
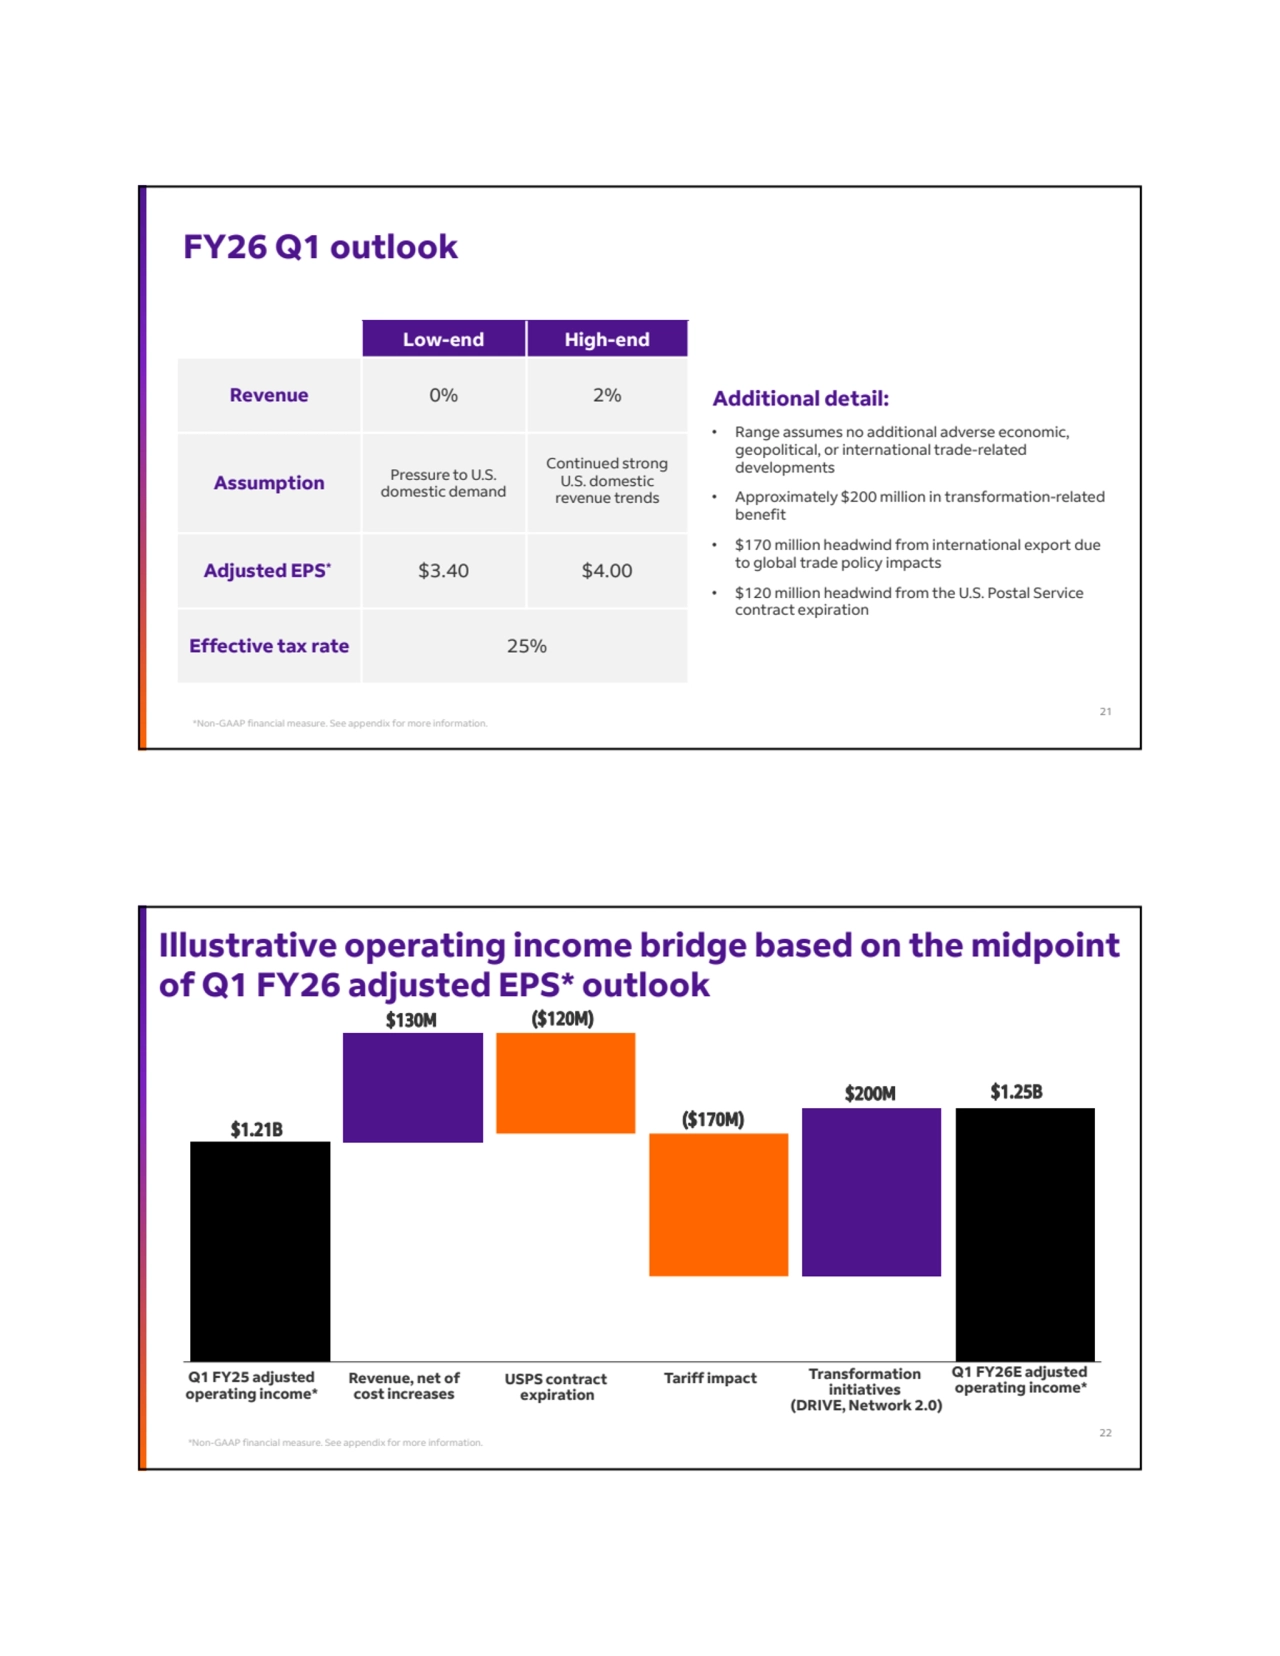
- 11. *Non-GAAP financial measure. See appendix for more information. FY26 Q1 outlook Low-end High-end Revenue 0% 2% Continued strong U.S. domestic revenue trends Pressure to U.S. domestic demand Assumption Adjusted EPS* $3.40 $4.00 Effective tax rate 25% Additional detail: • Range assumes no additional adverse economic, geopolitical, or international trade-related developments • Approximately $200 million in transformation-related benefit • $170 million headwind from international export due to global trade policy impacts • $120 million headwind from the U.S. Postal Service contract expiration 21 Illustrative operating income bridge based on the midpoint of Q1 FY26 adjusted EPS* outlook Q1 FY25 adjusted operating income* Revenue, net of cost increases USPS contract expiration Tariff impact Transformation initiatives (DRIVE, Network 2.0) Q1 FY26E adjusted operating income* $130M $200M ($120M) ($170M) $1.21B $1.25B *Non-GAAP financial measure. See appendix for more information. 22
- 12. FY26 considerations • Expect $1 billion in transformation tailwinds from DRIVE and Network 2.0 • U.S. Postal Service contract expiration will be a headwind for first four months • Significant revenue net of cost improvement is contingent upon improving demand and pricing environment • Will resume full-year outlook once more clarity is gained around global trade policy and demand environment 23 Enterprise updates FedEx Freight separation on track • Expect to spin-off Freight in June 2026 Capital market days • FedEx Corporation investor day to be held in early calendar year 2026 in Memphis • FedEx Freight investor day to be held in Spring 2026 Network 2.0 progress • Significant value creation opportunities remain, as Network 2.0 represents $2 billion benefit by the end of FY27 from our physical parcel network integration and one FedEx associated savings 24
- 13. Q&A 25 Q&A 25 Appendix 26
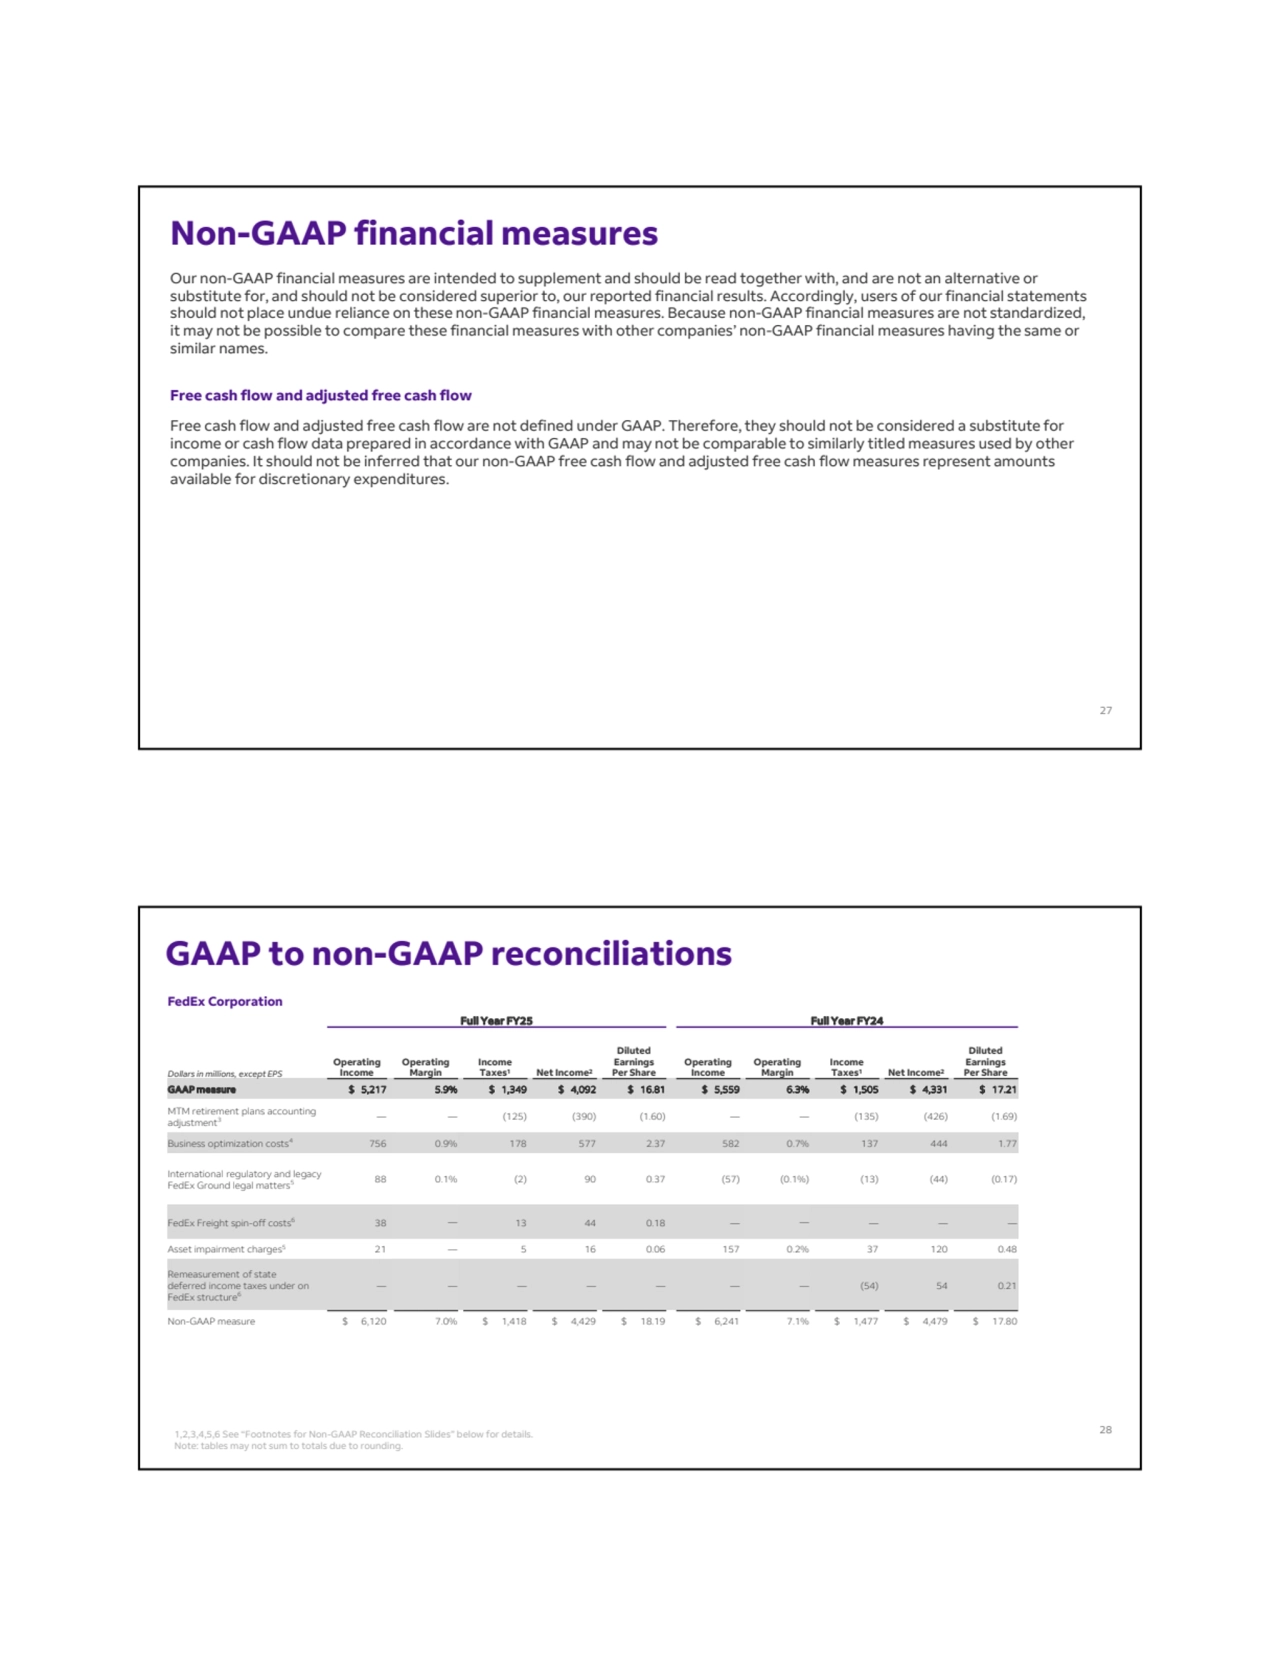
- 14. Non-GAAP financial measures Our non-GAAP financial measures are intended to supplement and should be read together with, and are not an alternative or substitute for, and should not be considered superior to, our reported financial results. Accordingly, users of our financial statements should not place undue reliance on these non-GAAP financial measures. Because non-GAAP financial measures are not standardized, it may not be possible to compare these financial measures with other companies’ non-GAAP financial measures having the same or similar names. Free cash flow and adjusted free cash flow Free cash flow and adjusted free cash flow are not defined under GAAP. Therefore, they should not be considered a substitute for income or cash flow data prepared in accordance with GAAP and may not be comparable to similarly titled measures used by other companies. It should not be inferred that our non-GAAP free cash flow and adjusted free cash flow measures represent amounts available for discretionary expenditures. 27 1,2,3,4,5,6 See “Footnotes for Non-GAAP Reconciliation Slides” below for details. Note: tables may not sum to totals due to rounding. GAAP to non-GAAP reconciliations FedEx Corporation Full Year FY25 Full Year FY24 Diluted Earnings Net Income2 Per Share Income Taxes1 Operating Margin Operating Income Diluted Earnings Net Income2 Per Share Income Taxes1 Operating Margin Operating Dollars in millions, except EPS Income GAAP measure $ 5,217 5.9% $ 1,349 $ 4,092 $ 16.81 $ 5,559 6.3% $ 1,505 $ 4,331 $ 17.21 — — (125) (390) (1.60) — — (135) (426) (1.69) MTM retirement plans accounting adjustment3 Business optimization costs 756 0.9% 178 577 2.37 582 0.7% 137 444 1.77 4 88 0.1% (2) 90 0.37 (57) (0.1%) (13) (44) (0.17) International regulatory and legacy FedEx Ground legal matters5 FedEx Freight spin-off costs6 38 — 13 44 0.18 — — — — — Asset impairment charges 21 — 5 16 0.06 157 0.2% 37 120 0.48 5 — — — — — — — (54) 54 0.21 Remeasurement of state deferred income taxes under on FedEx structure6 Non-GAAP measure $ 6,120 7.0% $ 1,418 $ 4,429 $ 18.19 $ 6,241 7.1% $ 1,477 $ 4,479 $ 17.80 28
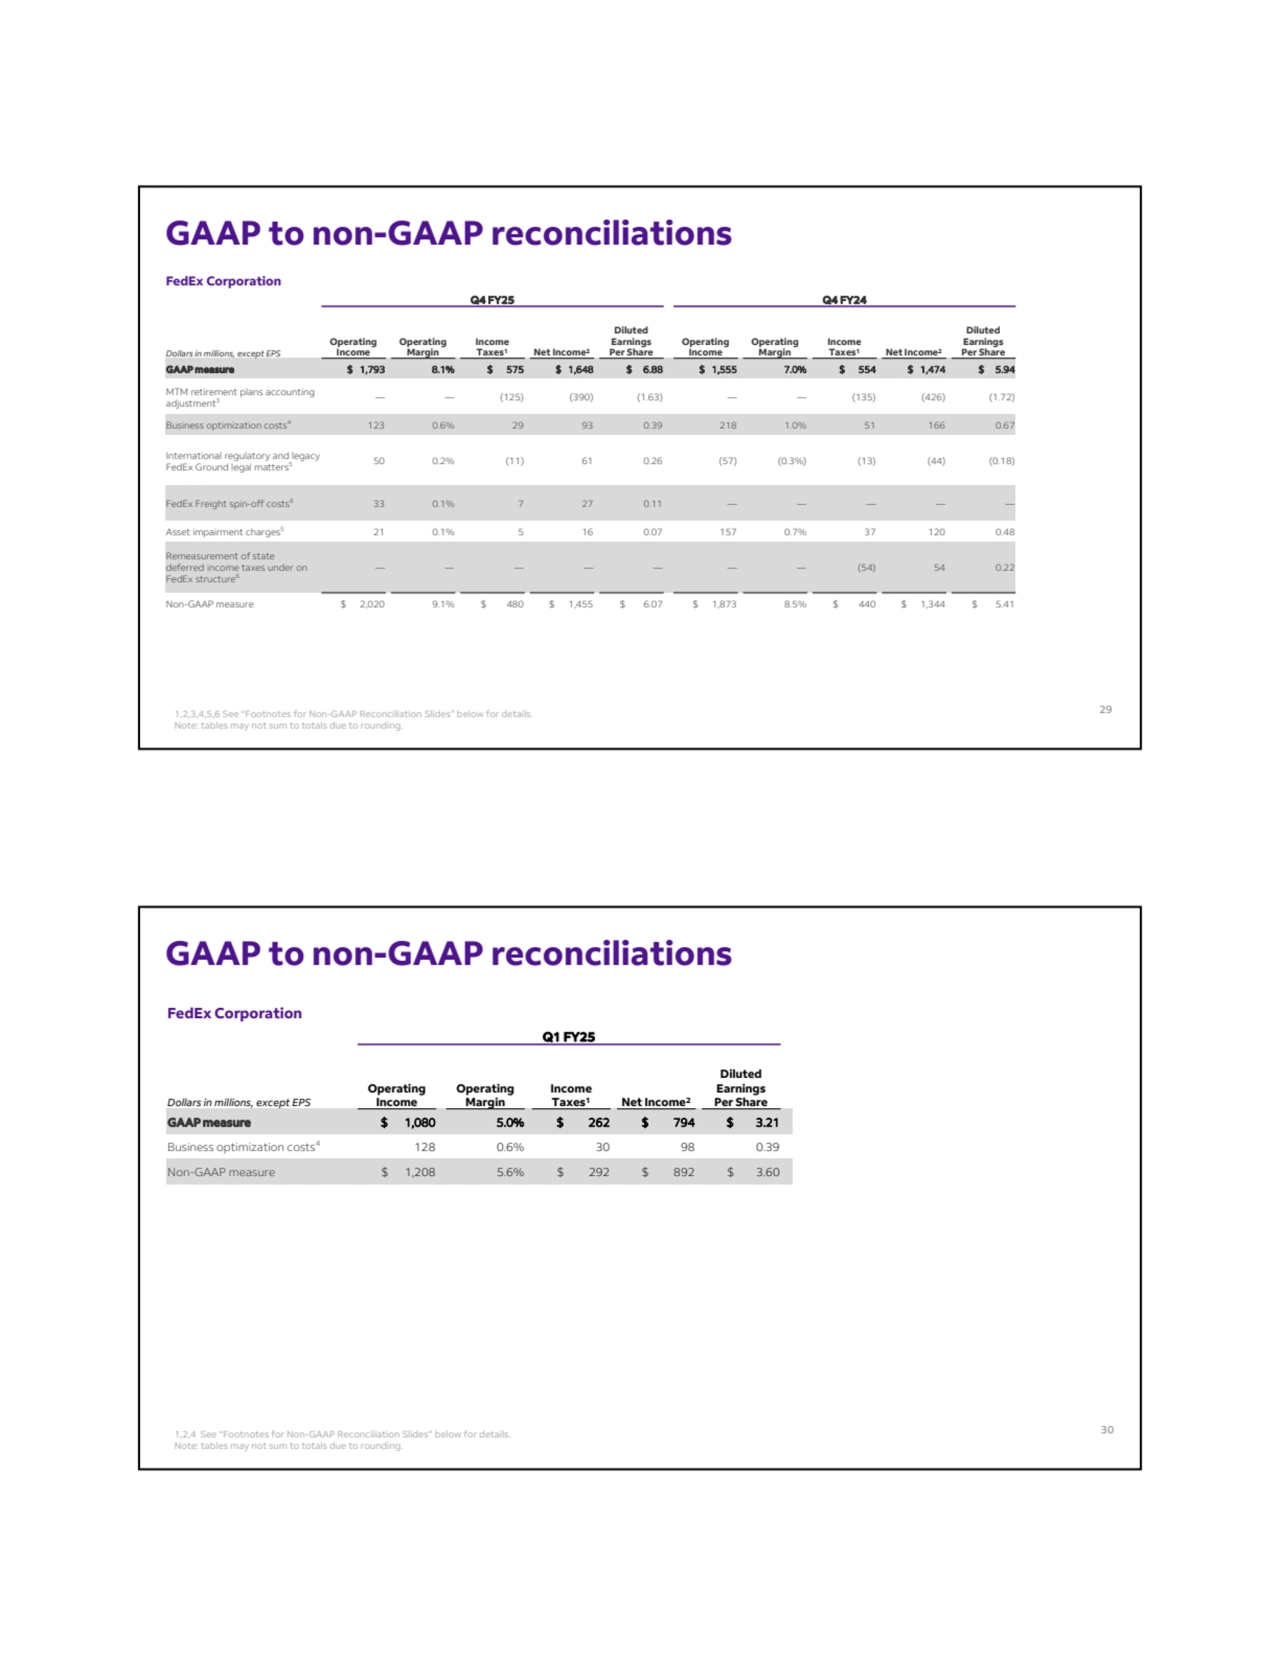
- 15. GAAP to non-GAAP reconciliations FedEx Corporation Q4 FY25 Q4 FY24 Diluted Earnings Net Income2 Per Share Income Taxes1 Operating Margin Operating Income Diluted Earnings Net Income2 Per Share Income Taxes1 Operating Margin Operating Dollars in millions, except EPS Income GAAP measure $ 1,793 8.1% $ 575 $ 1,648 $ 6.88 $ 1,555 7.0% $ 554 $ 1,474 $ 5.94 — — (125) (390) (1.63) — — (135) (426) (1.72) MTM retirement plans accounting adjustment3 Business optimization costs 123 0.6% 29 93 0.39 218 1.0% 51 166 0.67 4 50 0.2% (11) 61 0.26 (57) (0.3%) (13) (44) (0.18) International regulatory and legacy FedEx Ground legal matters5 FedEx Freight spin-off costs6 33 0.1% 7 27 0.11 — — — — — Asset impairment charges 21 0.1% 5 16 0.07 157 0.7% 37 120 0.48 5 — — — — — — — (54) 54 0.22 Remeasurement of state deferred income taxes under on FedEx structure6 Non-GAAP measure $ 2,020 9.1% $ 480 $ 1,455 $ 6.07 $ 1,873 8.5% $ 440 $ 1,344 $ 5.41 1,2,3,4,5,6 See “Footnotes for Non-GAAP Reconciliation Slides” below for details. Note: tables may not sum to totals due to rounding. 29 GAAP to non-GAAP reconciliations 1,2,4 See “Footnotes for Non-GAAP Reconciliation Slides” below for details. Note: tables may not sum to totals due to rounding. FedEx Corporation Q1 FY25 Diluted Earnings Net Income2 Per Share Income Taxes1 Operating Margin Operating Dollars in millions, except EPS Income GAAP measure $ 1,080 5.0% $ 262 $ 794 $ 3.21 Business optimization costs 128 0.6% 30 98 0.39 4 Non-GAAP measure $ 1,208 5.6% $ 292 $ 892 $ 3.60 30
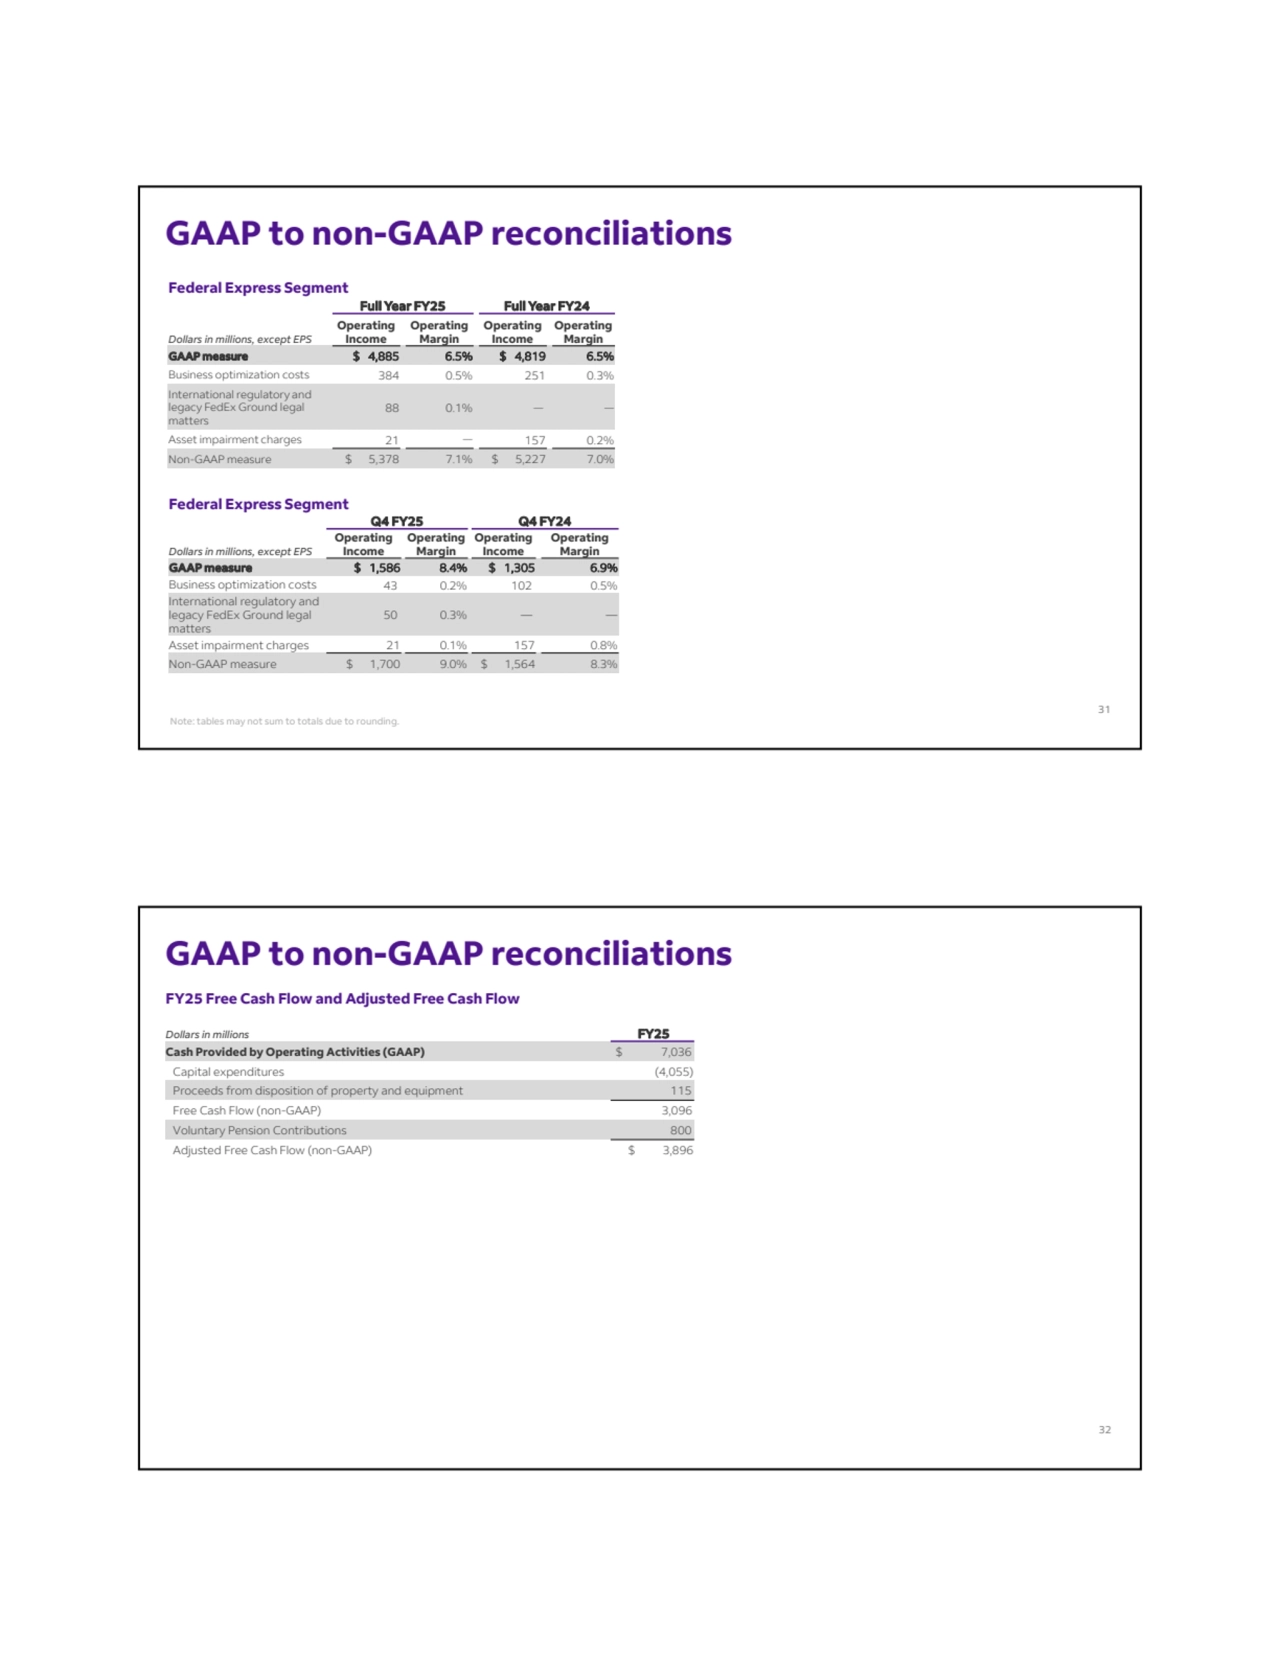
- 16. GAAP to non-GAAP reconciliations Federal Express Segment Full Year FY25 Full Year FY24 Operating Margin Operating Income Operating Margin Operating Dollars in millions, except EPS Income GAAP measure $ 4,885 6.5% $ 4,819 6.5% Business optimization costs 384 0.5% 251 0.3% 88 0.1% — — International regulatory and legacy FedEx Ground legal matters Asset impairment charges 21 — 157 0.2% Non-GAAP measure $ 5,378 7.1% $ 5,227 7.0% Federal Express Segment Q4 FY25 Q4 FY24 Operating Margin Operating Income Operating Margin Operating Dollars in millions, except EPS Income GAAP measure $ 1,586 8.4% $ 1,305 6.9% Business optimization costs 43 0.2% 102 0.5% 50 0.3% — — International regulatory and legacy FedEx Ground legal matters Asset impairment charges 21 0.1% 157 0.8% Non-GAAP measure $ 1,700 9.0% $ 1,564 8.3% Note: tables may not sum to totals due to rounding. 31 GAAP to non-GAAP reconciliations FY25 Free Cash Flow and Adjusted Free Cash Flow Dollars in millions FY25 Cash Provided by Operating Activities (GAAP) $ 7,036 Capital expenditures (4,055) Proceeds from disposition of property and equipment 115 Free Cash Flow (non-GAAP) 3,096 Voluntary Pension Contributions 800 Adjusted Free Cash Flow (non-GAAP) $ 3,896 32
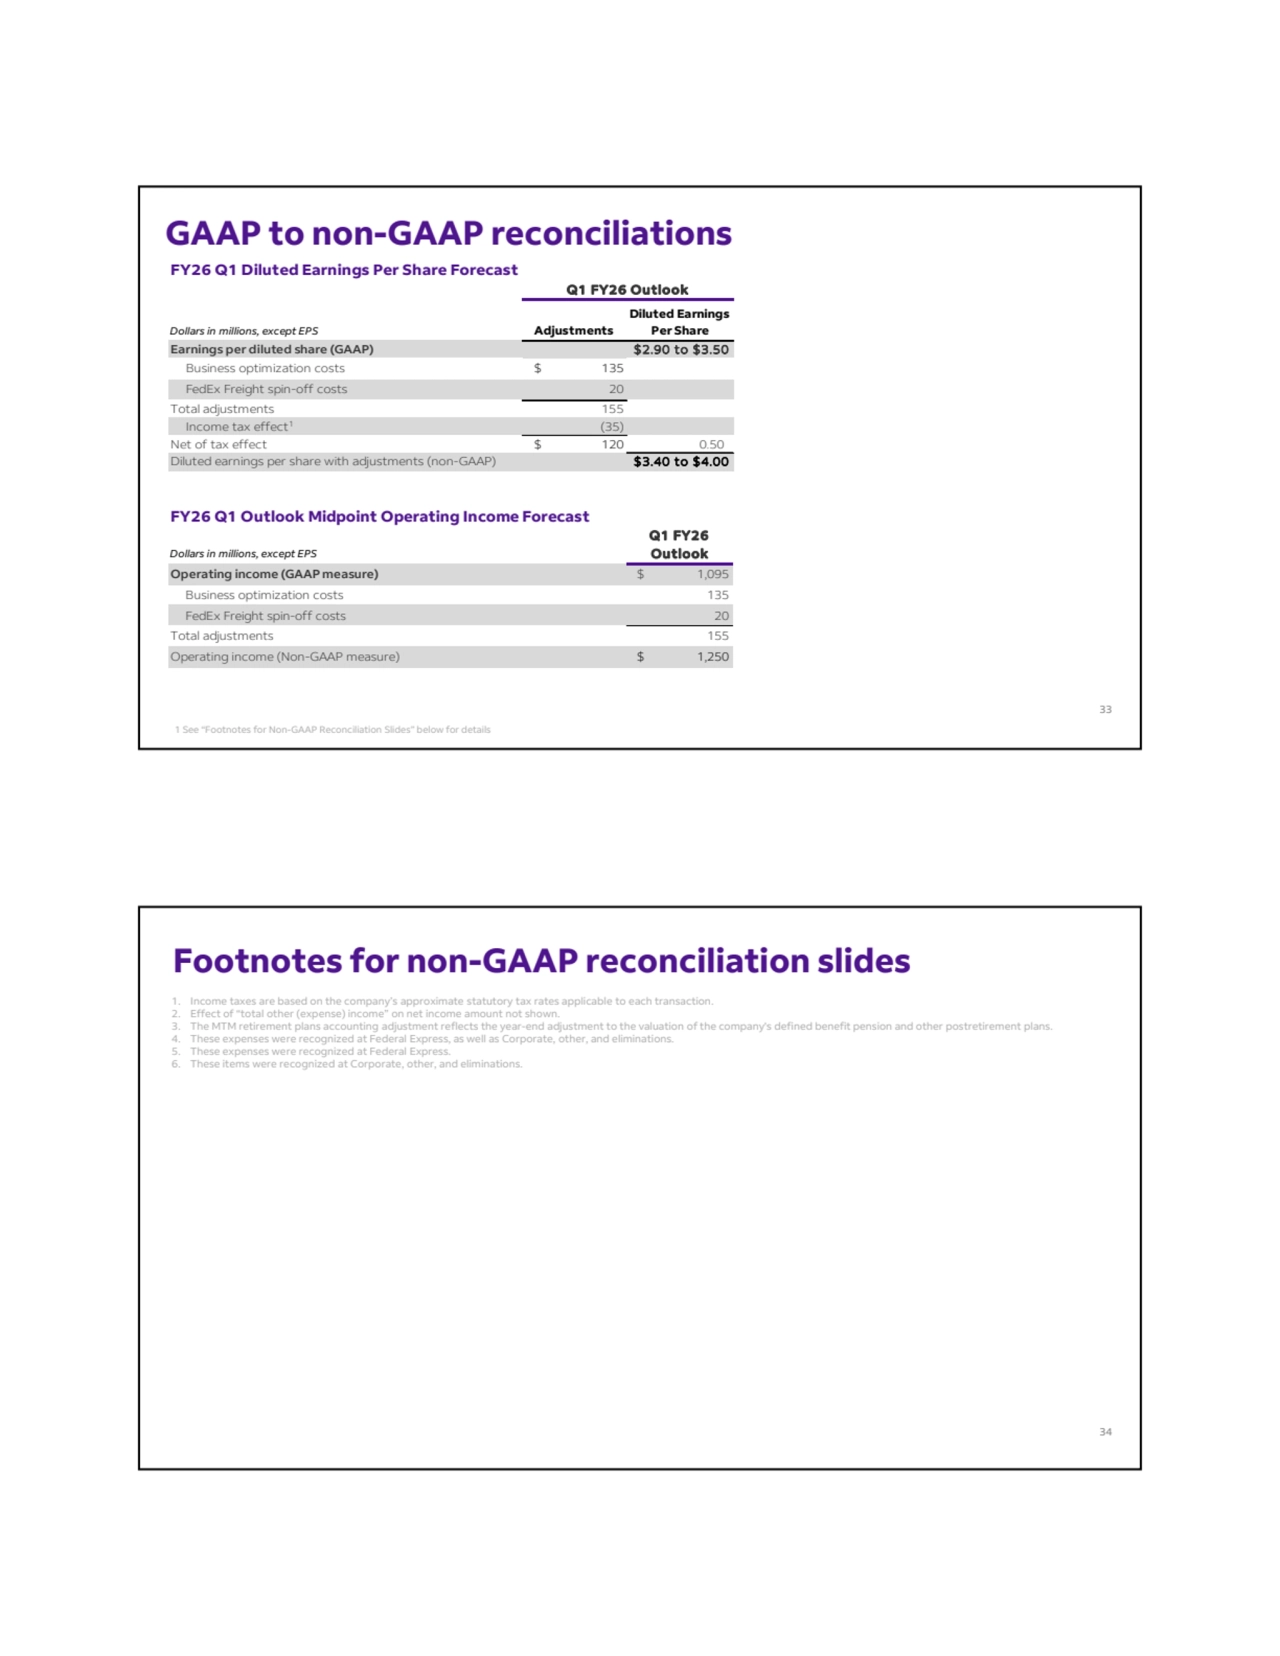
- 17. 1 See “Footnotes for Non-GAAP Reconciliation Slides” below for details GAAP to non-GAAP reconciliations FY26 Q1 Diluted Earnings Per Share Forecast Dollars in millions, except EPS Adjustments Diluted Earnings Per Share Earnings per diluted share (GAAP) $2.90 to $3.50 Business optimization costs $ 135 FedEx Freight spin-off costs 20 Total adjustments 155 Income tax effect1 (35) Net of tax effect $ 120 0.50 Diluted earnings per share with adjustments (non-GAAP) $3.40 to $4.00 Q1 FY26 Outlook FY26 Q1 Outlook Midpoint Operating Income Forecast Dollars in millions, except EPS Operating income (GAAP measure) $ 1,095 Business optimization costs 135 FedEx Freight spin-off costs 20 Total adjustments 155 Operating income (Non-GAAP measure) $ 1,250 Q1 FY26 Outlook 33 Footnotes for non-GAAP reconciliation slides 1. Income taxes are based on the company’s approximate statutory tax rates applicable to each transaction. 2. Effect of “total other (expense) income” on net income amount not shown. 3. The MTM retirement plans accounting adjustment reflects the year-end adjustment to the valuation of the company's defined benefit pension and other postretirement plans. 4. These expenses were recognized at Federal Express, as well as Corporate, other, and eliminations. 5. These expenses were recognized at Federal Express. 6. These items were recognized at Corporate, other, and eliminations. 34