Icahn Enterprises L.P. Q2 2025 Earnings Presentation
 AI Summary
Key Insights
- 📉 Financial Results: IEP reports a Q2 2025 net loss of $165 million, an improvement from the $331 million loss in Q2 2024.
- 💰 Adjusted EBITDA: Adjusted EBITDA loss decreases to $43 million in Q2 2025 from $155 million in Q2 2024.
- 📊 Net Asset Value: The indicative net asset value reaches approximately $3.3 billion by June 30, 2025.
- ⛽ Energy Segment: CVR Energy's consolidated Adjusted EBITDA saw a significant drop of $127 million compared to last year.
- 🚗 Automotive Segment: The Automotive segment sees lower sales, revenues, and a decrease in adjusted EBITDA.
Icahn Enterprises L.P. Q2 2025 Earnings Presentation
- 1. Icahn Enterprises L.P. Q2 2025 Earnings Presentation August 4, 2025 1
- 2. Forward-Looking Statements and Non-GAAP Financial Measures The Private Securities Litigation Reform Act of 1995 provides a "safe harbor" for forward-looking statements we make in this presentation, including statements regarding our future performance and plans for our businesses and potential acquisitions. Forward-looking statements may be identified by words such as “believes,” "expects," “potential,” “continues,” “may,” “should,” “seeks,” “predicts,” “anticipates,” “intends,” “projects,” “estimates,” “plans,” “could,” “designed,” “should be” or words of similar meaning and include, but are not limited to, statements about the expected future business and financial performance of Icahn Enterprises L.P. and its subsidiaries. Actual events, results and outcomes may differ materially from our expectations due to a variety of known and unknown risks, uncertainties and other factors that are discussed in our filings with the Securities and Exchange Commission, including economic, competitive, legal and other factors, including interest rate increases; the impacts from the Russia/Ukraine conflict and the conflict in the Middle East, including economic volatility and the impacts of export controls and other economic sanctions, and political and regulatory uncertainty, including changing economic policy and the imposition of tariffs. Accordingly, there is no assurance that our expectations will be realized. We assume no obligation to update or revise any forward-looking statements should circumstances change, except as otherwise required by law. This presentation also includes certain non-GAAP financial measures. A reconciliation of such non-GAAP financial measures to the most directly comparable GAAP financial measures can be found in the back of this presentation. 2 Safe Harbor Statement
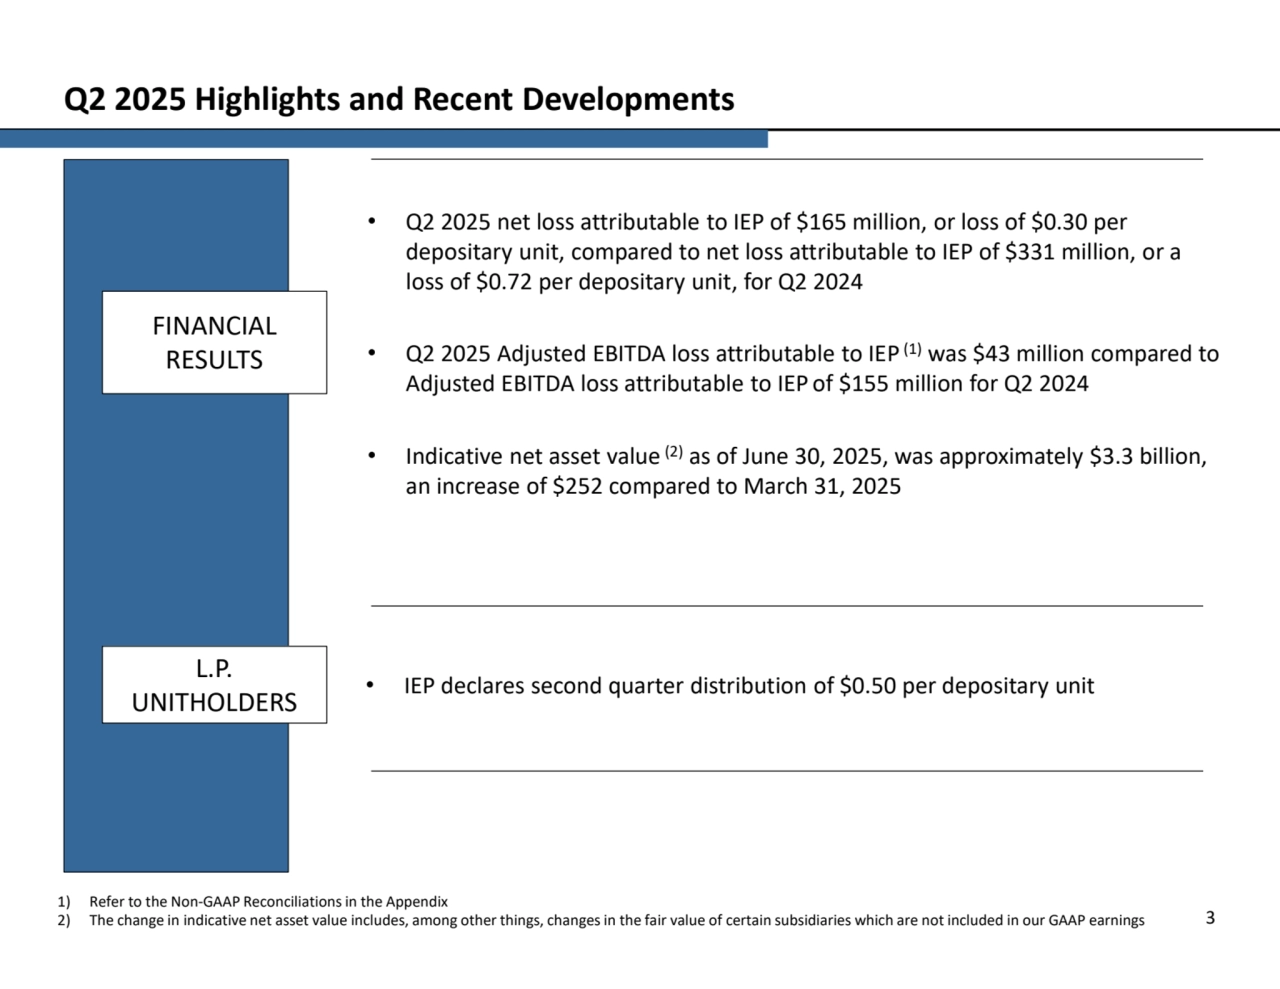
- 3. • Q2 2025 net loss attributable to IEP of $165 million, or loss of $0.30 per depositary unit, compared to net loss attributable to IEP of $331 million, or a loss of $0.72 per depositary unit, for Q2 2024 • Q2 2025 Adjusted EBITDA loss attributable to IEP (1) was $43 million compared to Adjusted EBITDA loss attributable to IEP of $155 million for Q2 2024 • Indicative net asset value (2) as of June 30, 2025, was approximately $3.3 billion, an increase of $252 compared to March 31, 2025 3 Q2 2025 Highlights and Recent Developments 1) Refer to the Non-GAAP Reconciliations in the Appendix 2) The change in indicative net asset value includes, among other things, changes in the fair value of certain subsidiaries which are not included in our GAAP earnings FINANCIAL RESULTS L.P. UNITHOLDERS • IEP declares second quarter distribution of $0.50 per depositary unit
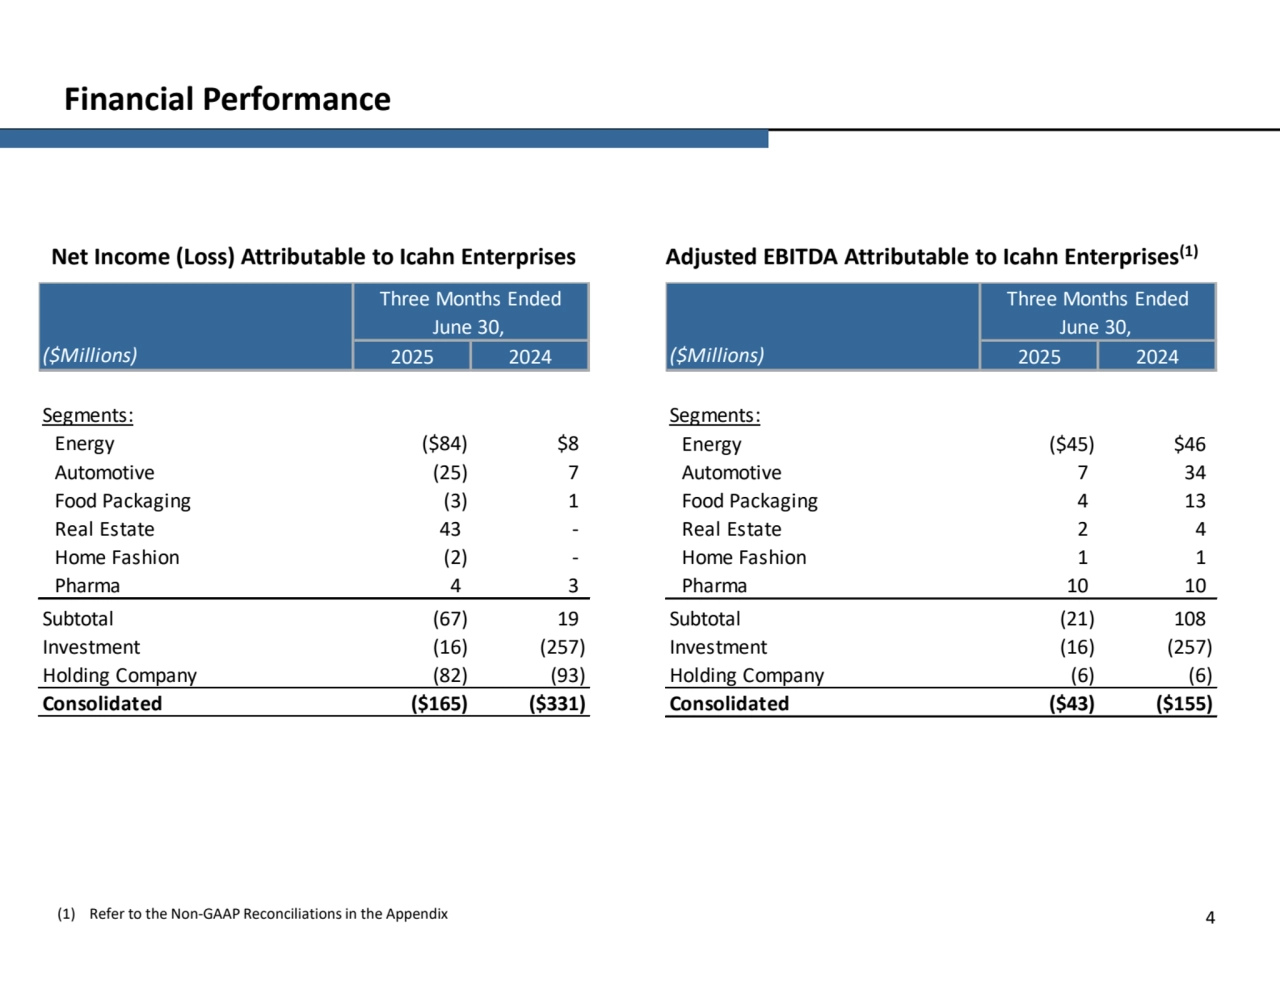
- 4. 4 Financial Performance Adjusted EBITDA Attributable to Icahn Enterprises Net Income (Loss) Attributable to Icahn Enterprises (1) (1) Refer to the Non-GAAP Reconciliations in the Appendix ($Millions) Segments: Energy Automotive Food Packaging Real Estate Home Fashion Pharma Subtotal Investment Holding Company Consolidated 2025 2024 ($84) $8 (25) 7 Three Months Ended June 30, 4 3 (3) 1 43 - (2) - ($165) ($331) (16) (257) (82) (93) (67) 19 ($Millions) Segments: Energy Automotive Food Packaging Real Estate Home Fashion Pharma Subtotal Investment Holding Company Consolidated 7 34 4 13 2 Three Months Ended June 30, 2025 2024 ($45) $46 4 1 1 10 10 ($43) ($155) (21) 108 (16) (257) (6) (6)
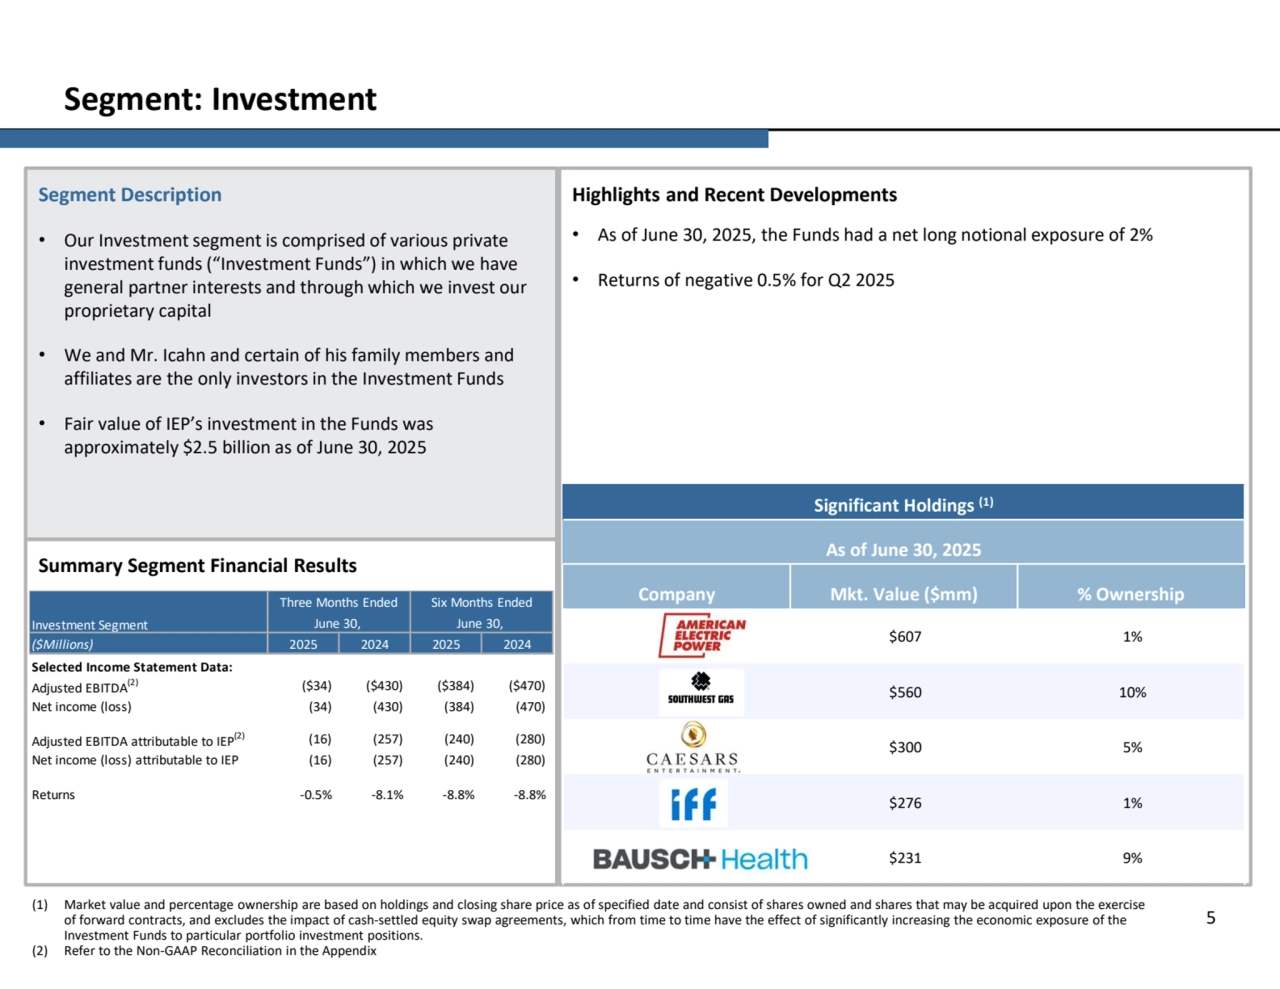
- 5. Segment: Investment Segment Description • Our Investment segment is comprised of various private investment funds (“Investment Funds”) in which we have general partner interests and through which we invest our proprietary capital • We and Mr. Icahn and certain of his family members and affiliates are the only investors in the Investment Funds • Fair value of IEP’s investment in the Funds was approximately $2.5 billion as of June 30, 2025 Highlights and Recent Developments • As of June 30, 2025, the Funds had a net long notional exposure of 2% • Returns of negative 0.5% for Q2 2025 Summary Segment Financial Results (1) Market value and percentage ownership are based on holdings and closing share price as of specified date and consist of shares owned and shares that may be acquired upon the exercise of forward contracts, and excludes the impact of cash-settled equity swap agreements, which from time to time have the effect of significantly increasing the economic exposure of the Investment Funds to particular portfolio investment positions. (2) Refer to the Non-GAAP Reconciliation in the Appendix 5 Significant Holdings (1) As of June 30, 2025 Company Mkt. Value ($mm) % Ownership $607 1% $560 10% $300 5% $276 1% $231 9% ($Millions) Selected Income Statement Data: Adjusted EBITDA(2) ($34) ($430) ($384) ($470) Net income (loss) (34) (430) (384) (470) Adjusted EBITDA attributable to IEP(2) (16) (257) (240) (280) Net income (loss) attributable to IEP (16) (257) (240) (280) Returns -0.5% -8.1% -8.8% -8.8% Investment Segment Three Months Ended Six Months Ended June 30, June 30, 2025 2024 2025 2024
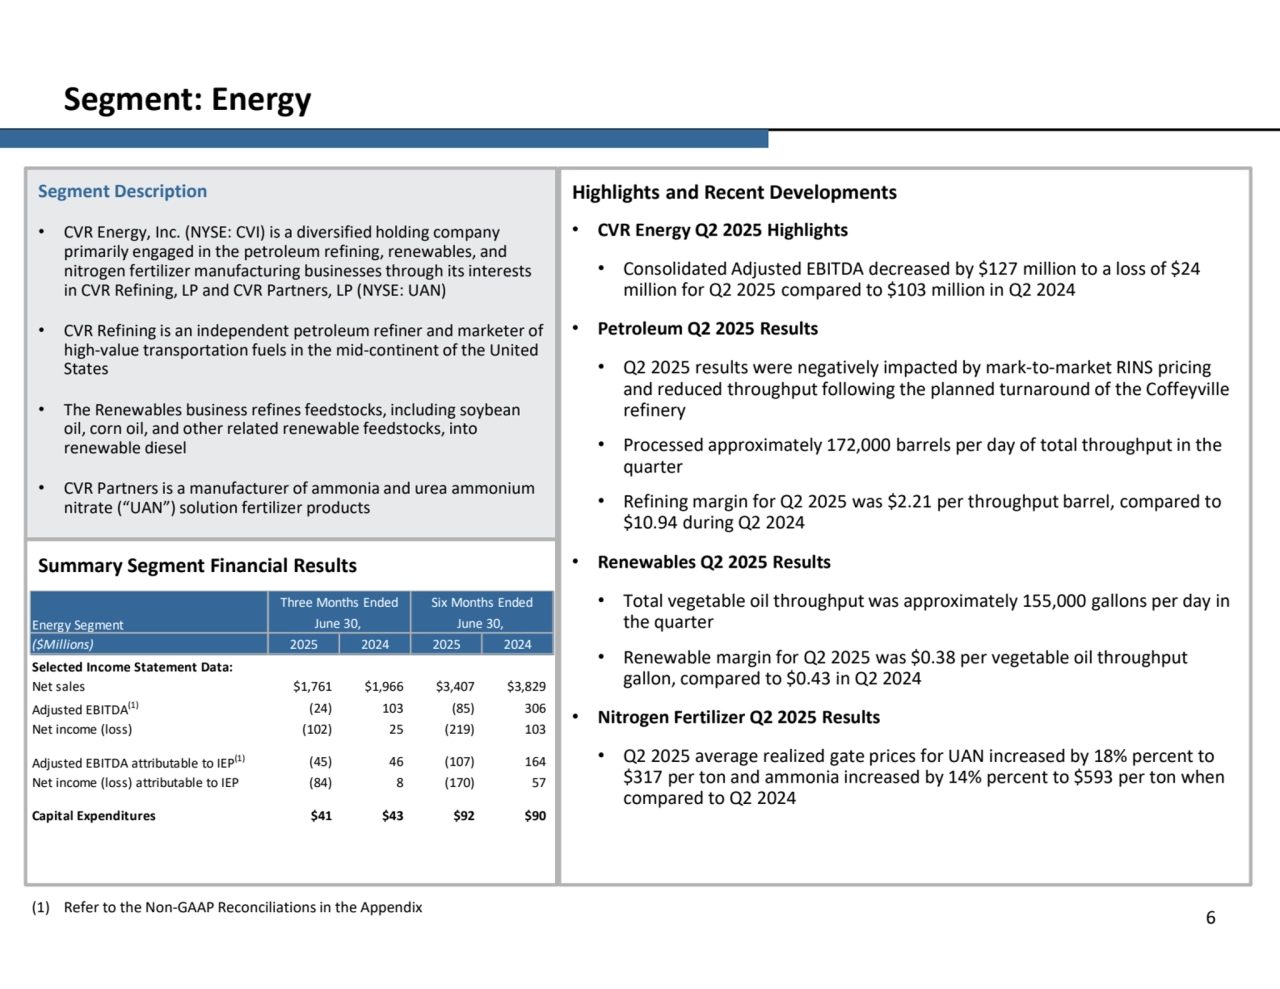
- 6. Segment: Energy Segment Description • CVR Energy, Inc. (NYSE: CVI) is a diversified holding company primarily engaged in the petroleum refining, renewables, and nitrogen fertilizer manufacturing businesses through its interests in CVR Refining, LP and CVR Partners, LP (NYSE: UAN) • CVR Refining is an independent petroleum refiner and marketer of high-value transportation fuels in the mid-continent of the United States • The Renewables business refines feedstocks, including soybean oil, corn oil, and other related renewable feedstocks, into renewable diesel • CVR Partners is a manufacturer of ammonia and urea ammonium nitrate (“UAN”) solution fertilizer products Highlights and Recent Developments • CVR Energy Q2 2025 Highlights • Consolidated Adjusted EBITDA decreased by $127 million to a loss of $24 million for Q2 2025 compared to $103 million in Q2 2024 • Petroleum Q2 2025 Results • Q2 2025 results were negatively impacted by mark-to-market RINS pricing and reduced throughput following the planned turnaround of the Coffeyville refinery • Processed approximately 172,000 barrels per day of total throughput in the quarter • Refining margin for Q2 2025 was $2.21 per throughput barrel, compared to $10.94 during Q2 2024 • Renewables Q2 2025 Results • Total vegetable oil throughput was approximately 155,000 gallons per day in the quarter • Renewable margin for Q2 2025 was $0.38 per vegetable oil throughput gallon, compared to $0.43 in Q2 2024 • Nitrogen Fertilizer Q2 2025 Results • Q2 2025 average realized gate prices for UAN increased by 18% percent to $317 per ton and ammonia increased by 14% percent to $593 per ton when compared to Q2 2024 Summary Segment Financial Results (1) Refer to the Non-GAAP Reconciliations in the Appendix 6 ($Millions) Selected Income Statement Data: Net sales $1,761 $1,966 $3,407 $3,829 Adjusted EBITDA(1) (24) 103 (85) 306 Net income (loss) (102) 25 (219) 103 Adjusted EBITDA attributable to IEP(1) (45) 46 (107) 164 Net income (loss) attributable to IEP (84) 8 (170) 57 Capital Expenditures $41 $43 $92 $90 Energy Segment Three Months Ended Six Months Ended June 30, June 30, 2025 2024 2025 2024
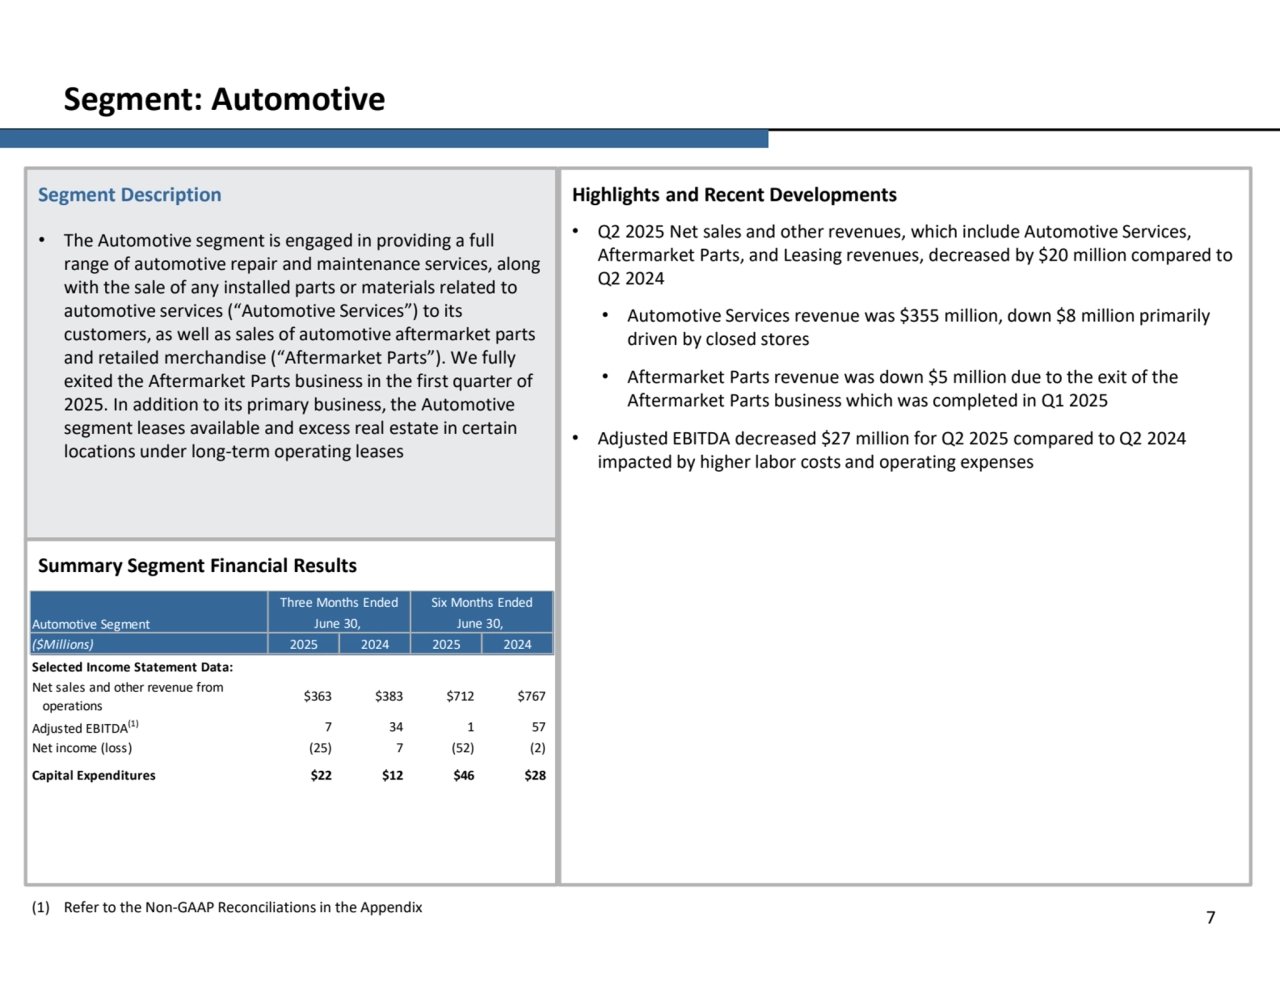
- 7. Segment: Automotive Segment Description • The Automotive segment is engaged in providing a full range of automotive repair and maintenance services, along with the sale of any installed parts or materials related to automotive services (“Automotive Services”) to its customers, as well as sales of automotive aftermarket parts and retailed merchandise (“Aftermarket Parts”). We fully exited the Aftermarket Parts business in the first quarter of 2025. In addition to its primary business, the Automotive segment leases available and excess real estate in certain locations under long-term operating leases Highlights and Recent Developments • Q2 2025 Net sales and other revenues, which include Automotive Services, Aftermarket Parts, and Leasing revenues, decreased by $20 million compared to Q2 2024 • Automotive Services revenue was $355 million, down $8 million primarily driven by closed stores • Aftermarket Parts revenue was down $5 million due to the exit of the Aftermarket Parts business which was completed in Q1 2025 • Adjusted EBITDA decreased $27 million for Q2 2025 compared to Q2 2024 impacted by higher labor costs and operating expenses Summary Segment Financial Results (1) Refer to the Non-GAAP Reconciliations in the Appendix 7 ($Millions) Selected Income Statement Data: Net sales and other revenue from operations $363 $383 $712 $767 Adjusted EBITDA(1) 7 34 1 57 Net income (loss) (25) 7 (52) (2) Capital Expenditures $22 $12 $46 $28 Automotive Segment Three Months Ended Six Months Ended June 30, June 30, 2025 2024 2025 2024
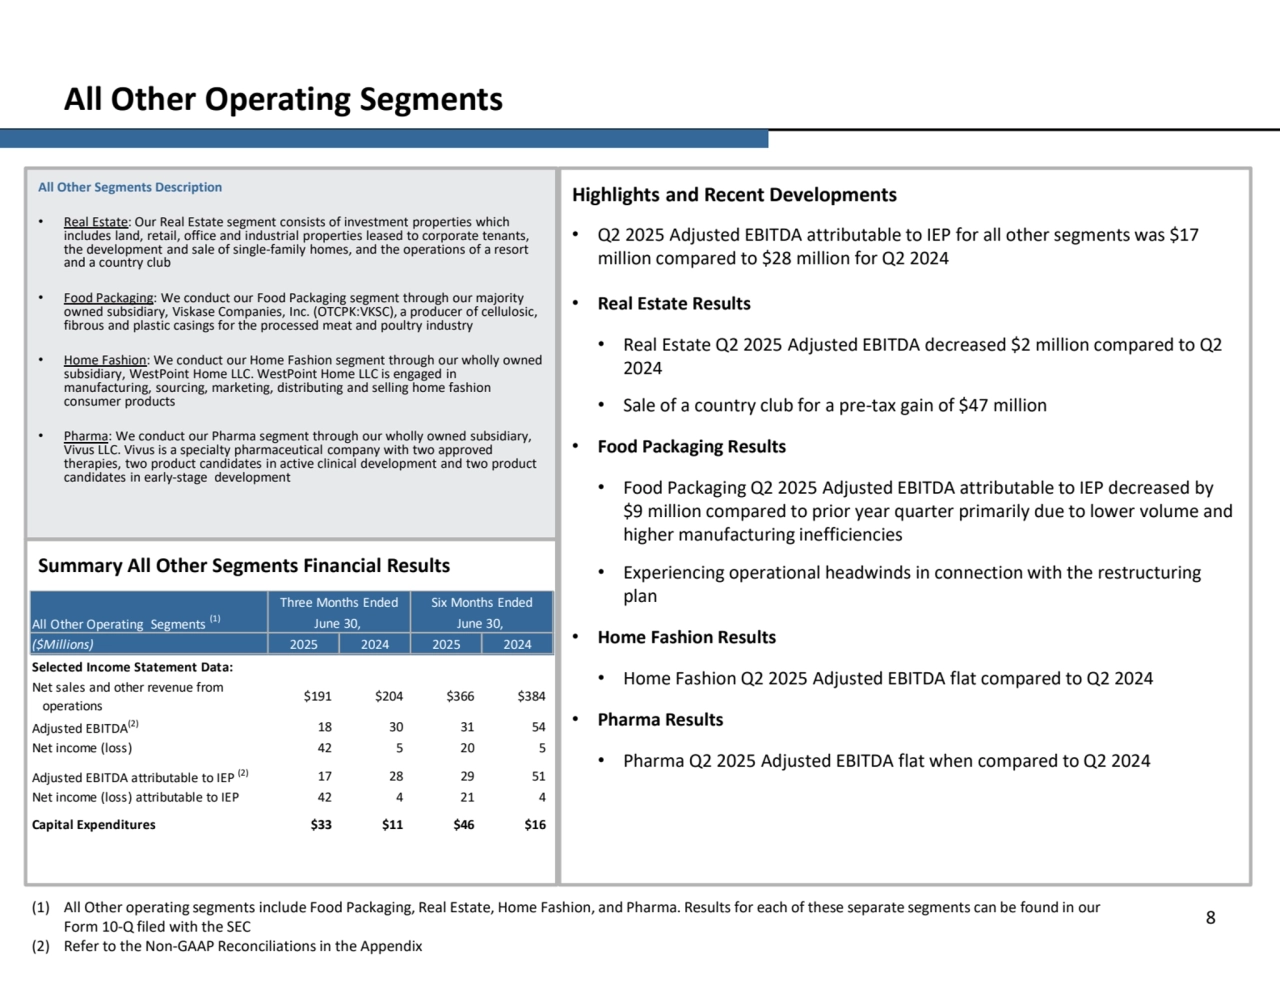
- 8. All Other Operating Segments All Other Segments Description • Real Estate: Our Real Estate segment consists of investment properties which includes land, retail, office and industrial properties leased to corporate tenants, the development and sale of single-family homes, and the operations of a resort and a country club • Food Packaging: We conduct our Food Packaging segment through our majority owned subsidiary, Viskase Companies, Inc. (OTCPK:VKSC), a producer of cellulosic, fibrous and plastic casings for the processed meat and poultry industry • Home Fashion: We conduct our Home Fashion segment through our wholly owned subsidiary, WestPoint Home LLC. WestPoint Home LLC is engaged in manufacturing, sourcing, marketing, distributing and selling home fashion consumer products • Pharma: We conduct our Pharma segment through our wholly owned subsidiary, Vivus LLC. Vivus is a specialty pharmaceutical company with two approved therapies, two product candidates in active clinical development and two product candidates in early-stage development Highlights and Recent Developments • Q2 2025 Adjusted EBITDA attributable to IEP for all other segments was $17 million compared to $28 million for Q2 2024 • Real Estate Results • Real Estate Q2 2025 Adjusted EBITDA decreased $2 million compared to Q2 2024 • Sale of a country club for a pre-tax gain of $47 million • Food Packaging Results • Food Packaging Q2 2025 Adjusted EBITDA attributable to IEP decreased by $9 million compared to prior year quarter primarily due to lower volume and higher manufacturing inefficiencies • Experiencing operational headwinds in connection with the restructuring plan • Home Fashion Results • Home Fashion Q2 2025 Adjusted EBITDA flat compared to Q2 2024 • Pharma Results • Pharma Q2 2025 Adjusted EBITDA flat when compared to Q2 2024 Summary All Other Segments Financial Results (1) All Other operating segments include Food Packaging, Real Estate, Home Fashion, and Pharma. Results for each of these separate segments can be found in our Form 10-Q filed with the SEC (2) Refer to the Non-GAAP Reconciliations in the Appendix 8 ($Millions) Selected Income Statement Data: Net sales and other revenue from operations $191 $204 $366 $384 Adjusted EBITDA(2) 18 30 31 54 Net income (loss) 42 5 20 5 Adjusted EBITDA attributable to IEP (2) 17 28 29 51 Net income (loss) attributable to IEP 42 4 21 4 Capital Expenditures $33 $11 $46 $16 All Other Operating Segments (1) Three Months Ended Six Months Ended June 30, June 30, 2025 2024 2025 2024
- 9. Financial Performance 9
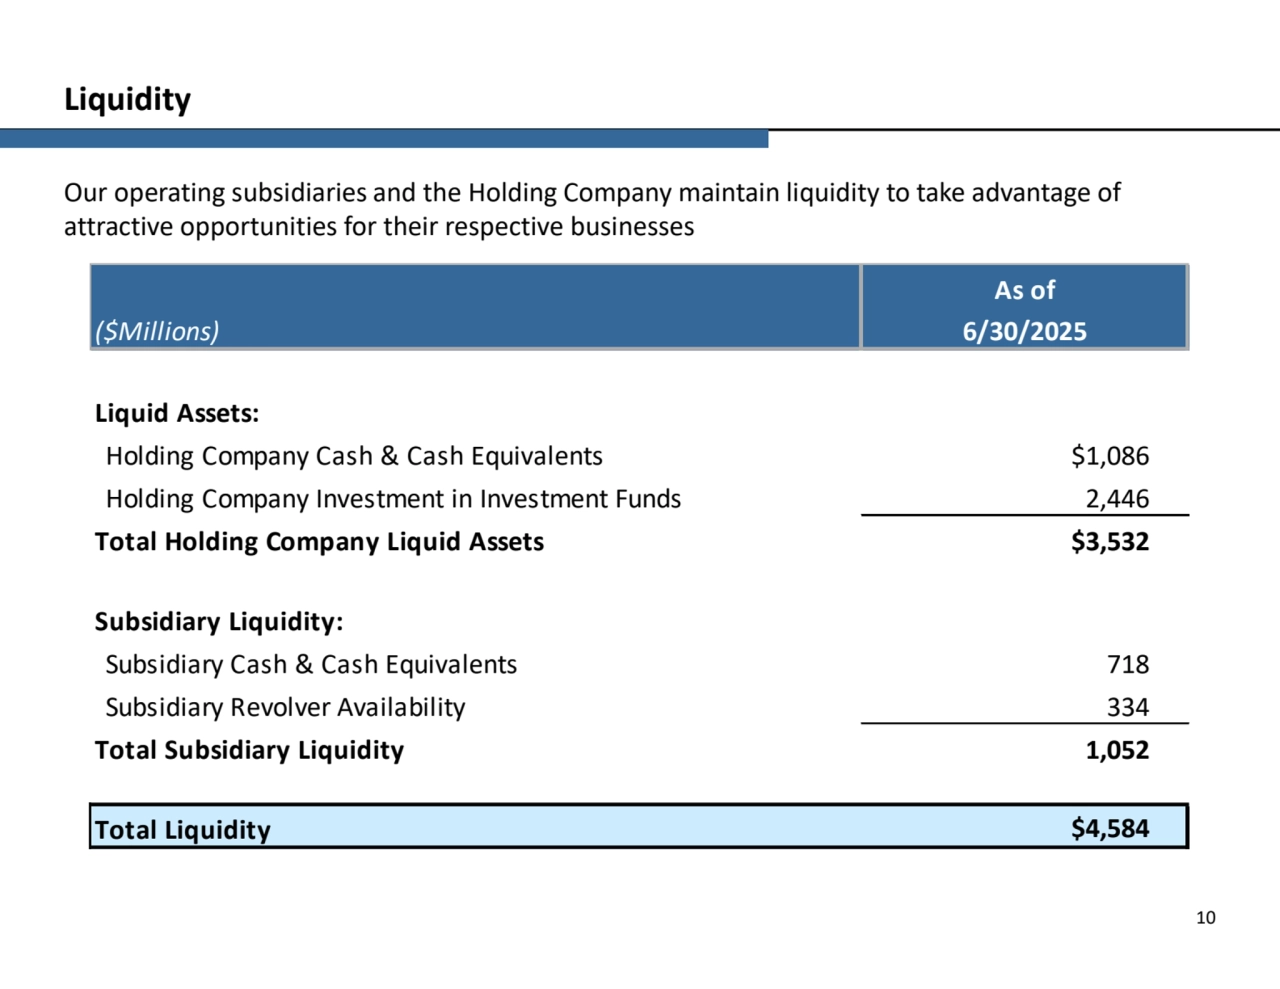
- 10. Our operating subsidiaries and the Holding Company maintain liquidity to take advantage of attractive opportunities for their respective businesses Liquidity 10 Holding Company Cash & Cash Equivalents $1,086 Holding Company Investment in Investment Funds 2,446 $3,532 Subsidiary Cash & Cash Equivalents 718 Subsidiary Revolver Availability 334 1,052 Total Liquidity $4,584 Total Holding Company Liquid Assets Subsidiary Liquidity: Total Subsidiary Liquidity As of ($Millions) 6/30/2025 Liquid Assets:
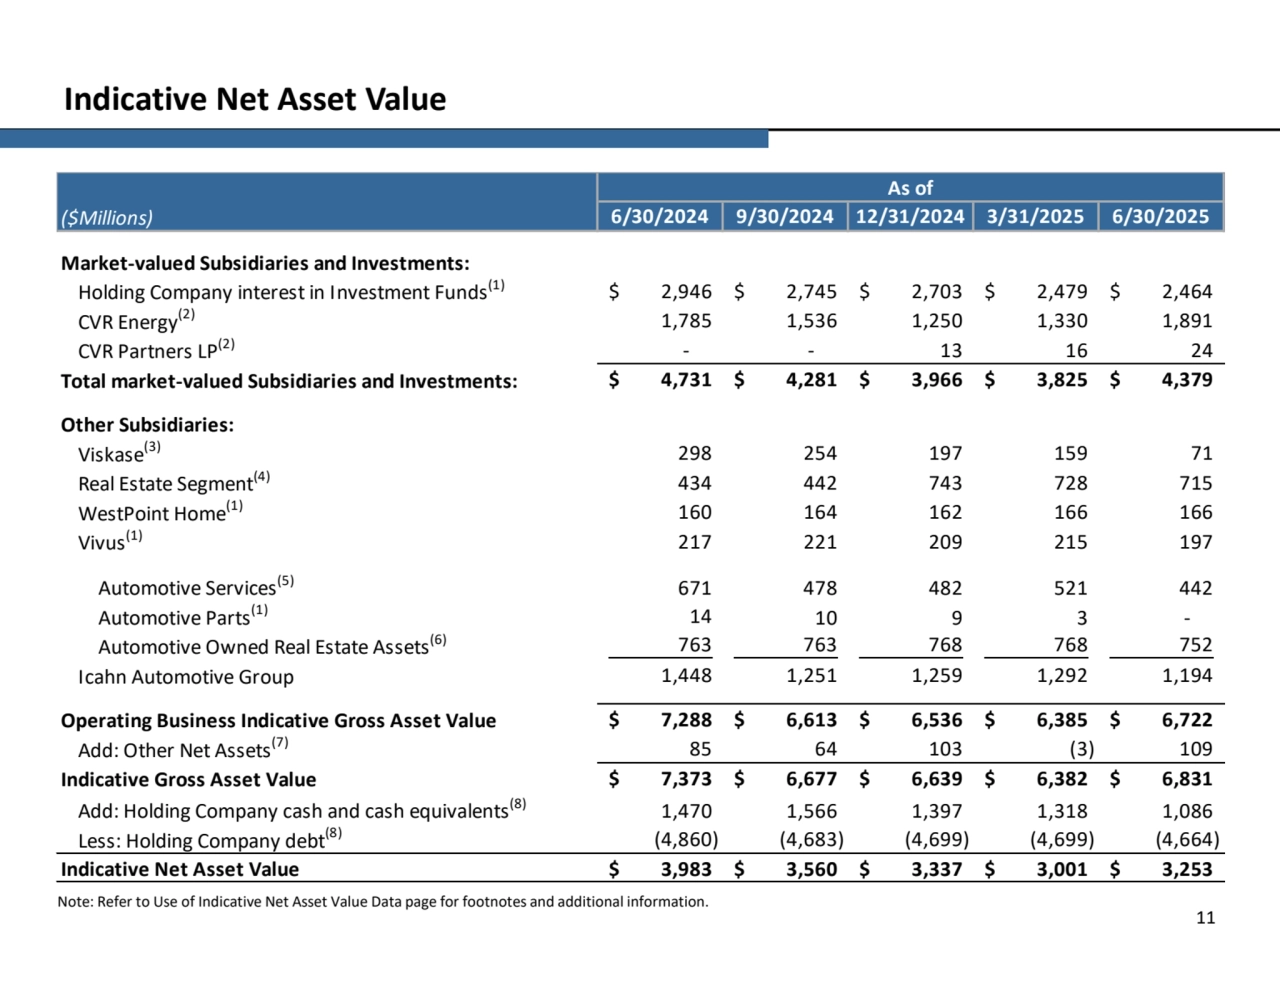
- 11. Indicative Net Asset Value Note: Refer to Use of Indicative Net Asset Value Data page for footnotes and additional information. 11 6/30/2024 9/30/2024 12/31/2024 3/31/2025 6/30/2025 Holding Company interest in Investment Funds(1) $ 2,745 2,946 $ 2,703 $ 2,479 $ 2,464 $ CVR Energy(2) 1,536 1,785 1,250 1,330 1,891 CVR Partners LP(2) - - 13 16 24 Total market-valued Subsidiaries and Investments: $ 4,281 4,731 $ 3,966 $ 3,825 $ 4,379 $ Viskase(3) 254 298 197 159 71 Real Estate Segment(4) 442 434 743 728 715 WestPoint Home(1) 164 160 162 166 166 Vivus(1) 221 217 209 215 197 Automotive Services(5) 671 478 482 521 442 Automotive Parts(1) 14 10 9 3 - Automotive Owned Real Estate Assets(6) 763 763 768 768 752 Icahn Automotive Group 1,251 1,448 1,259 1,292 1,194 Operating Business Indicative Gross Asset Value $ 6,613 7,288 $ 6,536 $ 6,385 $ 6,722 $ Add: Other Net Assets(7) 64 85 103 (3) 109 Indicative Gross Asset Value $ 6,677 7,373 $ 6,639 $ 6,382 $ 6,831 $ Add: Holding Company cash and cash equivalents(8) 1,470 1,566 1,397 1,318 1,086 Less: Holding Company debt(8) (4,683) (4,860) (4,699) (4,699) (4,664) Indicative Net Asset Value 3,983 $ 3,560 $ 3,337 $ 3,001 $ 3,253 $ Other Subsidiaries: As of Market-valued Subsidiaries and Investments: ($Millions)
- 12. Indicative Net Asset Value 12 Use of Indicative Net Asset Value Data The Company uses indicative net asset value as an additional method for considering the value of the Company’s assets, and we believe that this information can be helpful to investors. Please note, however, that the indicative net asset value does not represent the market price at which the depositary units trade. Accordingly, data regarding indicative net asset value is of limited use and should not be considered in isolation. The Company's depositary units are not redeemable, which means that investors have no right or ability to obtain from the Company the indicative net asset value of units that they own. Units may be bought and sold on The Nasdaq Global Select Market at prevailing market prices. Those prices may be higher or lower than the indicative net asset value of the depositary units as calculated by management. Prior to December 31, 2024, we used GAAP equity attributable to IEP for purposes of calculating our Real Estate segment indicative net asset value. During the fourth quarter of the year ended December 31, 2024, we signed an agreement to sell certain properties in our Real Estate segment which would have resulted in a fair value that would have significantly exceeded their GAAP equity attributable to IEP. As a result, in the view of management, this segment’s GAAP equity attributable to IEP as of December 31, 2024 no longer reflected indicative net asset value. Accordingly, these properties were valued based on the anticipated sales price adjusted for customary closing costs. Additionally, management performed a valuation with the assistance of third-party consultants to estimate fair-market value for the remaining assets in the Real Estate segment. We believe these changes better reflect the value of our Real Estate segment’s assets and provide a more useful measurement for management and investors. Prior to December 31, 2024, we valued the Automotive Services business using the trailing twelve month Adjusted EBITDA. Management no longer believes that the trailing twelve month Adjusted EBITDA represents uniform performance and growth for the business. Accordingly, starting December 31, 2024 management performed a valuation of the business using discounted cash flow and guideline public company methodologies with the assistance of third-party consultants and will continue to use these forward looking methodologies in future periods.
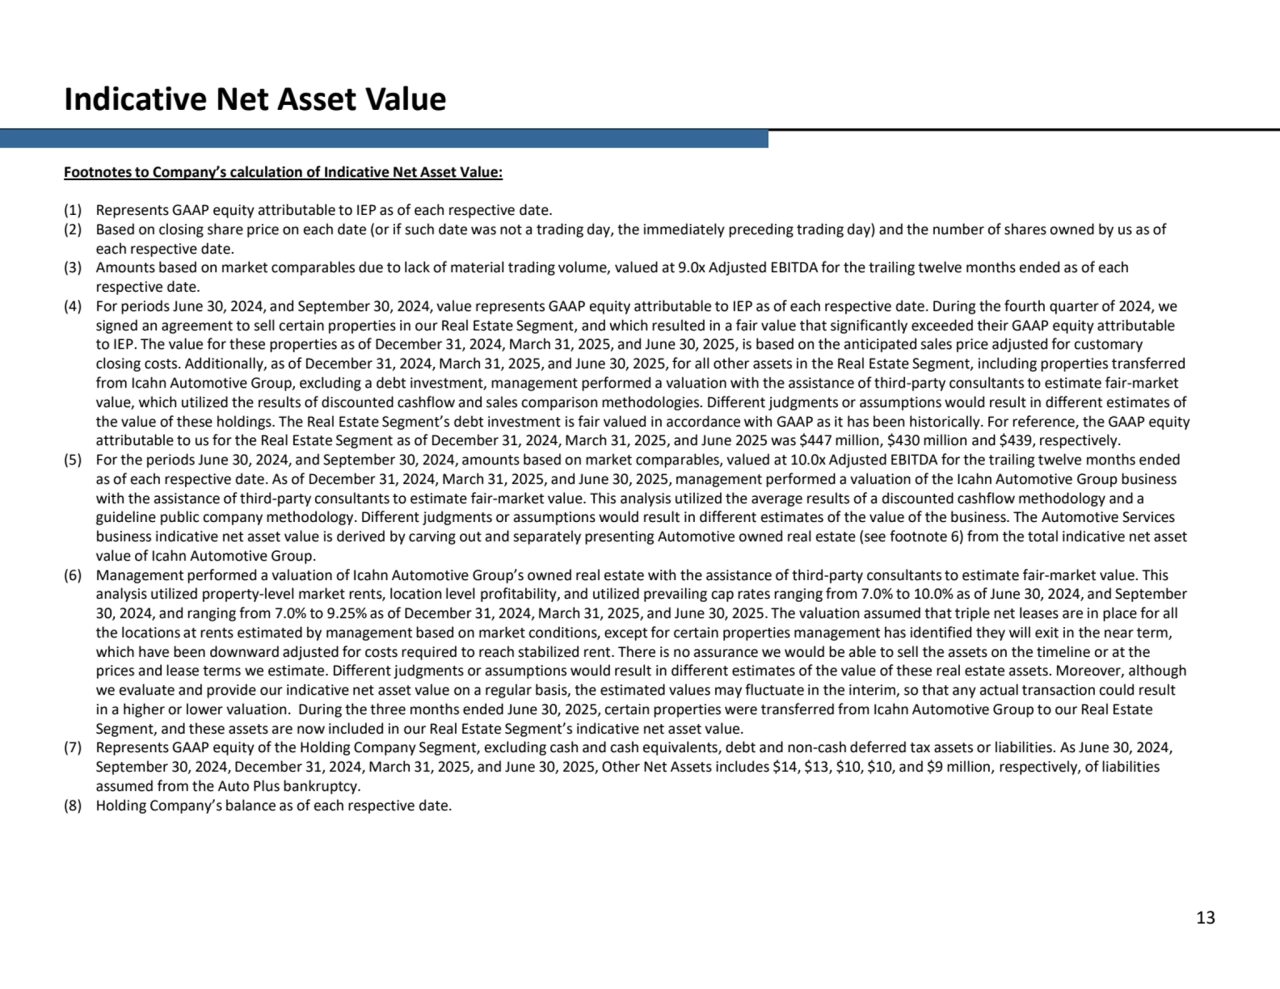
- 13. Indicative Net Asset Value 13 Footnotes to Company’s calculation of Indicative Net Asset Value: (1) Represents GAAP equity attributable to IEP as of each respective date. (2) Based on closing share price on each date (or if such date was not a trading day, the immediately preceding trading day) and the number of shares owned by us as of each respective date. (3) Amounts based on market comparables due to lack of material trading volume, valued at 9.0x Adjusted EBITDA for the trailing twelve months ended as of each respective date. (4) For periods June 30, 2024, and September 30, 2024, value represents GAAP equity attributable to IEP as of each respective date. During the fourth quarter of 2024, we signed an agreement to sell certain properties in our Real Estate Segment, and which resulted in a fair value that significantly exceeded their GAAP equity attributable to IEP. The value for these properties as of December 31, 2024, March 31, 2025, and June 30, 2025, is based on the anticipated sales price adjusted for customary closing costs. Additionally, as of December 31, 2024, March 31, 2025, and June 30, 2025, for all other assets in the Real Estate Segment, including properties transferred from Icahn Automotive Group, excluding a debt investment, management performed a valuation with the assistance of third-party consultants to estimate fair-market value, which utilized the results of discounted cashflow and sales comparison methodologies. Different judgments or assumptions would result in different estimates of the value of these holdings. The Real Estate Segment’s debt investment is fair valued in accordance with GAAP as it has been historically. For reference, the GAAP equity attributable to us for the Real Estate Segment as of December 31, 2024, March 31, 2025, and June 2025 was $447 million, $430 million and $439, respectively. (5) For the periods June 30, 2024, and September 30, 2024, amounts based on market comparables, valued at 10.0x Adjusted EBITDA for the trailing twelve months ended as of each respective date. As of December 31, 2024, March 31, 2025, and June 30, 2025, management performed a valuation of the Icahn Automotive Group business with the assistance of third-party consultants to estimate fair-market value. This analysis utilized the average results of a discounted cashflow methodology and a guideline public company methodology. Different judgments or assumptions would result in different estimates of the value of the business. The Automotive Services business indicative net asset value is derived by carving out and separately presenting Automotive owned real estate (see footnote 6) from the total indicative net asset value of Icahn Automotive Group. (6) Management performed a valuation of Icahn Automotive Group’s owned real estate with the assistance of third-party consultants to estimate fair-market value. This analysis utilized property-level market rents, location level profitability, and utilized prevailing cap rates ranging from 7.0% to 10.0% as of June 30, 2024, and September 30, 2024, and ranging from 7.0% to 9.25% as of December 31, 2024, March 31, 2025, and June 30, 2025. The valuation assumed that triple net leases are in place for all the locations at rents estimated by management based on market conditions, except for certain properties management has identified they will exit in the near term, which have been downward adjusted for costs required to reach stabilized rent. There is no assurance we would be able to sell the assets on the timeline or at the prices and lease terms we estimate. Different judgments or assumptions would result in different estimates of the value of these real estate assets. Moreover, although we evaluate and provide our indicative net asset value on a regular basis, the estimated values may fluctuate in the interim, so that any actual transaction could result in a higher or lower valuation. During the three months ended June 30, 2025, certain properties were transferred from Icahn Automotive Group to our Real Estate Segment, and these assets are now included in our Real Estate Segment’s indicative net asset value. (7) Represents GAAP equity of the Holding Company Segment, excluding cash and cash equivalents, debt and non-cash deferred tax assets or liabilities. As June 30, 2024, September 30, 2024, December 31, 2024, March 31, 2025, and June 30, 2025, Other Net Assets includes $14, $13, $10, $10, and $9 million, respectively, of liabilities assumed from the Auto Plus bankruptcy. (8) Holding Company’s balance as of each respective date.
- 14. Non-GAAP Reconciliations 14
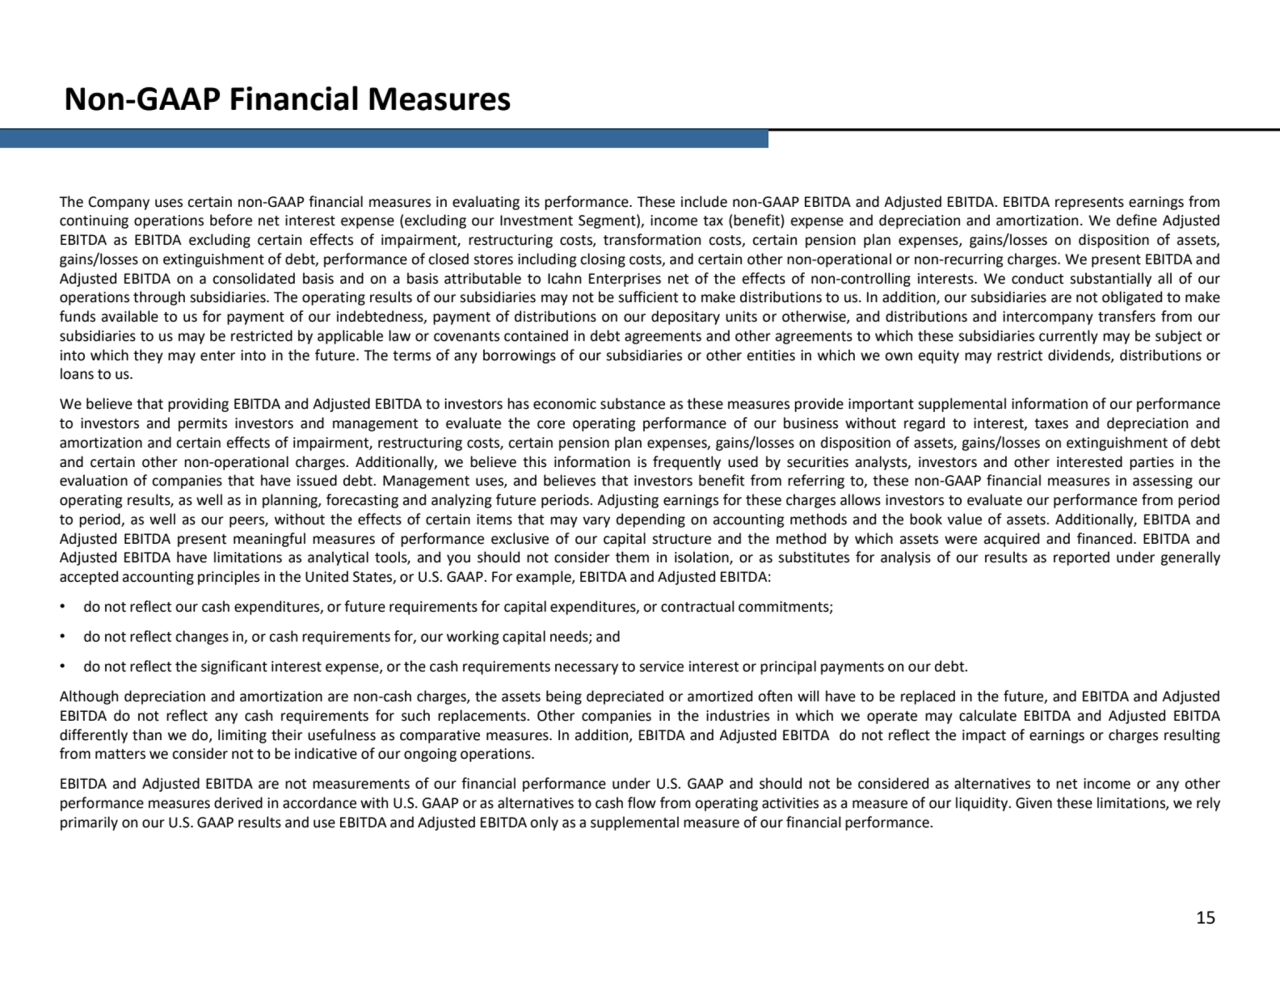
- 15. Non-GAAP Financial Measures 15 The Company uses certain non-GAAP financial measures in evaluating its performance. These include non-GAAP EBITDA and Adjusted EBITDA. EBITDA represents earnings from continuing operations before net interest expense (excluding our Investment Segment), income tax (benefit) expense and depreciation and amortization. We define Adjusted EBITDA as EBITDA excluding certain effects of impairment, restructuring costs, transformation costs, certain pension plan expenses, gains/losses on disposition of assets, gains/losses on extinguishment of debt, performance of closed stores including closing costs, and certain other non-operational or non-recurring charges. We present EBITDA and Adjusted EBITDA on a consolidated basis and on a basis attributable to Icahn Enterprises net of the effects of non-controlling interests. We conduct substantially all of our operations through subsidiaries. The operating results of our subsidiaries may not be sufficient to make distributions to us. In addition, our subsidiaries are not obligated to make funds available to us for payment of our indebtedness, payment of distributions on our depositary units or otherwise, and distributions and intercompany transfers from our subsidiaries to us may be restricted by applicable law or covenants contained in debt agreements and other agreements to which these subsidiaries currently may be subject or into which they may enter into in the future. The terms of any borrowings of our subsidiaries or other entities in which we own equity may restrict dividends, distributions or loans to us. We believe that providing EBITDA and Adjusted EBITDA to investors has economic substance as these measures provide important supplemental information of our performance to investors and permits investors and management to evaluate the core operating performance of our business without regard to interest, taxes and depreciation and amortization and certain effects of impairment, restructuring costs, certain pension plan expenses, gains/losses on disposition of assets, gains/losses on extinguishment of debt and certain other non-operational charges. Additionally, we believe this information is frequently used by securities analysts, investors and other interested parties in the evaluation of companies that have issued debt. Management uses, and believes that investors benefit from referring to, these non-GAAP financial measures in assessing our operating results, as well as in planning, forecasting and analyzing future periods. Adjusting earnings for these charges allows investors to evaluate our performance from period to period, as well as our peers, without the effects of certain items that may vary depending on accounting methods and the book value of assets. Additionally, EBITDA and Adjusted EBITDA present meaningful measures of performance exclusive of our capital structure and the method by which assets were acquired and financed. EBITDA and Adjusted EBITDA have limitations as analytical tools, and you should not consider them in isolation, or as substitutes for analysis of our results as reported under generally accepted accounting principles in the United States, or U.S. GAAP. For example, EBITDA and Adjusted EBITDA: • do not reflect our cash expenditures, or future requirements for capital expenditures, or contractual commitments; • do not reflect changes in, or cash requirements for, our working capital needs; and • do not reflect the significant interest expense, or the cash requirements necessary to service interest or principal payments on our debt. Although depreciation and amortization are non-cash charges, the assets being depreciated or amortized often will have to be replaced in the future, and EBITDA and Adjusted EBITDA do not reflect any cash requirements for such replacements. Other companies in the industries in which we operate may calculate EBITDA and Adjusted EBITDA differently than we do, limiting their usefulness as comparative measures. In addition, EBITDA and Adjusted EBITDA do not reflect the impact of earnings or charges resulting from matters we consider not to be indicative of our ongoing operations. EBITDA and Adjusted EBITDA are not measurements of our financial performance under U.S. GAAP and should not be considered as alternatives to net income or any other performance measures derived in accordance with U.S. GAAP or as alternatives to cash flow from operating activities as a measure of our liquidity. Given these limitations, we rely primarily on our U.S. GAAP results and use EBITDA and Adjusted EBITDA only as a supplemental measure of our financial performance.
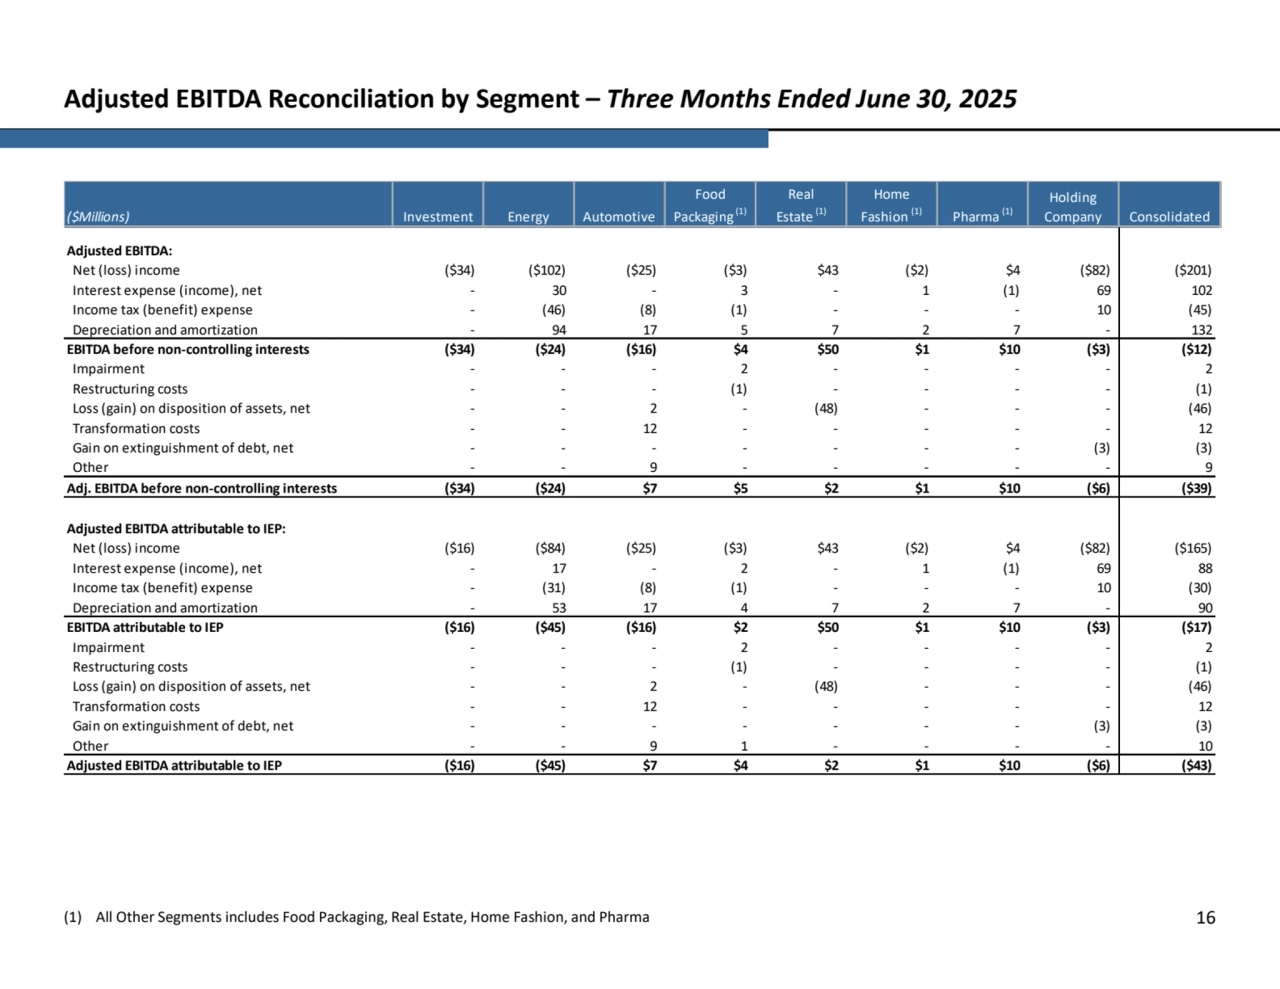
- 16. Adjusted EBITDA Reconciliation by Segment – Three Months Ended June 30, 2025 (1) All Other Segments includes Food Packaging, Real Estate, Home Fashion, and Pharma 16 Net (loss) income ($34) ($102) ($25) ($3) $43 ($2) $4 ($82) ($201) Interest expense (income), net - 30 - 3 - 1 (1) 69 102 Income tax (benefit) expense - (46) (8) (1) - - - 10 (45) Depreciation and amortization - 94 17 5 7 2 7 - 132 ($34) ($24) ($16) $4 $50 $1 $10 ($3) ($12) Impairment - - - 2 - - - - 2 Restructuring costs - - - (1) - - - - (1) Loss (gain) on disposition of assets, net - - 2 - (48) - - - (46) Transformation costs - - 12 - - - - - 12 Gain on extinguishment of debt, net - - - - - - - (3) (3) Other - - 9 - - - - - 9 ($34) ($24) $7 $5 $2 $1 $10 ($6) ($39) Net (loss) income ($16) ($84) ($25) ($3) $43 ($2) $4 ($82) ($165) Interest expense (income), net - 17 - 2 - 1 (1) 69 88 Income tax (benefit) expense - (31) (8) (1) - - - 10 (30) Depreciation and amortization - 53 17 4 7 2 7 - 90 ($16) ($45) ($16) $2 $50 $1 $10 ($3) ($17) Impairment - - - 2 - - - - 2 Restructuring costs - - - (1) - - - - (1) Loss (gain) on disposition of assets, net - - 2 - (48) - - - (46) Transformation costs - - 12 - - - - - 12 Gain on extinguishment of debt, net - - - - - - - (3) (3) Other - - 9 1 - - - - 10 ($16) ($45) $7 $4 $2 $1 $10 ($6) ($43) Holding Company Consolidated Real Estate (1) Home Fashion (1) Pharma (1) ($Millions) Investment Energy Automotive Food Packaging (1) Adjusted EBITDA attributable to IEP: EBITDA attributable to IEP Adjusted EBITDA: Adjusted EBITDA attributable to IEP EBITDA before non-controlling interests Adj. EBITDA before non-controlling interests
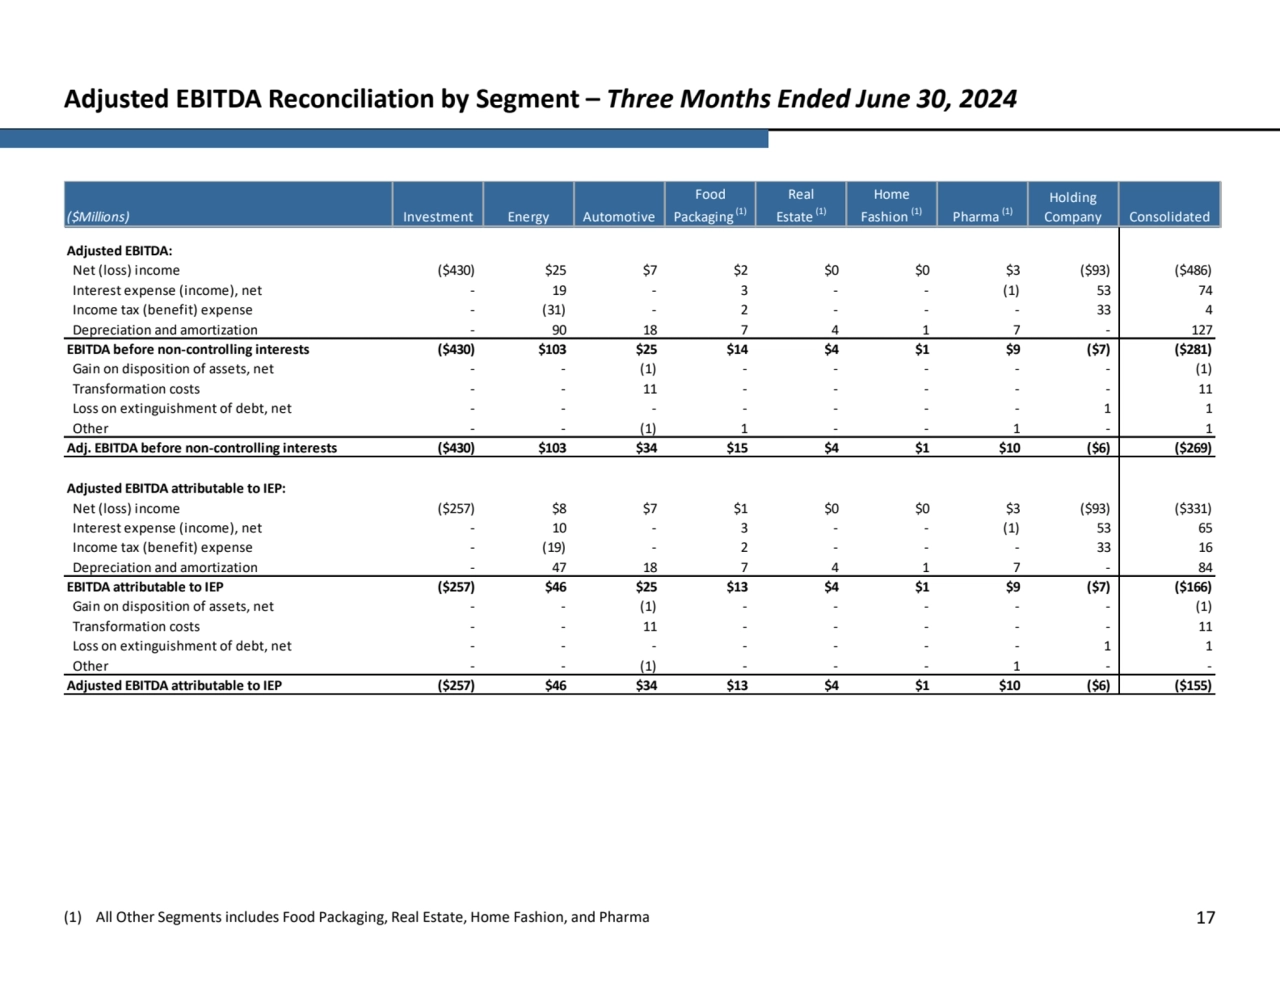
- 17. Adjusted EBITDA Reconciliation by Segment – Three Months Ended June 30, 2024 (1) All Other Segments includes Food Packaging, Real Estate, Home Fashion, and Pharma 17 Net (loss) income ($430) $25 $7 $2 $0 $0 $3 ($93) ($486) Interest expense (income), net - 19 - 3 - - (1) 53 74 Income tax (benefit) expense - (31) - 2 - - - 33 4 Depreciation and amortization - 90 18 7 4 1 7 - 127 ($430) $103 $25 $14 $4 $1 $9 ($7) ($281) Gain on disposition of assets, net - - (1) - - - - - (1) Transformation costs - - 11 - - - - - 11 Loss on extinguishment of debt, net - - - - - - - 1 1 Other - - (1) 1 - - 1 - 1 ($430) $103 $34 $15 $4 $1 $10 ($6) ($269) Net (loss) income ($257) $8 $7 $1 $0 $0 $3 ($93) ($331) Interest expense (income), net - 10 - 3 - - (1) 53 65 Income tax (benefit) expense - (19) - 2 - - - 33 16 Depreciation and amortization - 47 18 7 4 1 7 - 84 ($257) $46 $25 $13 $4 $1 $9 ($7) ($166) Gain on disposition of assets, net - - (1) - - - - - (1) Transformation costs - - 11 - - - - - 11 Loss on extinguishment of debt, net - - - - - - - 1 1 Other - - (1) - - - 1 - - ($257) $46 $34 $13 $4 $1 $10 ($6) ($155) Holding Company Consolidated Real Estate (1) Home Fashion (1) Pharma (1) ($Millions) Investment Energy Automotive Food Packaging (1) Adjusted EBITDA attributable to IEP Adjusted EBITDA attributable to IEP: EBITDA before non-controlling interests Adj. EBITDA before non-controlling interests EBITDA attributable to IEP Adjusted EBITDA:
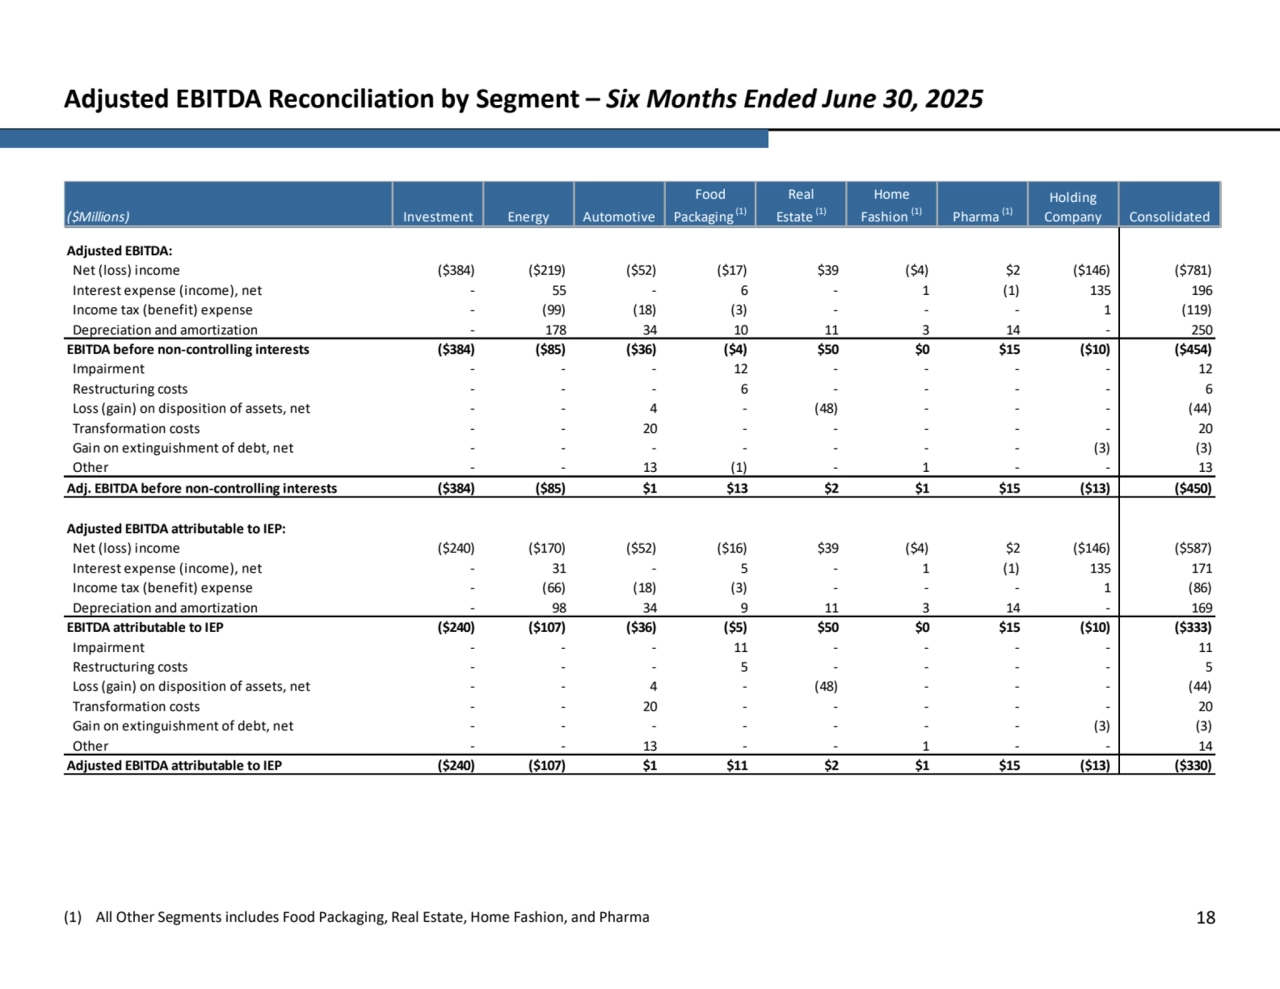
- 18. Adjusted EBITDA Reconciliation by Segment – Six Months Ended June 30, 2025 (1) All Other Segments includes Food Packaging, Real Estate, Home Fashion, and Pharma 18 Net (loss) income ($384) ($219) ($52) ($17) $39 ($4) $2 ($146) ($781) Interest expense (income), net - 55 - 6 - 1 (1) 135 196 Income tax (benefit) expense - (99) (18) (3) - - - 1 (119) Depreciation and amortization - 178 34 10 11 3 14 - 250 ($384) ($85) ($36) ($4) $50 $0 $15 ($10) ($454) Impairment - - - 12 - - - - 12 Restructuring costs - - - 6 - - - - 6 Loss (gain) on disposition of assets, net - - 4 - (48) - - - (44) Transformation costs - - 20 - - - - - 20 Gain on extinguishment of debt, net - - - - - - - (3) (3) Other - - 13 (1) - 1 - - 13 ($384) ($85) $1 $13 $2 $1 $15 ($13) ($450) Net (loss) income ($240) ($170) ($52) ($16) $39 ($4) $2 ($146) ($587) Interest expense (income), net - 31 - 5 - 1 (1) 135 171 Income tax (benefit) expense - (66) (18) (3) - - - 1 (86) Depreciation and amortization - 98 34 9 11 3 14 - 169 ($240) ($107) ($36) ($5) $50 $0 $15 ($10) ($333) Impairment - - - 11 - - - - 11 Restructuring costs - - - 5 - - - - 5 Loss (gain) on disposition of assets, net - - 4 - (48) - - - (44) Transformation costs - - 20 - - - - - 20 Gain on extinguishment of debt, net - - - - - - - (3) (3) Other - - 13 - - 1 - - 14 ($240) ($107) $1 $11 $2 $1 $15 ($13) ($330) ($Millions) Investment Energy Automotive Food Packaging (1) Holding Company Consolidated Real Estate (1) Home Fashion (1) Pharma (1) Adjusted EBITDA: EBITDA before non-controlling interests Adj. EBITDA before non-controlling interests Adjusted EBITDA attributable to IEP Adjusted EBITDA attributable to IEP: EBITDA attributable to IEP
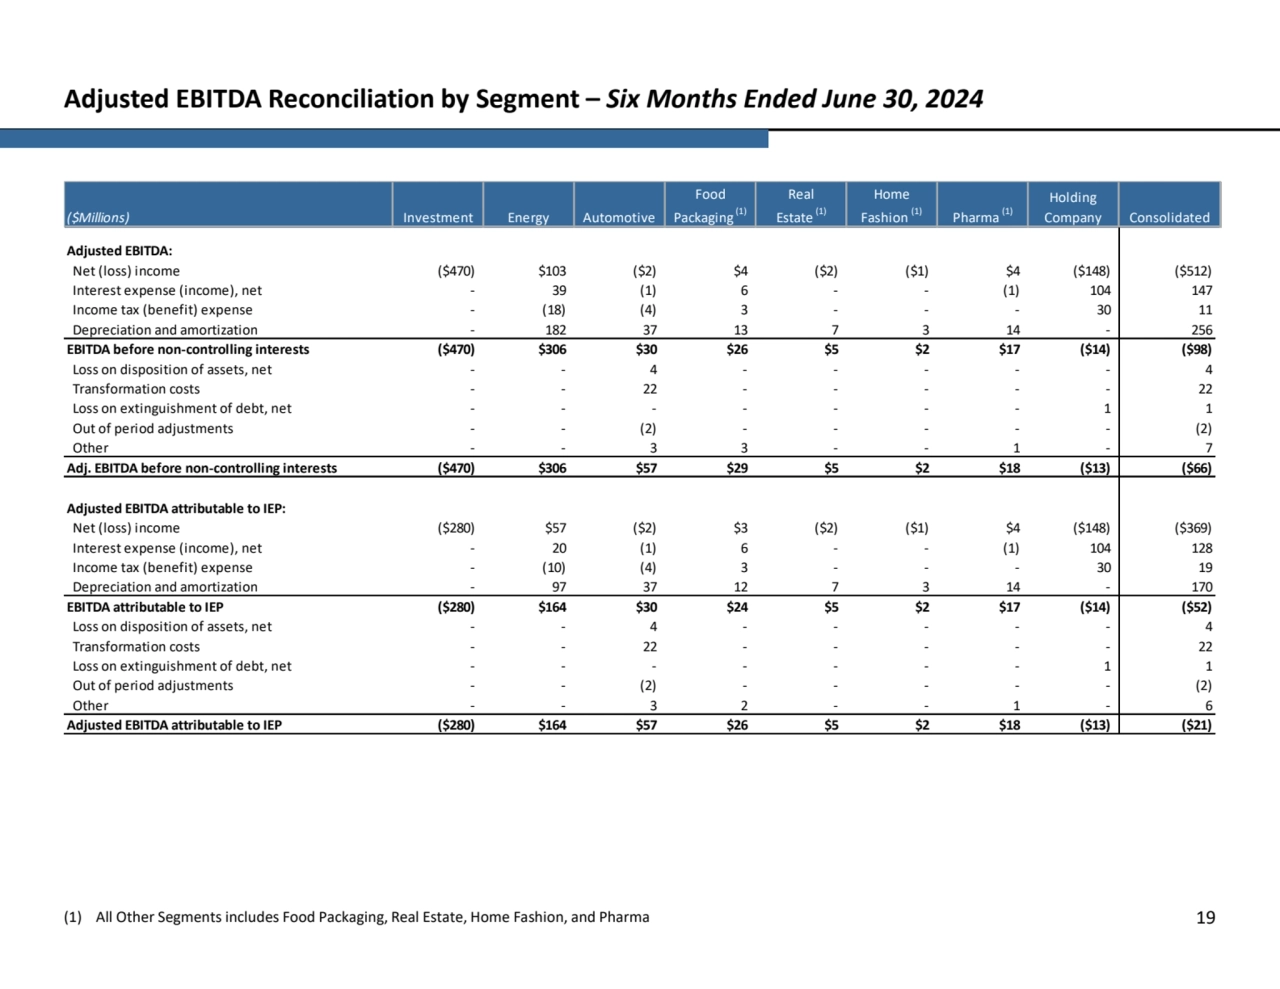
- 19. Adjusted EBITDA Reconciliation by Segment – Six Months Ended June 30, 2024 (1) All Other Segments includes Food Packaging, Real Estate, Home Fashion, and Pharma 19 Net (loss) income ($470) $103 ($2) $4 ($2) ($1) $4 ($148) ($512) Interest expense (income), net - 39 (1) 6 - - (1) 104 147 Income tax (benefit) expense - (18) (4) 3 - - - 30 11 Depreciation and amortization - 182 37 13 7 3 14 - 256 ($470) $306 $30 $26 $5 $2 $17 ($14) ($98) Loss on disposition of assets, net - - 4 - - - - - 4 Transformation costs - - 22 - - - - - 22 Loss on extinguishment of debt, net - - - - - - - 1 1 Out of period adjustments - - (2) - - - - - (2) Other - - 3 3 - - 1 - 7 ($470) $306 $57 $29 $5 $2 $18 ($13) ($66) Net (loss) income ($280) $57 ($2) $3 ($2) ($1) $4 ($148) ($369) Interest expense (income), net - 20 (1) 6 - - (1) 104 128 Income tax (benefit) expense - (10) (4) 3 - - - 30 19 Depreciation and amortization - 97 37 12 7 3 14 - 170 ($280) $164 $30 $24 $5 $2 $17 ($14) ($52) Loss on disposition of assets, net - - 4 - - - - - 4 Transformation costs - - 22 - - - - - 22 Loss on extinguishment of debt, net - - - - - - - 1 1 Out of period adjustments - - (2) - - - - - (2) Other - - 3 2 - - 1 - 6 ($280) $164 $57 $26 $5 $2 $18 ($13) ($21) ($Millions) Investment Energy Automotive Food Packaging (1) Holding Company Consolidated Real Estate (1) Home Fashion (1) Pharma (1) Adjusted EBITDA: EBITDA before non-controlling interests Adj. EBITDA before non-controlling interests Adjusted EBITDA attributable to IEP Adjusted EBITDA attributable to IEP: EBITDA attributable to IEP