Intel 2nd Quarter Earnings Presentation
 AI Summary
Key Insights
- 📈 Financial Performance: Revenue reached $12.9B, up 0.2% YoY, but profitability was impacted by restructuring.
- ⚙️ Operational Efficiency: Headcount reductions are mostly done, aiming to reduce complexity.
- 🎯 Strategic Focus: Intel is becoming customer-centric and engineering-focused.
- 💻 Segment Performance: Al PC demand boosts CCG, while Xeon 6 ramps in DCAI.
- 🔮 Future Outlook: Q3 2025 revenue expected between $12.6-13.6B, with 36.0% gross margin.


Intel 2nd Quarter Earnings Presentation
- 2. 2 nd Quarter Earnings Presentation David Zinsner Executive Vice President and Chief Financial Officer Lip-Bu Tan Chief Executive Officer
- 3. • This presentation contains non-GAAP financial measures. Intel gross margin percentage, operating income, earnings per share attributable to Intel, and adjusted free cash flow, including year-over-year comparisons, are presented on a non-GAAP basis. This presentation also contains forward-looking estimates for non-GAAP R&D and MG&A and non-GAAP net capital spending. The Appendix provides a reconciliation of these measures to the most directly comparable GAAP financial measure. Non-GAAP financial measures should not be considered a substitute for, or superior to, the financial measures prepared in accordance with GAAP. Please refer to “Explanation of Non-GAAP Measures” in our earnings release dated July 24, 2025 for a detailed explanation of the adjustments made to the comparable GAAP measures, the ways management uses the non-GAAP measures, and the reasons why management believes the non-GAAP measures provide investors with useful supplemental information. • Statements in this presentation that refer to business outlook, plans, and expectations are forward-looking statements that involve risks and uncertainties. Such statements may include, but not be limited to, those regarding: our business plans, strategy and leadership and anticipated benefits therefrom; projections of our future financial performance, including future revenue, gross margins, capital expenditures, profitability and cash flows; future cash requirements and the availability and sufficiency of funding; expectations regarding returns to stockholders; future products, services and technologies, and the expected goals, timeline, ramps, progress, availability, production, regulation and benefits of such products, services and technologies, including future process nodes and packaging technology, product roadmaps, schedules, future product architectures, expectations regarding process performance, per-watt parity, and metrics and expectations regarding product and process competitiveness; internal and external manufacturing plans; future production capacity and product supply; supply expectations; plans and goals related to Intel’s foundry business, including with respect to anticipated customers, future manufacturing capacity and service, technology and IP offerings; expected timing and impact of acquisitions, divestitures, and other significant transactions; expected completion and impacts of restructuring activities and cost-saving or efficiency initiatives; social and environmental performance goals; our anticipated growth, future market share, and trends in our businesses and operations; projected market trends; anticipated trends and impacts related to industry component, substrate, and foundry capacity utilization, shortages and constraints; expectations regarding CHIPS Act and other government incentives; technology trends, such as AI; environmental and economic conditions; geopolitical tensions and conflicts, including with respect to international trade policies in areas such as tariffs and export controls, and their potential impact on our business; tax- and accounting-related expectations; expectations regarding certain sanctioned parties; and other characterizations of future events or circumstances. • Such statements involve many risks and uncertainties that could cause our actual results to differ materially from those expressed or implied, including: the high level of competition and rapid technological change in our industry; the significant long-term and inherently risky investments we are making in R&D and manufacturing facilities; the complexities and uncertainties in developing and implementing new semiconductor products and manufacturing process technologies; implementing new business strategies and investing in new business and technologies; our ability to time and scale our capital investments appropriately and successfully secure favorable alternative financing arrangements and government grants; changes in demand for and margins on our products; macroeconomic conditions and geopolitical tensions and conflicts, including geopolitical and trade tensions between the US and China, tensions and conflict affecting Israel and the Middle East, rising tensions between mainland China and Taiwan, and the impacts of Russia's war on Ukraine; the evolving market for products with AI capabilities; our complex global supply chain, including from disruptions, delays, trade tensions and conflicts, or shortages; recently elevated geopolitical tensions, volatility and uncertainty with respect to international trade policies, including tariffs and export controls, impacting our business, the markets in which we compete and the world economy; product defects, errata and other product issues; potential security vulnerabilities in our products; increasing and evolving cybersecurity threats and privacy risks; IP risks including related litigation and regulatory proceedings; the need to attract, retain, and motivate key talent; strategic transactions and investments; sales-related risks, including customer concentration and the use of distributors and other third parties; our debt obligations and our ability to access sources of capital; our having ceased to return capital to stockholders; complex and evolving laws and regulations across many jurisdictions; fluctuations in currency exchange rates; changes in our effective tax rate; catastrophic events; environmental, health, safety, and product regulations; corporate responsibility initiatives and requirements; and other risks and uncertainties described in this presentation, our earnings release dated July 24, 2025, most recent Annual Report on Form 10-K and other filings with the SEC. • Unless specifically indicated otherwise, the forward-looking statements in this presentation do not reflect the potential impact of any divestitures, mergers, acquisitions, or other business combinations that have not been completed as of the date of this presentation. All information in this presentation reflects management’s views as of July 24, 2025, unless an earlier date is specified. We do not undertake, and expressly disclaim any duty, to update such statements, whether as a result of new information, new developments, or otherwise, except to the extent that disclosure may be required by law.
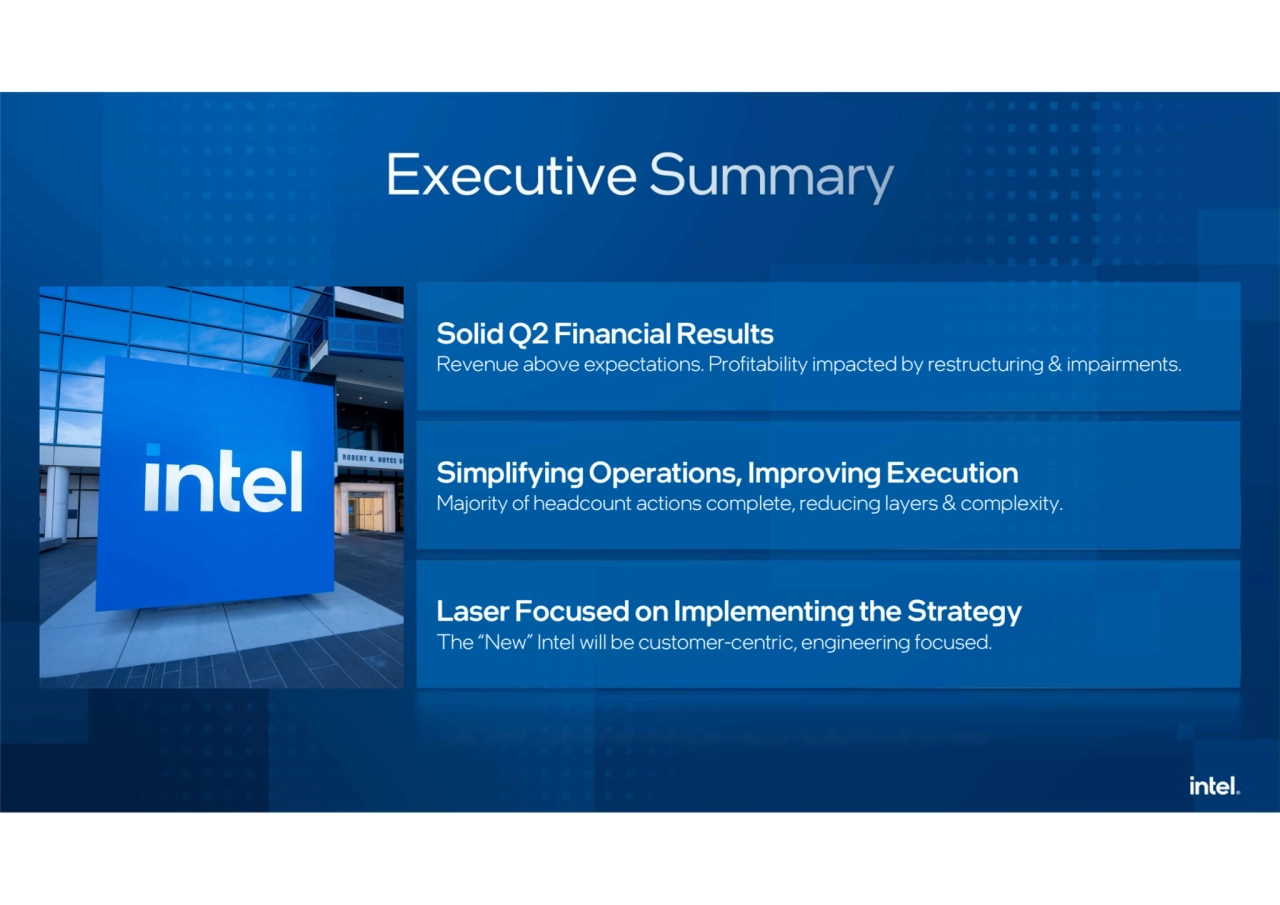
- 4. Solid Q2 Financial Results Revenue above expectations. Profitability impacted by restructuring & impairments. Simplifying Operations, Improving Execution Majority of headcount actions complete, reducing layers & complexity. Laser Focused on Implementing the Strategy The “New” Intel will be customer-centric, engineering focused.
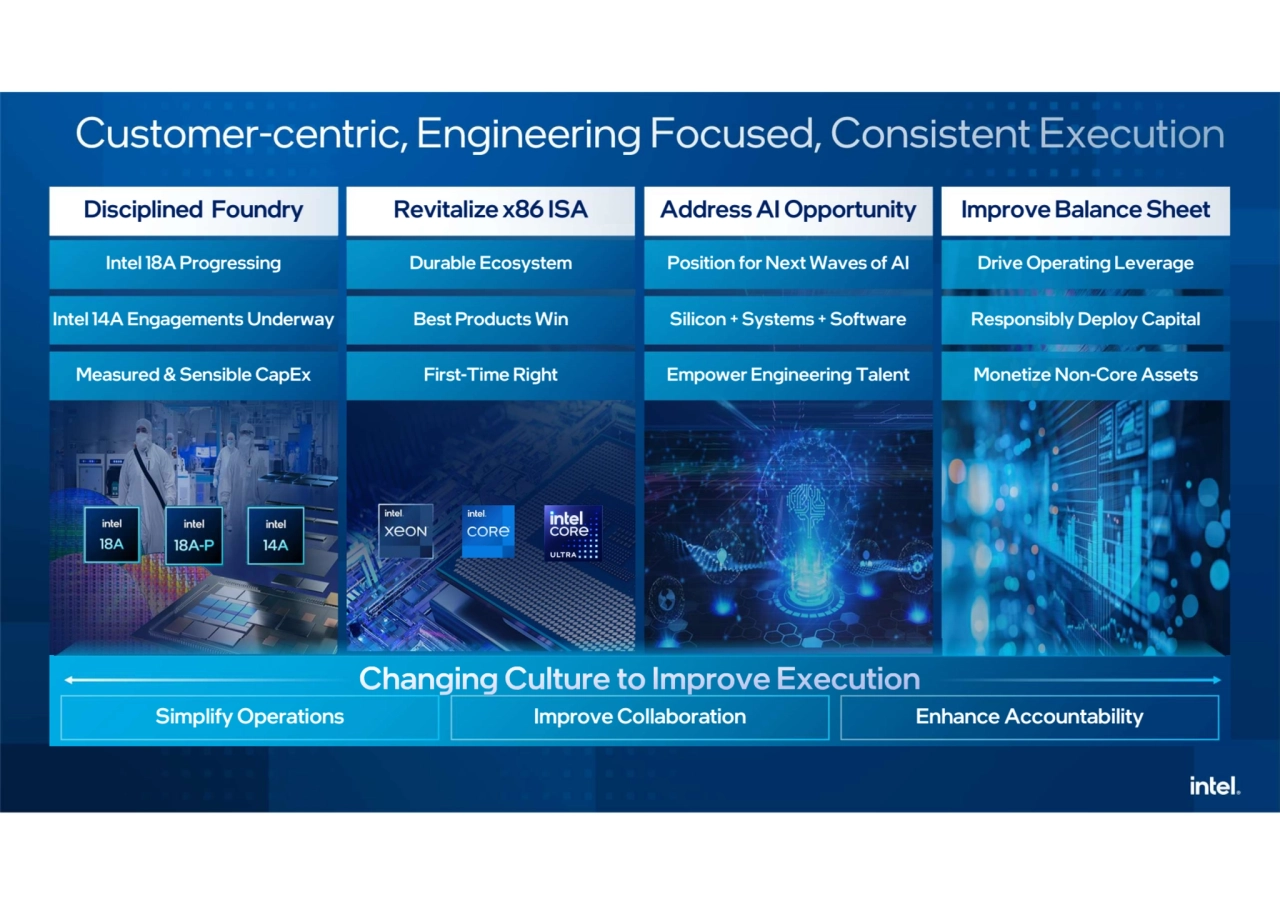
- 5. Revitalize x86 ISA Durable Ecosystem Best Products Win First-Time Right Disciplined Foundry Intel 18A Progressing Intel 14A Engagements Underway Measured & Sensible CapEx Address AI Opportunity Position for Next Waves of AI Empower Engineering Talent Silicon + Systems + Software Improve Balance Sheet Drive Operating Leverage Responsibly Deploy Capital Monetize Non-Core Assets Simplify Operations Improve Collaboration Enhance Accountability
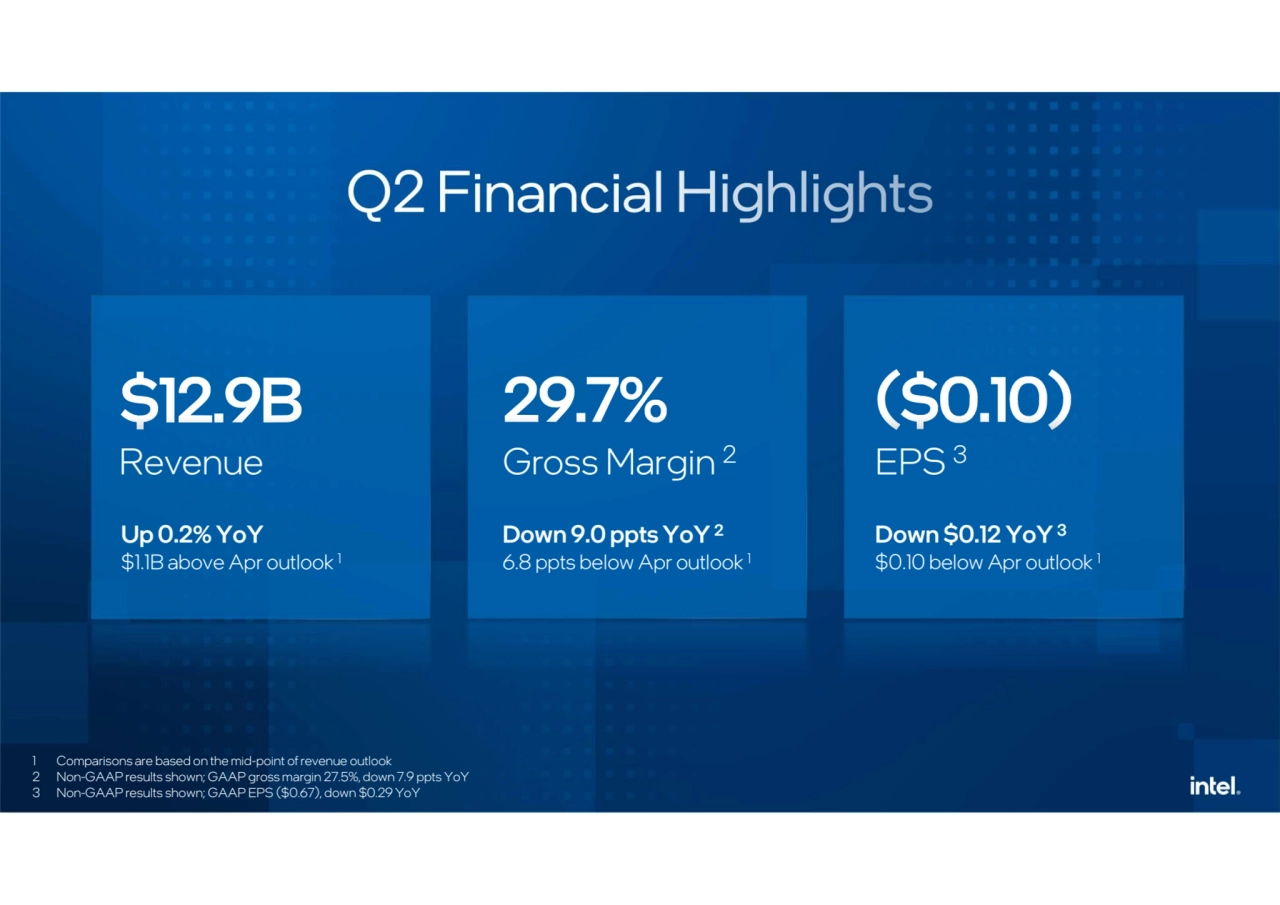
- 6. Up 0.2% YoY $1.1B above Apr outlook 1 Gross Margin 2 Down 9.0 ppts YoY 2 6.8 ppts below Apr outlook 1 EPS 3 Down $0.12 YoY 3 $0.10 below Apr outlook 1 Revenue 1 Comparisons are based on the mid-point of revenue outlook 2 Non-GAAP results shown; GAAP gross margin 27.5%, down 7.9 ppts YoY 3 Non-GAAP results shown; GAAP EPS ($0.67), down $0.29 YoY
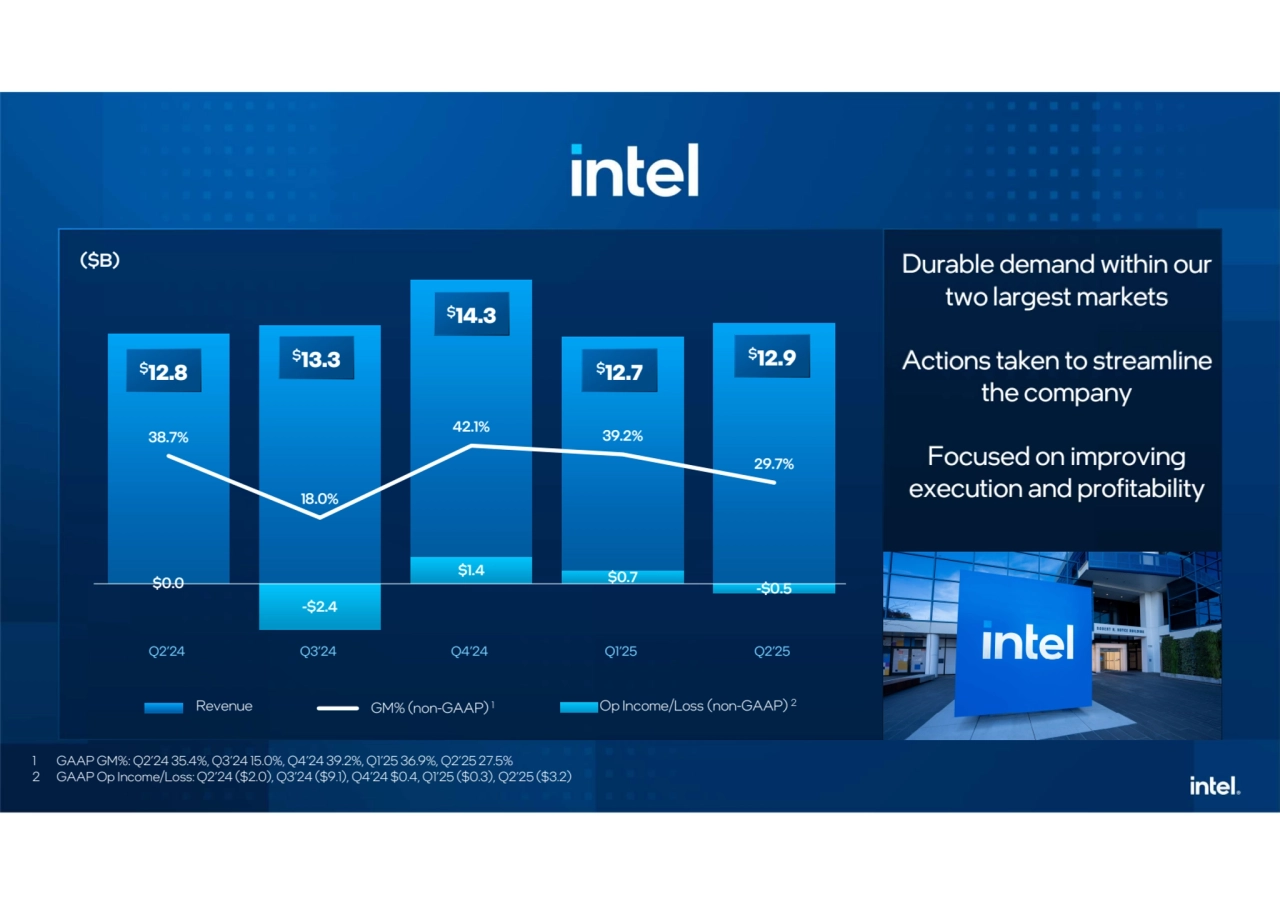
- 7. $0.0 -$2.4 $1.4 $0.7 -$0.5 38.7% 18.0% 42.1% 39.2% 29.7% Durable demand within our two largest markets Actions taken to streamline the company Focused on improving execution and profitability Durable demand within our two largest markets Actions taken to streamline the company Focused on improving execution and profitability GM% (non-GAAP) Revenue 1 Op Income/Loss (non-GAAP) 2 ($B) $12.8 $13.3 $14.3 $12.7 Q2’24 Q3’24 Q4’24 Q1’25 Q2’25 $12.9 1 GAAP GM%: Q2’24 35.4%, Q3’24 15.0%, Q4’24 39.2%, Q1’25 36.9%, Q2’25 27.5% 2 GAAP Op Income/Loss: Q2’24 ($2.0), Q3’24 ($9.1), Q4’24 $0.4, Q1’25 ($0.3), Q2’25 ($3.2)
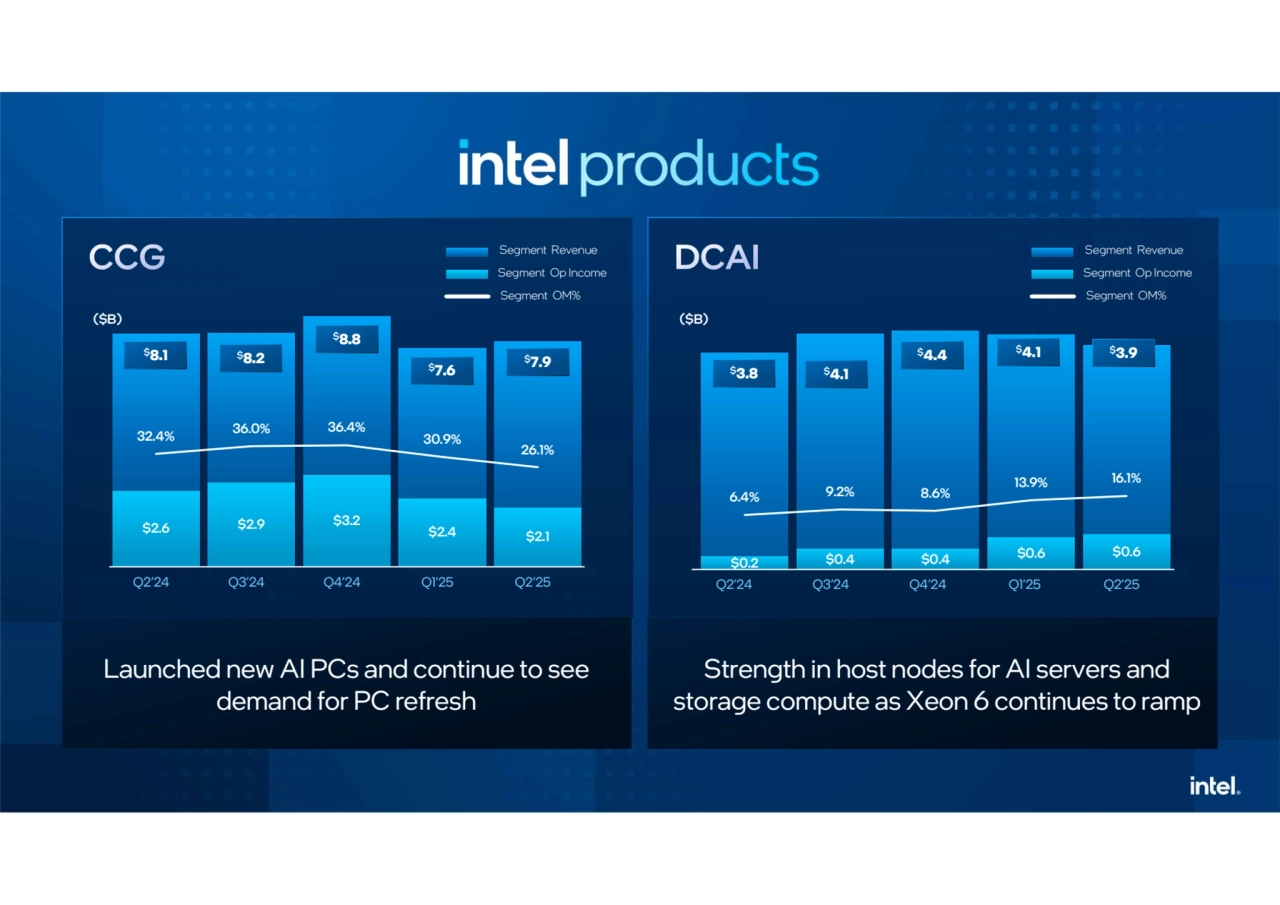
- 8. $2.6 $2.9 $3.2 $2.4 $2.1 32.4% 36.0% 36.4% 30.9% 26.1% $0.2 $0.4 $0.4 $0.6 $0.6 6.4% 9.2% 8.6% 13.9% 16.1% Strength in host nodes for AI servers and storage compute as Xeon 6 continues to ramp Launched new AI PCs and continue to see demand for PC refresh Segment OM% Segment Revenue Segment Op Income ($B) $3.9 $3.8 $4.1 $4.4 $4.1 Segment OM% Segment Revenue Segment Op Income $7.9 $8.1 $8.2 $8.8 $7.6 ($B) Q2’24 Q3’24 Q4’24 Q1’25 Q2’25 Q2’24 Q3’24 Q4’24 Q1’25 Q2’25
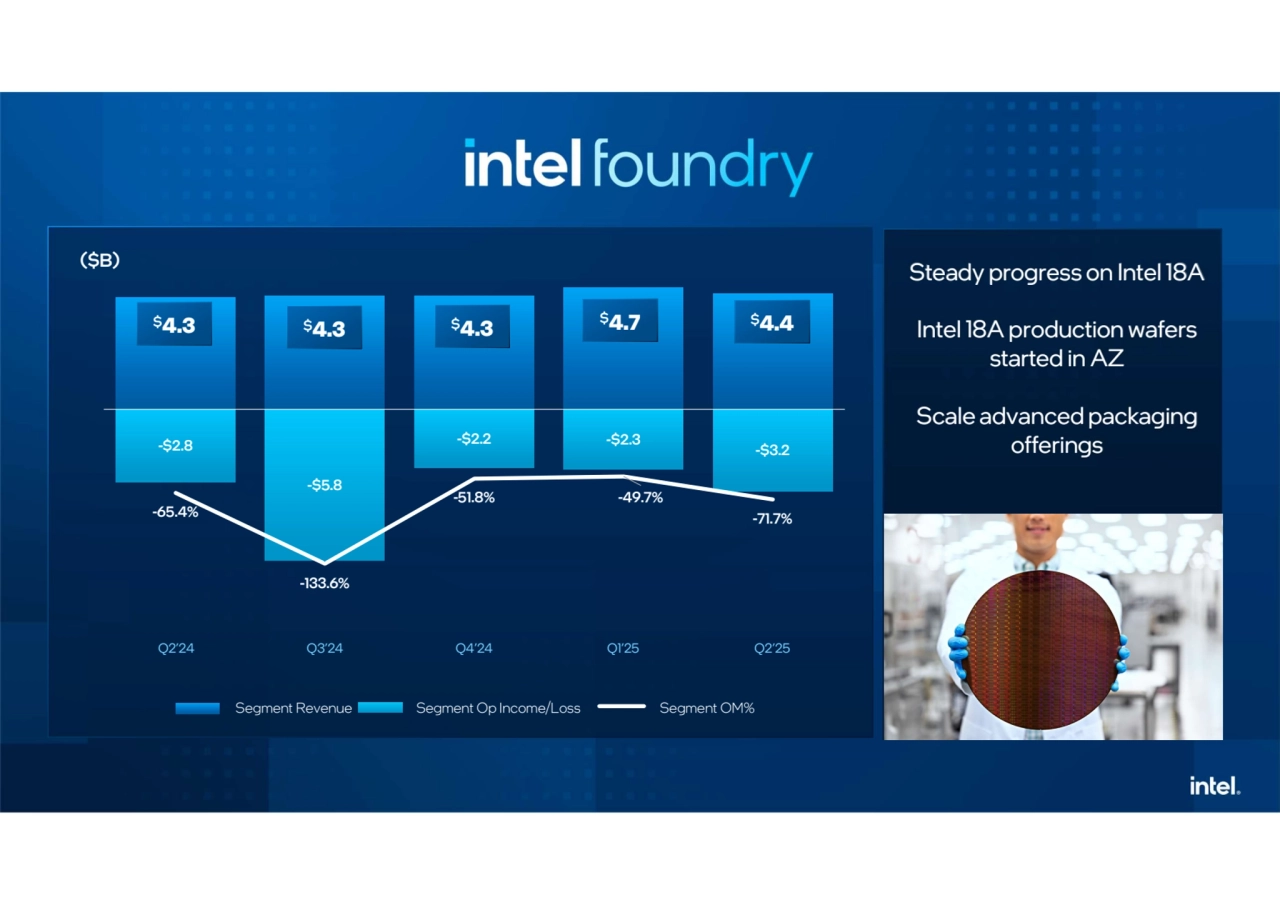
- 9. -$2.8 -$5.8 -$2.2 -$2.3 -$3.2 -65.4% -133.6% -51.8% -49.7% -71.7% Steady progress on Intel 18A Intel 18A production wafers started in AZ Scale advanced packaging offerings ($B) Segment Revenue Segment Op Income/Loss Segment OM% Q2’24 Q3’24 Q4’24 Q1’25 Q2’25 $4.3 $4.3 $4.3 $4.4 $4.7
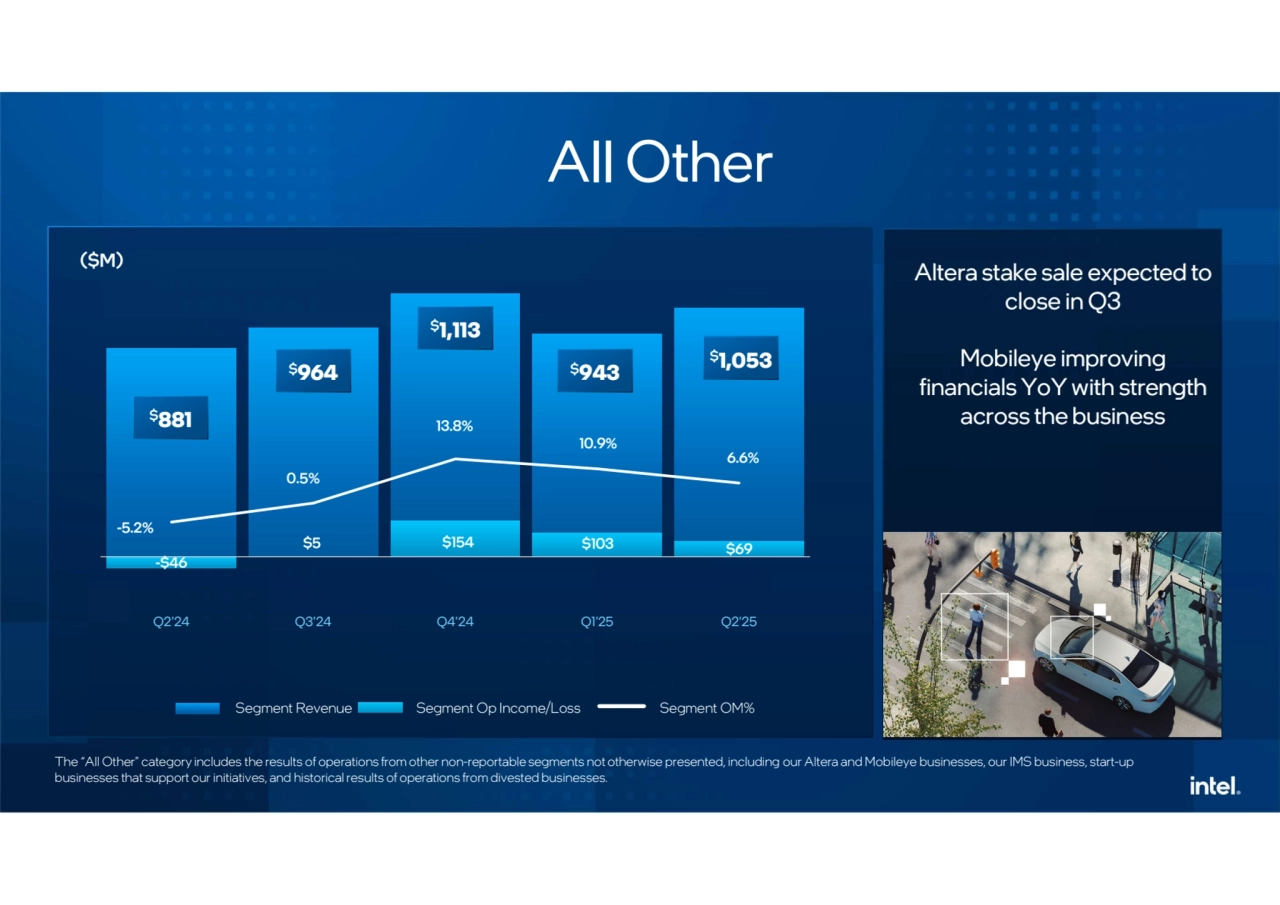
- 10. -$46 $5 $154 $103 $69 -5.2% 0.5% 13.8% 10.9% 6.6% Q2'24 Q3'24 Q4'24 Q1'25 Q2'25 Altera stake sale expected to close in Q3 Mobileye improving financials YoY with strength across the business ($M) $1,053 $881 $964 $1,113 $943 All Other The “All Other" category includes the results of operations from other non-reportable segments not otherwise presented, including our Altera and Mobileye businesses, our IMS business, start-up businesses that support our initiatives, and historical results of operations from divested businesses. Segment Revenue Segment Op Income/Loss Segment OM%
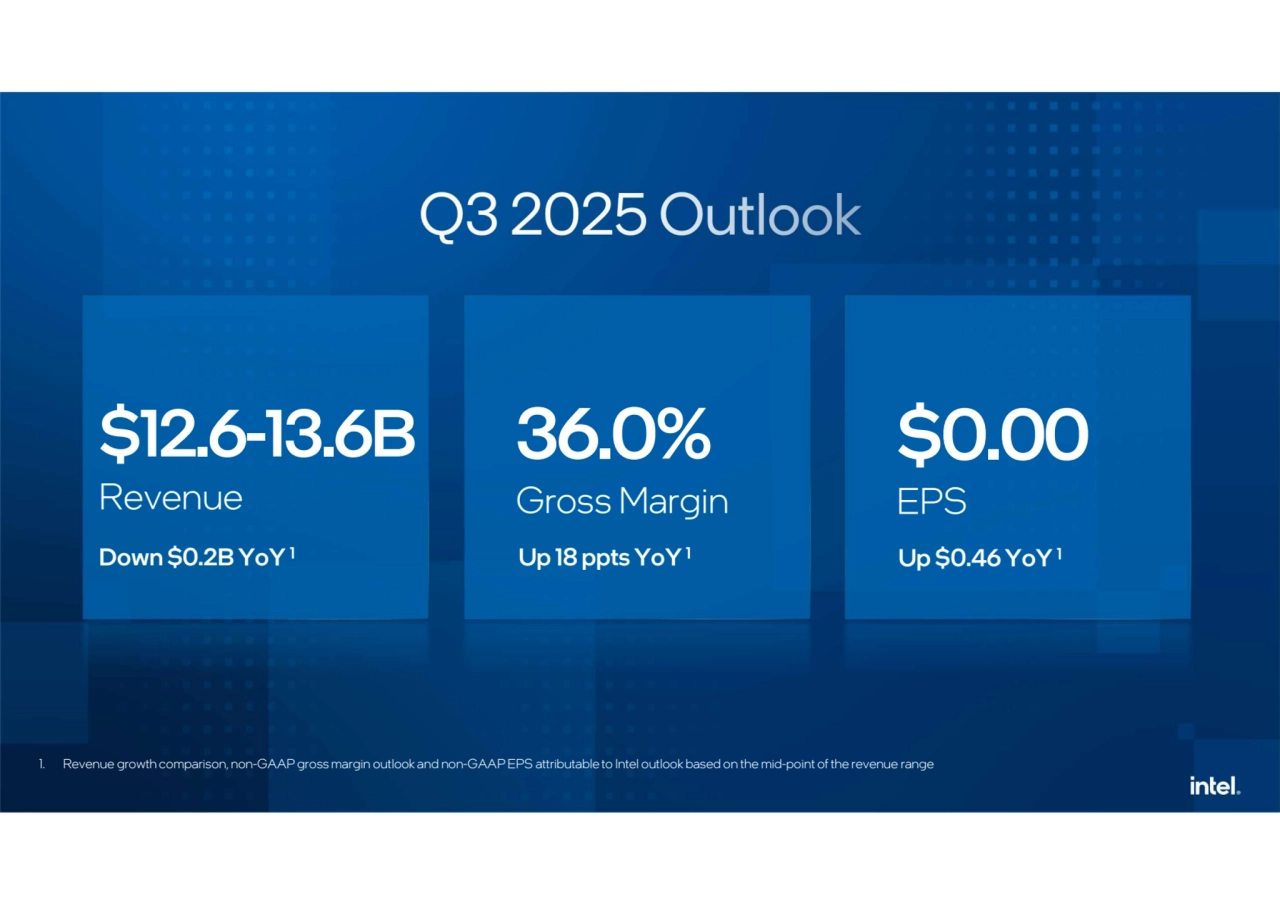
- 12. 1. Revenue growth comparison, non-GAAP gross margin outlook and non-GAAP EPS attributable to Intel outlook based on the mid-point of the revenue range $12.6-13.6B Revenue 36.0% Gross Margin $0.00 EPS Down $0.2B YoY 1 Up 18 ppts YoY 1 Up $0.46 YoY 1
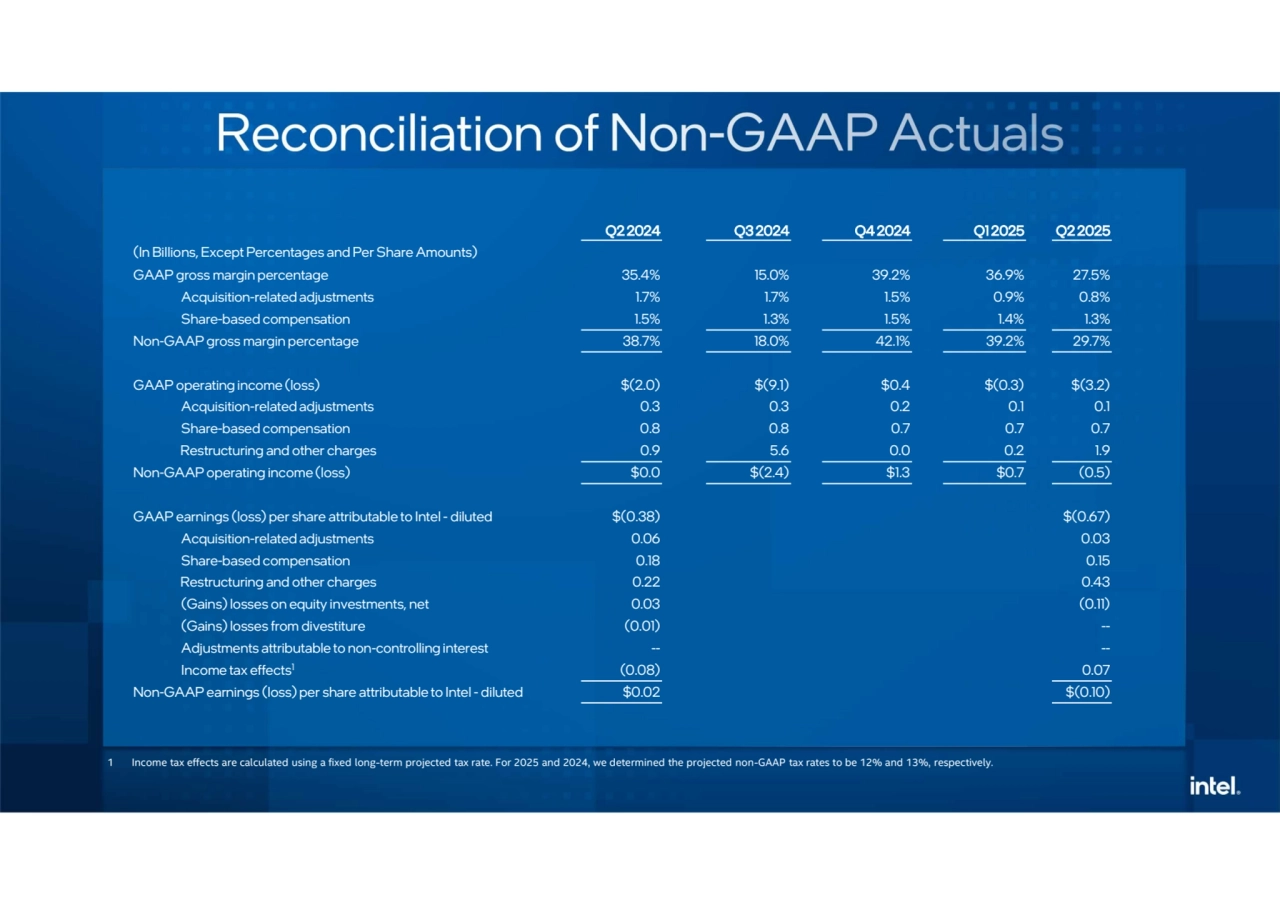
- 15. Q2 2024 Q3 2024 Q4 2024 Q1 2025 Q2 2025 (In Billions, Except Percentages and Per Share Amounts) GAAP gross margin percentage 35.4% 15.0% 39.2% 36.9% 27.5% Acquisition-related adjustments 1.7% 1.7% 1.5% 0.9% 0.8% Share-based compensation 1.5% 1.3% 1.5% 1.4% 1.3% Non-GAAP gross margin percentage 38.7% 18.0% 42.1% 39.2% 29.7% GAAP operating income (loss) $(2.0) $(9.1) $0.4 $(0.3) $(3.2) Acquisition-related adjustments 0.3 0.3 0.2 0.1 0.1 Share-based compensation 0.8 0.8 0.7 0.7 0.7 Restructuring and other charges 0.9 5.6 0.0 0.2 1.9 Non-GAAP operating income (loss) $0.0 $(2.4) $1.3 $0.7 (0.5) GAAP earnings (loss) per share attributable to Intel - diluted $(0.38) $(0.67) Acquisition-related adjustments 0.06 0.03 Share-based compensation 0.18 0.15 Restructuring and other charges 0.22 0.43 (Gains) losses on equity investments, net 0.03 (0.11) (Gains) losses from divestiture (0.01) -- Adjustments attributable to non-controlling interest -- -- Income tax effects (0.08) 0.07 1 Non-GAAP earnings (loss) per share attributable to Intel - diluted $0.02 $(0.10) 1 Income tax effects are calculated using a fixed long-term projected tax rate. For 2025 and 2024, we determined the projected non-GAAP tax rates to be 12% and 13%, respectively.
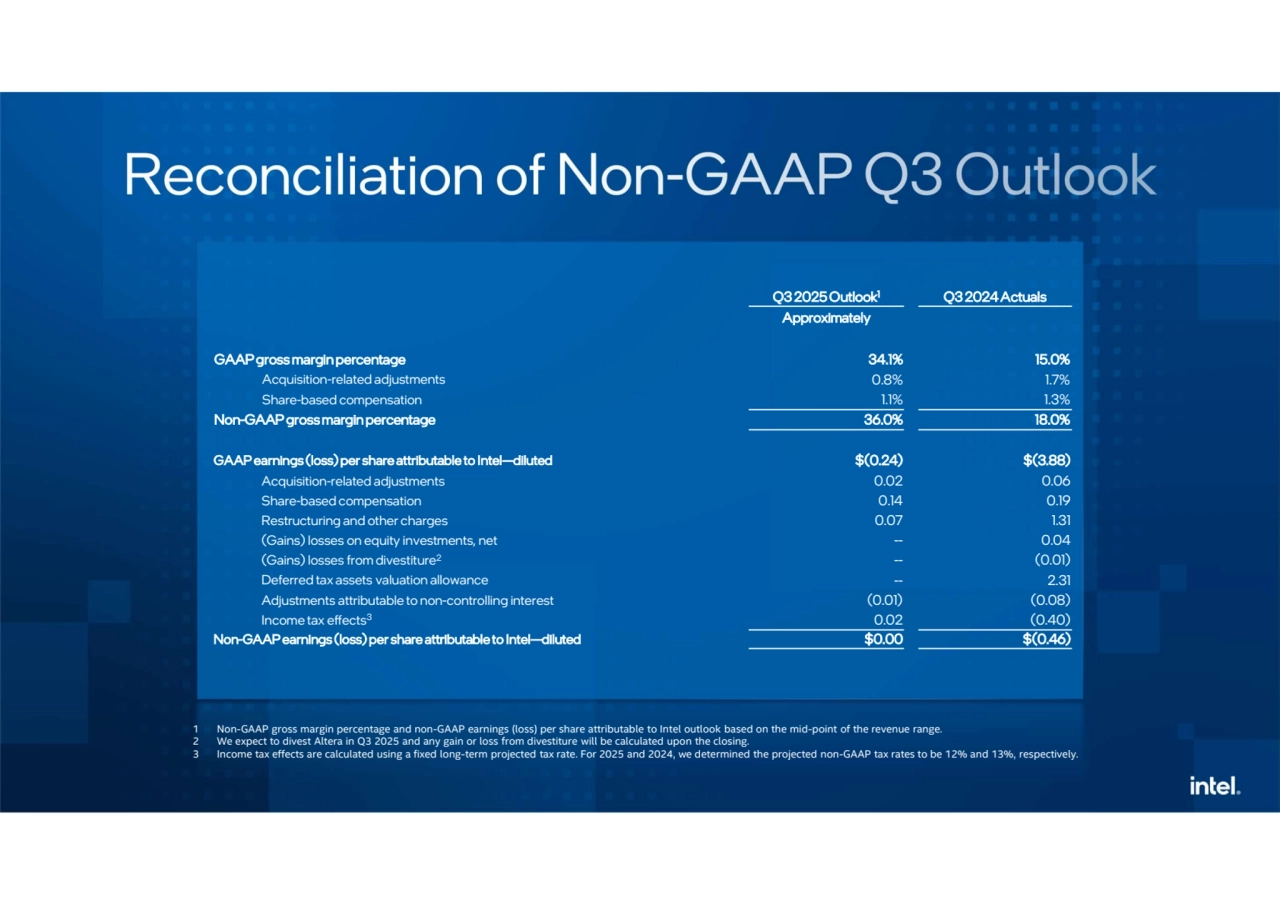
- 16. Q3 2025 Outlook Q3 2024 Actuals 1 Approximately GAAP gross margin percentage 34.1% 15.0% Acquisition-related adjustments 0.8% 1.7% Share-based compensation 1.1% 1.3% Non-GAAP gross margin percentage 36.0% 18.0% GAAP earnings (loss) per share attributable to Intel—diluted $(0.24) $(3.88) Acquisition-related adjustments 0.02 0.06 Share-based compensation 0.14 0.19 Restructuring and other charges 0.07 1.31 (Gains) losses on equity investments, net -- 0.04 (Gains) losses from divestiture -- (0.01) 2 Deferred tax assets valuation allowance -- 2.31 Adjustments attributable to non-controlling interest (0.01) (0.08) Income tax effects 0.02 (0.40) 3 Non-GAAP earnings (loss) per share attributable to Intel—diluted $0.00 $(0.46) 1 Non-GAAP gross margin percentage and non-GAAP earnings (loss) per share attributable to Intel outlook based on the mid-point of the revenue range. 2 We expect to divest Altera in Q3 2025 and any gain or loss from divestiture will be calculated upon the closing. 3 Income tax effects are calculated using a fixed long-term projected tax rate. For 2025 and 2024, we determined the projected non-GAAP tax rates to be 12% and 13%, respectively.
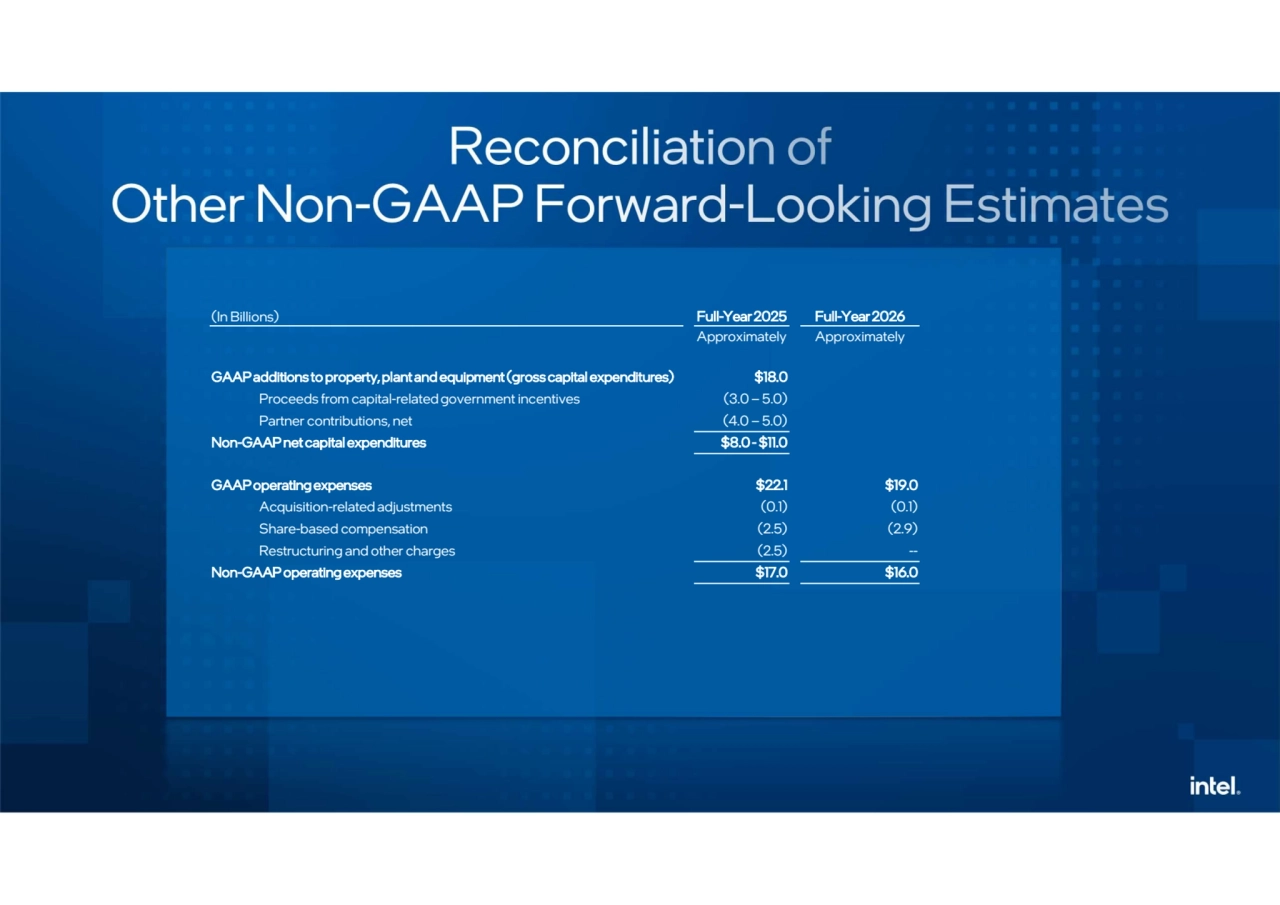
- 17. (In Billions) Full-Year 2025 Full-Year 2026 Approximately Approximately GAAP additions to property, plant and equipment (gross capital expenditures) $18.0 Proceeds from capital-related government incentives (3.0 – 5.0) Partner contributions, net (4.0 – 5.0) Non-GAAP net capital expenditures $8.0 - $11.0 GAAP operating expenses $22.1 $19.0 Acquisition-related adjustments (0.1) (0.1) Share-based compensation (2.5) (2.9) Restructuring and other charges (2.5) -- Non-GAAP operating expenses $17.0 $16.0
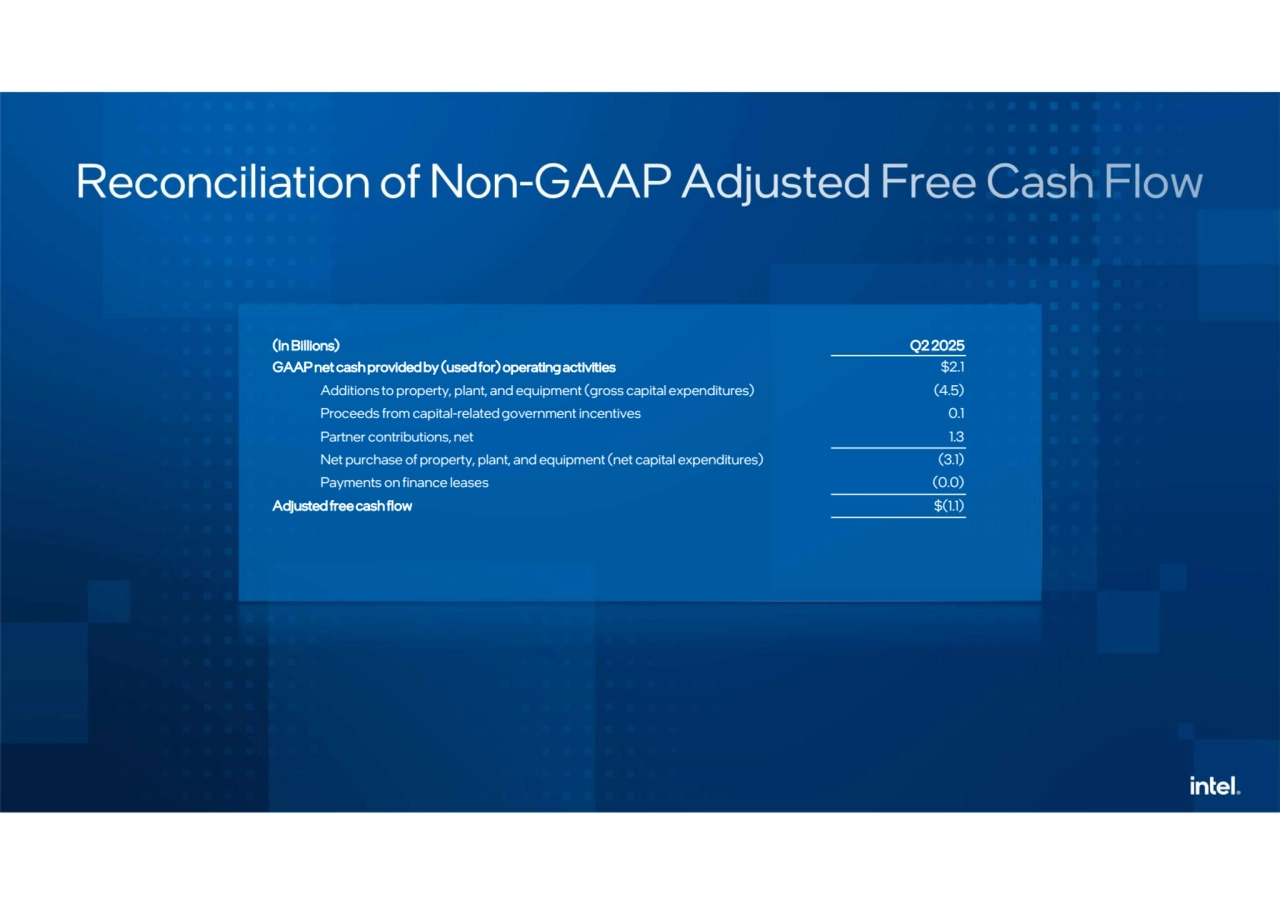
- 18. (In Billions) Q2 2025 GAAP net cash provided by (used for) operating activities $2.1 Additions to property, plant, and equipment (gross capital expenditures) (4.5) Proceeds from capital-related government incentives 0.1 Partner contributions, net 1.3 Net purchase of property, plant, and equipment (net capital expenditures) (3.1) Payments on finance leases (0.0) Adjusted free cash flow $(1.1)