INVESTOR CALL FY25 Q4 July 29, 2025 Northeast Bank
 AI Summary
Key Insights
- 📊 Financial Highlights: Northeast Bank reports its Q4 FY25 and Year-to-Date FY25 financial data, including total loan volume and net income.
- 🏦 National Lending Division: Details on purchased, originated, and SBA loans, along with the net interest margin and purchased loan return.
- 📈 Loan Portfolio Summary: Provides the number of loans, total balance, average balance, and WA LTV for different loan portfolios.
- 🔑 Asset Quality Metrics: Key metrics such as NPAs, NPLs, Classified Commercial Loans, and Allowance for Credit Losses/Gross Loans.
- 💰 Deposit Portfolio Changes: Overview of changes in deposit balances, WAR (Weighted Average Rate), and mix by channels and products.

INVESTOR CALL FY25 Q4 July 29, 2025 Northeast Bank
- 1. INVESTOR CALL FY25 Q4 July 29, 2025
- 2. FORWARD-LOOKING STATEMENT Statements in this presentation that are not historical facts are forward-looking statements within the meaning of Section 27A of the Securities Act of 1933, as amended, and Section 21E of the Securities Exchange Act of 1934, as amended, and are intended to be covered by the safe harbor provisions of the Private Securities Litigation Reform Act of 1995. Although the Bank believes that these forward-looking statements are based on reasonable estimates and assumptions, they are not guarantees of future performance and are subject to known and unknown risks, uncertainties, and other factors. You should not place undue reliance on our forward-looking statements. You should exercise caution in interpreting and relying on forward-looking statements because they are subject to significant risks, uncertainties and other factors which are, in some cases, beyond the Bank’s control. The Bank’s actual results could differ materially from those projected in the forward-looking statements as a result of, among other factors, changes in employment levels, general business and economic conditions on a national basis and in the local markets in which the Bank operates; changes in customer behavior due to changing business and economic conditions (including inflation and concerns about liquidity) or legislative or regulatory initiatives; the possibility that future credit losses are higher than currently expected due to changes in economic assumptions, customer behavior or adverse economic developments; turbulence in the capital and debt markets; changes in interest rates and real estate values; competitive pressures from other financial institutions; changes in loan defaults and charge-off rates; changes in the value of securities and other assets, adequacy of credit loss reserves, or deposit levels necessitating increased borrowing to fund loans and investments; changing government regulation; operational risks including, but not limited to, cybersecurity, fraud, natural disasters, climate change and future pandemics; the risk that the Bank may not be successful in the implementation of its business strategy; the risk that intangibles recorded in the Bank’s financial statements will become impaired; and the other risks and uncertainties detailed in the Bank’s Annual Report on Form 10-K, as amended by Amendment No. 1 to the Annual Report on Form 10-K/A as updated in the Bank’s Quarterly Reports on Form 10-Q and other filings submitted to the FDIC. These forward-looking statements speak only as of the date of this report and the Bank does not undertake any obligation to update or revise any of these forward-looking statements to reflect events or circumstances occurring after the date of this report or to reflect the occurrence of unanticipated events.
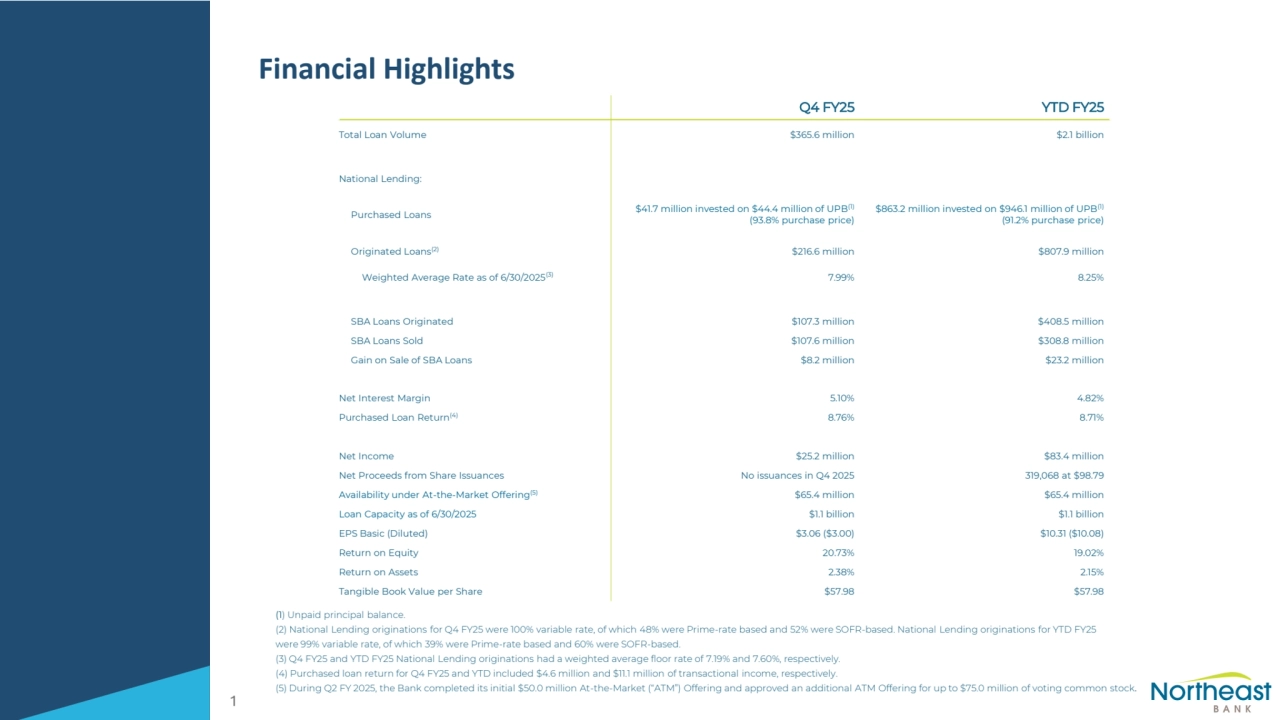
- 3. Financial Highlights (1) Unpaid principal balance. (2) National Lending originations for Q4 FY25 were 100% variable rate, of which 48% were Prime-rate based and 52% were SOFR-based. National Lending originations for YTD FY25 were 99% variable rate, of which 39% were Prime-rate based and 60% were SOFR-based. (3) Q4 FY25 and YTD FY25 National Lending originations had a weighted average floor rate of 7.19% and 7.60%, respectively. (4) Purchased loan return for Q4 FY25 and YTD included $4.6 million and $11.1 million of transactional income, respectively. (5) During Q2 FY 2025, the Bank completed its initial $50.0 million At-the-Market (“ATM”) Offering and approved an additional ATM Offering for up to $75.0 million of voting common stock. 1 Q4 FY25 YTD FY25 Total Loan Volume $365.6 million $2.1 billion National Lending: Purchased Loans $41.7 million invested on $44.4 million of UPB(1) (93.8% purchase price) $863.2 million invested on $946.1 million of UPB(1) (91.2% purchase price) Originated Loans(2) $216.6 million $807.9 million Weighted Average Rate as of 6/30/2025(3) 7.99% 8.25% SBA Loans Originated $107.3 million $408.5 million SBA Loans Sold $107.6 million $308.8 million Gain on Sale of SBA Loans $8.2 million $23.2 million Net Interest Margin 5.10% 4.82% Purchased Loan Return(4) 8.76% 8.71% Net Income $25.2 million $83.4 million Net Proceeds from Share Issuances No issuances in Q4 2025 319,068 at $98.79 Availability under At-the-Market Offering(5) $65.4 million $65.4 million Loan Capacity as of 6/30/2025 $1.1 billion $1.1 billion EPS Basic (Diluted) $3.06 ($3.00) $10.31 ($10.08) Return on Equity 20.73% 19.02% Return on Assets 2.38% 2.15% Tangible Book Value per Share $57.98 $57.98
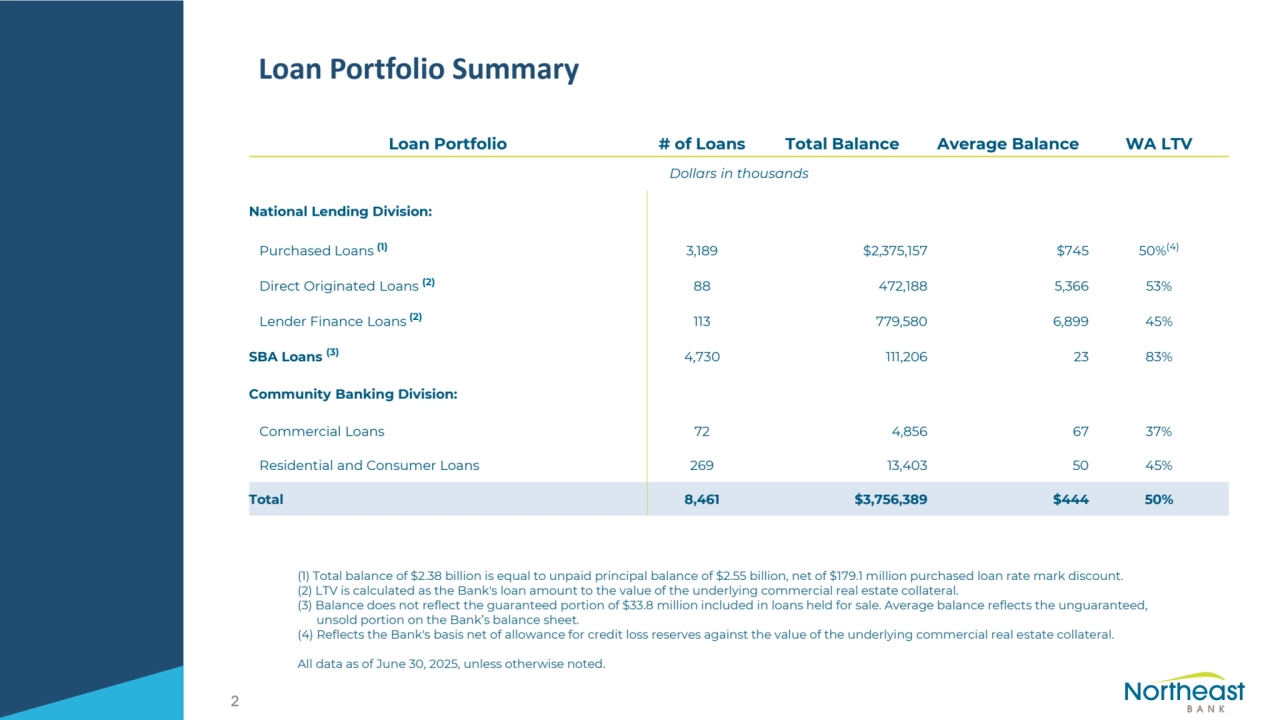
- 4. Loan Portfolio Summary (1) Total balance of $2.38 billion is equal to unpaid principal balance of $2.55 billion, net of $179.1 million purchased loan rate mark discount. (2) LTV is calculated as the Bank's loan amount to the value of the underlying commercial real estate collateral. (3) Balance does not reflect the guaranteed portion of $33.8 million included in loans held for sale. Average balance reflects the unguaranteed, unsold portion on the Bank’s balance sheet. (4) Reflects the Bank's basis net of allowance for credit loss reserves against the value of the underlying commercial real estate collateral. All data as of June 30, 2025, unless otherwise noted. 2 Loan Portfolio # of Loans Total Balance Average Balance WA LTV Dollars in thousands National Lending Division: Purchased Loans (1) 3,189 $2,375,157 $745 50%(4) Direct Originated Loans (2) 88 472,188 5,366 53% Lender Finance Loans (2) 113 779,580 6,899 45% SBA Loans (3) 4,730 111,206 23 83% Community Banking Division: Commercial Loans 72 4,856 67 37% Residential and Consumer Loans 269 13,403 50 45% Total 8,461 $3,756,389 $444 50%
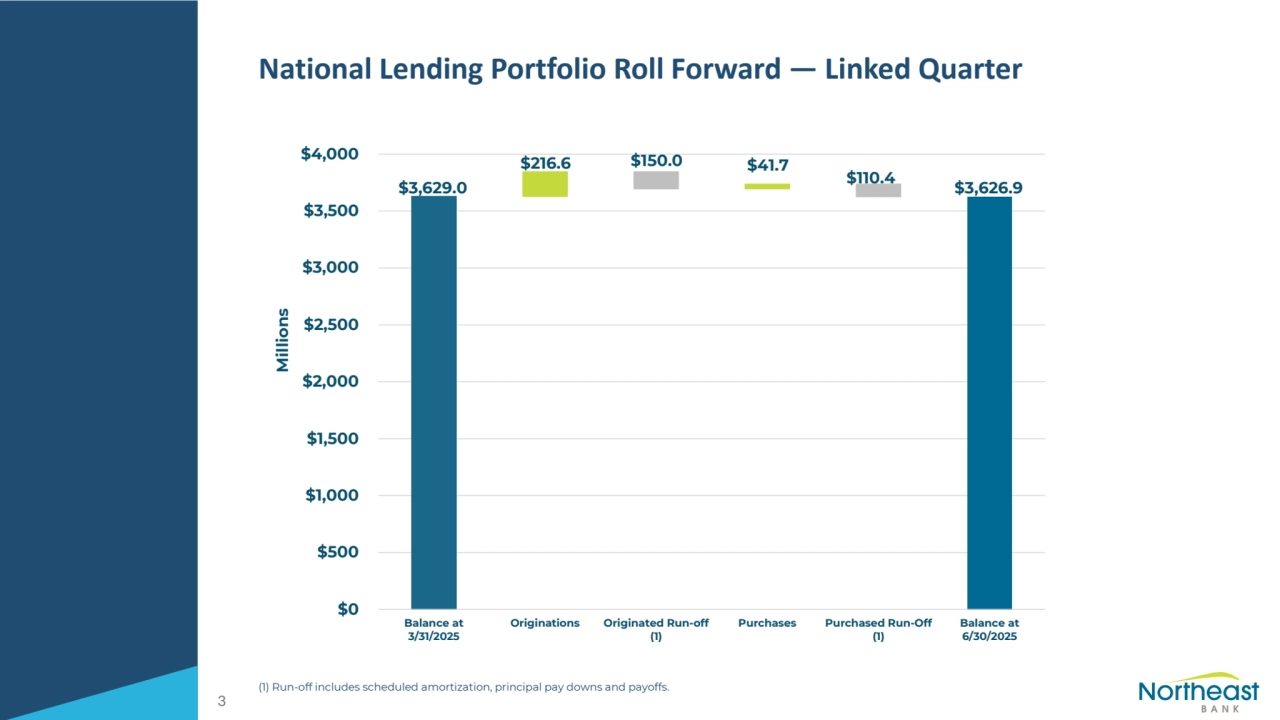
- 5. National Lending Portfolio Roll Forward — Linked Quarter (1) Run-off includes scheduled amortization, principal pay downs and payoffs. 3 $3,629.0 $3,626.9 $216.6 $150.0 $41.7 $110.4 $0 $500 $1,000 $1,500 $2,000 $2,500 $3,000 $3,500 $4,000 Balance at 3/31/2025 Originations Originated Run-off (1) Purchases Purchased Run-Off (1) Balance at 6/30/2025 Millions
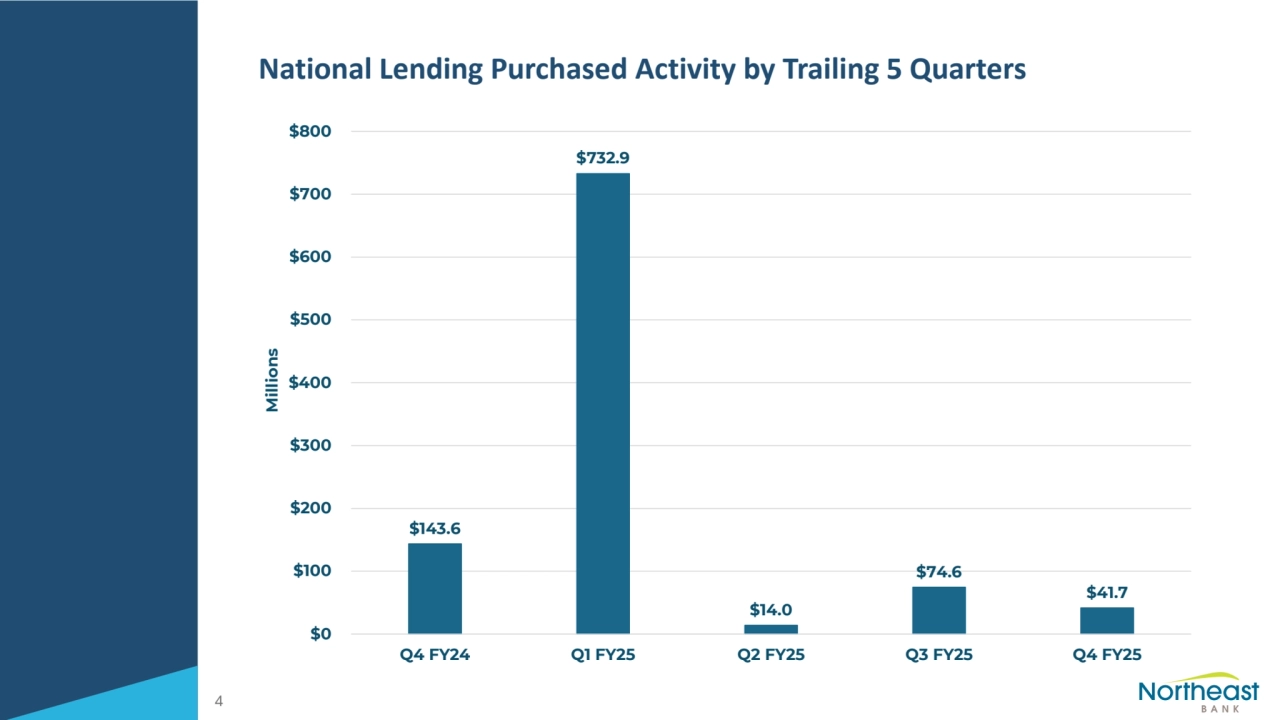
- 6. National Lending Purchased Activity by Trailing 5 Quarters 4 $143.6 $732.9 $14.0 $74.6 $41.7 $0 $100 $200 $300 $400 $500 $600 $700 $800 Q4 FY24 Q1 FY25 Q2 FY25 Q3 FY25 Q4 FY25 Millions
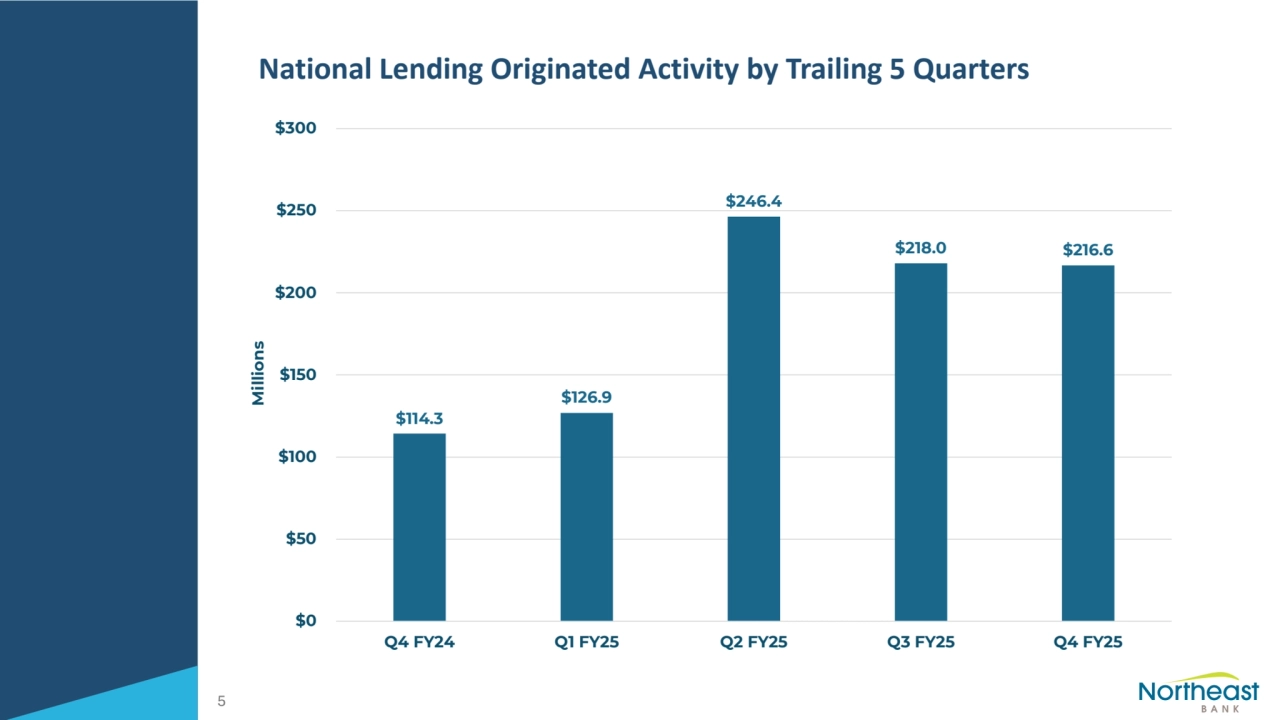
- 7. National Lending Originated Activity by Trailing 5 Quarters 5 $114.3 $126.9 $246.4 $218.0 $216.6 $0 $50 $100 $150 $200 $250 $300 Q4 FY24 Q1 FY25 Q2 FY25 Q3 FY25 Q4 FY25 Millions
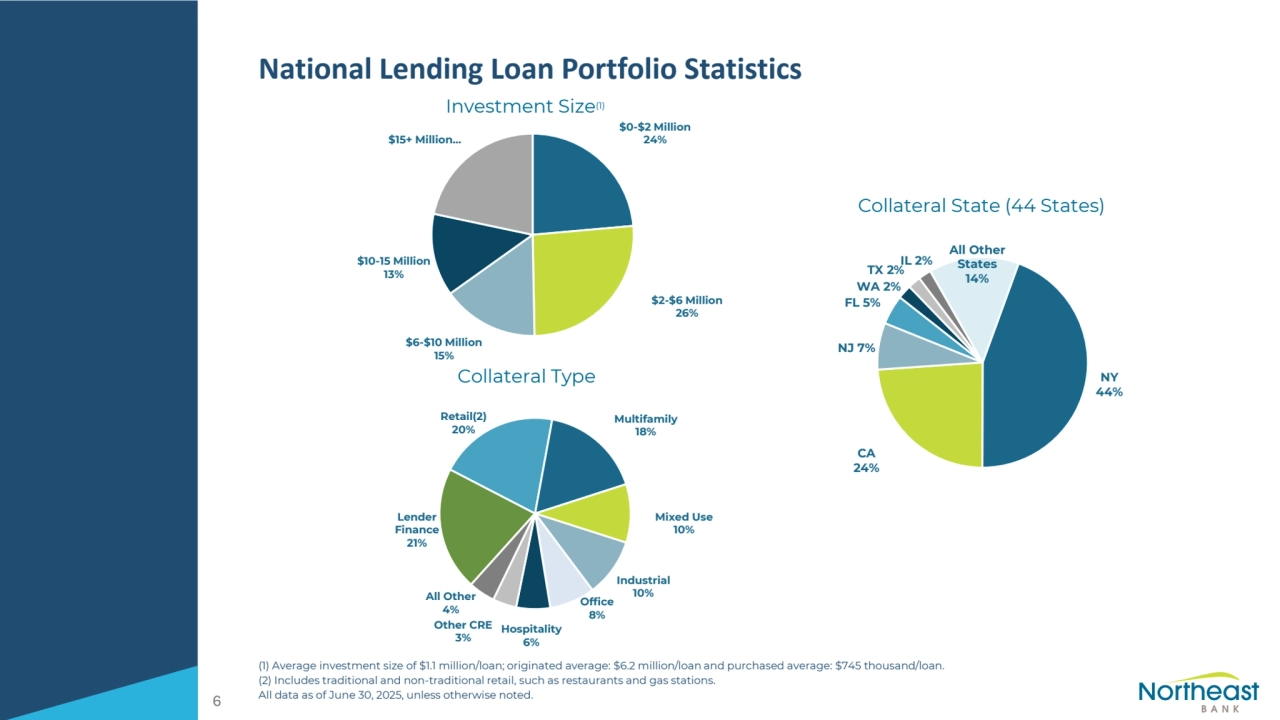
- 8. National Lending Loan Portfolio Statistics (1) Average investment size of $1.1 million/loan; originated average: $6.2 million/loan and purchased average: $745 thousand/loan. (2) Includes traditional and non-traditional retail, such as restaurants and gas stations. All data as of June 30, 2025, unless otherwise noted. Investment Size(1) Collateral State (44 States) Collateral Type 6 $0-$2 Million 24% $2-$6 Million 26% $6-$10 Million 15% $10-15 Million 13% $15+ Million… NY 44% CA 24% NJ 7% FL 5% WA 2% TX 2% IL 2% All Other States 14% Lender Finance 21% Retail(2) 20% Multifamily 18% Mixed Use 10% Industrial 10% Office 8% Hospitality 6% Other CRE 3% All Other 4%
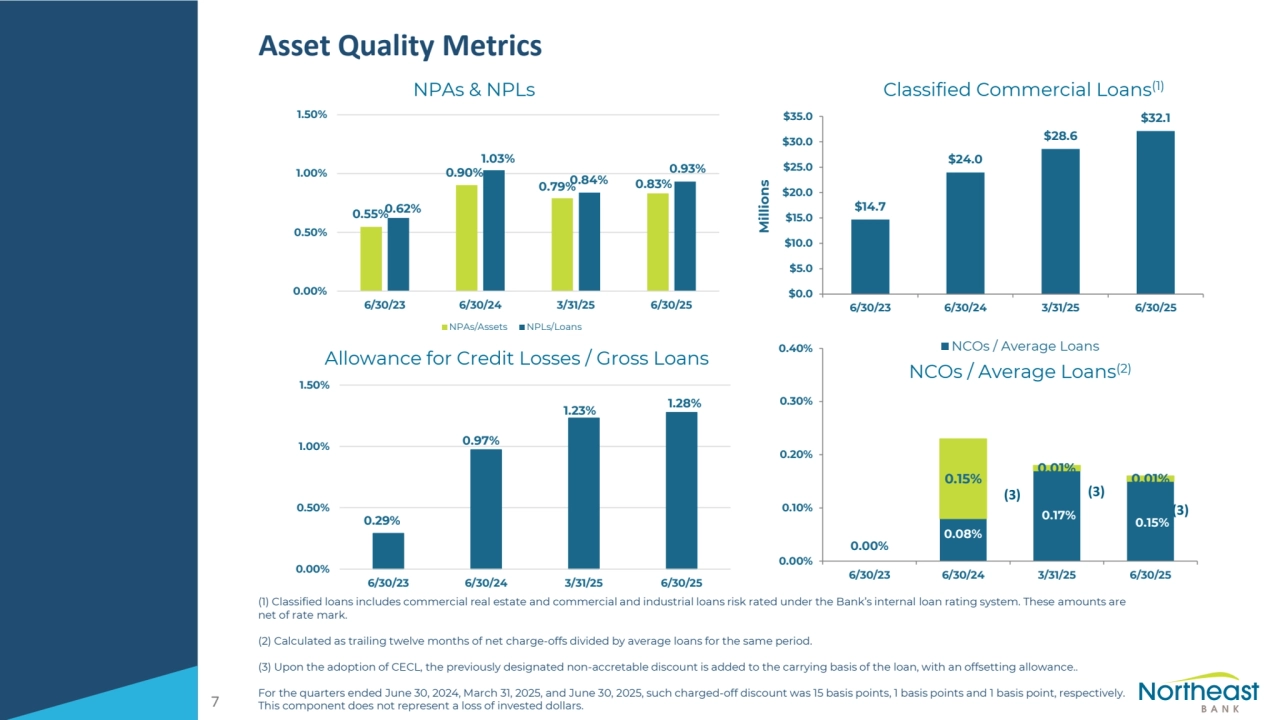
- 9. Asset Quality Metrics (1) Classified loans includes commercial real estate and commercial and industrial loans risk rated under the Bank’s internal loan rating system. These amounts are net of rate mark. (2) Calculated as trailing twelve months of net charge-offs divided by average loans for the same period. (3) Upon the adoption of CECL, the previously designated non-accretable discount is added to the carrying basis of the loan, with an offsetting allowance.. For the quarters ended June 30, 2024, March 31, 2025, and June 30, 2025, such charged-off discount was 15 basis points, 1 basis points and 1 basis point, respectively. This component does not represent a loss of invested dollars. NPAs & NPLs Classified Commercial Loans(1) Allowance for Credit Losses / Gross Loans NCOs / Average Loans(2) (3) (3) (3) 7 0.55% 0.90% 0.79% 0.83% 0.62% 1.03% 0.84% 0.93% 0.00% 0.50% 1.00% 1.50% 6/30/23 6/30/24 3/31/25 6/30/25 NPAs/Assets NPLs/Loans 0.29% 0.97% 1.23% 1.28% 0.00% 0.50% 1.00% 1.50% 6/30/23 6/30/24 3/31/25 6/30/25 0.00% 0.08% 0.17% 0.15% 0.15% 0.01% 0.01% 0.00% 0.10% 0.20% 0.30% 0.40% 6/30/23 6/30/24 3/31/25 6/30/25 NCOs / Average Loans $14.7 $24.0 $28.6 $32.1 $0.0 $5.0 $10.0 $15.0 $20.0 $25.0 $30.0 $35.0 6/30/23 6/30/24 3/31/25 6/30/25 Millions
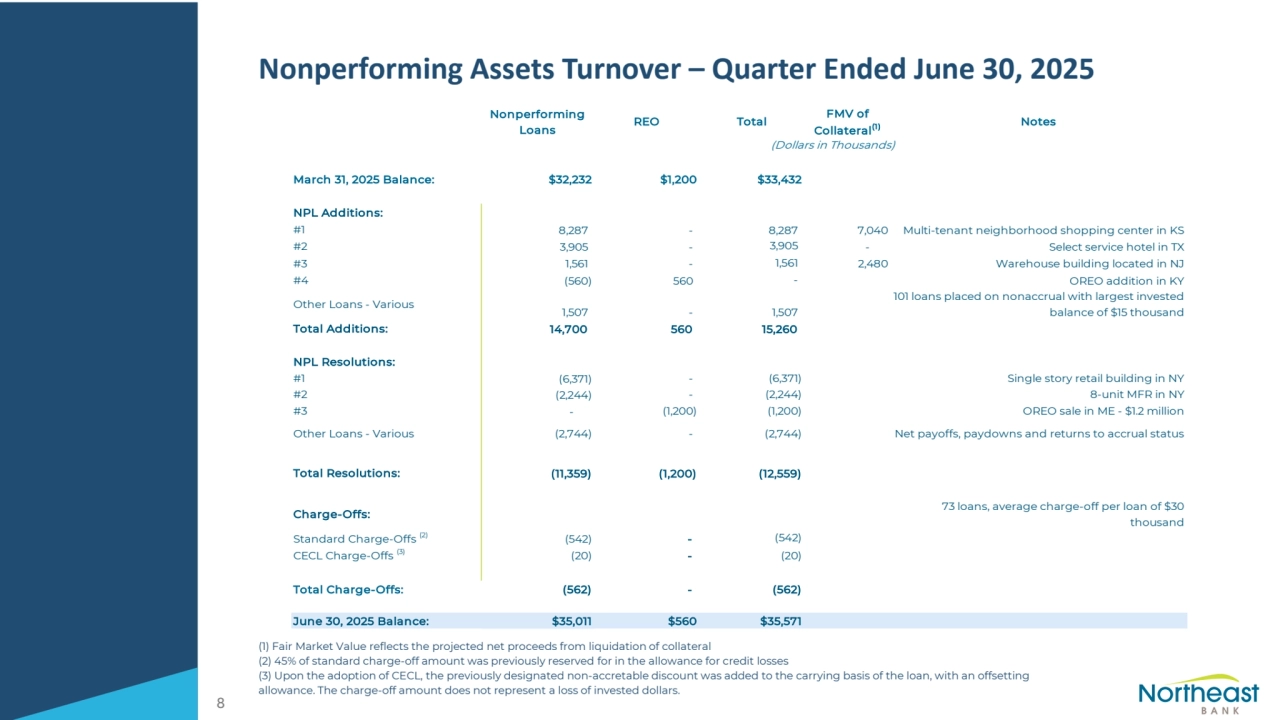
- 10. Nonperforming Assets Turnover – Quarter Ended June 30, 2025 (1) Fair Market Value reflects the projected net proceeds from liquidation of collateral (2) 45% of standard charge-off amount was previously reserved for in the allowance for credit losses (3) Upon the adoption of CECL, the previously designated non-accretable discount was added to the carrying basis of the loan, with an offsetting allowance. The charge-off amount does not represent a loss of invested dollars. 8 Nonperforming Loans REO Total FMV of Collateral(1) Notes March 31, 2025 Balance: $32,232 $1,200 $33,432 NPL Additions: #1 8,287 - 8,287 7,040 Multi-tenant neighborhood shopping center in KS #2 3,905 - 3,905 - Select service hotel in TX #3 1,561 - 1,561 2,480 Warehouse building located in NJ #4 (560) 560 - OREO addition in KY Other Loans - Various 1,507 - 1,507 101 loans placed on nonaccrual with largest invested balance of $15 thousand Total Additions: 14,700 560 15,260 NPL Resolutions: #1 (6,371) - (6,371) Single story retail building in NY #2 (2,244) - (2,244) 8-unit MFR in NY #3 - (1,200) (1,200) OREO sale in ME - $1.2 million Other Loans - Various (2,744) - (2,744) Net payoffs, paydowns and returns to accrual status Total Resolutions: (11,359) (1,200) (12,559) Charge-Offs: 73 loans, average charge-off per loan of $30 thousand Standard Charge-Offs (2) (542) - (542) CECL Charge-Offs (3) (20) - (20) Total Charge-Offs: (562) - (562) June 30, 2025 Balance: $35,011 $560 $35,571 (Dollars in Thousands)
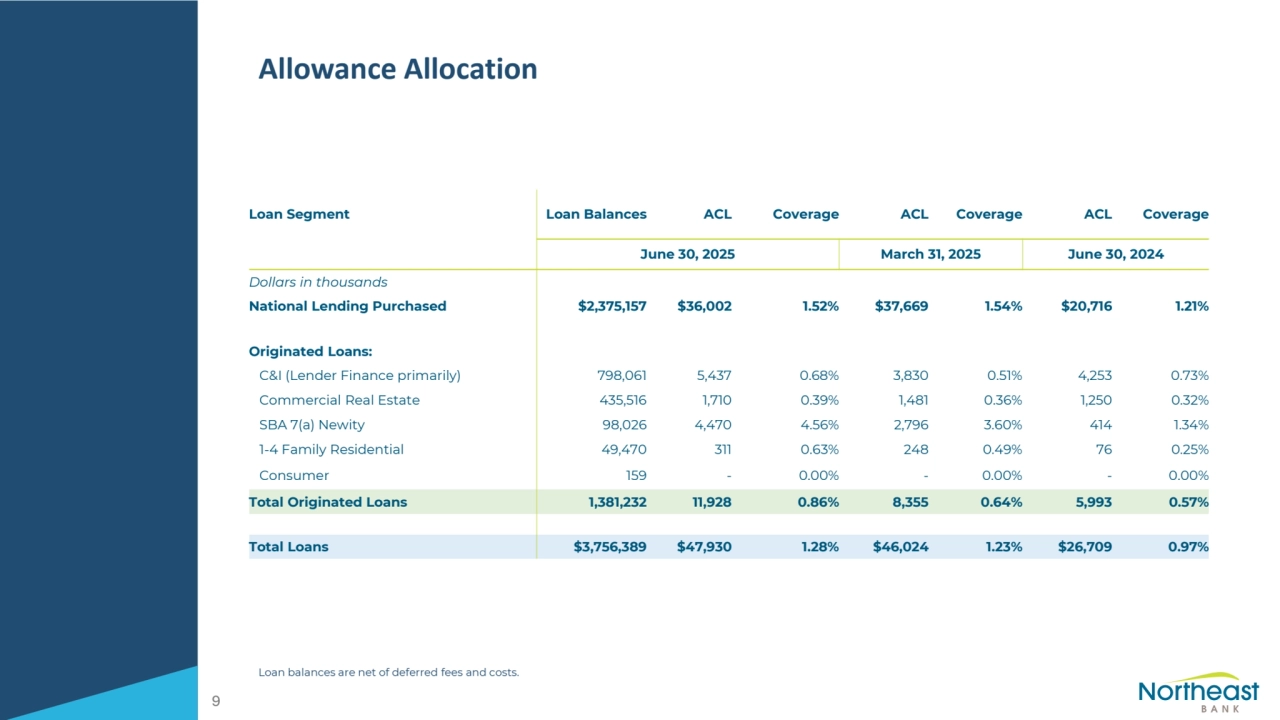
- 11. Allowance Allocation Loan balances are net of deferred fees and costs. 9 Loan Segment Loan Balances ACL Coverage ACL Coverage ACL Coverage June 30, 2025 March 31, 2025 June 30, 2024 Dollars in thousands National Lending Purchased $2,375,157 $36,002 1.52% $37,669 1.54% $20,716 1.21% Originated Loans: C&I (Lender Finance primarily) 798,061 5,437 0.68% 3,830 0.51% 4,253 0.73% Commercial Real Estate 435,516 1,710 0.39% 1,481 0.36% 1,250 0.32% SBA 7(a) Newity 98,026 4,470 4.56% 2,796 3.60% 414 1.34% 1-4 Family Residential 49,470 311 0.63% 248 0.49% 76 0.25% Consumer 159 - 0.00% - 0.00% - 0.00% Total Originated Loans 1,381,232 11,928 0.86% 8,355 0.64% 5,993 0.57% Total Loans $3,756,389 $47,930 1.28% $46,024 1.23% $26,709 0.97%
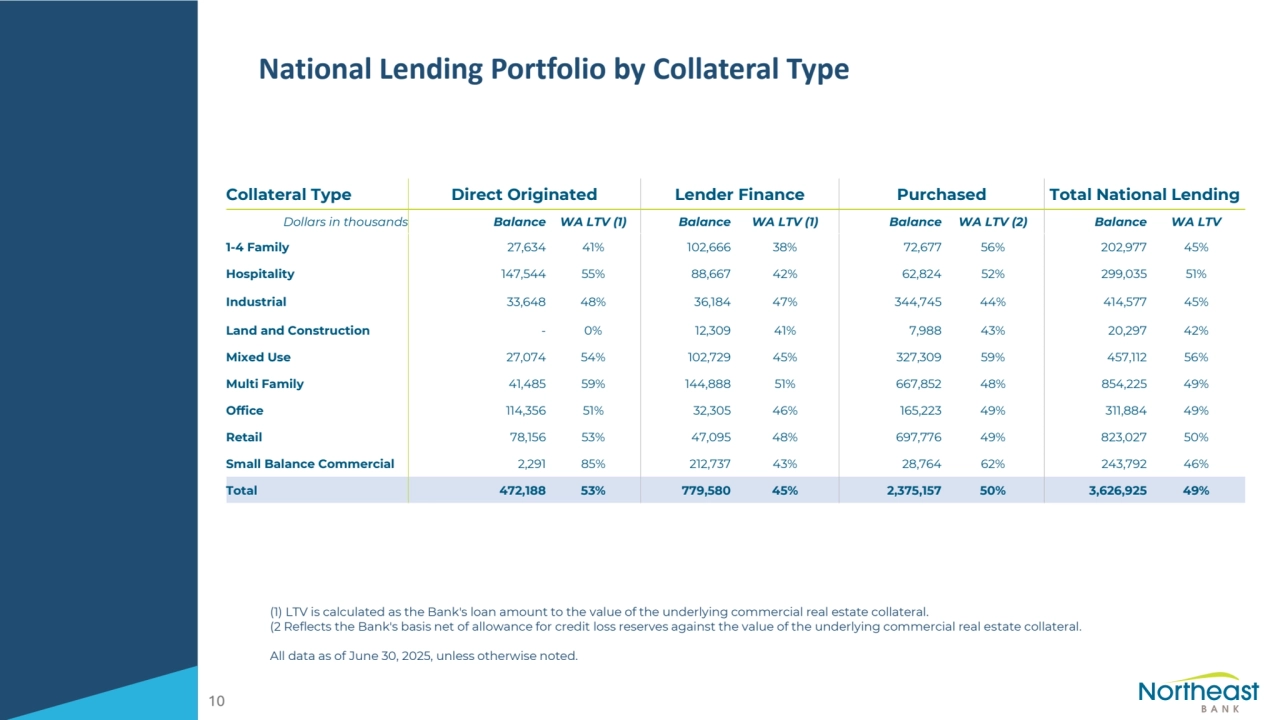
- 12. National Lending Portfolio by Collateral Type (1) LTV is calculated as the Bank's loan amount to the value of the underlying commercial real estate collateral. (2 Reflects the Bank's basis net of allowance for credit loss reserves against the value of the underlying commercial real estate collateral. All data as of June 30, 2025, unless otherwise noted. 10 Collateral Type Direct Originated Lender Finance Purchased Total National Lending Dollars in thousands Balance WA LTV (1) Balance WA LTV (1) Balance WA LTV (2) Balance WA LTV 1-4 Family 27,634 41% 102,666 38% 72,677 56% 202,977 45% Hospitality 147,544 55% 88,667 42% 62,824 52% 299,035 51% Industrial 33,648 48% 36,184 47% 344,745 44% 414,577 45% Land and Construction - 0% 12,309 41% 7,988 43% 20,297 42% Mixed Use 27,074 54% 102,729 45% 327,309 59% 457,112 56% Multi Family 41,485 59% 144,888 51% 667,852 48% 854,225 49% Office 114,356 51% 32,305 46% 165,223 49% 311,884 49% Retail 78,156 53% 47,095 48% 697,776 49% 823,027 50% Small Balance Commercial 2,291 85% 212,737 43% 28,764 62% 243,792 46% Total 472,188 53% 779,580 45% 2,375,157 50% 3,626,925 49%
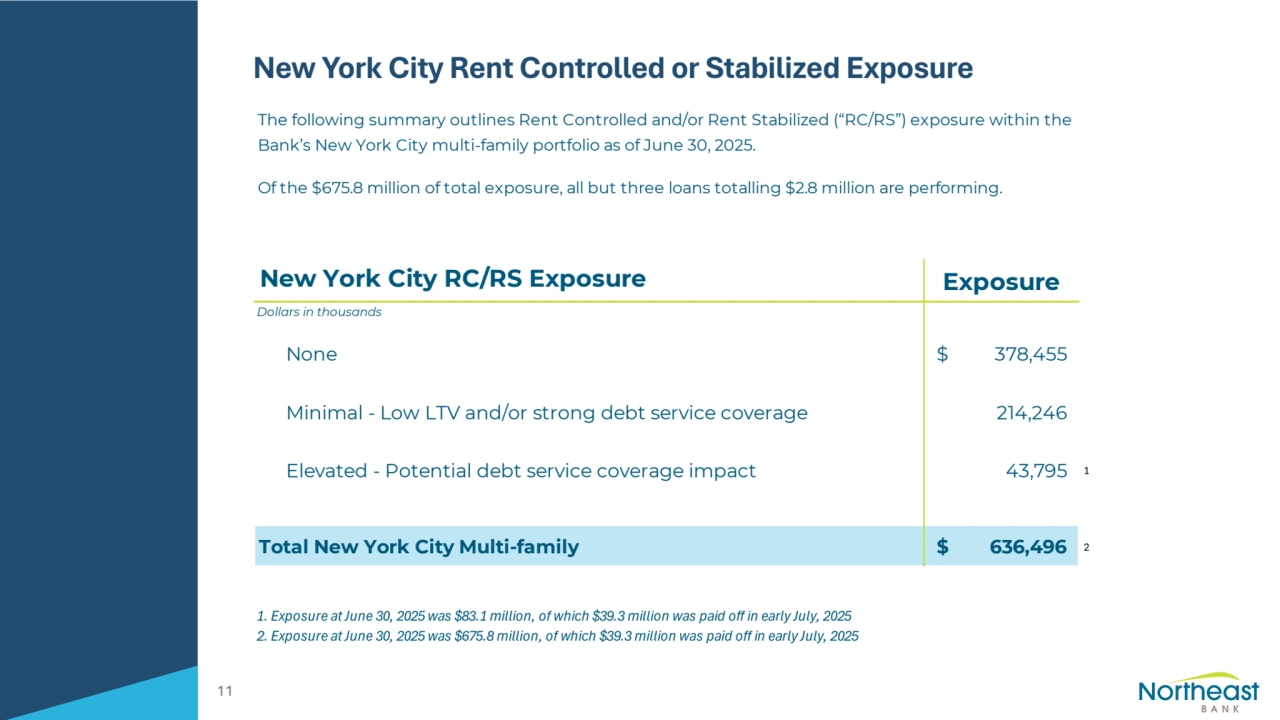
- 13. New York City Rent Controlled or Stabilized Exposure 11 New York City RC/RS Exposure Exposure Dollars in thousands None $ 378,455 Minimal - Low LTV and/or strong debt service coverage 214,246 Elevated - Potential debt service coverage impact 43,795 1 Total New York City Multi-family $ 636,496 2 1. Exposure at June 30, 2025 was $83.1 million, of which $39.3 million was paid off in early July, 2025 2. Exposure at June 30, 2025 was $675.8 million, of which $39.3 million was paid off in early July, 2025 The following summary outlines Rent Controlled and/or Rent Stabilized (“RC/RS”) exposure within the Bank’s New York City multi-family portfolio as of June 30, 2025. Of the $675.8 million of total exposure, all but three loans totalling $2.8 million are performing.
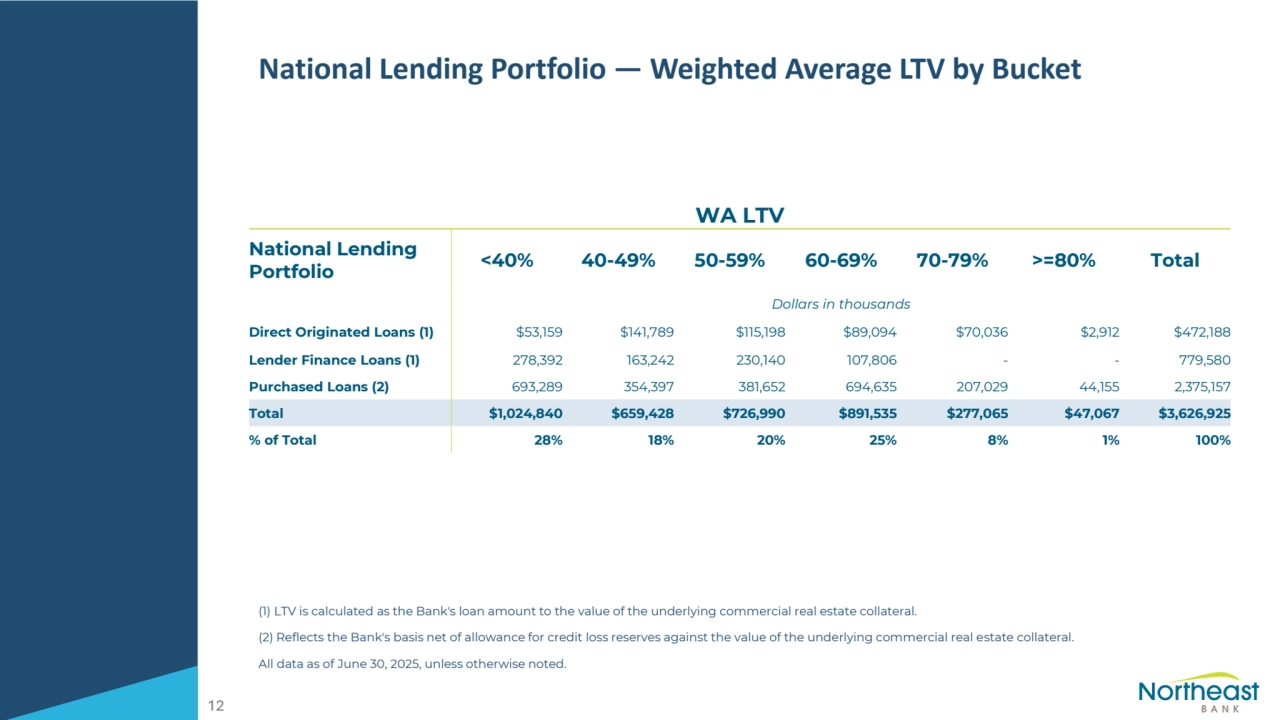
- 14. National Lending Portfolio — Weighted Average LTV by Bucket (1) LTV is calculated as the Bank's loan amount to the value of the underlying commercial real estate collateral. (2) Reflects the Bank's basis net of allowance for credit loss reserves against the value of the underlying commercial real estate collateral. All data as of June 30, 2025, unless otherwise noted. 12 WA LTV National Lending Portfolio <40% 40-49% 50-59% 60-69% 70-79% >=80% Total Dollars in thousands Direct Originated Loans (1) $53,159 $141,789 $115,198 $89,094 $70,036 $2,912 $472,188 Lender Finance Loans (1) 278,392 163,242 230,140 107,806 - - 779,580 Purchased Loans (2) 693,289 354,397 381,652 694,635 207,029 44,155 2,375,157 Total $1,024,840 $659,428 $726,990 $891,535 $277,065 $47,067 $3,626,925 % of Total 28% 18% 20% 25% 8% 1% 100%
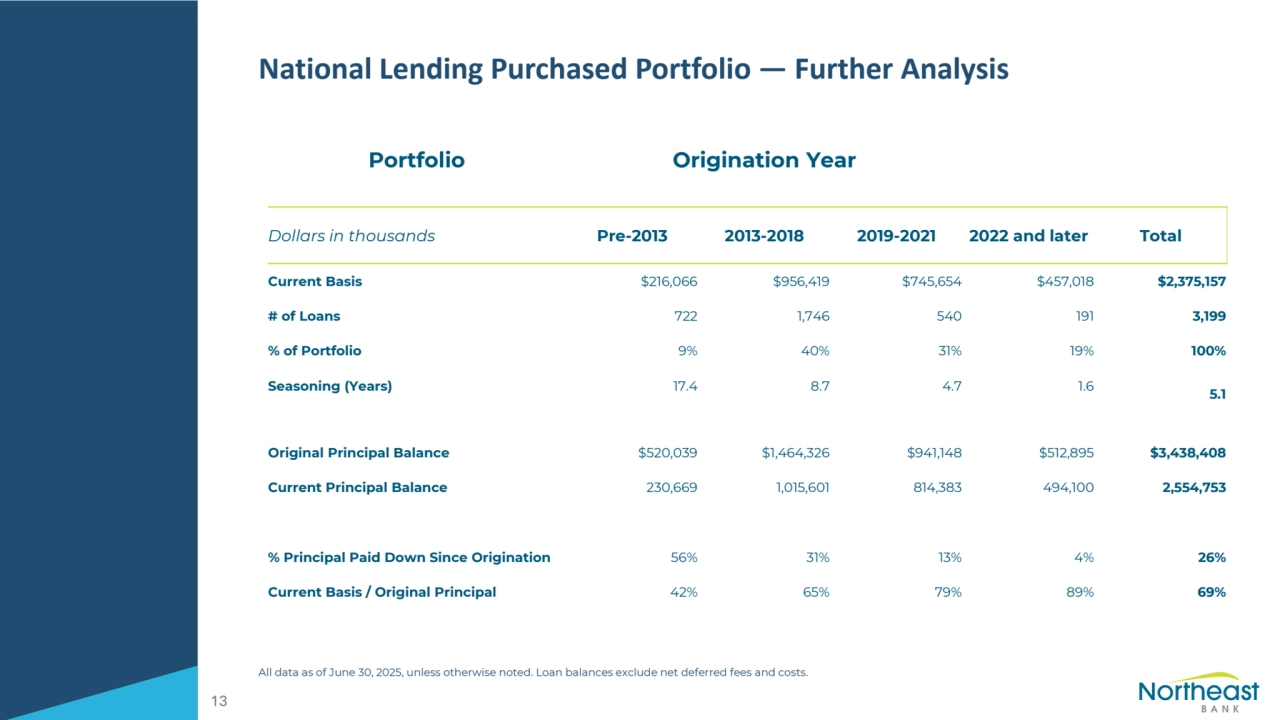
- 15. National Lending Purchased Portfolio — Further Analysis All data as of June 30, 2025, unless otherwise noted. Loan balances exclude net deferred fees and costs. 13 Portfolio Origination Year Dollars in thousands Pre-2013 2013-2018 2019-2021 2022 and later Total Current Basis $216,066 $956,419 $745,654 $457,018 $2,375,157 # of Loans 722 1,746 540 191 3,199 % of Portfolio 9% 40% 31% 19% 100% Seasoning (Years) 17.4 8.7 4.7 1.6 5.1 Original Principal Balance $520,039 $1,464,326 $941,148 $512,895 $3,438,408 Current Principal Balance 230,669 1,015,601 814,383 494,100 2,554,753 % Principal Paid Down Since Origination 56% 31% 13% 4% 26% Current Basis / Original Principal 42% 65% 79% 89% 69%
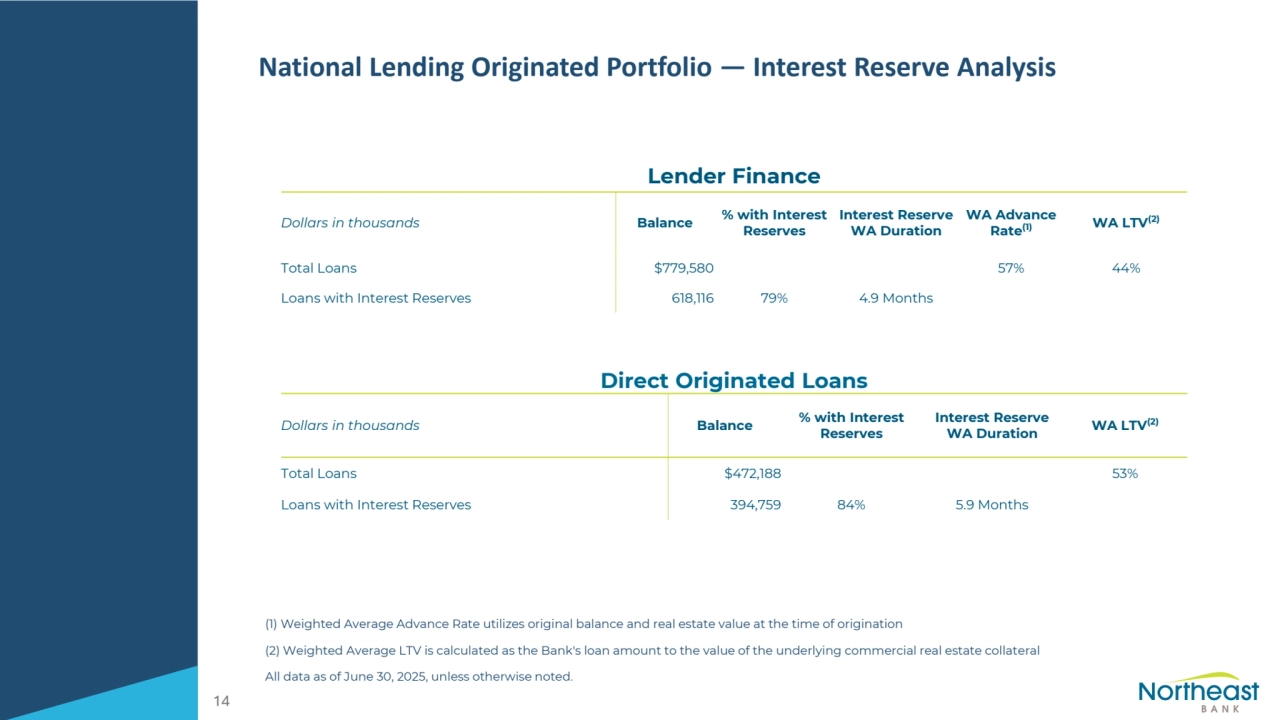
- 16. National Lending Originated Portfolio — Interest Reserve Analysis (1) Weighted Average Advance Rate utilizes original balance and real estate value at the time of origination (2) Weighted Average LTV is calculated as the Bank's loan amount to the value of the underlying commercial real estate collateral All data as of June 30, 2025, unless otherwise noted. 14 Lender Finance Dollars in thousands Balance % with Interest Reserves Interest Reserve WA Duration WA Advance Rate(1) WA LTV(2) Total Loans $779,580 57% 44% Loans with Interest Reserves 618,116 79% 4.9 Months Direct Originated Loans Dollars in thousands Balance % with Interest Reserves Interest Reserve WA Duration WA LTV(2) Total Loans $472,188 53% Loans with Interest Reserves 394,759 84% 5.9 Months
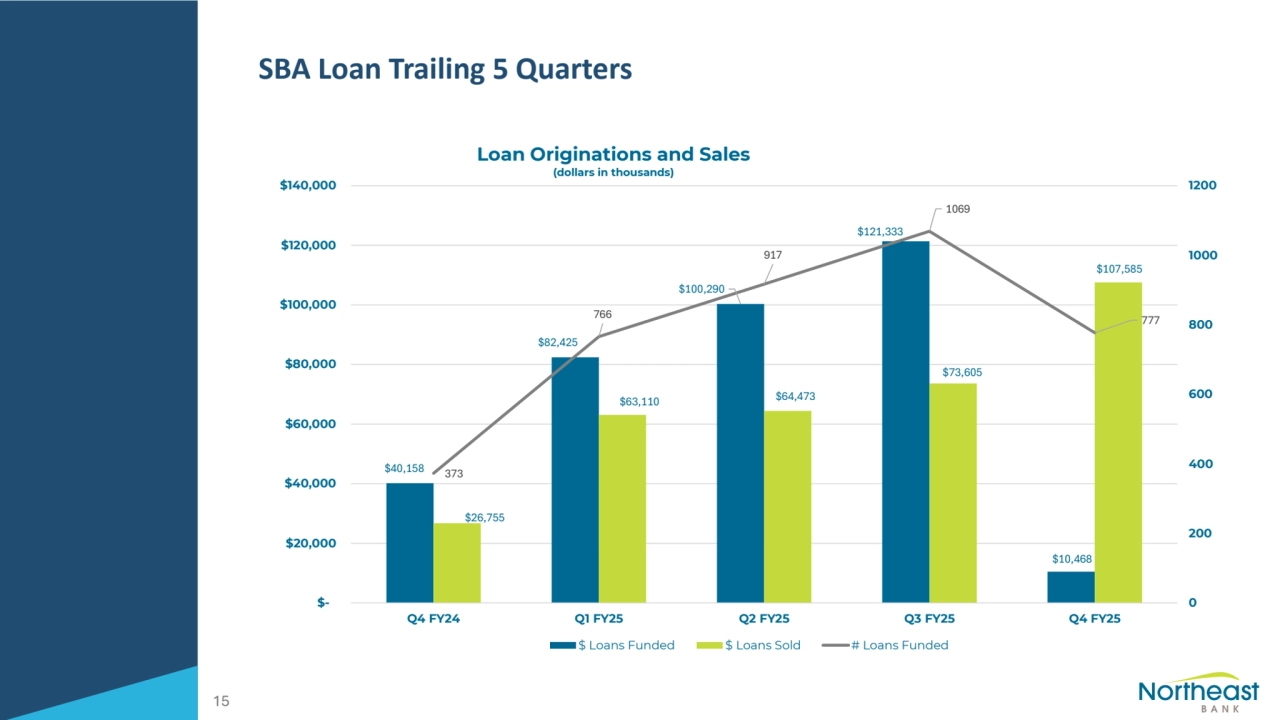
- 17. SBA Loan Trailing 5 Quarters 15 $40,158 $82,425 $100,290 $121,333 $10,468 $26,755 $63,110 $64,473 $73,605 $107,585 373 766 917 1069 777 0 200 400 600 800 1000 1200 $- $20,000 $40,000 $60,000 $80,000 $100,000 $120,000 $140,000 Q4 FY24 Q1 FY25 Q2 FY25 Q3 FY25 Q4 FY25 Loan Originations and Sales (dollars in thousands) $ Loans Funded $ Loans Sold # Loans Funded
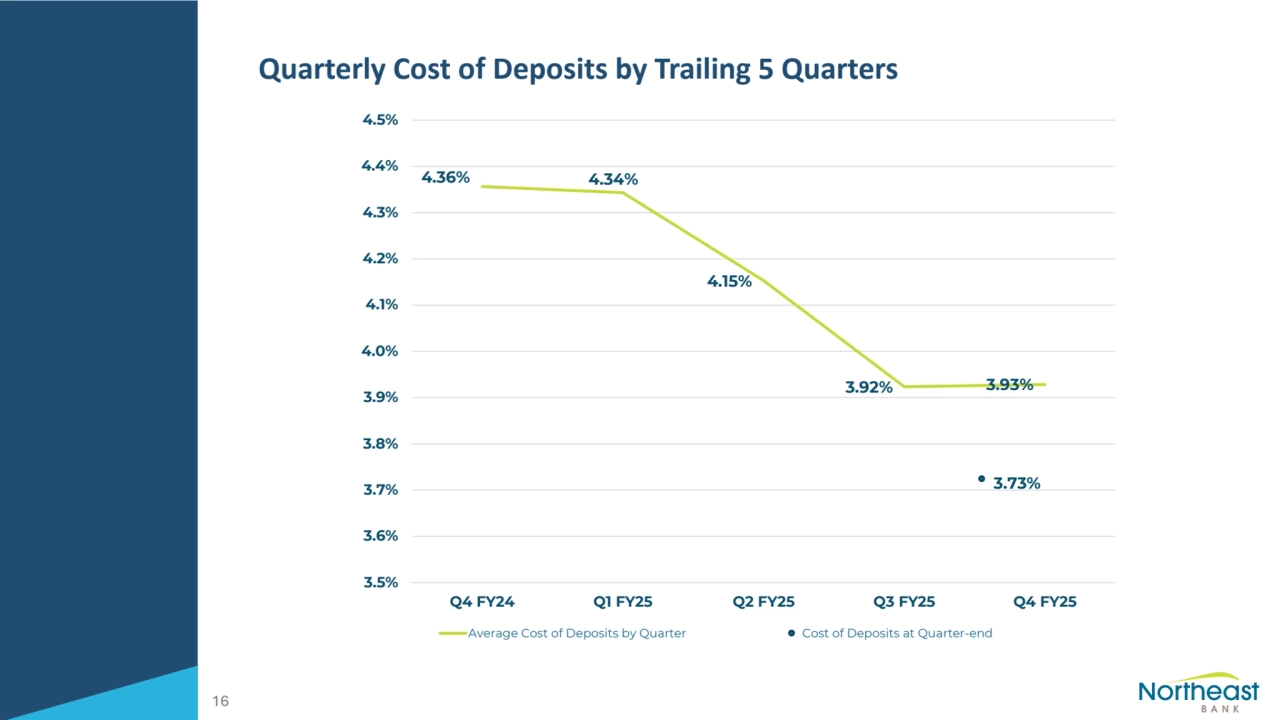
- 18. Quarterly Cost of Deposits by Trailing 5 Quarters 16 3.73% 4.36% 4.34% 4.15% 3.92% 3.93% 3.5% 3.6% 3.7% 3.8% 3.9% 4.0% 4.1% 4.2% 4.3% 4.4% 4.5% Q4 FY24 Q1 FY25 Q2 FY25 Q3 FY25 Q4 FY25 Average Cost of Deposits by Quarter Cost of Deposits at Quarter-end
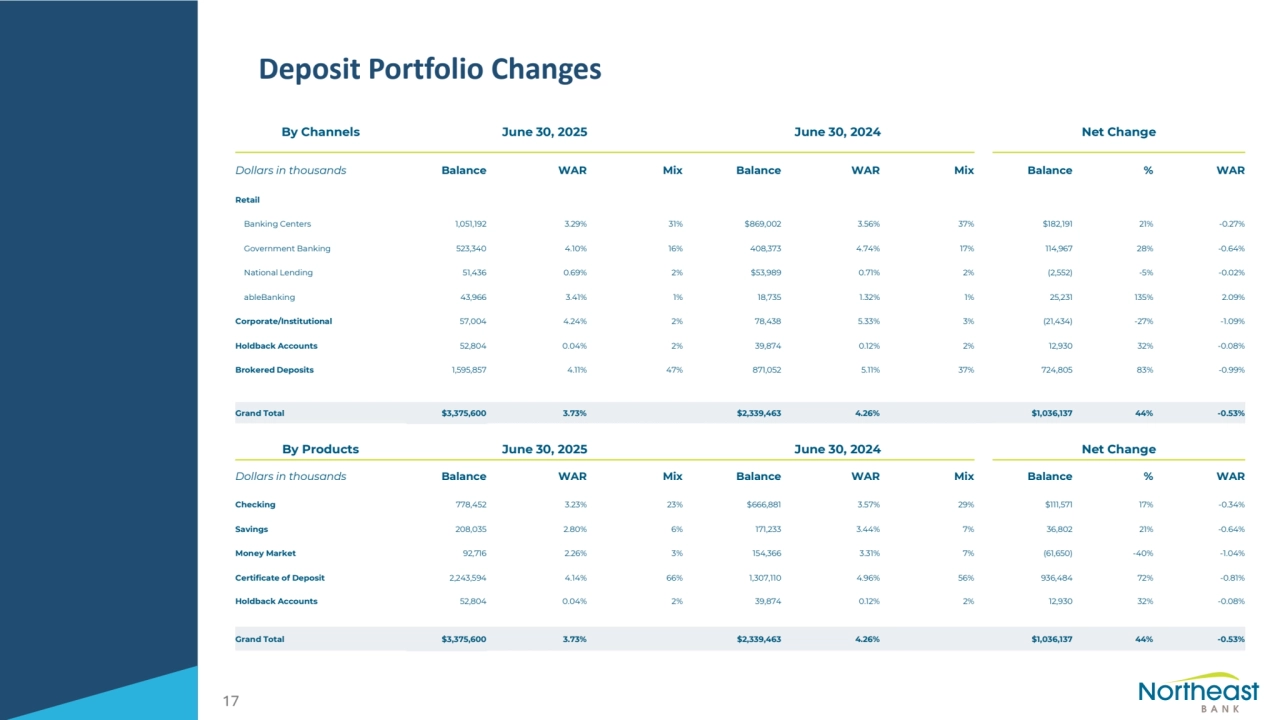
- 19. Deposit Portfolio Changes 17 By Channels June 30, 2025 June 30, 2024 Net Change Dollars in thousands Balance WAR Mix Balance WAR Mix Balance % WAR Retail Banking Centers 1,051,192 3.29% 31% $869,002 3.56% 37% $182,191 21% -0.27% Government Banking 523,340 4.10% 16% 408,373 4.74% 17% 114,967 28% -0.64% National Lending 51,436 0.69% 2% $53,989 0.71% 2% (2,552) -5% -0.02% ableBanking 43,966 3.41% 1% 18,735 1.32% 1% 25,231 135% 2.09% Corporate/Institutional 57,004 4.24% 2% 78,438 5.33% 3% (21,434) -27% -1.09% Holdback Accounts 52,804 0.04% 2% 39,874 0.12% 2% 12,930 32% -0.08% Brokered Deposits 1,595,857 4.11% 47% 871,052 5.11% 37% 724,805 83% -0.99% Grand Total $3,375,600 3.73% $2,339,463 4.26% $1,036,137 44% -0.53% By Products June 30, 2025 June 30, 2024 Net Change Dollars in thousands Balance WAR Mix Balance WAR Mix Balance % WAR Checking 778,452 3.23% 23% $666,881 3.57% 29% $111,571 17% -0.34% Savings 208,035 2.80% 6% 171,233 3.44% 7% 36,802 21% -0.64% Money Market 92,716 2.26% 3% 154,366 3.31% 7% (61,650) -40% -1.04% Certificate of Deposit 2,243,594 4.14% 66% 1,307,110 4.96% 56% 936,484 72% -0.81% Holdback Accounts 52,804 0.04% 2% 39,874 0.12% 2% 12,930 32% -0.08% Grand Total $3,375,600 3.73% $2,339,463 4.26% $1,036,137 44% -0.53%
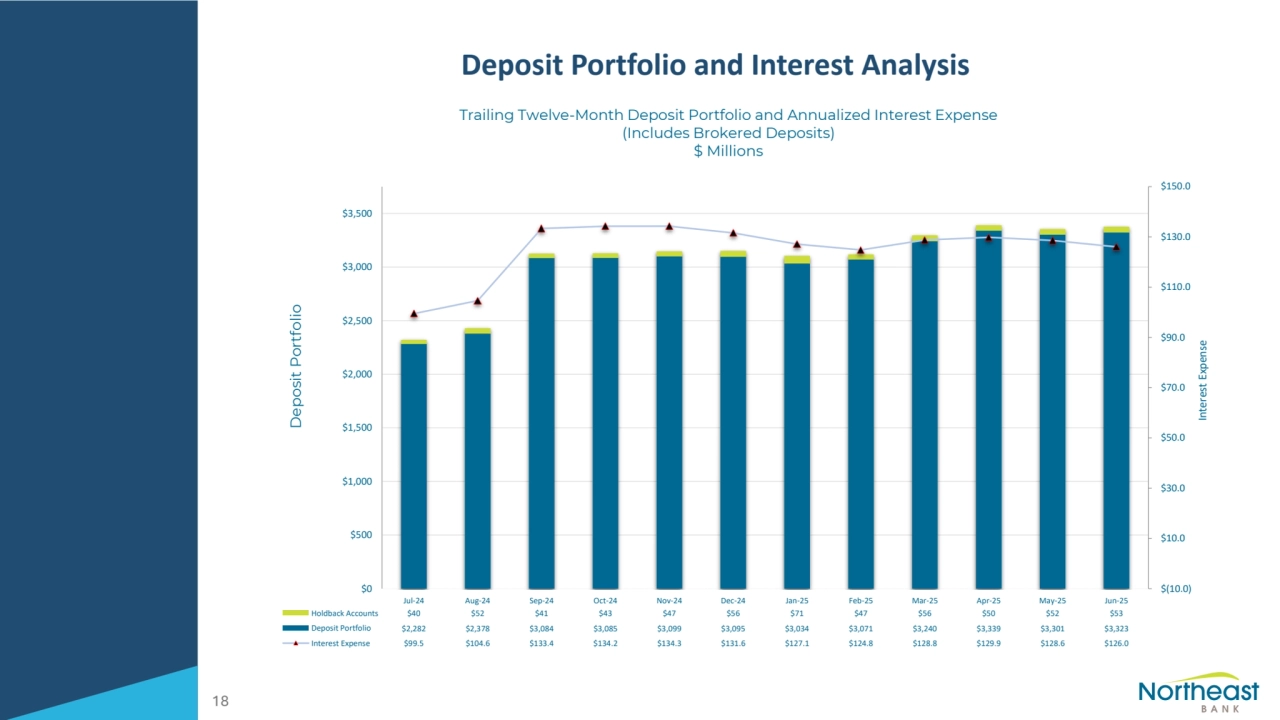
- 20. Deposit Portfolio and Interest Analysis 18 $(10.0) $10.0 $30.0 $50.0 $70.0 $90.0 $110.0 $130.0 $150.0 $0 $500 $1,000 $1,500 $2,000 $2,500 $3,000 $3,500 Jul-24 Aug-24 Sep-24 Oct-24 Nov-24 Dec-24 Jan-25 Feb-25 Mar-25 Apr-25 May-25 Jun-25 Holdback Accounts $40 $52 $41 $43 $47 $56 $71 $47 $56 $50 $52 $53 Deposit Portfolio $2,282 $2,378 $3,084 $3,085 $3,099 $3,095 $3,034 $3,071 $3,240 $3,339 $3,301 $3,323 Interest Expense $99.5 $104.6 $133.4 $134.2 $134.3 $131.6 $127.1 $124.8 $128.8 $129.9 $128.6 $126.0 Trailing Twelve-Month Deposit Portfolio and Annualized Interest Expense (Includes Brokered Deposits) $ Millions Deposit Portfolio Interest Expense
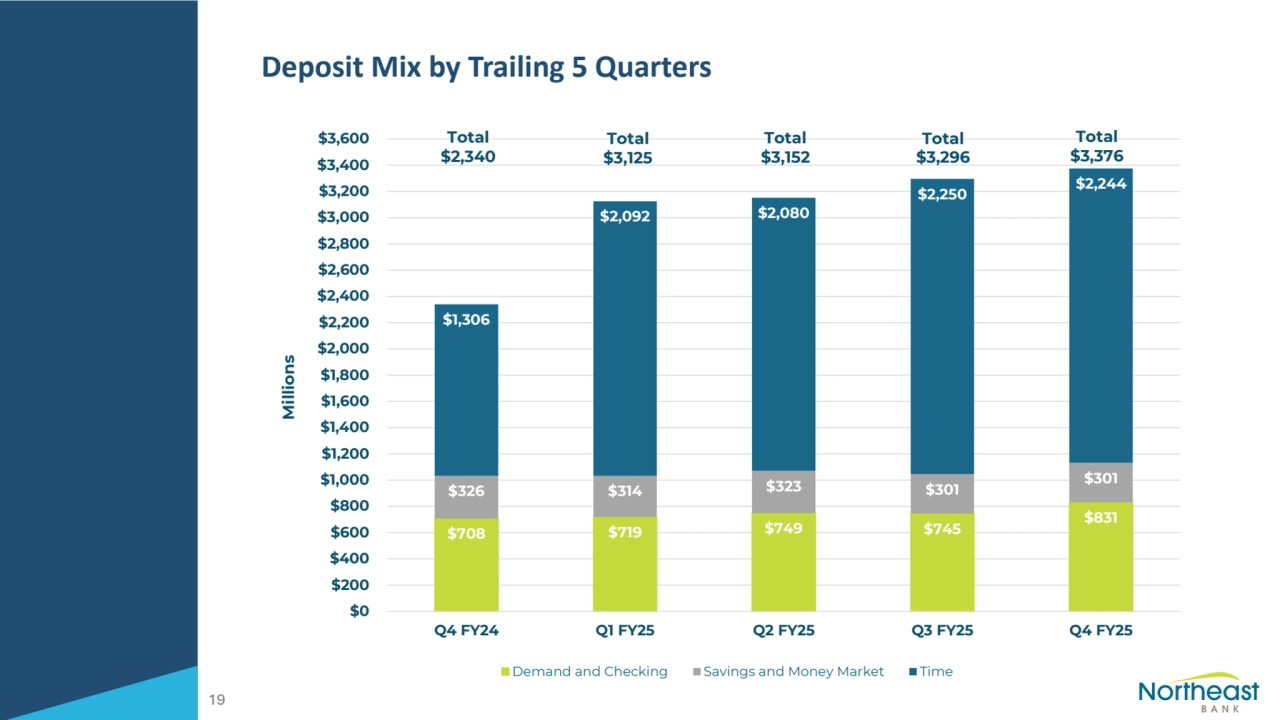
- 21. Deposit Mix by Trailing 5 Quarters 19 $708 $719 $749 $745 $831 $326 $314 $323 $301 $301 $1,306 $2,092 $2,080 $2,250 $2,244 $0 $200 $400 $600 $800 $1,000 $1,200 $1,400 $1,600 $1,800 $2,000 $2,200 $2,400 $2,600 $2,800 $3,000 $3,200 $3,400 $3,600 Q4 FY24 Q1 FY25 Q2 FY25 Q3 FY25 Q4 FY25 Millions Demand and Checking Savings and Money Market Time Total $2,340 Total $3,125 Total $3,152 Total $3,296 Total $3,376
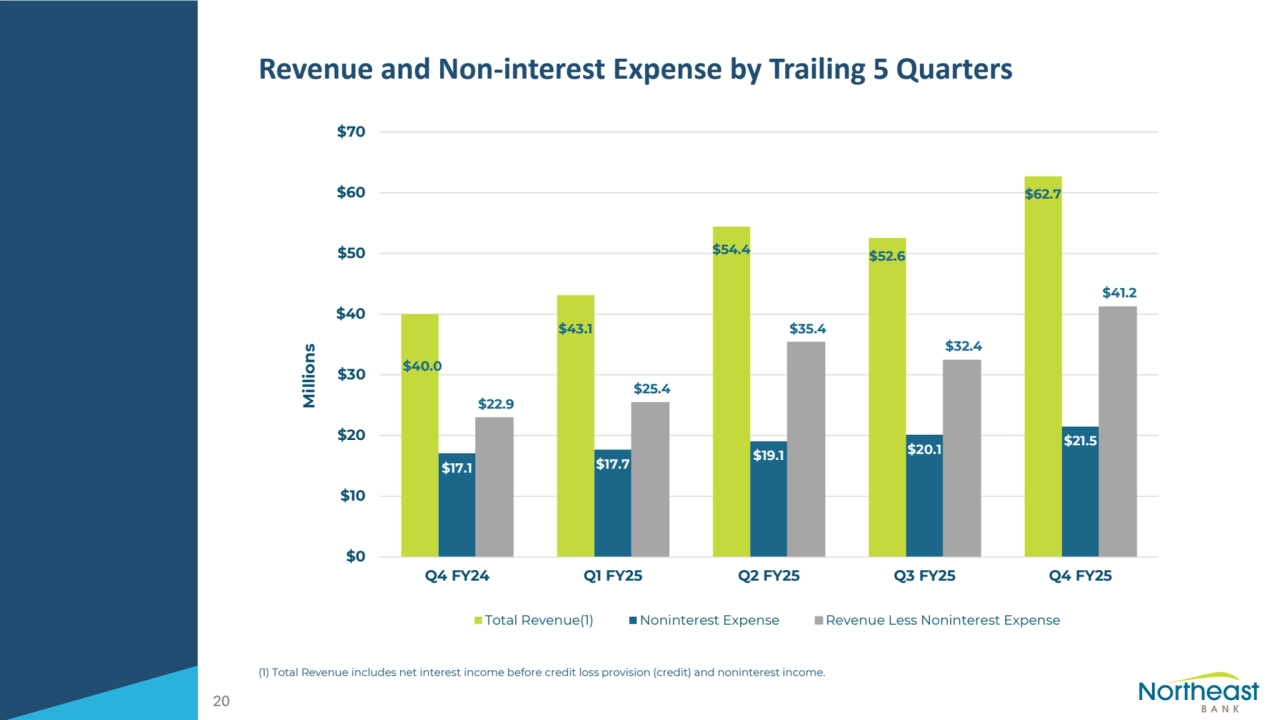
- 22. Revenue and Non-interest Expense by Trailing 5 Quarters (1) Total Revenue includes net interest income before credit loss provision (credit) and noninterest income. 20 $40.0 $43.1 $54.4 $52.6 $62.7 $17.1 $17.7 $19.1 $20.1 $21.5 $22.9 $25.4 $35.4 $32.4 $41.2 $0 $10 $20 $30 $40 $50 $60 $70 Q4 FY24 Q1 FY25 Q2 FY25 Q3 FY25 Q4 FY25 Millions Total Revenue(1) Noninterest Expense Revenue Less Noninterest Expense
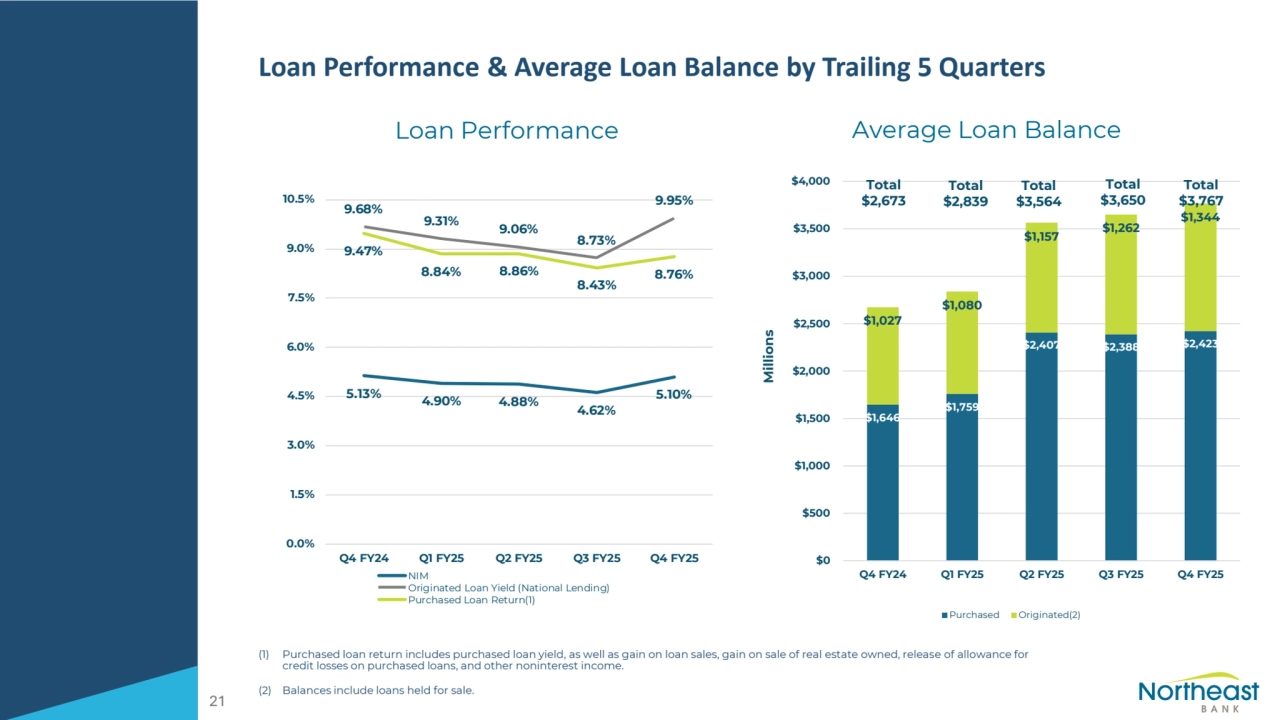
- 23. Loan Performance & Average Loan Balance by Trailing 5 Quarters (1) Purchased loan return includes purchased loan yield, as well as gain on loan sales, gain on sale of real estate owned, release of allowance for credit losses on purchased loans, and other noninterest income. (2) Balances include loans held for sale. Loan Performance Average Loan Balance 21 5.13% 4.90% 4.88% 4.62% 5.10% 9.68% 9.31% 9.06% 8.73% 9.95% 9.47% 8.84% 8.86% 8.43% 8.76% 0.0% 1.5% 3.0% 4.5% 6.0% 7.5% 9.0% 10.5% Q4 FY24 Q1 FY25 Q2 FY25 Q3 FY25 Q4 FY25 NIM Originated Loan Yield (National Lending) Purchased Loan Return(1) $1,646 $1,759 $2,407 $2,388 $2,423 $1,027 $1,080 $1,157 $1,262 $1,344 $0 $500 $1,000 $1,500 $2,000 $2,500 $3,000 $3,500 $4,000 Q4 FY24 Q1 FY25 Q2 FY25 Q3 FY25 Q4 FY25 Millions Purchased Originated(2) Total $2,673 Total $2,839 Total $3,564 Total $3,650 Total $3,767
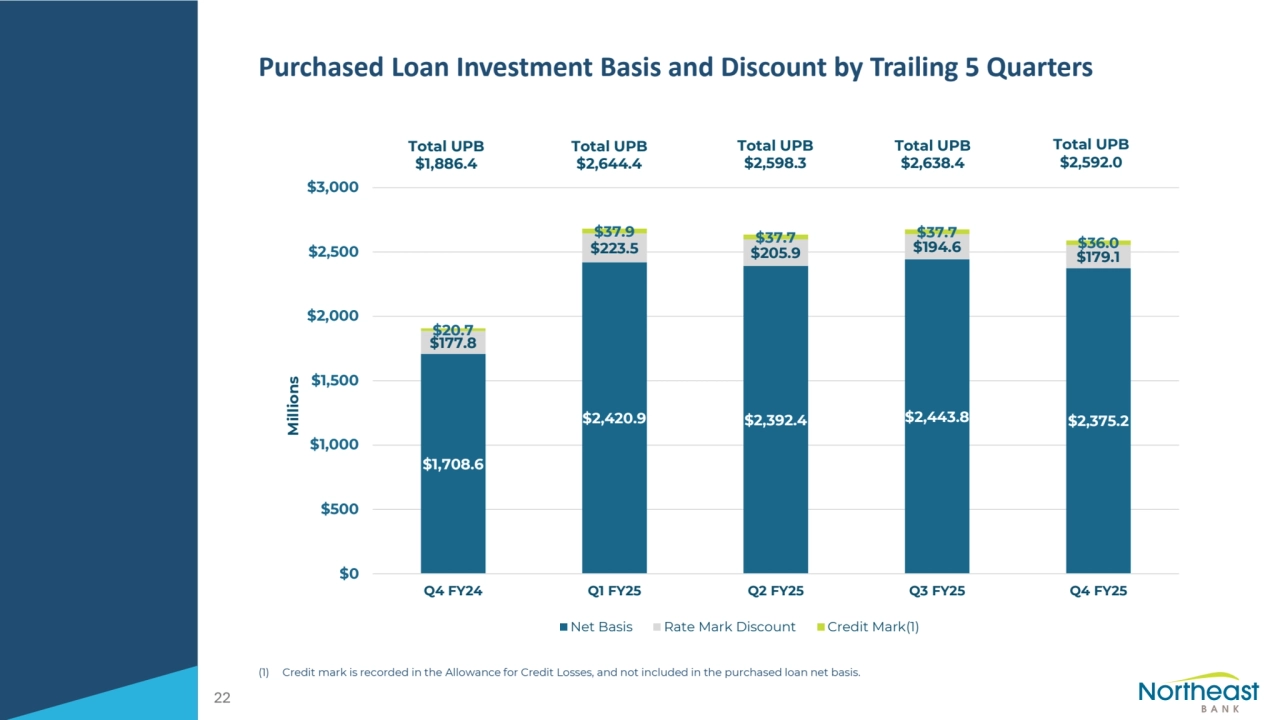
- 24. Purchased Loan Investment Basis and Discount by Trailing 5 Quarters (1) Credit mark is recorded in the Allowance for Credit Losses, and not included in the purchased loan net basis. 22 $1,708.6 $2,420.9 $2,392.4 $2,443.8 $2,375.2 $177.8 $223.5 $205.9 $194.6 $179.1 $20.7 $37.9 $37.7 $37.7 $36.0 $0 $500 $1,000 $1,500 $2,000 $2,500 $3,000 Q4 FY24 Q1 FY25 Q2 FY25 Q3 FY25 Q4 FY25 Millions Net Basis Rate Mark Discount Credit Mark(1) Total UPB $1,886.4 Total UPB $2,644.4 Total UPB $2,598.3 Total UPB $2,638.4 Total UPB $2,592.0
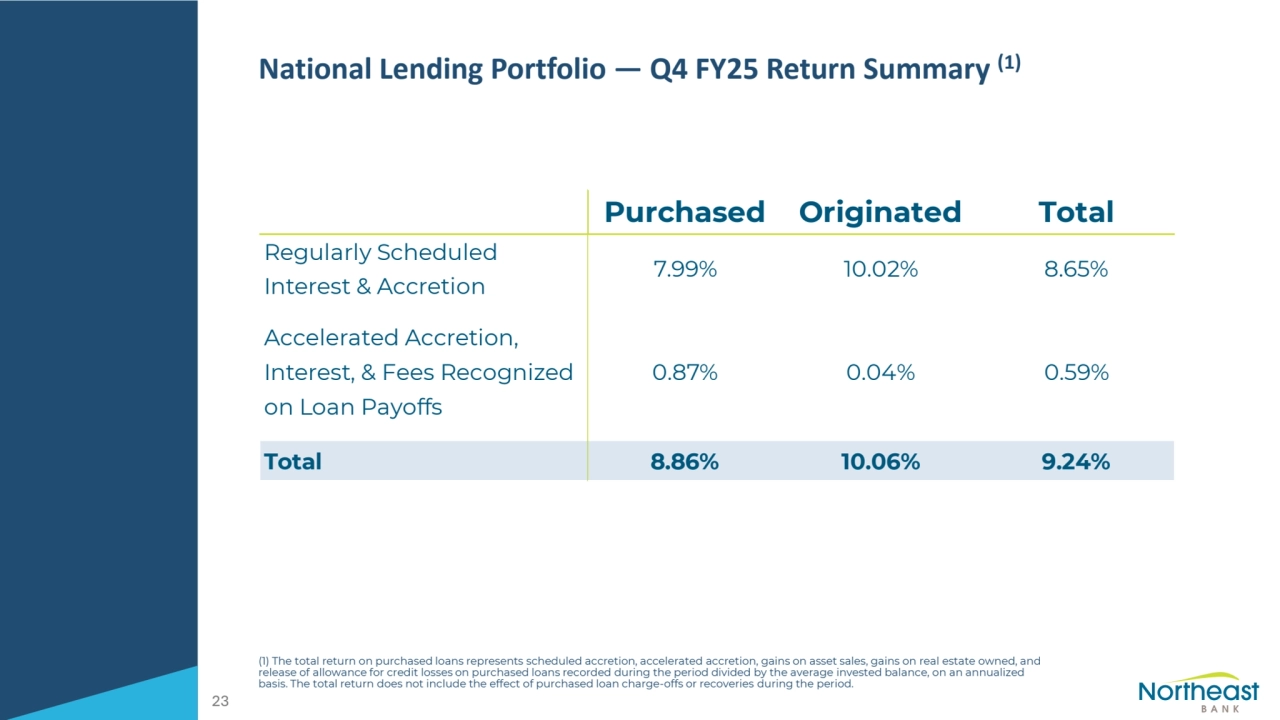
- 25. National Lending Portfolio — Q4 FY25 Return Summary (1) (1) The total return on purchased loans represents scheduled accretion, accelerated accretion, gains on asset sales, gains on real estate owned, and release of allowance for credit losses on purchased loans recorded during the period divided by the average invested balance, on an annualized basis. The total return does not include the effect of purchased loan charge-offs or recoveries during the period. 23 Purchased Originated Total Regularly Scheduled Interest & Accretion 7.99% 10.02% 8.65% Accelerated Accretion, Interest, & Fees Recognized on Loan Payoffs 0.87% 0.04% 0.59% Total 8.86% 10.06% 9.24%
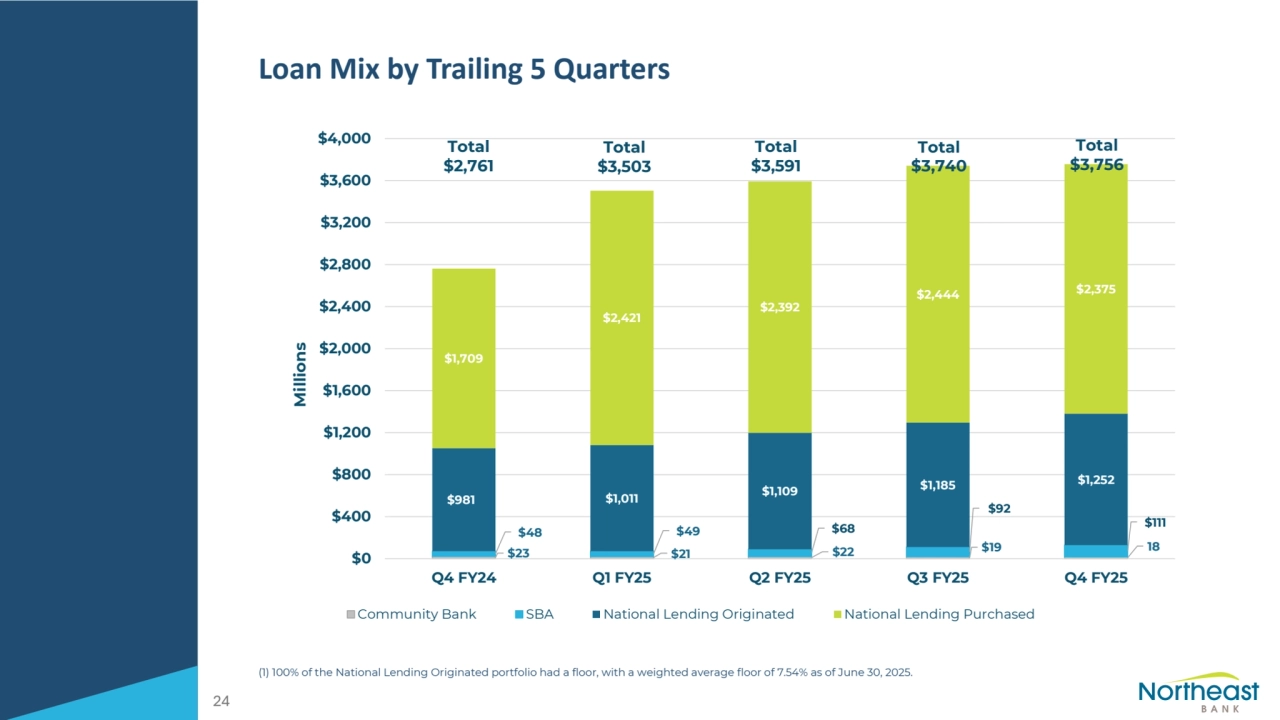
- 26. Loan Mix by Trailing 5 Quarters (1) 100% of the National Lending Originated portfolio had a floor, with a weighted average floor of 7.54% as of June 30, 2025. 24 $23 $21 $22 $19 18 $48 $49 $68 $92 $111 $981 $1,011 $1,109 $1,185 $1,252 $1,709 $2,421 $2,392 $2,444 $2,375 $0 $400 $800 $1,200 $1,600 $2,000 $2,400 $2,800 $3,200 $3,600 $4,000 Q4 FY24 Q1 FY25 Q2 FY25 Q3 FY25 Q4 FY25 Millions Community Bank SBA National Lending Originated National Lending Purchased Total $2,761 Total $3,503 Total $3,591 Total $3,740 Total $3,756 (1
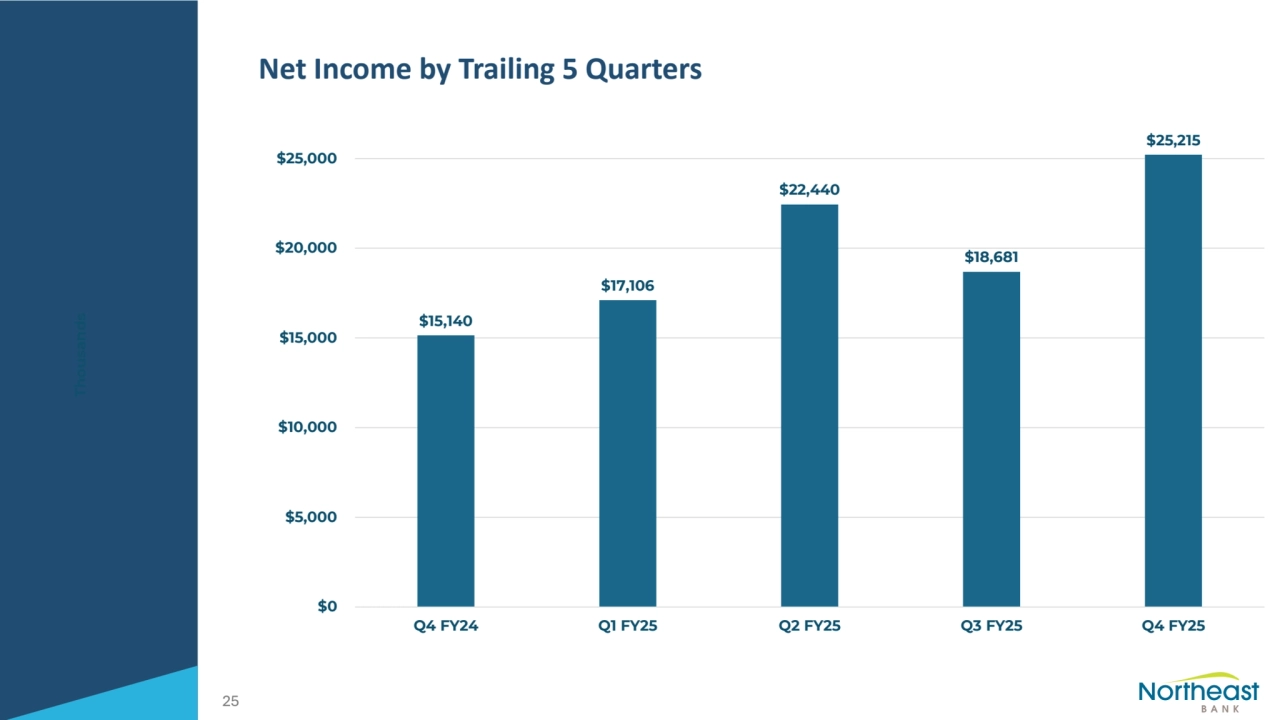
- 27. Net Income by Trailing 5 Quarters 25 $15,140 $17,106 $22,440 $18,681 $25,215 $0 $5,000 $10,000 $15,000 $20,000 $25,000 Q4 FY24 Q1 FY25 Q2 FY25 Q3 FY25 Q4 FY25 Thousands
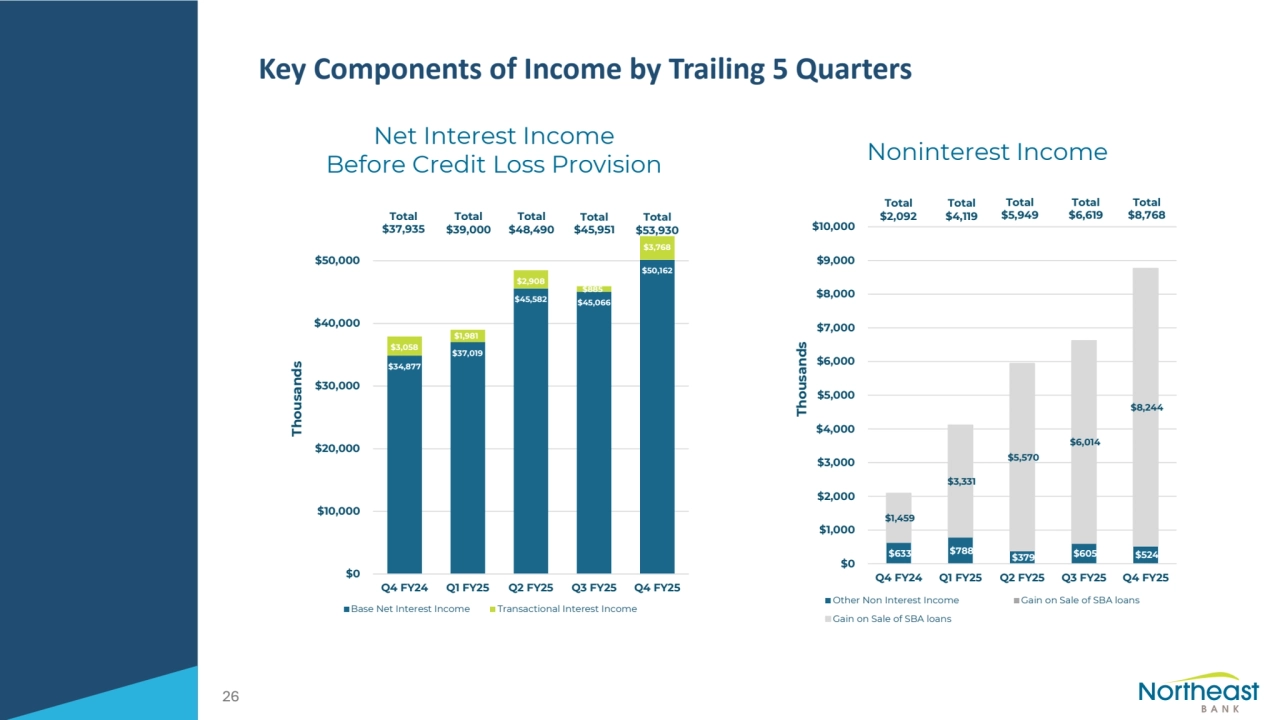
- 28. Key Components of Income by Trailing 5 Quarters Net Interest Income Before Credit Loss Provision Noninterest Income 26 $633 $788 $379 $605 $524 $1,459 $3,331 $5,570 $6,014 $8,244 $0 $1,000 $2,000 $3,000 $4,000 $5,000 $6,000 $7,000 $8,000 $9,000 $10,000 Q4 FY24 Q1 FY25 Q2 FY25 Q3 FY25 Q4 FY25 Thousands Other Non Interest Income Gain on Sale of SBA loans Gain on Sale of SBA loans Total $6,619 Total $4,119 Total $5,949 Total $2,092 Total $8,768 $34,877 $37,019 $45,582 $45,066 $50,162 $3,058 $1,981 $2,908 $885 $3,768 $0 $10,000 $20,000 $30,000 $40,000 $50,000 Q4 FY24 Q1 FY25 Q2 FY25 Q3 FY25 Q4 FY25 Thousands Base Net Interest Income Transactional Interest Income Total $37,935 Total $39,000 Total $48,490 Total $45,951 Total $53,930