Lyft Q2 2025 Earnings
 AI Summary
Key Insights
- 📈 Record Quarter: Lyft reports a record quarter with strong active rider growth and ride volume.
- 🤝 Strategic Partnerships: Partnerships, including Freenow acquisition, fuel growth and expand market reach in Europe.
- 🚗 AV Expansion: Continuous expansion of autonomous vehicle partnerships to increase global reach.
- 💰 Financial Highlights: Positive trends in gross bookings, adjusted EBITDA, and free cash flow, with Q3 2025 guidance provided.
- ⚙️ Efficiency: Efforts to improve marketplace incentives are yielding increased leverage and are on track to achieve further annual efficiencies.


Lyft Q2 2025 Earnings
- 1. Q2 2025 Earnings August 6, 2025
- 2. Forward Looking Statements & Non-GAAP Financial Measures 2 This presentation and the accompanying oral presentation contain forward-looking statements within the meaning of Section 27A of the Securities Act of 1933, as amended, and Section 21E of the Securities Exchange Act of 1934, as amended. Forward-looking statements generally relate to future events or Lyft's future financial or operating performance. In some cases, you can identify forward looking statements because they contain words such as "may," "will," "should," "expects," "plans," "anticipates,ˮ “going to,ˮ "could," "intends," "target," "projects," "contemplates," "believes," "estimates," "predicts," "potential" or "continue" or the negative of these words or other similar terms or expressions that concern Lyft's expectations, strategy, priorities, plans or intentions. Forward-looking statements in this presentation and the accompanying oral presentation include, but are not limited to, statements regarding Lyftʼs future financial and operating performance, including its outlook for the third quarter of 2025, demand for Lyftʼs products and services and the markets in which Lyft operates, impact of pricing pressure and seasonality trends, expected trends in insurance costs and their impact on Lyftʼs business, the impact of macroeconomic conditions on our business, results of operations, and the markets in which we operate, expectations regarding our acquisition of Freenow and its anticipated impact on our total addressable market and international operations, risks related to the integration and operation of Freenow, expansion of our operations in Canada, Europe and Puerto Rico, expectations regarding our autonomous and other partnerships, rider and driver activity, including driver supply, expectations regarding our share repurchase program including the timing of repurchases thereunder, and litigation and regulatory matters. Lyftʼs expectations and beliefs regarding these matters may not materialize, and actual results in future periods are subject to risks and uncertainties that could cause actual results to differ materially from those projected, including the macroeconomic environment, including inflation, tariffs and geopolitical uncertainty, and the impact of these factors and other market factors on operating expenses, including insurance costs, the sufficiency of Lyftʼs unrestricted cash, cash equivalents, and short-term investments, as well as risks associated with the outcome of litigation and regulatory matters. The forward-looking statements contained in this presentation are also subject to other risks and uncertainties, including those more fully described in Lyft's filings with the Securities and Exchange Commission (“SECˮ), including in our Annual Report on Form 10K for the year ended December 31, 2024 and subsequent Quarterly Reports on Form 10Q filed with the SEC. The forward-looking statements in this presentation are based on information available to Lyft as of the date of this presentation, and Lyft disclaims any obligation to update any forward-looking statements, except as required by law. This presentation and the accompanying oral presentation discuss "customers." For rideshare, there are two customers in every car - the driver is Lyft's customer, and the rider is the driver's customer. We care about both. In addition to financial information presented in accordance with U.S. generally accepted accounting principles (“GAAPˮ), this presentation and the accompanying oral presentation include certain non-GAAP financial measures, including Adjusted EBITDA, Adjusted EBITDA margin as a percentage of Gross Bookings, non-GAAP operating expenses, and free cash flow. These non-GAAP measures are presented for supplemental informational purposes only and should not be considered a substitute for financial information presented in accordance with GAAP. These non-GAAP measures have limitations as analytical tools, and they should not be considered in isolation or as a substitute for analysis of other GAAP financial measures. A reconciliation of these measures to the most directly comparable GAAP measures is included at the end of this presentation. We have not provided the forward-looking GAAP equivalents for certain forward-looking non-GAAP measures presented in the accompanying oral presentation, or a GAAP reconciliation, as a result of the uncertainty regarding, and the potential variability of, reconciling items such as stock-based compensation expense. Accordingly, a reconciliation of these non-GAAP guidance metrics to their corresponding GAAP equivalents is not available without unreasonable effort. However, it is important to note that material changes to reconciling items could have a significant effect on future GAAP results. Gross profit is defined as revenue less cost of revenue. Gross margin is defined as gross profit divided by revenue for the same period. This presentation and the accompanying oral presentation also contain statistical data, estimates and forecasts that are based on independent industry publications or other publicly available information, as well as other information based on our internal sources. This information involves many assumptions and limitations, and you are cautioned not to give undue weight to such information. We have not independently verified the accuracy or completeness of the information contained in the industry publications and other publicly available information. Accordingly, we make no representations as to the accuracy or completeness of that information nor do we undertake to update such information after the date of this presentation.
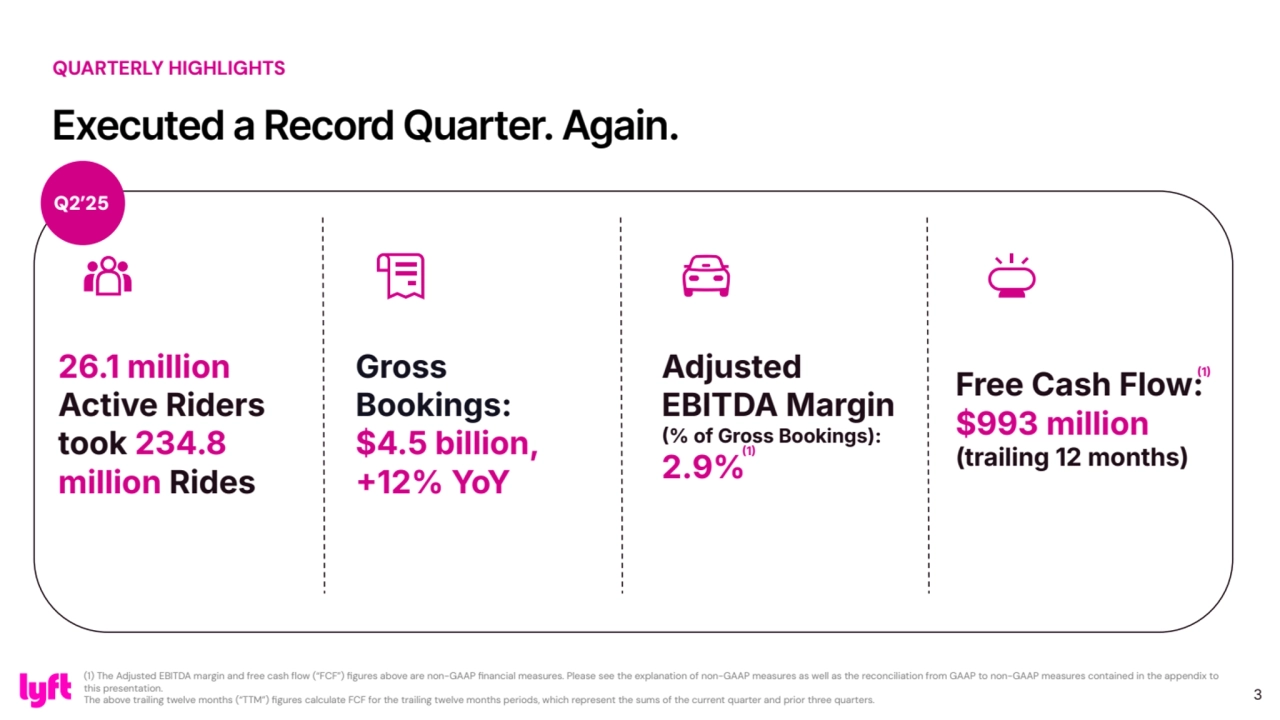
- 3. Executed a Record Quarter. Again. 3 QUARTERLY HIGHLIGHTS 26.1 million Active Riders took 234.8 million Rides Adjusted EBITDA Margin % of Gross Bookings): 2.9% Gross Bookings: $4.5 billion, 12% YoY Q2’25 Free Cash Flow: $993 million (trailing 12 months) 1 (1) The Adjusted EBITDA margin and free cash flow (“FCF”) figures above are non-GAAP financial measures. Please see the explanation of non-GAAP measures as well as the reconciliation from GAAP to non-GAAP measures contained in the appendix to this presentation. The above trailing twelve months (“TTM”) figures calculate FCF for the trailing twelve months periods, which represent the sums of the current quarter and prior three quarters. 1
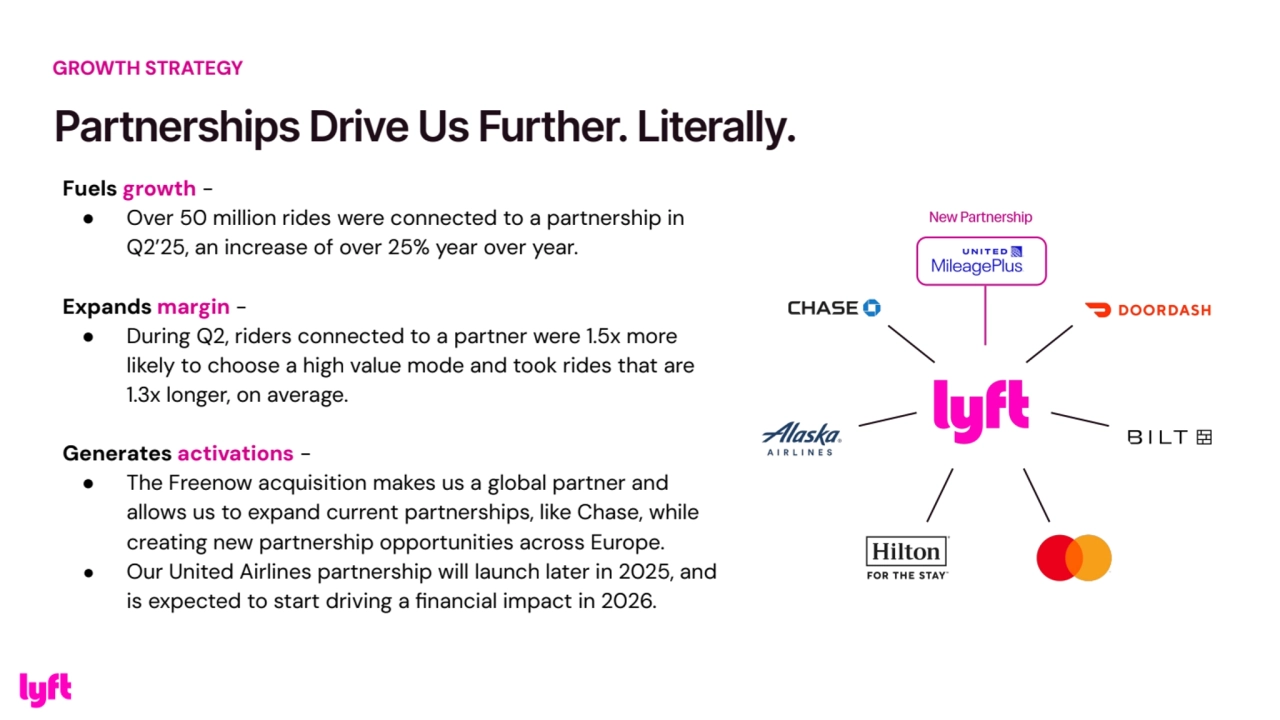
- 4. Fuels growth - ● Over 50 million rides were connected to a partnership in Q2’25, an increase of over 25% year over year. Expands margin - ● During Q2, riders connected to a partner were 1.5x more likely to choose a high value mode and took rides that are 1.3x longer, on average. Generates activations - ● The Freenow acquisition makes us a global partner and allows us to expand current partnerships, like Chase, while creating new partnership opportunities across Europe. ● Our United Airlines partnership will launch later in 2025, and is expected to start driving a financial impact in 2026. Partnerships Drive Us Further. Literally. GROWTH STRATEGY
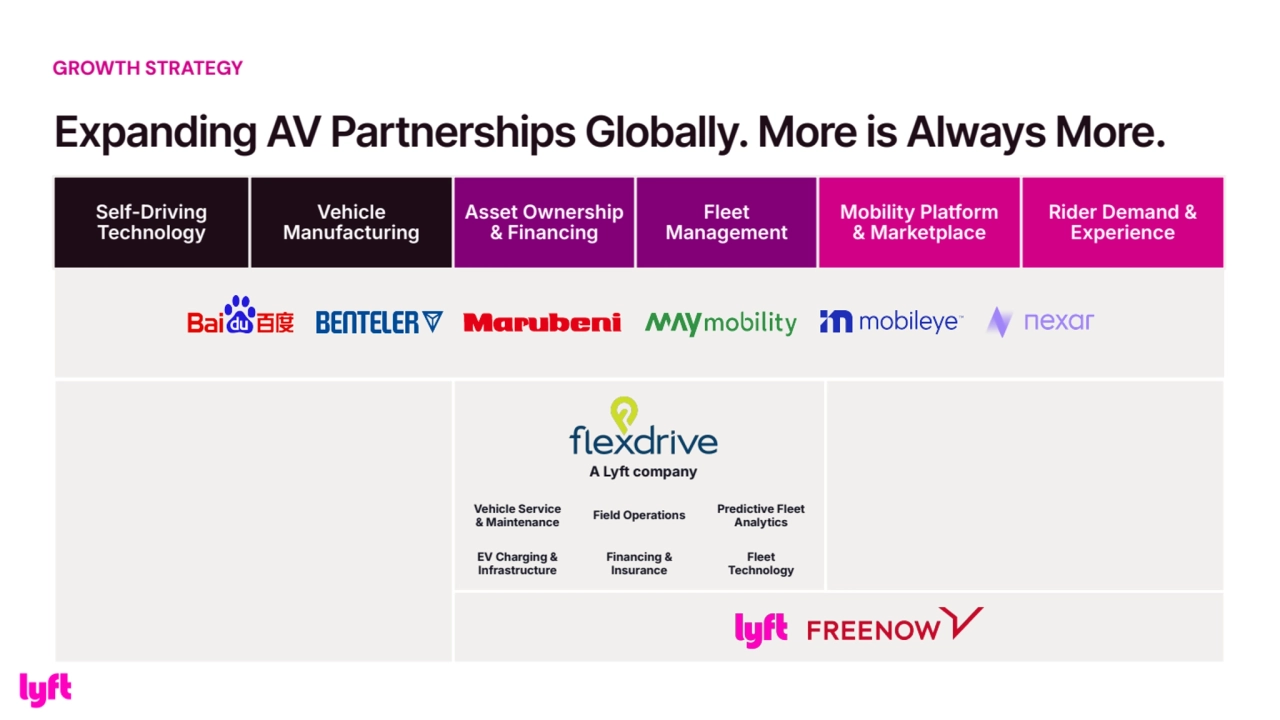
- 5. Self-Driving Technology Vehicle Manufacturing Asset Ownership & Financing Fleet Management Mobility Platform & Marketplace Rider Demand & Experience A Lyft company Vehicle Service & Maintenance Field Operations Predictive Fleet Analytics EV Charging & Infrastructure Financing & Insurance Fleet Technology GROWTH STRATEGY Expanding AV Partnerships Globally. More is Always More.
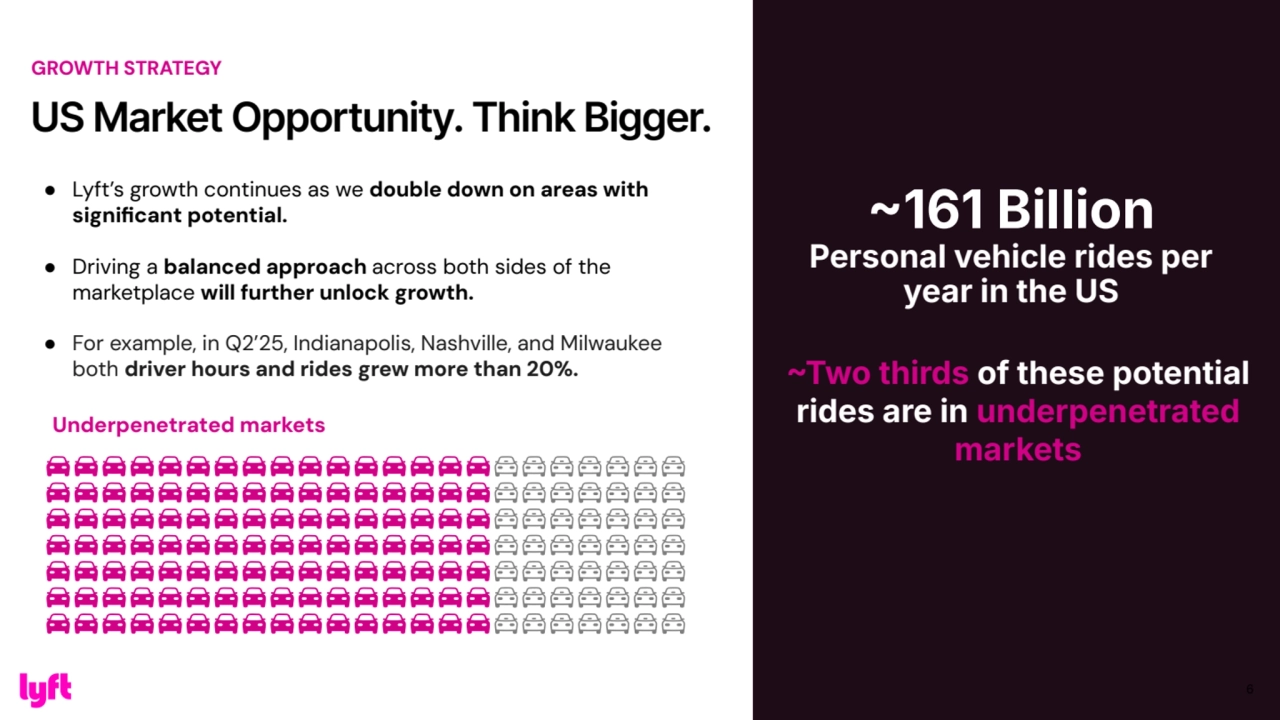
- 6. 161 Billion Personal vehicle rides per year in the US 6 Two thirds of these potential rides are in underpenetrated markets ● Lyft’s growth continues as we double down on areas with significant potential. ● Driving a balanced approach across both sides of the marketplace will further unlock growth. ● For example, in Q2’25, Indianapolis, Nashville, and Milwaukee both driver hours and rides grew more than 20%. Underpenetrated markets US Market Opportunity. Think Bigger. GROWTH STRATEGY
- 7. Results & Guidance
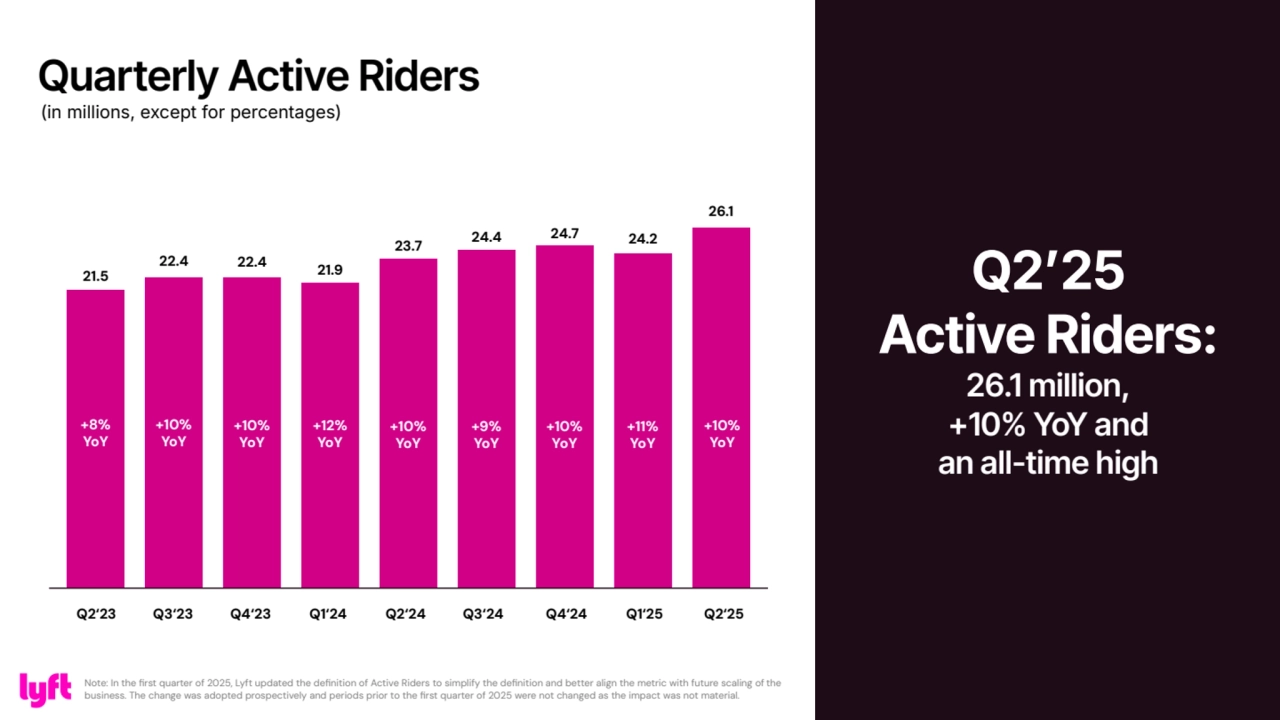
- 8. 21.5 +8% YoY 22.4 +10% YoY 22.4 +10% YoY 21.9 +12% YoY 23.7 +10% YoY 24.4 +9% YoY 24.7 +10% YoY 24.2 +11% YoY 26.1 +10% YoY Q2‘23 Q3‘23 Q4‘23 Q1‘24 Q2‘24 Q3‘24 Q4‘24 Q1‘25 Q2‘25 8 Note: In the first quarter of 2025, Lyft updated the definition of Active Riders to simplify the definition and better align the metric with future scaling of the business. The change was adopted prospectively and periods prior to the first quarter of 2025 were not changed as the impact was not material. Quarterly Active Riders (in millions, except for percentages) Q2ʼ25 Active Riders: 26.1 million, +10% YoY and an all-time high
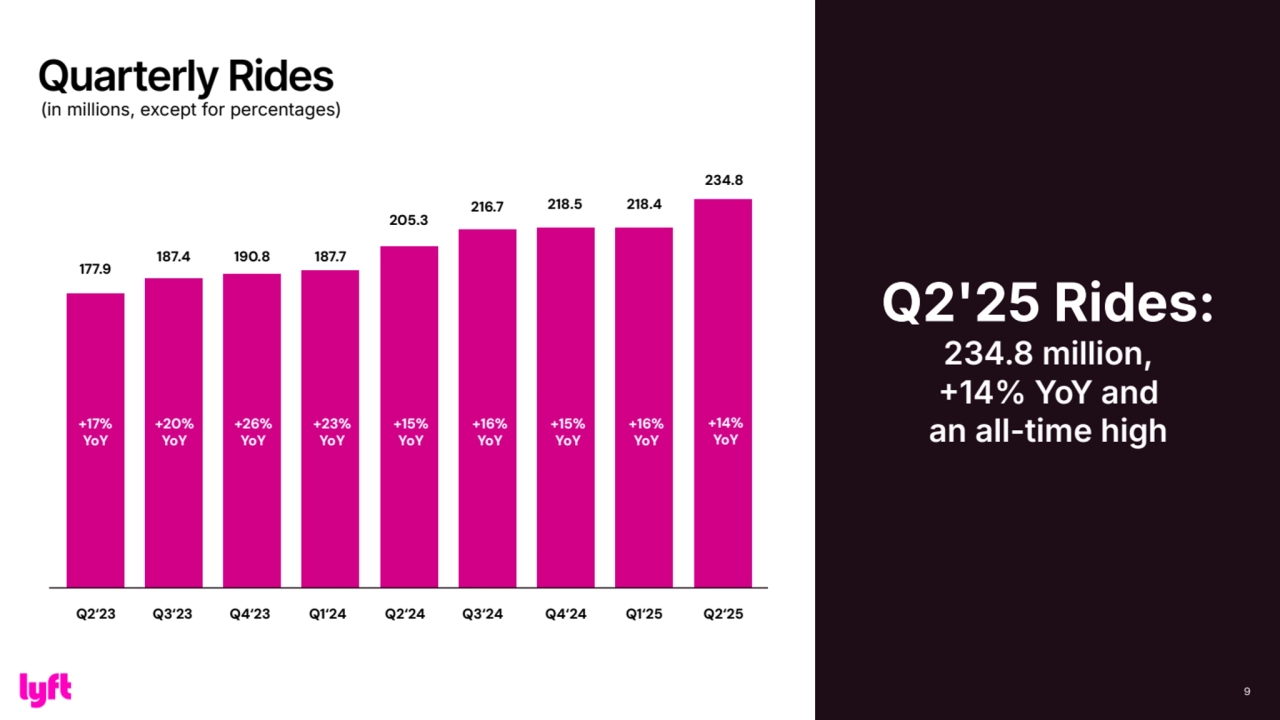
- 9. Q2'25 Rides: 234.8 million, 14% YoY and an all-time high 9 +14% YoY 187.4 +17% YoY +20% YoY 190.8 +20% YoY +26% YoY 187.7 +23% YoY 205.3 +15% YoY 177.9 +10% YoY +17% YoY 216.7 +16% YoY 218.5 +15% YoY 218.4 +16% YoY Q2‘23 Q3‘23 Q4‘23 Q1‘24 Q2‘24 Q3‘24 Q4‘24 Q1‘25 Q2‘25 234.8 Quarterly Rides (in millions, except for percentages)
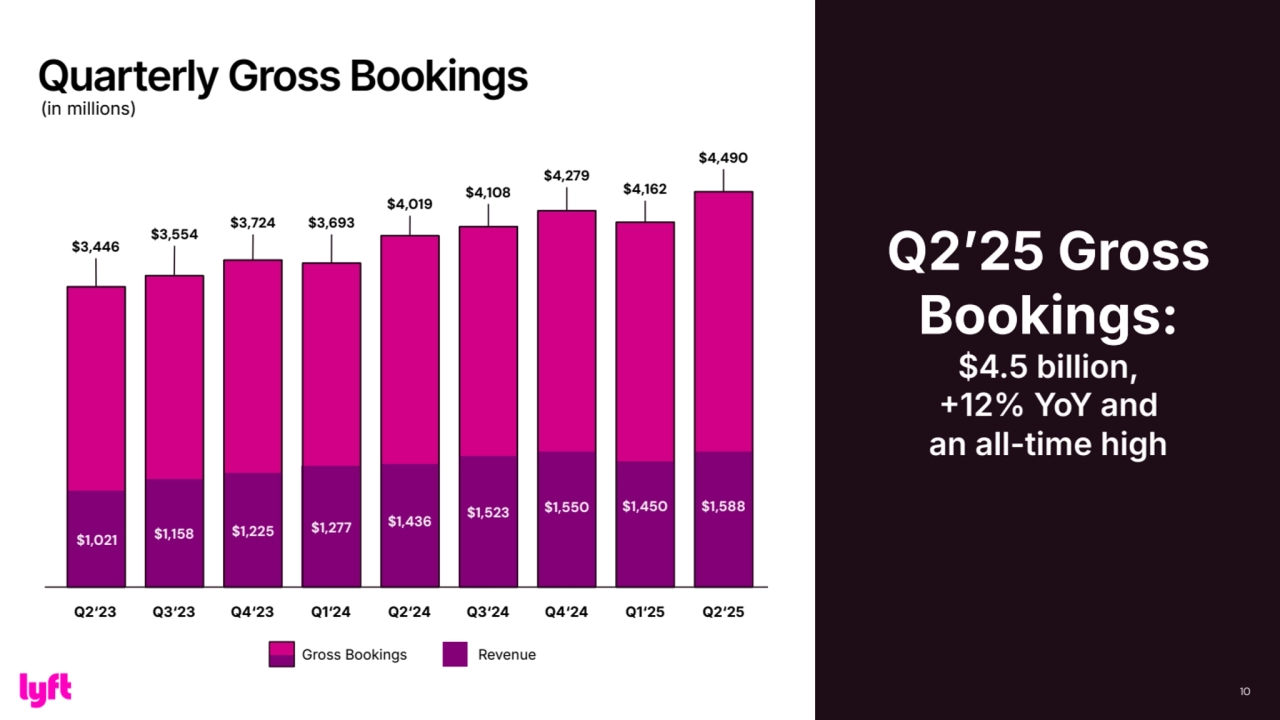
- 10. Quarterly Gross Bookings 10 (in millions) Q2ʼ25 Gross Bookings: $4.5 billion, 12% YoY and an all-time high 10 Revenue Q2‘23 Q3‘23 Q4‘23 Q1‘24 $1,225 $3,724 $1,277 $3,693 $1,021 $3,446 $1,158 $3,554 $1,436 $4,019 Q2‘24 Q3‘24 $1,523 $4,108 $1,550 $4,279 Q4‘24 $1,450 $4,162 Q1‘25 $1,588 $4,490 Q2‘25 Gross Bookings
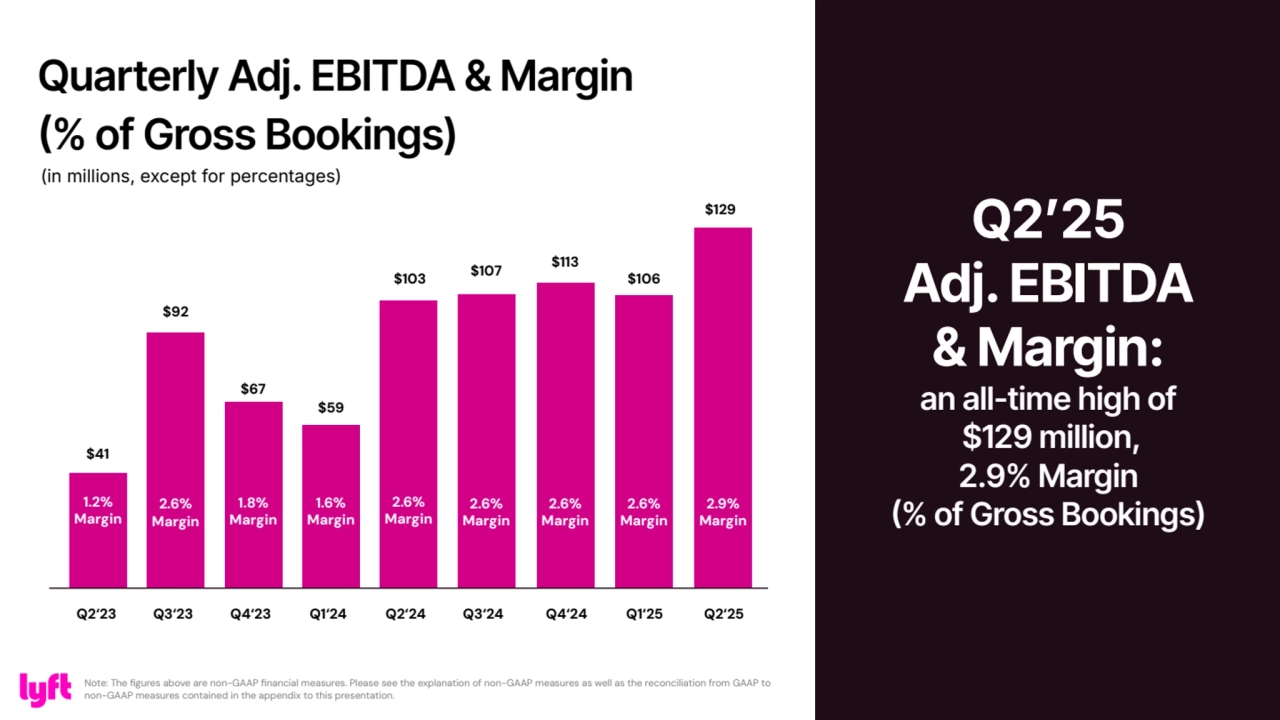
- 11. $41 1.2% Margin $92 2.6% Margin $67 1.8% Margin $59 1.6% Margin $103 2.6% Margin $107 2.6% Margin $113 2.6% Margin $106 2.6% Margin $129 2.9% Margin Q2‘23 Q3‘23 Q4‘23 Q1‘24 Q2‘24 Q3‘24 Q4‘24 Q1‘25 Q2‘25 Quarterly Adj. EBITDA & Margin (% of Gross Bookings) 11 (in millions, except for percentages) Note: The figures above are non-GAAP financial measures. Please see the explanation of non-GAAP measures as well as the reconciliation from GAAP to non-GAAP measures contained in the appendix to this presentation. Q2ʼ25 Adj. EBITDA & Margin: an all-time high of $129 million, 2.9% Margin (% of Gross Bookings)
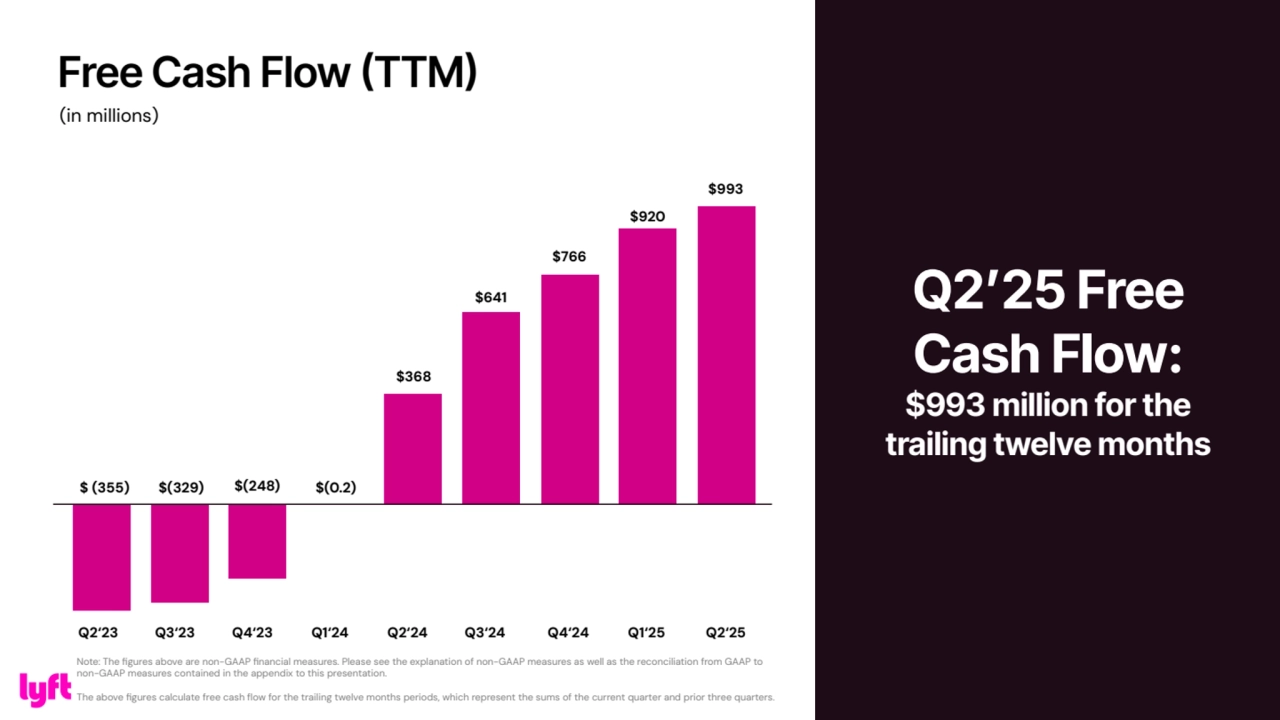
- 12. Free Cash Flow (TTM) 12 (in millions) Note: The figures above are non-GAAP financial measures. Please see the explanation of non-GAAP measures as well as the reconciliation from GAAP to non-GAAP measures contained in the appendix to this presentation. The above figures calculate free cash flow for the trailing twelve months periods, which represent the sums of the current quarter and prior three quarters. Q2ʼ25 Free Cash Flow: $993 million for the trailing twelve months $ (355) $(329) $(248) $(0.2) $368 $641 $766 $920 $993 Q2‘23 Q3‘23 Q4‘23 Q1‘24 Q2‘24 Q3‘24 Q4‘24 Q1‘25 Q2‘25
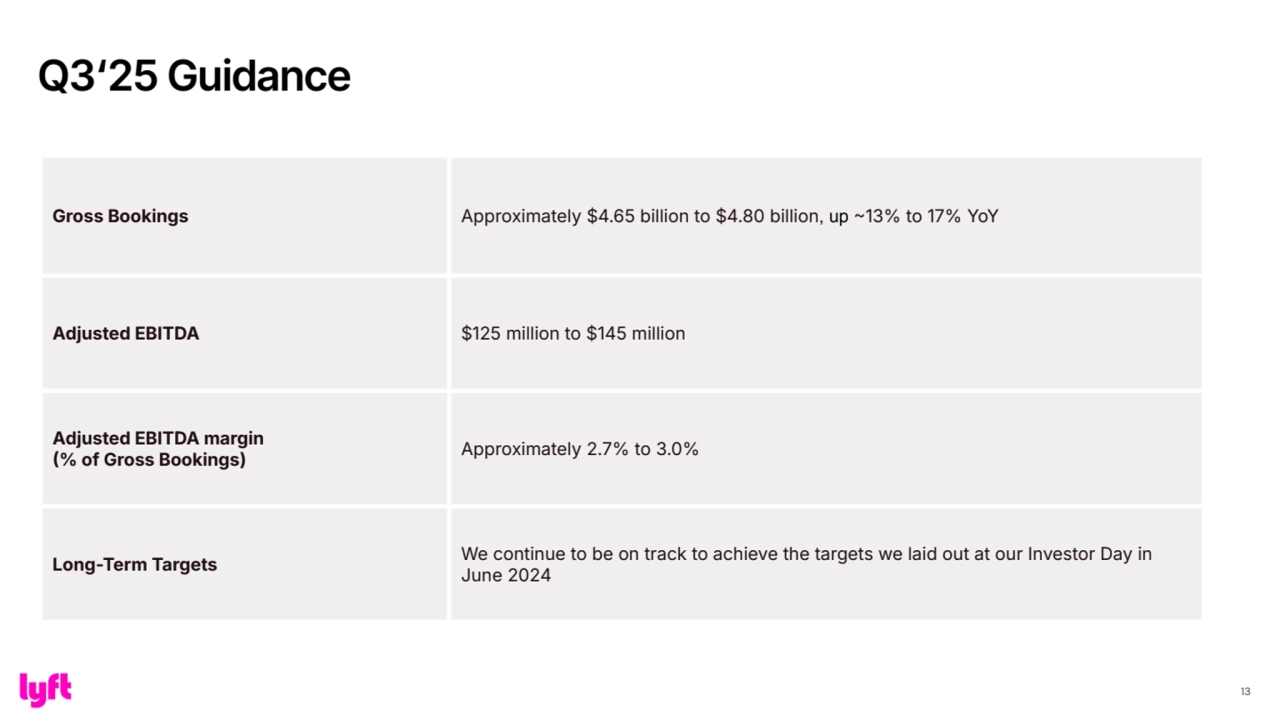
- 13. 13 Gross Bookings Approximately $4.65 billion to $4.80 billion, up 13% to 17% YoY Adjusted EBITDA $125 million to $145 million Adjusted EBITDA margin % of Gross Bookings) Approximately 2.7% to 3.0% Long-Term Targets We continue to be on track to achieve the targets we laid out at our Investor Day in June 2024 Q3‘25 Guidance
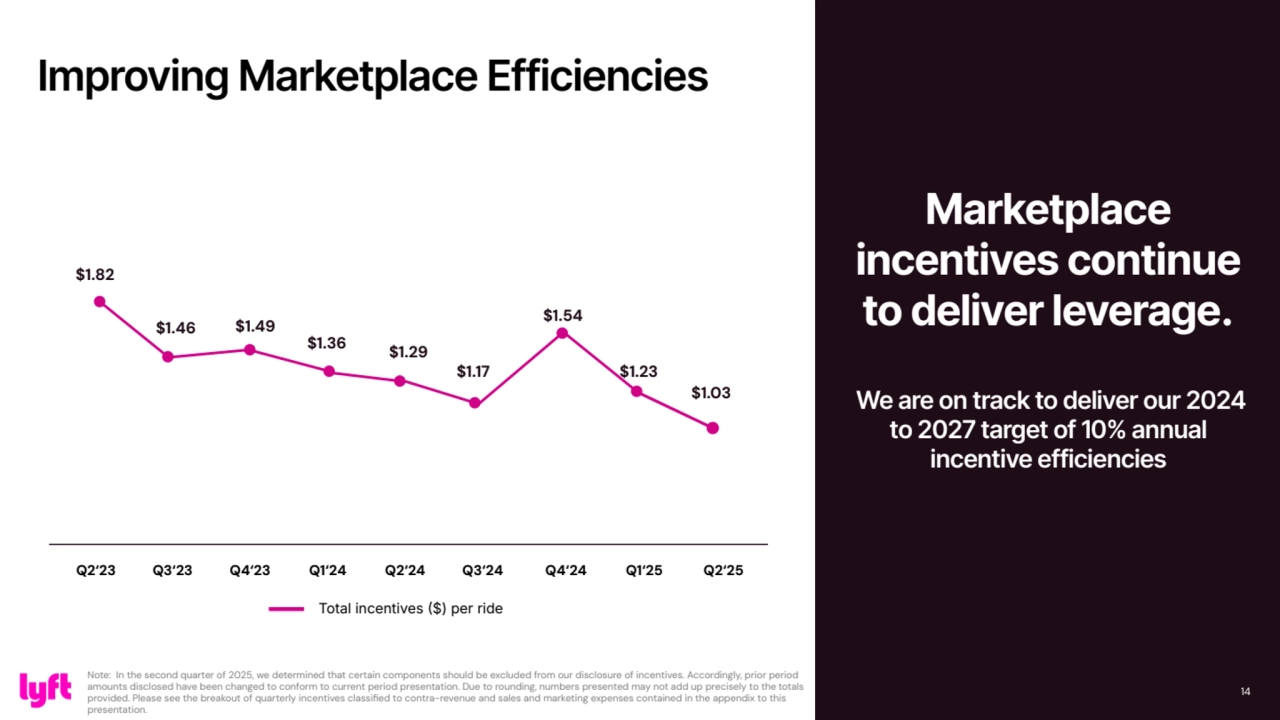
- 14. Marketplace incentives continue to deliver leverage. We are on track to deliver our 2024 to 2027 target of 10% annual incentive efficiencies 14 Improving Marketplace Efficiencies $1.82 $1.29 Note: In the second quarter of 2025, we determined that certain components should be excluded from our disclosure of incentives. Accordingly, prior period amounts disclosed have been changed to conform to current period presentation. Due to rounding, numbers presented may not add up precisely to the totals provided. Please see the breakout of quarterly incentives classified to contra-revenue and sales and marketing expenses contained in the appendix to this presentation. Total incentives $) per ride $1.46 $1.49 $1.36 $1.17 $1.54 $1.23 Q2‘23 Q3‘23 Q4‘23 Q1‘24 Q2‘24 Q3‘24 Q4‘24 Q1‘25 Q2‘25 $1.03
- 15. Financial Results: Reconciliations from GAAP to Non-GAAP and Trended Financial Statements
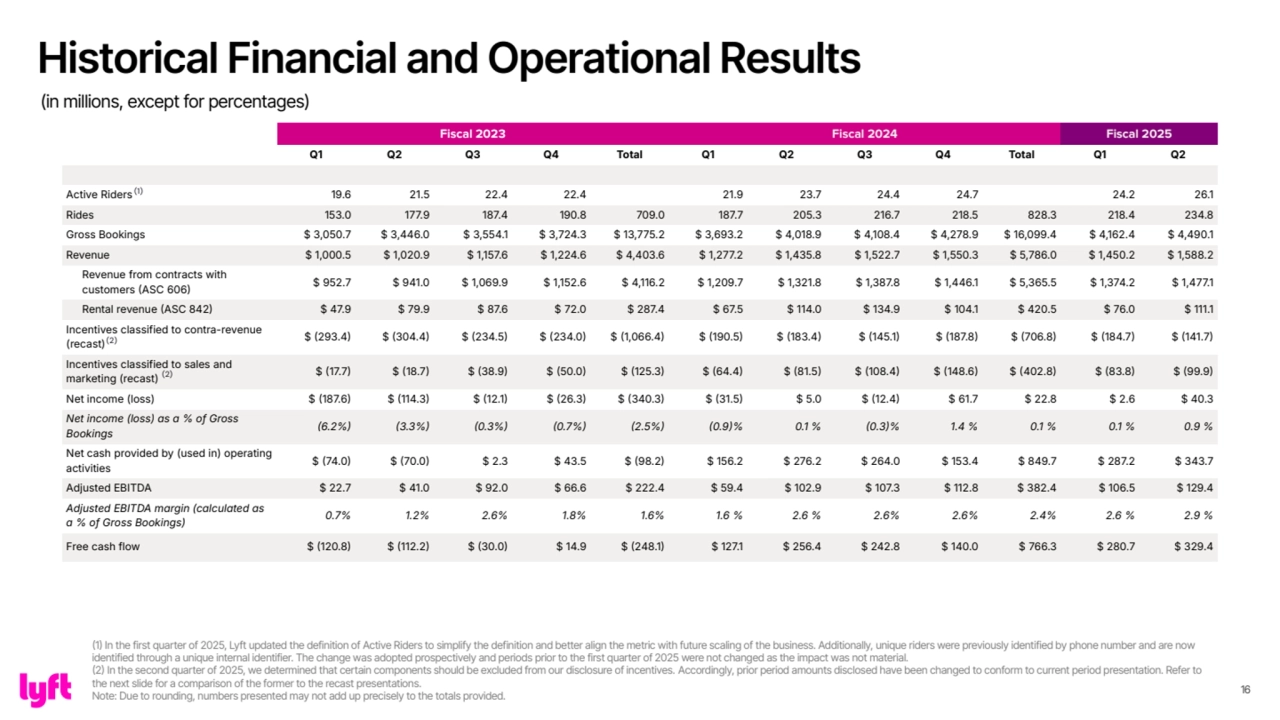
- 16. 16 Fiscal 2023 Fiscal 2024 Fiscal 2025 Q1 Q2 Q3 Q4 Total Q1 Q2 Q3 Q4 Total Q1 Q2 Active Riders 19.6 21.5 22.4 22.4 21.9 23.7 24.4 24.7 24.2 26.1 Rides 153.0 177.9 187.4 190.8 709.0 187.7 205.3 216.7 218.5 828.3 218.4 234.8 Gross Bookings $ 3,050.7 $ 3,446.0 $ 3,554.1 $ 3,724.3 $ 13,775.2 $ 3,693.2 $ 4,018.9 $ 4,108.4 $ 4,278.9 $ 16,099.4 $ 4,162.4 $ 4,490.1 Revenue $ 1,000.5 $ 1,020.9 $ 1,157.6 $ 1,224.6 $ 4,403.6 $ 1,277.2 $ 1,435.8 $ 1,522.7 $ 1,550.3 $ 5,786.0 $ 1,450.2 $ 1,588.2 Revenue from contracts with customers ASC 606 $ 952.7 $ 941.0 $ 1,069.9 $ 1,152.6 $ 4,116.2 $ 1,209.7 $ 1,321.8 $ 1,387.8 $ 1,446.1 $ 5,365.5 $ 1,374.2 $ 1,477.1 Rental revenue ASC 842 $ 47.9 $ 79.9 $ 87.6 $ 72.0 $ 287.4 $ 67.5 $ 114.0 $ 134.9 $ 104.1 $ 420.5 $ 76.0 $ 111.1 Incentives classified to contra-revenue (recast) $ 293.4 $ 304.4 $ 234.5 $ 234.0 $ 1,066.4 $ 190.5 $ 183.4 $ 145.1 $ 187.8 $ 706.8 $ 184.7 $ 141.7 Incentives classified to sales and marketing (recast) $ 17.7 $ 18.7 $ 38.9 $ 50.0 $ 125.3 $ 64.4 $ 81.5 $ 108.4 $ 148.6 $ 402.8 $ 83.8 $ 99.9 Net income (loss) $ 187.6 $ 114.3 $ 12.1 $ 26.3 $ 340.3 $ 31.5 $ 5.0 $ 12.4 $ 61.7 $ 22.8 $ 2.6 $ 40.3 Net income (loss) as a % of Gross Bookings 6.2% 3.3% 0.3% 0.7% 2.5% 0.9% 0.1 % 0.3% 1.4 % 0.1 % 0.1 % 0.9 % Net cash provided by (used in) operating activities $ 74.0 $ 70.0 $ 2.3 $ 43.5 $ 98.2 $ 156.2 $ 276.2 $ 264.0 $ 153.4 $ 849.7 $ 287.2 $ 343.7 Adjusted EBITDA $ 22.7 $ 41.0 $ 92.0 $ 66.6 $ 222.4 $ 59.4 $ 102.9 $ 107.3 $ 112.8 $ 382.4 $ 106.5 $ 129.4 Adjusted EBITDA margin (calculated as a % of Gross Bookings) 0.7% 1.2% 2.6% 1.8% 1.6% 1.6 % 2.6 % 2.6% 2.6% 2.4% 2.6 % 2.9 % Free cash flow $ 120.8 $ 112.2 $ 30.0 $ 14.9 $ 248.1 $ 127.1 $ 256.4 $ 242.8 $ 140.0 $ 766.3 $ 280.7 $ 329.4 (1) Historical Financial and Operational Results (in millions, except for percentages) (1) In the first quarter of 2025, Lyft updated the definition of Active Riders to simplify the definition and better align the metric with future scaling of the business. Additionally, unique riders were previously identified by phone number and are now identified through a unique internal identifier. The change was adopted prospectively and periods prior to the first quarter of 2025 were not changed as the impact was not material. (2) In the second quarter of 2025, we determined that certain components should be excluded from our disclosure of incentives. Accordingly, prior period amounts disclosed have been changed to conform to current period presentation. Refer to the next slide for a comparison of the former to the recast presentations. Note: Due to rounding, numbers presented may not add up precisely to the totals provided. (2) (2)
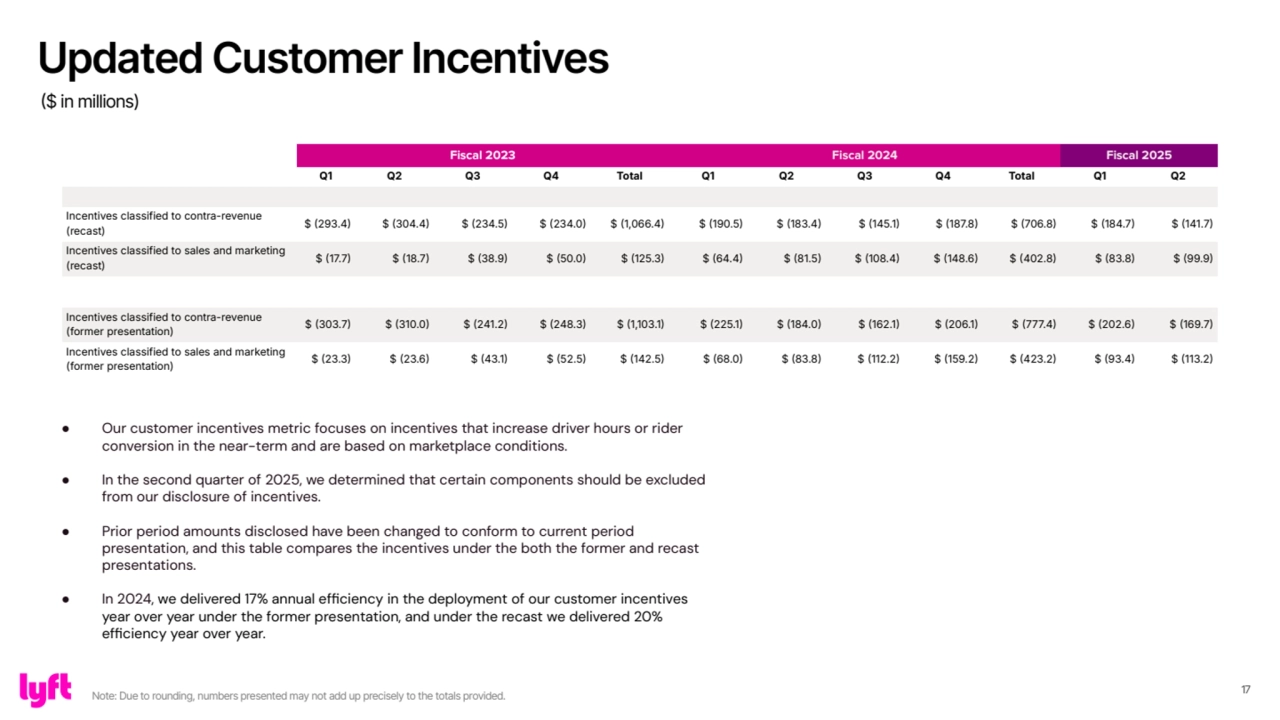
- 17. 17 Fiscal 2023 Fiscal 2024 Fiscal 2025 Q1 Q2 Q3 Q4 Total Q1 Q2 Q3 Q4 Total Q1 Q2 Incentives classified to contra-revenue (recast) $ 293.4 $ 304.4 $ 234.5 $ 234.0 $ 1,066.4 $ 190.5 $ 183.4 $ 145.1 $ 187.8 $ 706.8 $ 184.7 $ 141.7 Incentives classified to sales and marketing (recast) $ 17.7 $ 18.7 $ 38.9 $ 50.0 $ 125.3 $ 64.4 $ 81.5 $ 108.4 $ 148.6 $ 402.8 $ 83.8 $ 99.9 Incentives classified to contra-revenue (former presentation) $ 303.7 $ 310.0 $ 241.2 $ 248.3 $ 1,103.1 $ 225.1 $ 184.0 $ 162.1 $ 206.1 $ 777.4 $ 202.6 $ 169.7 Incentives classified to sales and marketing (former presentation) $ 23.3 $ 23.6 $ 43.1 $ 52.5 $ 142.5 $ 68.0 $ 83.8 $ 112.2 $ 159.2 $ 423.2 $ 93.4 $ 113.2 Updated Customer Incentives ($ in millions) Note: Due to rounding, numbers presented may not add up precisely to the totals provided. ● Our customer incentives metric focuses on incentives that increase driver hours or rider conversion in the near-term and are based on marketplace conditions. ● In the second quarter of 2025, we determined that certain components should be excluded from our disclosure of incentives. ● Prior period amounts disclosed have been changed to conform to current period presentation, and this table compares the incentives under the both the former and recast presentations. ● In 2024, we delivered 17% annual efficiency in the deployment of our customer incentives year over year under the former presentation, and under the recast we delivered 20% efficiency year over year.
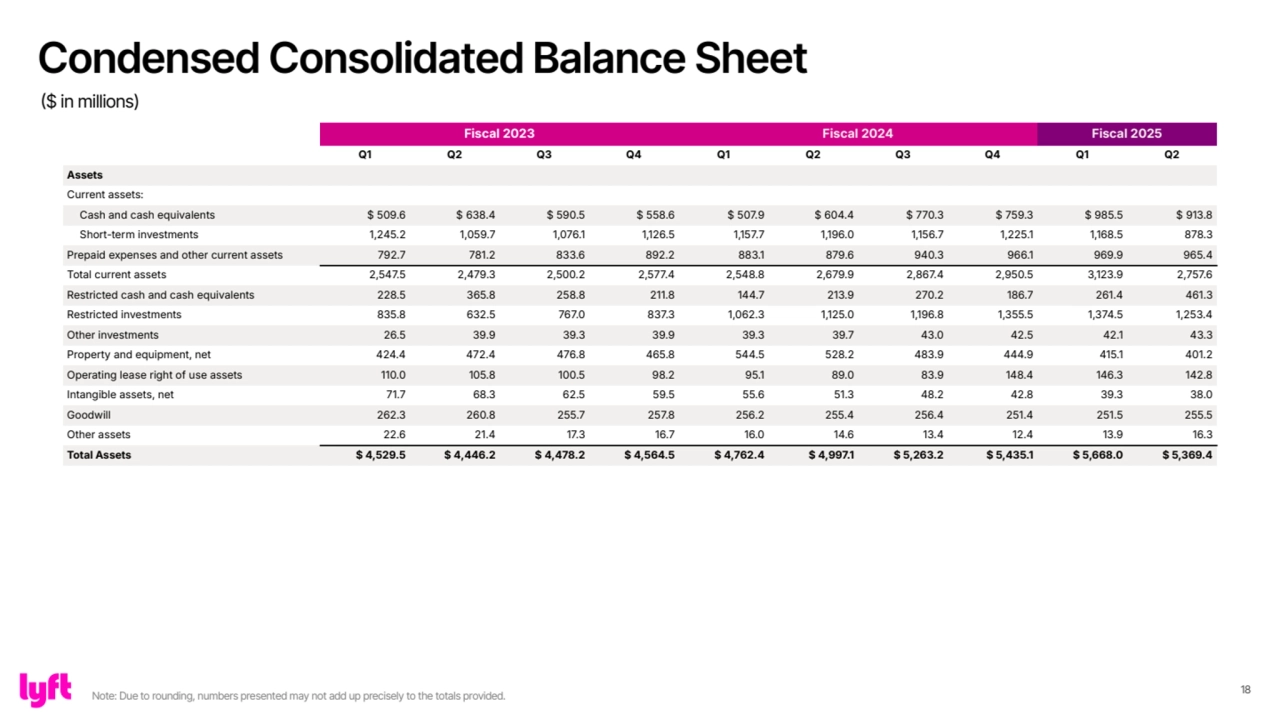
- 18. 18 Fiscal 2023 Fiscal 2024 Fiscal 2025 Q1 Q2 Q3 Q4 Q1 Q2 Q3 Q4 Q1 Q2 Assets Current assets: Cash and cash equivalents $ 509.6 $ 638.4 $ 590.5 $ 558.6 $ 507.9 $ 604.4 $ 770.3 $ 759.3 $ 985.5 $ 913.8 Short-term investments 1,245.2 1,059.7 1,076.1 1,126.5 1,157.7 1,196.0 1,156.7 1,225.1 1,168.5 878.3 Prepaid expenses and other current assets 792.7 781.2 833.6 892.2 883.1 879.6 940.3 966.1 969.9 965.4 Total current assets 2,547.5 2,479.3 2,500.2 2,577.4 2,548.8 2,679.9 2,867.4 2,950.5 3,123.9 2,757.6 Restricted cash and cash equivalents 228.5 365.8 258.8 211.8 144.7 213.9 270.2 186.7 261.4 461.3 Restricted investments 835.8 632.5 767.0 837.3 1,062.3 1,125.0 1,196.8 1,355.5 1,374.5 1,253.4 Other investments 26.5 39.9 39.3 39.9 39.3 39.7 43.0 42.5 42.1 43.3 Property and equipment, net 424.4 472.4 476.8 465.8 544.5 528.2 483.9 444.9 415.1 401.2 Operating lease right of use assets 110.0 105.8 100.5 98.2 95.1 89.0 83.9 148.4 146.3 142.8 Intangible assets, net 71.7 68.3 62.5 59.5 55.6 51.3 48.2 42.8 39.3 38.0 Goodwill 262.3 260.8 255.7 257.8 256.2 255.4 256.4 251.4 251.5 255.5 Other assets 22.6 21.4 17.3 16.7 16.0 14.6 13.4 12.4 13.9 16.3 Total Assets $ 4,529.5 $ 4,446.2 $ 4,478.2 $ 4,564.5 $ 4,762.4 $ 4,997.1 $ 5,263.2 $ 5,435.1 $ 5,668.0 $ 5,369.4 Condensed Consolidated Balance Sheet ($ in millions) Note: Due to rounding, numbers presented may not add up precisely to the totals provided.
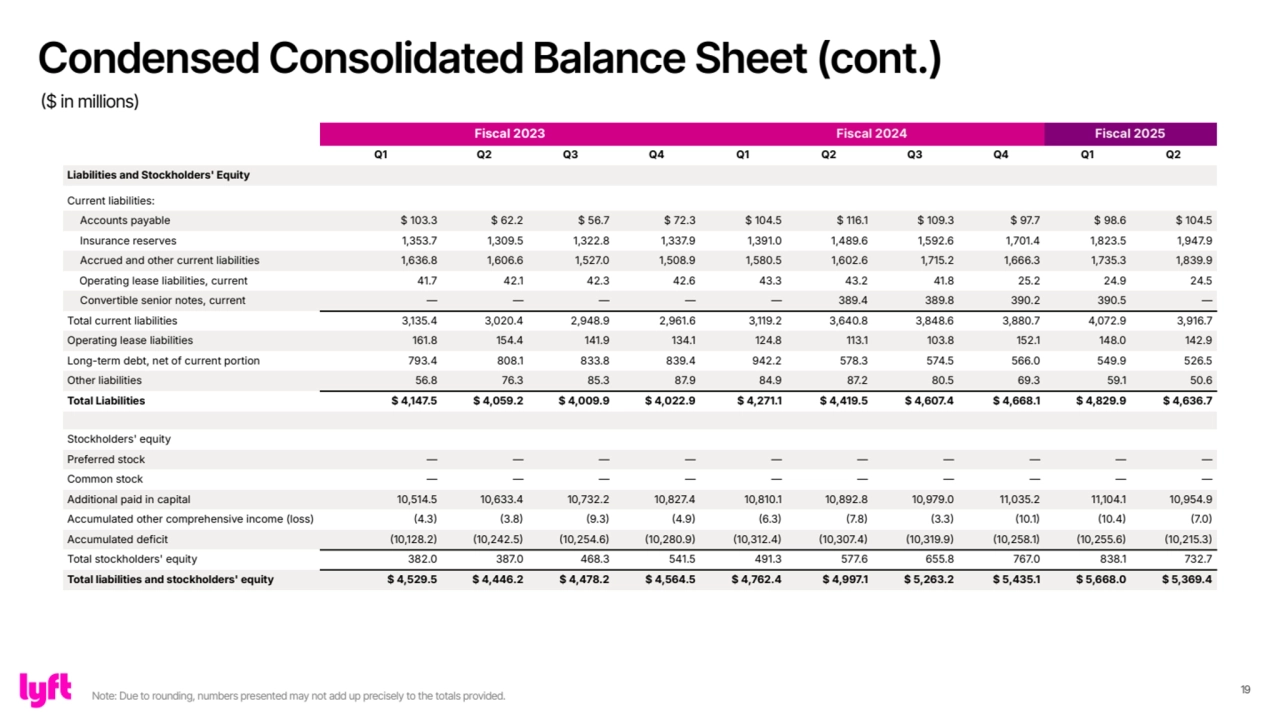
- 19. 19 Fiscal 2023 Fiscal 2024 Fiscal 2025 Q1 Q2 Q3 Q4 Q1 Q2 Q3 Q4 Q1 Q2 Liabilities and Stockholders' Equity Current liabilities: Accounts payable $ 103.3 $ 62.2 $ 56.7 $ 72.3 $ 104.5 $ 116.1 $ 109.3 $ 97.7 $ 98.6 $ 104.5 Insurance reserves 1,353.7 1,309.5 1,322.8 1,337.9 1,391.0 1,489.6 1,592.6 1,701.4 1,823.5 1,947.9 Accrued and other current liabilities 1,636.8 1,606.6 1,527.0 1,508.9 1,580.5 1,602.6 1,715.2 1,666.3 1,735.3 1,839.9 Operating lease liabilities, current 41.7 42.1 42.3 42.6 43.3 43.2 41.8 25.2 24.9 24.5 Convertible senior notes, current — — — — — 389.4 389.8 390.2 390.5 — Total current liabilities 3,135.4 3,020.4 2,948.9 2,961.6 3,119.2 3,640.8 3,848.6 3,880.7 4,072.9 3,916.7 Operating lease liabilities 161.8 154.4 141.9 134.1 124.8 113.1 103.8 152.1 148.0 142.9 Long-term debt, net of current portion 793.4 808.1 833.8 839.4 942.2 578.3 574.5 566.0 549.9 526.5 Other liabilities 56.8 76.3 85.3 87.9 84.9 87.2 80.5 69.3 59.1 50.6 Total Liabilities $ 4,147.5 $ 4,059.2 $ 4,009.9 $ 4,022.9 $ 4,271.1 $ 4,419.5 $ 4,607.4 $ 4,668.1 $ 4,829.9 $ 4,636.7 Stockholders' equity Preferred stock — — — — — — — — — — Common stock — — — — — — — — — — Additional paid in capital 10,514.5 10,633.4 10,732.2 10,827.4 10,810.1 10,892.8 10,979.0 11,035.2 11,104.1 10,954.9 Accumulated other comprehensive income (loss) 4.3 3.8 9.3 4.9 6.3 7.8 3.3 10.1 10.4 7.0 Accumulated deficit 10,128.2 10,242.5 10,254.6 10,280.9 10,312.4 10,307.4 10,319.9 10,258.1 10,255.6 10,215.3 Total stockholders' equity 382.0 387.0 468.3 541.5 491.3 577.6 655.8 767.0 838.1 732.7 Total liabilities and stockholders' equity $ 4,529.5 $ 4,446.2 $ 4,478.2 $ 4,564.5 $ 4,762.4 $ 4,997.1 $ 5,263.2 $ 5,435.1 $ 5,668.0 $ 5,369.4 Condensed Consolidated Balance Sheet (cont.) ($ in millions) Note: Due to rounding, numbers presented may not add up precisely to the totals provided.
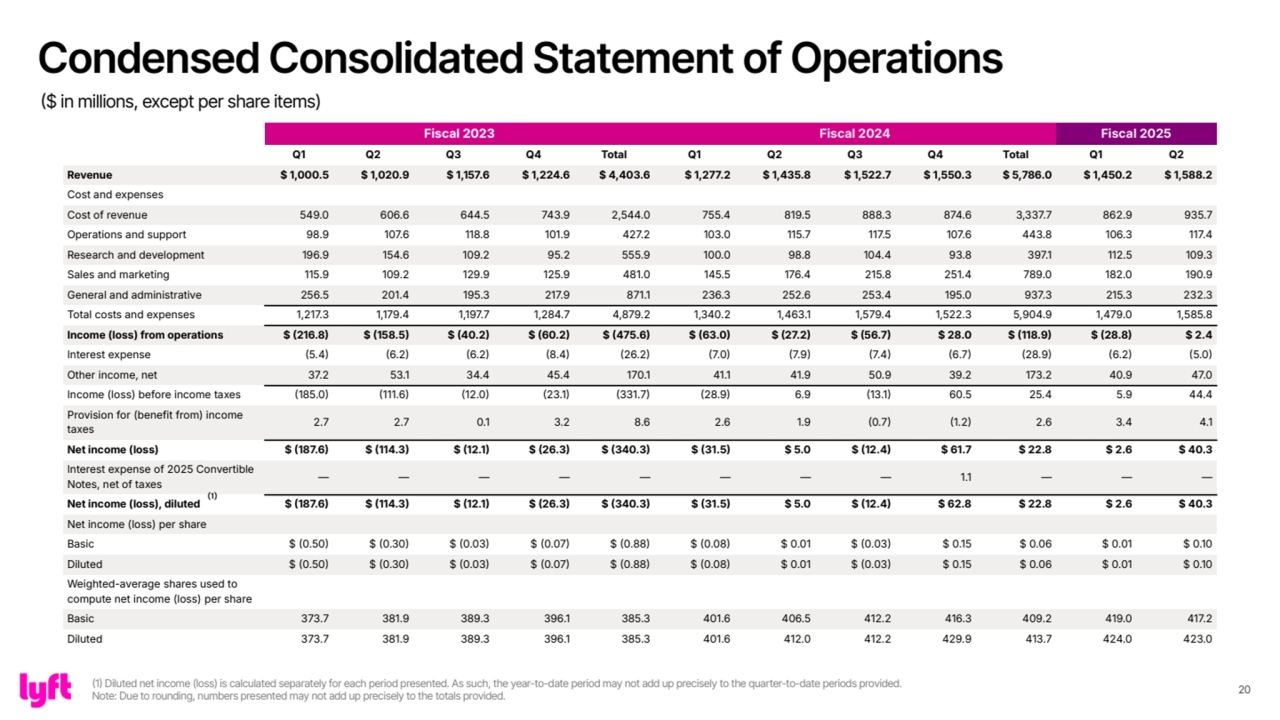
- 20. 20 Fiscal 2023 Fiscal 2024 Fiscal 2025 Q1 Q2 Q3 Q4 Total Q1 Q2 Q3 Q4 Total Q1 Q2 Revenue $ 1,000.5 $ 1,020.9 $ 1,157.6 $ 1,224.6 $ 4,403.6 $ 1,277.2 $ 1,435.8 $ 1,522.7 $ 1,550.3 $ 5,786.0 $ 1,450.2 $ 1,588.2 Cost and expenses Cost of revenue 549.0 606.6 644.5 743.9 2,544.0 755.4 819.5 888.3 874.6 3,337.7 862.9 935.7 Operations and support 98.9 107.6 118.8 101.9 427.2 103.0 115.7 117.5 107.6 443.8 106.3 117.4 Research and development 196.9 154.6 109.2 95.2 555.9 100.0 98.8 104.4 93.8 397.1 112.5 109.3 Sales and marketing 115.9 109.2 129.9 125.9 481.0 145.5 176.4 215.8 251.4 789.0 182.0 190.9 General and administrative 256.5 201.4 195.3 217.9 871.1 236.3 252.6 253.4 195.0 937.3 215.3 232.3 Total costs and expenses 1,217.3 1,179.4 1,197.7 1,284.7 4,879.2 1,340.2 1,463.1 1,579.4 1,522.3 5,904.9 1,479.0 1,585.8 Income (loss) from operations $ 216.8 $ 158.5 $ 40.2 $ 60.2 $ 475.6 $ 63.0 $ 27.2 $ 56.7 $ 28.0 $ 118.9 $ 28.8 $ 2.4 Interest expense 5.4 6.2 6.2 8.4 26.2 7.0 7.9 7.4 6.7 28.9 6.2 5.0 Other income, net 37.2 53.1 34.4 45.4 170.1 41.1 41.9 50.9 39.2 173.2 40.9 47.0 Income (loss) before income taxes 185.0 111.6 12.0 23.1 331.7 28.9 6.9 13.1 60.5 25.4 5.9 44.4 Provision for (benefit from) income taxes 2.7 2.7 0.1 3.2 8.6 2.6 1.9 0.7 1.2 2.6 3.4 4.1 Net income (loss) $ 187.6 $ 114.3 $ 12.1 $ 26.3 $ 340.3 $ 31.5 $ 5.0 $ 12.4 $ 61.7 $ 22.8 $ 2.6 $ 40.3 Interest expense of 2025 Convertible Notes, net of taxes — — — — — — — — 1.1 — — — Net income (loss), diluted $ 187.6 $ 114.3 $ 12.1 $ 26.3 $ 340.3 $ 31.5 $ 5.0 $ 12.4 $ 62.8 $ 22.8 $ 2.6 $ 40.3 Net income (loss) per share Basic $ 0.50 $ 0.30 $ 0.03 $ 0.07 $ 0.88 $ 0.08 $ 0.01 $ 0.03 $ 0.15 $ 0.06 $ 0.01 $ 0.10 Diluted $ 0.50 $ 0.30 $ 0.03 $ 0.07 $ 0.88 $ 0.08 $ 0.01 $ 0.03 $ 0.15 $ 0.06 $ 0.01 $ 0.10 Weighted-average shares used to compute net income (loss) per share Basic 373.7 381.9 389.3 396.1 385.3 401.6 406.5 412.2 416.3 409.2 419.0 417.2 Diluted 373.7 381.9 389.3 396.1 385.3 401.6 412.0 412.2 429.9 413.7 424.0 423.0 (1) Condensed Consolidated Statement of Operations ($ in millions, except per share items) (1) Diluted net income (loss) is calculated separately for each period presented. As such, the year-to-date period may not add up precisely to the quarter-to-date periods provided. Note: Due to rounding, numbers presented may not add up precisely to the totals provided.
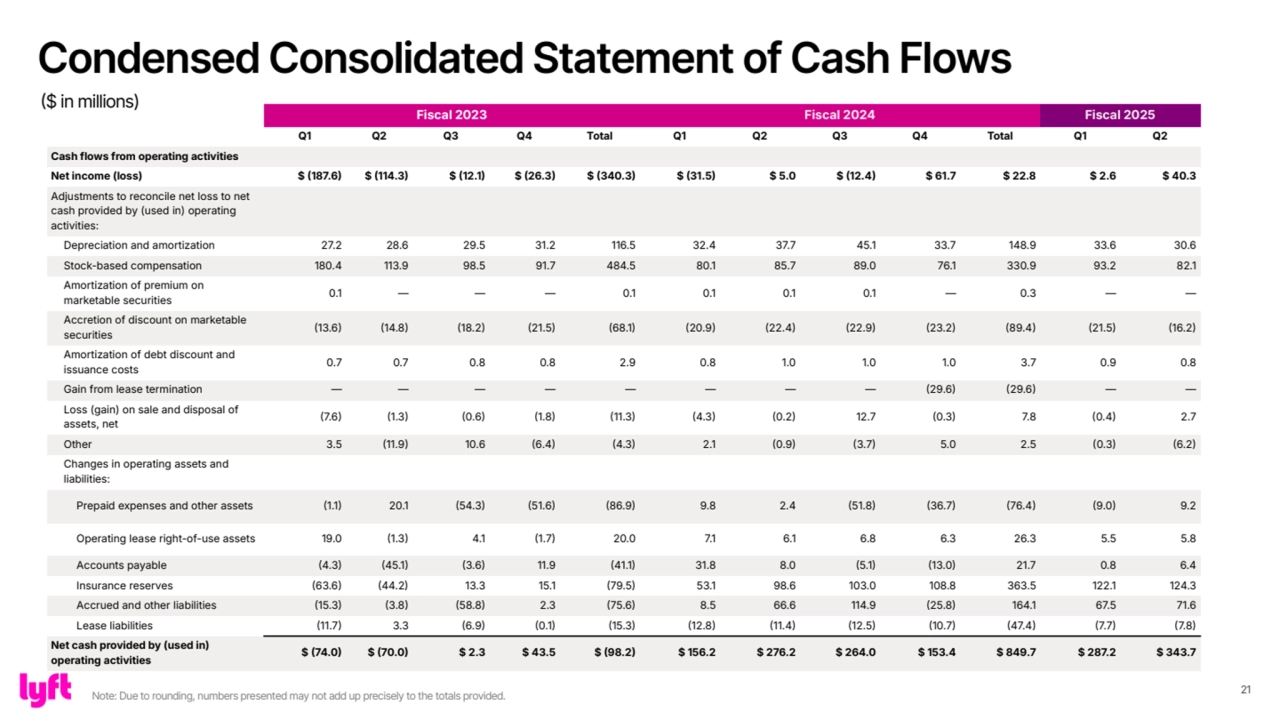
- 21. 21 Fiscal 2023 Fiscal 2024 Fiscal 2025 Q1 Q2 Q3 Q4 Total Q1 Q2 Q3 Q4 Total Q1 Q2 Cash flows from operating activities Net income (loss) $ 187.6 $ 114.3 $ 12.1 $ 26.3 $ 340.3 $ 31.5 $ 5.0 $ 12.4 $ 61.7 $ 22.8 $ 2.6 $ 40.3 Adjustments to reconcile net loss to net cash provided by (used in) operating activities: Depreciation and amortization 27.2 28.6 29.5 31.2 116.5 32.4 37.7 45.1 33.7 148.9 33.6 30.6 Stock-based compensation 180.4 113.9 98.5 91.7 484.5 80.1 85.7 89.0 76.1 330.9 93.2 82.1 Amortization of premium on marketable securities 0.1 — — — 0.1 0.1 0.1 0.1 — 0.3 — — Accretion of discount on marketable securities 13.6 14.8 18.2 21.5 68.1 20.9 22.4 22.9 23.2 89.4 21.5 16.2 Amortization of debt discount and issuance costs 0.7 0.7 0.8 0.8 2.9 0.8 1.0 1.0 1.0 3.7 0.9 0.8 Gain from lease termination — — — — — — — — 29.6 29.6 — — Loss (gain) on sale and disposal of assets, net 7.6 1.3 0.6 1.8 11.3 4.3 0.2 12.7 0.3 7.8 0.4 2.7 Other 3.5 11.9 10.6 6.4 4.3 2.1 0.9 3.7 5.0 2.5 0.3 6.2 Changes in operating assets and liabilities: Prepaid expenses and other assets 1.1 20.1 54.3 51.6 86.9 9.8 2.4 51.8 36.7 76.4 9.0 9.2 Operating lease right-of-use assets 19.0 1.3 4.1 1.7 20.0 7.1 6.1 6.8 6.3 26.3 5.5 5.8 Accounts payable 4.3 45.1 3.6 11.9 41.1 31.8 8.0 5.1 13.0 21.7 0.8 6.4 Insurance reserves 63.6 44.2 13.3 15.1 79.5 53.1 98.6 103.0 108.8 363.5 122.1 124.3 Accrued and other liabilities 15.3 3.8 58.8 2.3 75.6 8.5 66.6 114.9 25.8 164.1 67.5 71.6 Lease liabilities 11.7 3.3 6.9 0.1 15.3 12.8 11.4 12.5 10.7 47.4 7.7 7.8 Net cash provided by (used in) operating activities $ 74.0 $ 70.0 $ 2.3 $ 43.5 $ 98.2 $ 156.2 $ 276.2 $ 264.0 $ 153.4 $ 849.7 $ 287.2 $ 343.7 Condensed Consolidated Statement of Cash Flows Note: Due to rounding, numbers presented may not add up precisely to the totals provided. ($ in millions)
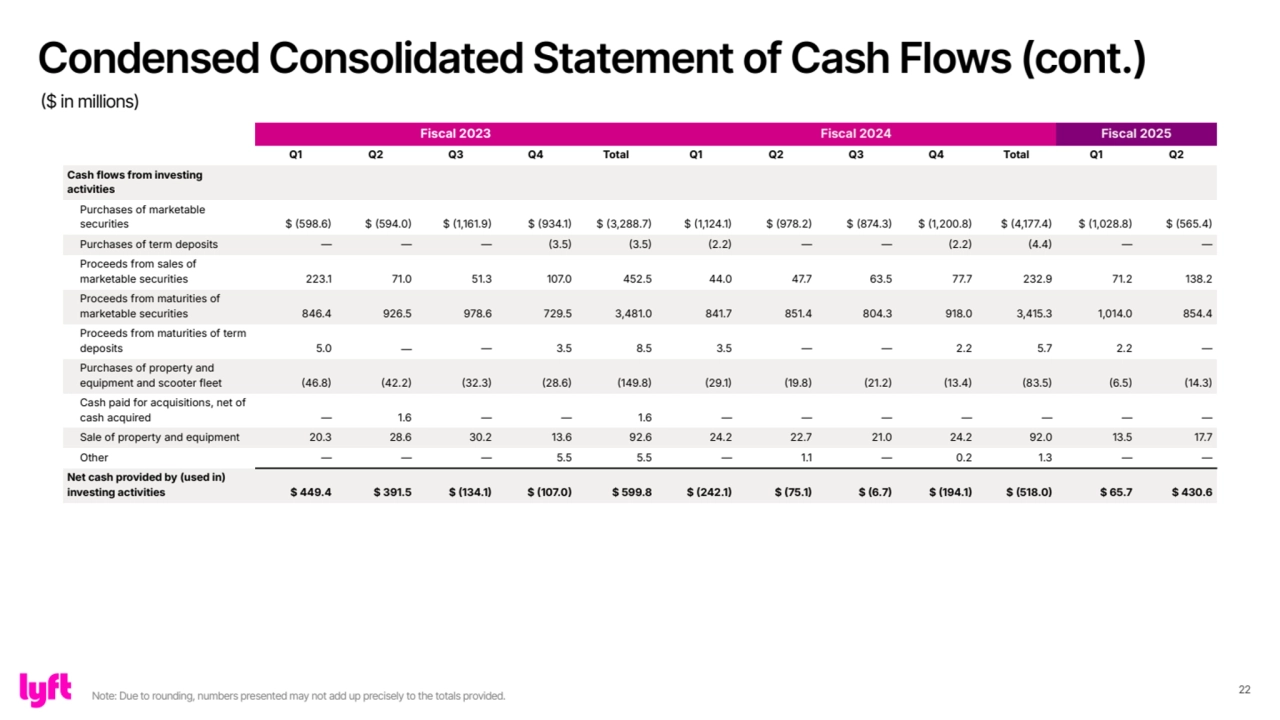
- 22. 22 Fiscal 2023 Fiscal 2024 Fiscal 2025 Q1 Q2 Q3 Q4 Total Q1 Q2 Q3 Q4 Total Q1 Q2 Cash flows from investing activities Purchases of marketable securities $ 598.6 $ 594.0 $ 1,161.9 $ 934.1 $ 3,288.7 $ 1,124.1 $ 978.2 $ 874.3 $ 1,200.8 $ 4,177.4 $ 1,028.8 $ 565.4 Purchases of term deposits — — — 3.5 3.5 2.2 — — 2.2 4.4 — — Proceeds from sales of marketable securities 223.1 71.0 51.3 107.0 452.5 44.0 47.7 63.5 77.7 232.9 71.2 138.2 Proceeds from maturities of marketable securities 846.4 926.5 978.6 729.5 3,481.0 841.7 851.4 804.3 918.0 3,415.3 1,014.0 854.4 Proceeds from maturities of term deposits 5.0 — — 3.5 8.5 3.5 — — 2.2 5.7 2.2 — Purchases of property and equipment and scooter fleet 46.8 42.2 32.3 28.6 149.8 29.1 19.8 21.2 13.4 83.5 6.5 14.3 Cash paid for acquisitions, net of cash acquired — 1.6 — — 1.6 — — — — — — — Sale of property and equipment 20.3 28.6 30.2 13.6 92.6 24.2 22.7 21.0 24.2 92.0 13.5 17.7 Other — — — 5.5 5.5 — 1.1 — 0.2 1.3 — — Net cash provided by (used in) investing activities $ 449.4 $ 391.5 $ 134.1 $ 107.0 $ 599.8 $ 242.1 $ 75.1 $ 6.7 $ 194.1 $ 518.0 $ 65.7 $ 430.6 Condensed Consolidated Statement of Cash Flows (cont.) ($ in millions) Note: Due to rounding, numbers presented may not add up precisely to the totals provided.
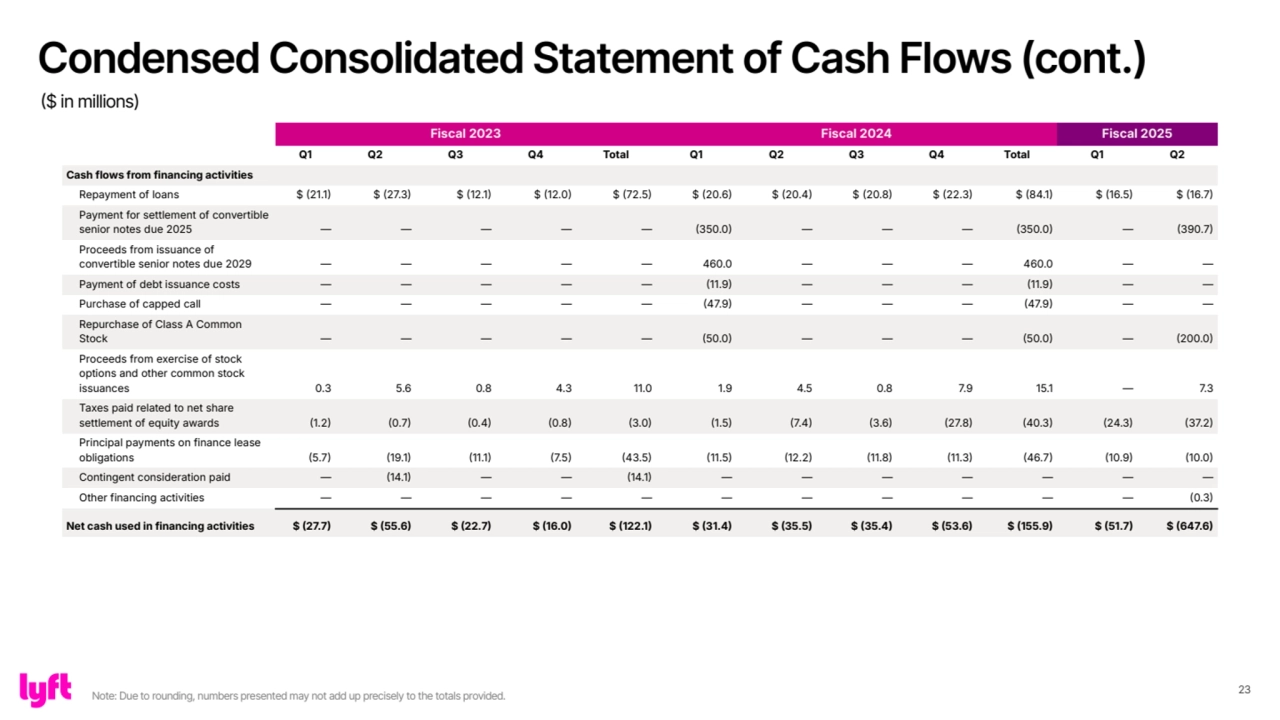
- 23. 23 Fiscal 2023 Fiscal 2024 Fiscal 2025 Q1 Q2 Q3 Q4 Total Q1 Q2 Q3 Q4 Total Q1 Q2 Cash flows from financing activities Repayment of loans $ 21.1 $ 27.3 $ 12.1 $ 12.0 $ 72.5 $ 20.6 $ 20.4 $ 20.8 $ 22.3 $ 84.1 $ 16.5 $ 16.7 Payment for settlement of convertible senior notes due 2025 — — — — — 350.0 — — — 350.0 — 390.7 Proceeds from issuance of convertible senior notes due 2029 — — — — — 460.0 — — — 460.0 — — Payment of debt issuance costs — — — — — 11.9 — — — 11.9 — — Purchase of capped call — — — — — 47.9 — — — 47.9 — — Repurchase of Class A Common Stock — — — — — 50.0 — — — 50.0 — 200.0 Proceeds from exercise of stock options and other common stock issuances 0.3 5.6 0.8 4.3 11.0 1.9 4.5 0.8 7.9 15.1 — 7.3 Taxes paid related to net share settlement of equity awards 1.2 0.7 0.4 0.8 3.0 1.5 7.4 3.6 27.8 40.3 24.3 37.2 Principal payments on finance lease obligations 5.7 19.1 11.1 7.5 43.5 11.5 12.2 11.8 11.3 46.7 10.9 10.0 Contingent consideration paid — 14.1 — — 14.1 — — — — — — — Other financing activities — — — — — — — — — — — 0.3 Net cash used in financing activities $ 27.7 $ 55.6 $ 22.7 $ 16.0 $ 122.1 $ 31.4 $ 35.5 $ 35.4 $ 53.6 $ 155.9 $ 51.7 $ 647.6 Condensed Consolidated Statement of Cash Flows (cont.) ($ in millions) Note: Due to rounding, numbers presented may not add up precisely to the totals provided.
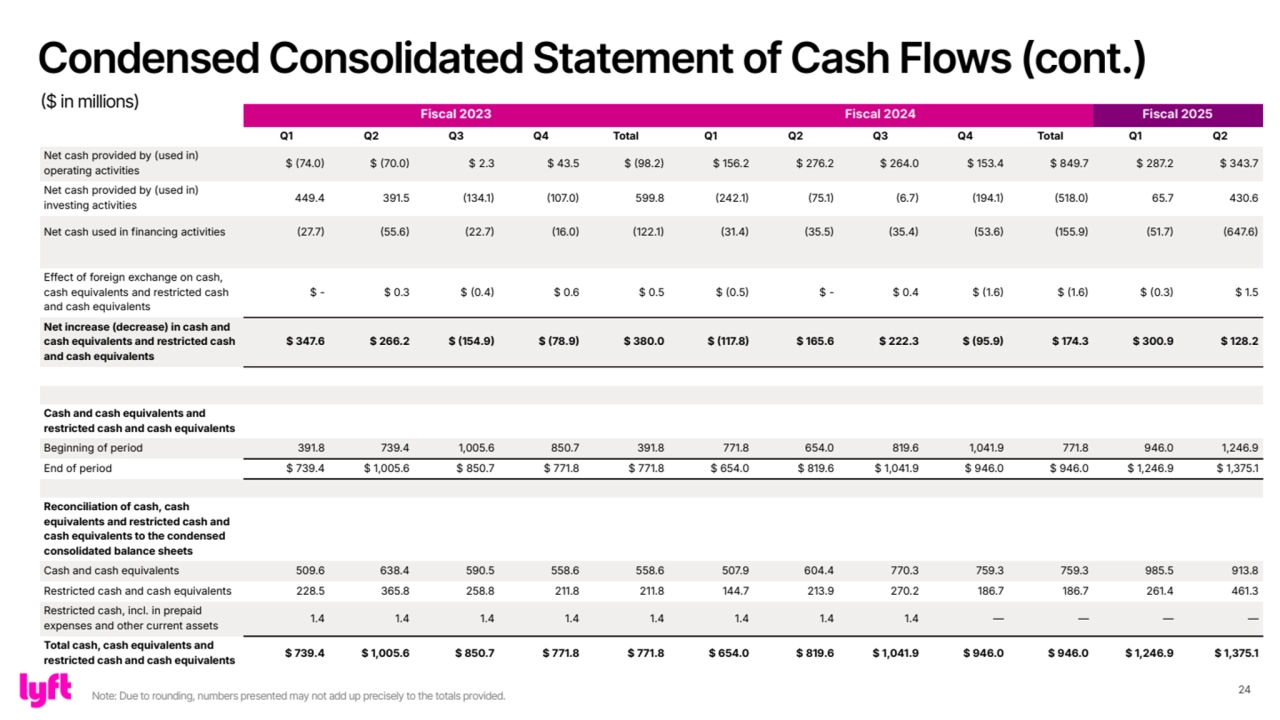
- 24. 24 Fiscal 2023 Fiscal 2024 Fiscal 2025 Q1 Q2 Q3 Q4 Total Q1 Q2 Q3 Q4 Total Q1 Q2 Net cash provided by (used in) operating activities $ 74.0 $ 70.0 $ 2.3 $ 43.5 $ 98.2 $ 156.2 $ 276.2 $ 264.0 $ 153.4 $ 849.7 $ 287.2 $ 343.7 Net cash provided by (used in) investing activities 449.4 391.5 134.1 107.0 599.8 242.1 75.1 6.7 194.1 518.0 65.7 430.6 Net cash used in financing activities 27.7 55.6 22.7 16.0 122.1 31.4 35.5 35.4 53.6 155.9 51.7 647.6 Effect of foreign exchange on cash, cash equivalents and restricted cash and cash equivalents $ - $ 0.3 $ 0.4 $ 0.6 $ 0.5 $ 0.5 $ - $ 0.4 $ 1.6 $ 1.6 $ 0.3 $ 1.5 Net increase (decrease) in cash and cash equivalents and restricted cash and cash equivalents $ 347.6 $ 266.2 $ 154.9 $ 78.9 $ 380.0 $ 117.8 $ 165.6 $ 222.3 $ 95.9 $ 174.3 $ 300.9 $ 128.2 Cash and cash equivalents and restricted cash and cash equivalents Beginning of period 391.8 739.4 1,005.6 850.7 391.8 771.8 654.0 819.6 1,041.9 771.8 946.0 1,246.9 End of period $ 739.4 $ 1,005.6 $ 850.7 $ 771.8 $ 771.8 $ 654.0 $ 819.6 $ 1,041.9 $ 946.0 $ 946.0 $ 1,246.9 $ 1,375.1 Reconciliation of cash, cash equivalents and restricted cash and cash equivalents to the condensed consolidated balance sheets Cash and cash equivalents 509.6 638.4 590.5 558.6 558.6 507.9 604.4 770.3 759.3 759.3 985.5 913.8 Restricted cash and cash equivalents 228.5 365.8 258.8 211.8 211.8 144.7 213.9 270.2 186.7 186.7 261.4 461.3 Restricted cash, incl. in prepaid expenses and other current assets 1.4 1.4 1.4 1.4 1.4 1.4 1.4 1.4 — — — — Total cash, cash equivalents and restricted cash and cash equivalents $ 739.4 $ 1,005.6 $ 850.7 $ 771.8 $ 771.8 $ 654.0 $ 819.6 $ 1,041.9 $ 946.0 $ 946.0 $ 1,246.9 $ 1,375.1 Condensed Consolidated Statement of Cash Flows (cont.) ($ in millions) Note: Due to rounding, numbers presented may not add up precisely to the totals provided.
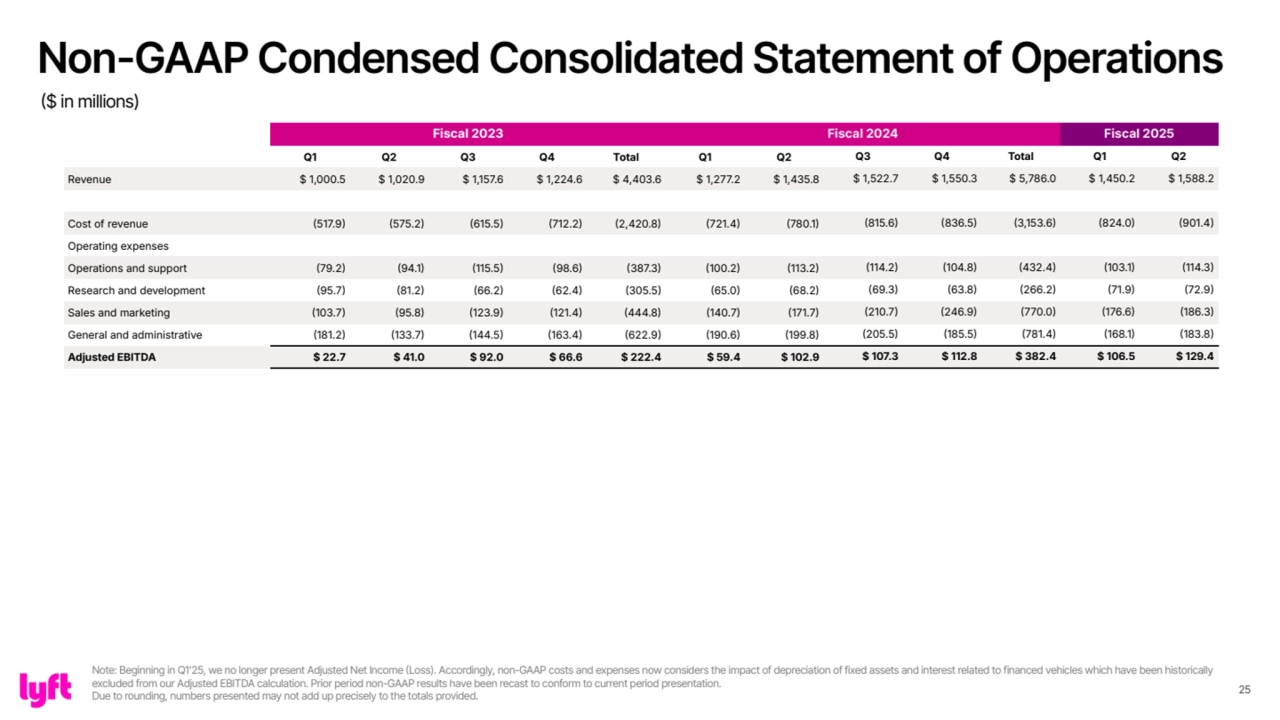
- 25. 25 Fiscal 2023 Fiscal 2024 Fiscal 2025 Q1 Q2 Q3 Q4 Total Q1 Q2 Q3 Q4 Total Q1 Q2 Revenue $ 1,000.5 $ 1,020.9 $ 1,157.6 $ 1,224.6 $ 4,403.6 $ 1,277.2 $ 1,435.8 $ 1,522.7 $ 1,550.3 $ 5,786.0 $ 1,450.2 $ 1,588.2 Cost of revenue 517.9 575.2 615.5 712.2 2,420.8 721.4 780.1 815.6 836.5 3,153.6 824.0 901.4 Operating expenses Operations and support 79.2 94.1 115.5 98.6 387.3 100.2 113.2 114.2 104.8 432.4 103.1 114.3 Research and development 95.7 81.2 66.2 62.4 305.5 65.0 68.2 69.3 63.8 266.2 71.9 72.9 Sales and marketing 103.7 95.8 123.9 121.4 444.8 140.7 171.7 210.7 246.9 770.0 176.6 186.3 General and administrative 181.2 133.7 144.5 163.4 622.9 190.6 199.8 205.5 185.5 781.4 168.1 183.8 Adjusted EBITDA $ 22.7 $ 41.0 $ 92.0 $ 66.6 $ 222.4 $ 59.4 $ 102.9 $ 107.3 $ 112.8 $ 382.4 $ 106.5 $ 129.4 Non-GAAP Condensed Consolidated Statement of Operations ($ in millions) Note: Beginning in Q1ʼ25, we no longer present Adjusted Net Income (Loss). Accordingly, non-GAAP costs and expenses now considers the impact of depreciation of fixed assets and interest related to financed vehicles which have been historically excluded from our Adjusted EBITDA calculation. Prior period non-GAAP results have been recast to conform to current period presentation. Due to rounding, numbers presented may not add up precisely to the totals provided.
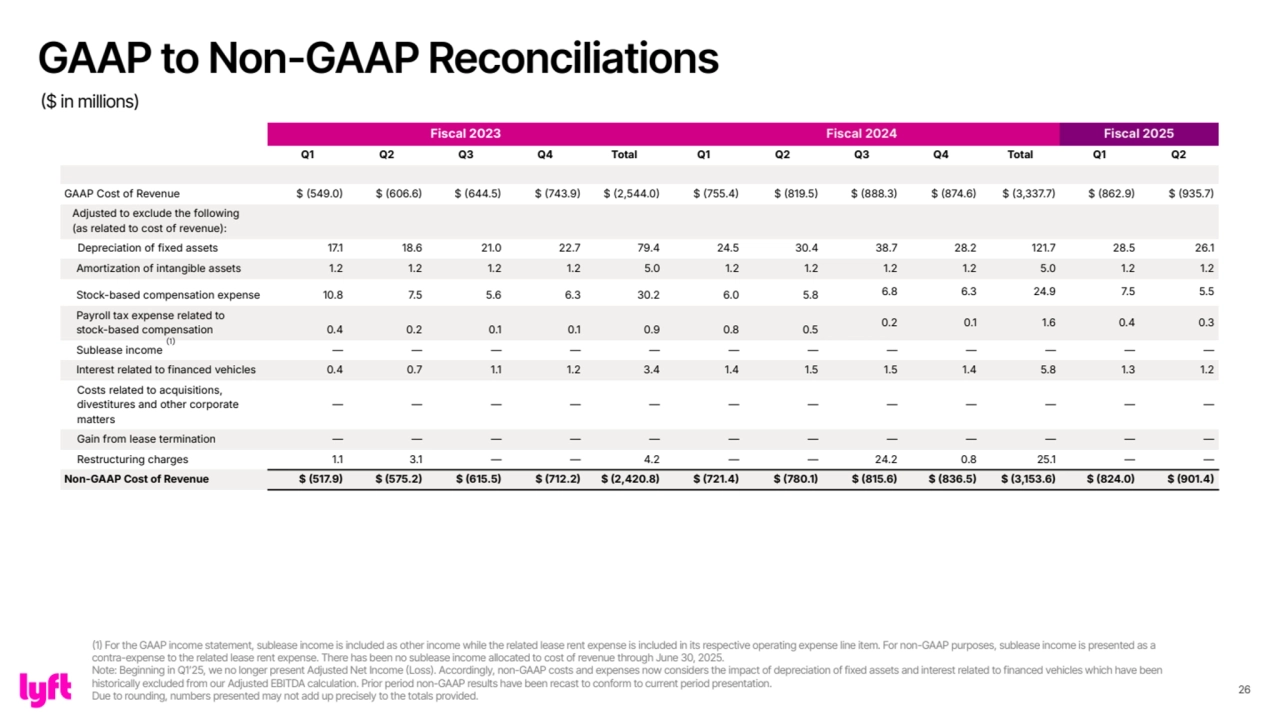
- 26. 26 Fiscal 2023 Fiscal 2024 Fiscal 2025 Q1 Q2 Q3 Q4 Total Q1 Q2 Q3 Q4 Total Q1 Q2 GAAP Cost of Revenue $ 549.0 $ 606.6 $ 644.5 $ 743.9 $ 2,544.0 $ 755.4 $ 819.5 $ 888.3 $ 874.6 $ 3,337.7 $ 862.9 $ 935.7 Adjusted to exclude the following (as related to cost of revenue): Depreciation of fixed assets 17.1 18.6 21.0 22.7 79.4 24.5 30.4 38.7 28.2 121.7 28.5 26.1 Amortization of intangible assets 1.2 1.2 1.2 1.2 5.0 1.2 1.2 1.2 1.2 5.0 1.2 1.2 Stock-based compensation expense 10.8 7.5 5.6 6.3 30.2 6.0 5.8 6.8 6.3 24.9 7.5 5.5 Payroll tax expense related to stock-based compensation 0.4 0.2 0.1 0.1 0.9 0.8 0.5 0.2 0.1 1.6 0.4 0.3 Sublease income — — — — — — — — — — — — Interest related to financed vehicles 0.4 0.7 1.1 1.2 3.4 1.4 1.5 1.5 1.4 5.8 1.3 1.2 Costs related to acquisitions, divestitures and other corporate matters — — — — — — — — — — — — Gain from lease termination — — — — — — — — — — — — Restructuring charges 1.1 3.1 — — 4.2 — — 24.2 0.8 25.1 — — Non-GAAP Cost of Revenue $ 517.9 $ 575.2 $ 615.5 $ 712.2 $ 2,420.8 $ 721.4 $ 780.1 $ 815.6 $ 836.5 $ 3,153.6 $ 824.0 $ 901.4 (1) GAAP to Non-GAAP Reconciliations ($ in millions) (1) For the GAAP income statement, sublease income is included as other income while the related lease rent expense is included in its respective operating expense line item. For non-GAAP purposes, sublease income is presented as a contra-expense to the related lease rent expense. There has been no sublease income allocated to cost of revenue through June 30, 2025. Note: Beginning in Q1ʼ25, we no longer present Adjusted Net Income (Loss). Accordingly, non-GAAP costs and expenses now considers the impact of depreciation of fixed assets and interest related to financed vehicles which have been historically excluded from our Adjusted EBITDA calculation. Prior period non-GAAP results have been recast to conform to current period presentation. Due to rounding, numbers presented may not add up precisely to the totals provided.
- 27. 27 Fiscal 2023 Fiscal 2024 Fiscal 2025 Q1 Q2 Q3 Q4 Total Q1 Q2 Q3 Q4 Total Q1 Q2 Non-GAAP Operating Expenses GAAP Operations and Support $ 98.9 $ 107.6 $ 118.8 $ 101.9 $ 427.2 $ 103.0 $ 115.7 $ 117.5 $ 107.6 $ 443.8 $ 106.3 $ 117.4 Depreciation of fixed assets 0.7 1.0 0.2 0.3 2.2 0.2 0.3 0.3 0.3 1.1 0.3 0.4 Amortization of intangible assets — — — — — — — — — — — — Stock-based compensation expense 5.9 4.0 2.8 2.7 15.5 2.1 1.9 2.3 2.1 8.4 2.7 2.5 Payroll tax expense related to stock-based compensation 0.3 0.1 0.1 0.1 0.6 0.3 0.2 0.1 0.1 0.7 0.1 0.2 Sublease income 0.2 0.2 0.1 0.2 0.7 0.2 0.1 0.2 0.2 0.7 0.1 0.1 Interest related to financed vehicles — — — — — — — — — — — — Costs related to acquisitions, divestitures and other corporate matters — — — — — — — — — — — — Gain from lease termination — — — — — — — — — — — — Restructuring charges 12.6 8.3 — — 20.9 — — 0.4 0.1 0.5 — — Non-GAAP Operations and Support $ 79.2 $ 94.1 $ 115.5 $ 98.6 $ 387.3 $ 100.2 $ 113.2 $ 114.2 $ 104.8 $ 432.4 $ 103.1 $ 114.3 GAAP Research and Development $ 196.9 $ 154.6 $ 109.2 $ 95.2 $ 555.9 $ 100.0 $ 98.8 $ 104.4 $ 93.8 $ 397.1 $ 112.5 $ 109.3 Depreciation of fixed assets 0.5 0.4 0.4 0.4 1.7 0.4 0.4 0.5 0.4 1.8 0.4 0.4 Amortization of intangible assets — — — 0.1 0.2 0.1 0.1 — — 0.2 — — Stock-based compensation expense 93.5 49.4 40.7 30.6 214.2 29.8 27.3 32.0 28.6 117.8 38.3 33.9 Payroll tax expense related to stock-based compensation 3.6 1.6 0.9 0.8 6.8 3.8 1.9 0.8 0.7 7.2 2.0 2.0 Sublease income 1.1 1.1 1.1 0.9 4.2 0.9 0.9 0.7 0.3 2.8 — — Interest related to financed vehicles — — — — — — — — — — — — Costs related to acquisitions, divestitures and other corporate matters — — — — — — — — — — — 0.1 Gain from lease termination — — — — — — — — — — — — Restructuring charges 2.6 20.9 — — 23.4 — — 1.0 — 1.0 — — Non-GAAP Research and Development $ 95.7 $ 81.2 $ 66.2 $ 62.4 $ 305.5 $ 65.0 $ 68.2 $ 69.3 $ 63.8 $ 266.2 $ 71.9 $ 72.9 (1) GAAP to Non-GAAP Reconciliations (cont.) ($ in millions) (1) For the GAAP income statement, sublease income is included as other income while the related lease rent expense is included in its respective operating expense line item. For non-GAAP purposes, sublease income is presented as a contra-expense to the related lease rent expense. Note: Beginning in Q1ʼ25, we no longer present Adjusted Net Income (Loss). Accordingly, non-GAAP costs and expenses now considers the impact of depreciation of fixed assets and interest related to financed vehicles which have been historically excluded from our Adjusted EBITDA calculation. Prior period non-GAAP results have been recast to conform to current period presentation. Due to rounding, numbers presented may not add up precisely to the totals provided. (1)
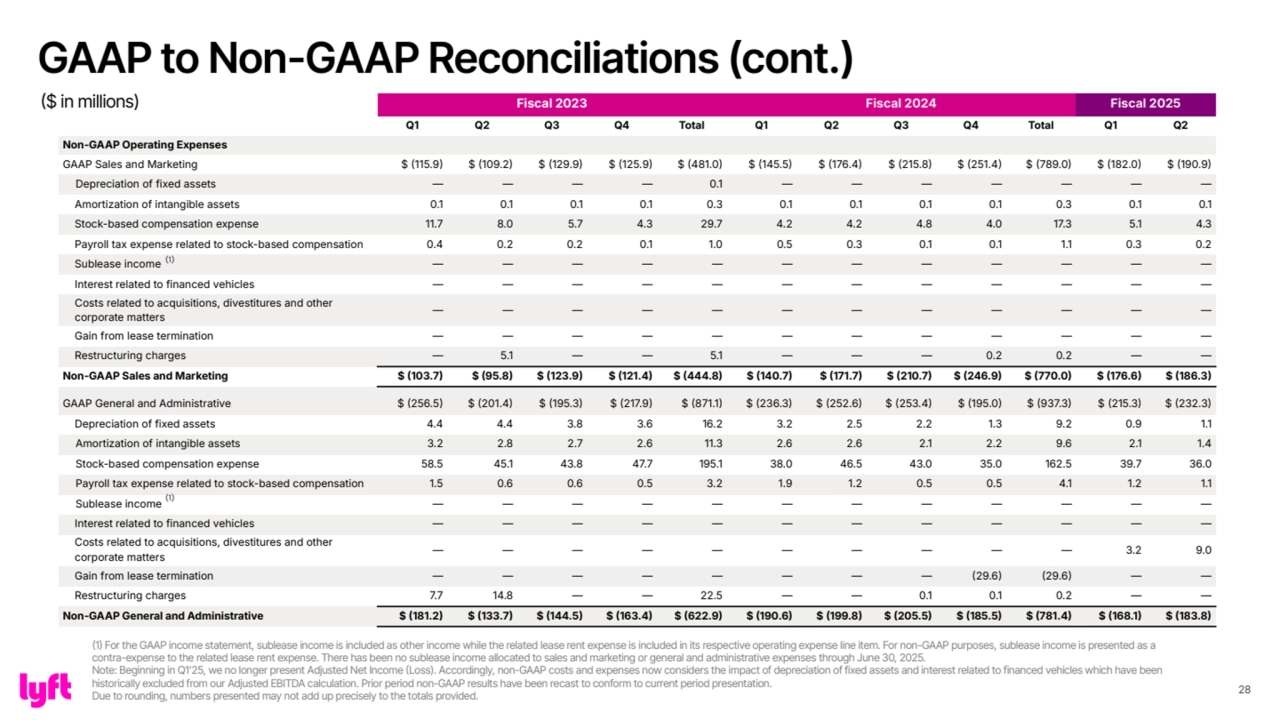
- 28. 28 Fiscal 2023 Fiscal 2024 Fiscal 2025 Q1 Q2 Q3 Q4 Total Q1 Q2 Q3 Q4 Total Q1 Q2 Non-GAAP Operating Expenses GAAP Sales and Marketing $ 115.9 $ 109.2 $ 129.9 $ 125.9 $ 481.0 $ 145.5 $ 176.4 $ 215.8 $ 251.4 $ 789.0 $ 182.0 $ 190.9 Depreciation of fixed assets — — — — 0.1 — — — — — — — Amortization of intangible assets 0.1 0.1 0.1 0.1 0.3 0.1 0.1 0.1 0.1 0.3 0.1 0.1 Stock-based compensation expense 11.7 8.0 5.7 4.3 29.7 4.2 4.2 4.8 4.0 17.3 5.1 4.3 Payroll tax expense related to stock-based compensation 0.4 0.2 0.2 0.1 1.0 0.5 0.3 0.1 0.1 1.1 0.3 0.2 Sublease income — — — — — — — — — — — — Interest related to financed vehicles — — — — — — — — — — — — Costs related to acquisitions, divestitures and other corporate matters — — — — — — — — — — — — Gain from lease termination — — — — — — — — — — — — Restructuring charges — 5.1 — — 5.1 — — — 0.2 0.2 — — Non-GAAP Sales and Marketing $ 103.7 $ 95.8 $ 123.9 $ 121.4 $ 444.8 $ 140.7 $ 171.7 $ 210.7 $ 246.9 $ 770.0 $ 176.6 $ 186.3 GAAP General and Administrative $ 256.5 $ 201.4 $ 195.3 $ 217.9 $ 871.1 $ 236.3 $ 252.6 $ 253.4 $ 195.0 $ 937.3 $ 215.3 $ 232.3 Depreciation of fixed assets 4.4 4.4 3.8 3.6 16.2 3.2 2.5 2.2 1.3 9.2 0.9 1.1 Amortization of intangible assets 3.2 2.8 2.7 2.6 11.3 2.6 2.6 2.1 2.2 9.6 2.1 1.4 Stock-based compensation expense 58.5 45.1 43.8 47.7 195.1 38.0 46.5 43.0 35.0 162.5 39.7 36.0 Payroll tax expense related to stock-based compensation 1.5 0.6 0.6 0.5 3.2 1.9 1.2 0.5 0.5 4.1 1.2 1.1 Sublease income — — — — — — — — — — — — Interest related to financed vehicles — — — — — — — — — — — — Costs related to acquisitions, divestitures and other corporate matters — — — — — — — — — — 3.2 9.0 Gain from lease termination — — — — — — — — 29.6 29.6 — — Restructuring charges 7.7 14.8 — — 22.5 — — 0.1 0.1 0.2 — — Non-GAAP General and Administrative $ 181.2 $ 133.7 $ 144.5 $ 163.4 $ 622.9 $ 190.6 $ 199.8 $ 205.5 $ 185.5 $ 781.4 $ 168.1 $ 183.8 (1) (1) GAAP to Non-GAAP Reconciliations (cont.) ($ in millions) (1) For the GAAP income statement, sublease income is included as other income while the related lease rent expense is included in its respective operating expense line item. For non-GAAP purposes, sublease income is presented as a contra-expense to the related lease rent expense. There has been no sublease income allocated to sales and marketing or general and administrative expenses through June 30, 2025. Note: Beginning in Q1ʼ25, we no longer present Adjusted Net Income (Loss). Accordingly, non-GAAP costs and expenses now considers the impact of depreciation of fixed assets and interest related to financed vehicles which have been historically excluded from our Adjusted EBITDA calculation. Prior period non-GAAP results have been recast to conform to current period presentation. Due to rounding, numbers presented may not add up precisely to the totals provided.
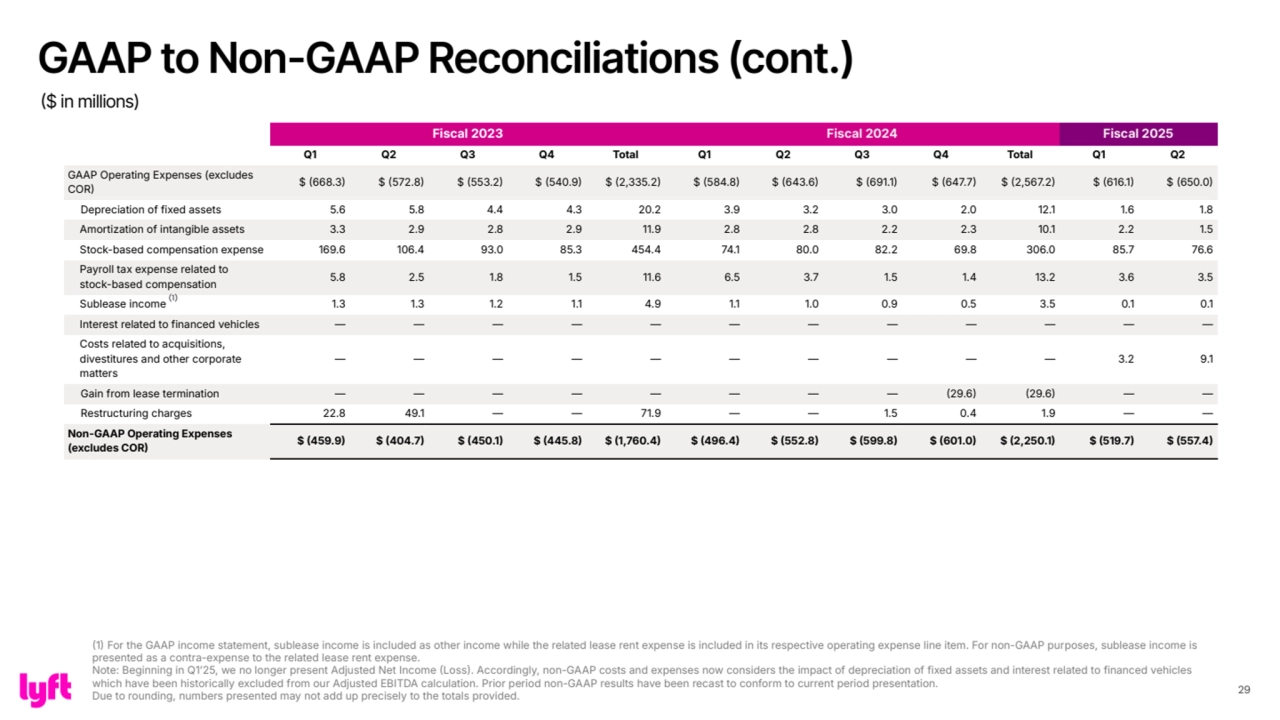
- 29. 29 Fiscal 2023 Fiscal 2024 Fiscal 2025 Q1 Q2 Q3 Q4 Total Q1 Q2 Q3 Q4 Total Q1 Q2 GAAP Operating Expenses (excludes COR $ 668.3 $ 572.8 $ 553.2 $ 540.9 $ 2,335.2 $ 584.8 $ 643.6 $ 691.1 $ 647.7 $ 2,567.2 $ 616.1 $ 650.0 Depreciation of fixed assets 5.6 5.8 4.4 4.3 20.2 3.9 3.2 3.0 2.0 12.1 1.6 1.8 Amortization of intangible assets 3.3 2.9 2.8 2.9 11.9 2.8 2.8 2.2 2.3 10.1 2.2 1.5 Stock-based compensation expense 169.6 106.4 93.0 85.3 454.4 74.1 80.0 82.2 69.8 306.0 85.7 76.6 Payroll tax expense related to stock-based compensation 5.8 2.5 1.8 1.5 11.6 6.5 3.7 1.5 1.4 13.2 3.6 3.5 Sublease income 1.3 1.3 1.2 1.1 4.9 1.1 1.0 0.9 0.5 3.5 0.1 0.1 Interest related to financed vehicles — — — — — — — — — — — — Costs related to acquisitions, divestitures and other corporate matters — — — — — — — — — — 3.2 9.1 Gain from lease termination — — — — — — — — 29.6 29.6 — — Restructuring charges 22.8 49.1 — — 71.9 — — 1.5 0.4 1.9 — — Non-GAAP Operating Expenses (excludes COR $ 459.9 $ 404.7 $ 450.1 $ 445.8 $ 1,760.4 $ 496.4 $ 552.8 $ 599.8 $ 601.0 $ 2,250.1 $ 519.7 $ 557.4 (1) GAAP to Non-GAAP Reconciliations (cont.) ($ in millions) 1 For the GAAP income statement, sublease income is included as other income while the related lease rent expense is included in its respective operating expense line item. For non-GAAP purposes, sublease income is presented as a contra-expense to the related lease rent expense. Note: Beginning in Q1ʼ25, we no longer present Adjusted Net Income Loss. Accordingly, non-GAAP costs and expenses now considers the impact of depreciation of fixed assets and interest related to financed vehicles which have been historically excluded from our Adjusted EBITDA calculation. Prior period non-GAAP results have been recast to conform to current period presentation. Due to rounding, numbers presented may not add up precisely to the totals provided.
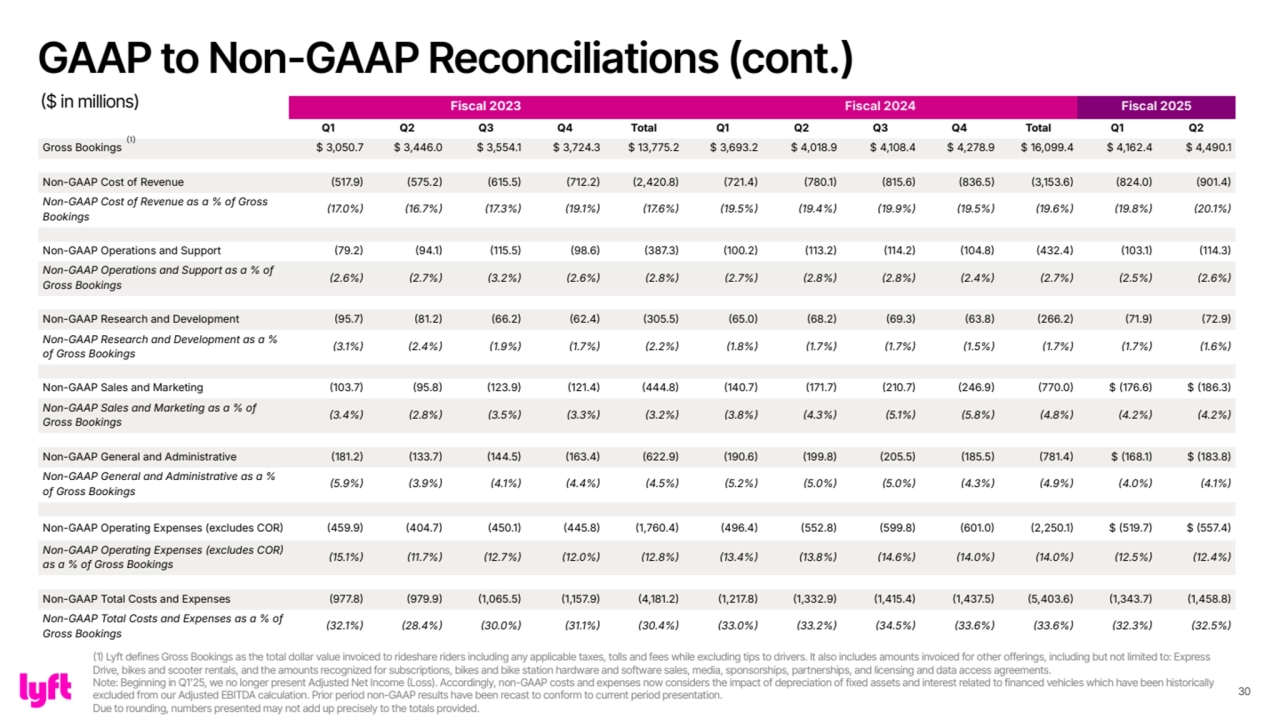
- 30. 30 Fiscal 2023 Fiscal 2024 Fiscal 2025 Q1 Q2 Q3 Q4 Total Q1 Q2 Q3 Q4 Total Q1 Q2 Gross Bookings $ 3,050.7 $ 3,446.0 $ 3,554.1 $ 3,724.3 $ 13,775.2 $ 3,693.2 $ 4,018.9 $ 4,108.4 $ 4,278.9 $ 16,099.4 $ 4,162.4 $ 4,490.1 Non-GAAP Cost of Revenue 517.9 575.2 615.5 712.2 2,420.8 721.4 780.1 815.6 836.5 3,153.6 824.0 901.4 Non-GAAP Cost of Revenue as a % of Gross Bookings 17.0% 16.7% 17.3% 19.1% 17.6% 19.5% 19.4% 19.9% 19.5% 19.6% 19.8% 20.1% Non-GAAP Operations and Support 79.2 94.1 115.5 98.6 387.3 100.2 113.2 114.2 104.8 432.4 103.1 114.3 Non-GAAP Operations and Support as a % of Gross Bookings 2.6% 2.7% 3.2% 2.6% 2.8% 2.7% 2.8% 2.8% 2.4% 2.7% 2.5% 2.6% Non-GAAP Research and Development 95.7 81.2 66.2 62.4 305.5 65.0 68.2 69.3 63.8 266.2 71.9 72.9 Non-GAAP Research and Development as a % of Gross Bookings 3.1% 2.4% 1.9% 1.7% 2.2% 1.8% 1.7% 1.7% 1.5% 1.7% 1.7% 1.6% Non-GAAP Sales and Marketing 103.7 95.8 123.9 121.4 444.8 140.7 171.7 210.7 246.9 770.0 $ 176.6 $ 186.3 Non-GAAP Sales and Marketing as a % of Gross Bookings 3.4% 2.8% 3.5% 3.3% 3.2% 3.8% 4.3% 5.1% 5.8% 4.8% 4.2% 4.2% Non-GAAP General and Administrative 181.2 133.7 144.5 163.4 622.9 190.6 199.8 205.5 185.5 781.4 $ 168.1 $ 183.8 Non-GAAP General and Administrative as a % of Gross Bookings 5.9% 3.9% 4.1% 4.4% 4.5% 5.2% 5.0% 5.0% 4.3% 4.9% 4.0% 4.1% Non-GAAP Operating Expenses (excludes COR 459.9 404.7 450.1 445.8 1,760.4 496.4 552.8 599.8 601.0 2,250.1 $ 519.7 $ 557.4 Non-GAAP Operating Expenses (excludes COR as a % of Gross Bookings 15.1% 11.7% 12.7% 12.0% 12.8% 13.4% 13.8% 14.6% 14.0% 14.0% 12.5% 12.4% Non-GAAP Total Costs and Expenses 977.8 979.9 1,065.5 1,157.9 4,181.2 1,217.8 1,332.9 1,415.4 1,437.5 5,403.6 1,343.7 1,458.8 Non-GAAP Total Costs and Expenses as a % of Gross Bookings 32.1% 28.4% 30.0% 31.1% 30.4% 33.0% 33.2% 34.5% 33.6% 33.6% 32.3% 32.5% (1) GAAP to Non-GAAP Reconciliations (cont.) ($ in millions) (1) Lyft defines Gross Bookings as the total dollar value invoiced to rideshare riders including any applicable taxes, tolls and fees while excluding tips to drivers. It also includes amounts invoiced for other offerings, including but not limited to: Express Drive, bikes and scooter rentals, and the amounts recognized for subscriptions, bikes and bike station hardware and software sales, media, sponsorships, partnerships, and licensing and data access agreements. Note: Beginning in Q1ʼ25, we no longer present Adjusted Net Income (Loss). Accordingly, non-GAAP costs and expenses now considers the impact of depreciation of fixed assets and interest related to financed vehicles which have been historically excluded from our Adjusted EBITDA calculation. Prior period non-GAAP results have been recast to conform to current period presentation. Due to rounding, numbers presented may not add up precisely to the totals provided.
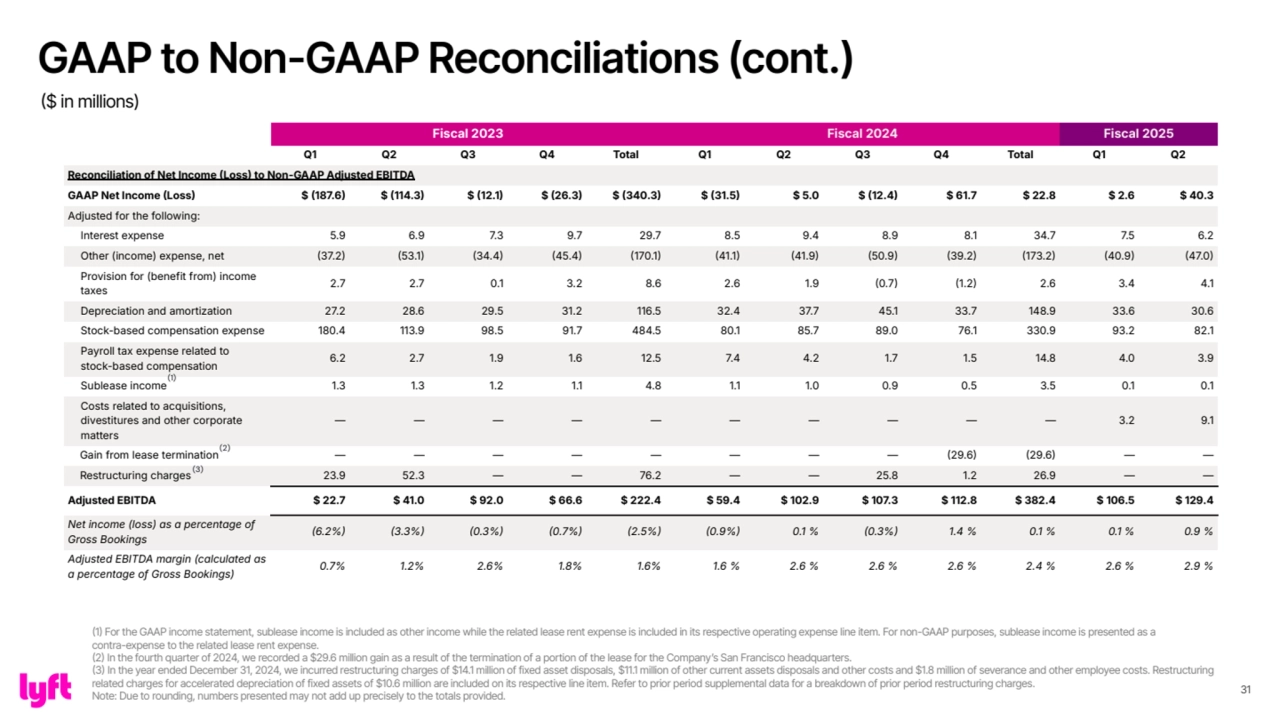
- 31. 31 Fiscal 2023 Fiscal 2024 Fiscal 2025 Q1 Q2 Q3 Q4 Total Q1 Q2 Q3 Q4 Total Q1 Q2 Reconciliation of Net Income Loss to Non-GAAP Adjusted EBITDA GAAP Net Income Loss $ 187.6 $ 114.3 $ 12.1 $ 26.3 $ 340.3 $ 31.5 $ 5.0 $ 12.4 $ 61.7 $ 22.8 $ 2.6 $ 40.3 Adjusted for the following: Interest expense 5.9 6.9 7.3 9.7 29.7 8.5 9.4 8.9 8.1 34.7 7.5 6.2 Other (income) expense, net 37.2 53.1 34.4 45.4 170.1 41.1 41.9 50.9 39.2 173.2 40.9 47.0 Provision for (benefit from) income taxes 2.7 2.7 0.1 3.2 8.6 2.6 1.9 0.7 1.2 2.6 3.4 4.1 Depreciation and amortization 27.2 28.6 29.5 31.2 116.5 32.4 37.7 45.1 33.7 148.9 33.6 30.6 Stock-based compensation expense 180.4 113.9 98.5 91.7 484.5 80.1 85.7 89.0 76.1 330.9 93.2 82.1 Payroll tax expense related to stock-based compensation 6.2 2.7 1.9 1.6 12.5 7.4 4.2 1.7 1.5 14.8 4.0 3.9 Sublease income 1.3 1.3 1.2 1.1 4.8 1.1 1.0 0.9 0.5 3.5 0.1 0.1 Costs related to acquisitions, divestitures and other corporate matters — — — — — — — — — — 3.2 9.1 Gain from lease termination — — — — — — — — 29.6 29.6 — — Restructuring charges 23.9 52.3 — — 76.2 — — 25.8 1.2 26.9 — — Adjusted EBITDA $ 22.7 $ 41.0 $ 92.0 $ 66.6 $ 222.4 $ 59.4 $ 102.9 $ 107.3 $ 112.8 $ 382.4 $ 106.5 $ 129.4 Net income (loss) as a percentage of Gross Bookings 6.2% 3.3% 0.3% 0.7% 2.5% 0.9% 0.1 % 0.3% 1.4 % 0.1 % 0.1 % 0.9 % Adjusted EBITDA margin (calculated as a percentage of Gross Bookings) 0.7% 1.2% 2.6% 1.8% 1.6% 1.6 % 2.6 % 2.6 % 2.6 % 2.4 % 2.6 % 2.9 % (1) (2) (3) GAAP to Non-GAAP Reconciliations (cont.) ($ in millions) (1) For the GAAP income statement, sublease income is included as other income while the related lease rent expense is included in its respective operating expense line item. For non-GAAP purposes, sublease income is presented as a contra-expense to the related lease rent expense. (2) In the fourth quarter of 2024, we recorded a $29.6 million gain as a result of the termination of a portion of the lease for the Companyʼs San Francisco headquarters. (3) In the year ended December 31, 2024, we incurred restructuring charges of $14.1 million of fixed asset disposals, $11.1 million of other current assets disposals and other costs and $1.8 million of severance and other employee costs. Restructuring related charges for accelerated depreciation of fixed assets of $10.6 million are included on its respective line item. Refer to prior period supplemental data for a breakdown of prior period restructuring charges. Note: Due to rounding, numbers presented may not add up precisely to the totals provided.
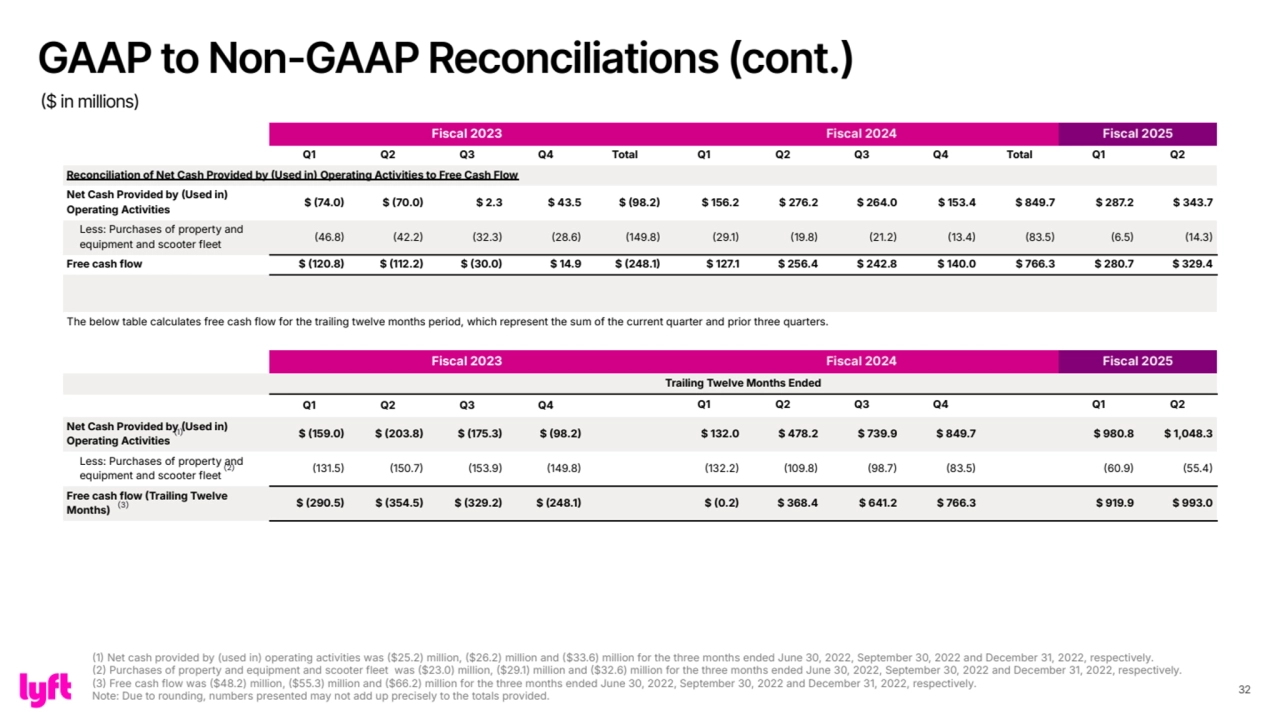
- 32. 32 Fiscal 2023 Fiscal 2024 Fiscal 2025 Q1 Q2 Q3 Q4 Total Q1 Q2 Q3 Q4 Total Q1 Q2 Reconciliation of Net Cash Provided by Used in) Operating Activities to Free Cash Flow Net Cash Provided by Used in) Operating Activities $ 74.0 $ 70.0 $ 2.3 $ 43.5 $ 98.2 $ 156.2 $ 276.2 $ 264.0 $ 153.4 $ 849.7 $ 287.2 $ 343.7 Less: Purchases of property and equipment and scooter fleet 46.8 42.2 32.3 28.6 149.8 29.1 19.8 21.2 13.4 83.5 6.5 14.3 Free cash flow $ 120.8 $ 112.2 $ 30.0 $ 14.9 $ 248.1 $ 127.1 $ 256.4 $ 242.8 $ 140.0 $ 766.3 $ 280.7 $ 329.4 The below table calculates free cash flow for the trailing twelve months period, which represent the sum of the current quarter and prior three quarters. Fiscal 2023 Fiscal 2024 Fiscal 2025 Trailing Twelve Months Ended Q1 Q2 Q3 Q4 Q1 Q2 Q3 Q4 Q1 Q2 Net Cash Provided by Used in) Operating Activities $ 159.0 $ 203.8 $ 175.3 $ 98.2 $ 132.0 $ 478.2 $ 739.9 $ 849.7 $ 980.8 $ 1,048.3 Less: Purchases of property and equipment and scooter fleet 131.5 150.7 153.9 149.8 132.2 109.8 98.7 83.5 60.9 55.4 Free cash flow Trailing Twelve Months) (3) $ 290.5 $ 354.5 $ 329.2 $ 248.1 $ 0.2 $ 368.4 $ 641.2 $ 766.3 $ 919.9 $ 993.0 1 Net cash provided by (used in) operating activities was $25.2) million, $26.2) million and $33.6) million for the three months ended June 30, 2022, September 30, 2022 and December 31, 2022, respectively. 2 Purchases of property and equipment and scooter fleet was $23.0) million, $29.1) million and $32.6) million for the three months ended June 30, 2022, September 30, 2022 and December 31, 2022, respectively. 3 Free cash flow was $48.2) million, $55.3) million and $66.2) million for the three months ended June 30, 2022, September 30, 2022 and December 31, 2022, respectively. Note: Due to rounding, numbers presented may not add up precisely to the totals provided. (1) (2) GAAP to Non-GAAP Reconciliations (cont.) ($ in millions)