Palo Alto Networks: Q3 Fiscal Year 2025 Earnings
 AI Summary
Key Insights
- 🚀 Strong Q3 Growth: Palo Alto Networks reports strong Q3 results, surpassing a $5B milestone in NGS ARR.
- 🤝 Platformization Success: Strong customer consolidation with the platform, driving an increase in total platformizations.
- 🛡️ Cortex Momentum: Record XSIAM bookings in Q3 are driving NGS ARR outperformance, reducing MTTR significantly.
- 🌐 NetSec Growth: Software firewalls and SASE continue to show strong growth, outpacing the market.
- 🤖 AI Security Focus: Introducing Prisma AIRS and acquiring Protect AI to expand capabilities in AI security.


Palo Alto Networks: Q3 Fiscal Year 2025 Earnings
- 1. © 2025 Palo Alto Networks, Inc. All rights reserved. Proprietary and confidential information. Q3 Fiscal Year 2025 Earnings Call May 20, 2025
- 2. © 2025 Palo Alto Networks, Inc. All rights reserved. Proprietary and confidential information. Safe Harbor This presentation contains “forward-looking” statements within the meaning of Section 27A of the Securities Act and Section 21E of the Exchange Act, including the cybersecurity threat landscape, expectations regarding our platformization strategy and related progress and opportunities, long-term expectations regarding annual recurring revenue, remaining performance obligation, product development strategy and expectations regarding artificial intelligence (AI), financial guidance for the fourth quarter of fiscal 2025 and fiscal year 2025, mid and long-term financial expectations, modeling points, business and economic conditions and challenges, and other financial, operational and business expectations. Many of these assumptions relate to matters that are beyond our control and changing rapidly. There are a significant number of factors that could cause actual results to differ materially from forward-looking statements made or implied in this presentation, including: developments and changes in general or worldwide market, geopolitical, economic, and business conditions; failure of our platformization product offerings; failure to achieve the expected benefits of our strategic partnerships and acquisitions; changes in the fair value of our contingent consideration liability associated with acquisitions; risks associated with managing our growth; risks associated with new product, subscription and support offerings, including our product offerings that leverage AI; shifts in priorities or delays in the development or release of new product or subscription or other offerings, or the failure to timely develop and achieve market acceptance of new products and subscriptions as well as existing products, subscriptions and support offerings; failure of our business strategies; rapidly evolving technological developments in the market for security products, subscriptions or support offerings; defects, errors, or vulnerabilities in our products, subscriptions, or support offerings; our customers’ purchasing decisions and the length of sales cycles; our competition; our ability to attract and retain new customers; our ability to acquire and integrate other companies, products, or technologies in a successful manner; our debt repayment obligations; and our share repurchase program, which may not be fully consummated or enhance shareholder value, and any share repurchases which could affect the price of our common stock. Additional risks and uncertainties on these and other factors that could affect our financial results and the forward-looking statements we make in this presentation are included under the captions “Risk Factors” and “Management’s Discussion and Analysis of Financial Condition and Results of Operations” and elsewhere in our Quarterly Report on Form 10-Q filed with the U.S. Securities and Exchange Commission (“SEC”) on February 14, 2025, which is available on our website at investors.paloaltonetworks.com and on the SEC’s website at www.sec.gov. Additional information will also be set forth in other documents that we file with or furnish to the SEC from time to time. All forward-looking statements in this presentation are based on our beliefs and information available to management as of the date hereof, and we do not assume any obligation to update the forward-looking statements provided to reflect events that occur or circumstances that exist after the date on which they were made. All information in this presentation is as of May 20, 2025. This presentation contains non-GAAP financial measures and key metrics relating to the company’s past and expected future performance. We have not reconciled diluted non-GAAP earnings per share guidance to GAAP earnings per diluted share, non-GAAP operating margin to GAAP operating margin or adjusted free cash flow margin guidance to GAAP net cash from operating activities because we do not provide guidance on GAAP net income (loss) or net cash from operating activities and would not be able to present the various reconciling cash and non-cash items between GAAP and non-GAAP financial measures, including share-based compensation expense, without unreasonable effort. 2
- 3. © 2025 Palo Alto Networks, Inc. All rights reserved. Proprietary and confidential information.
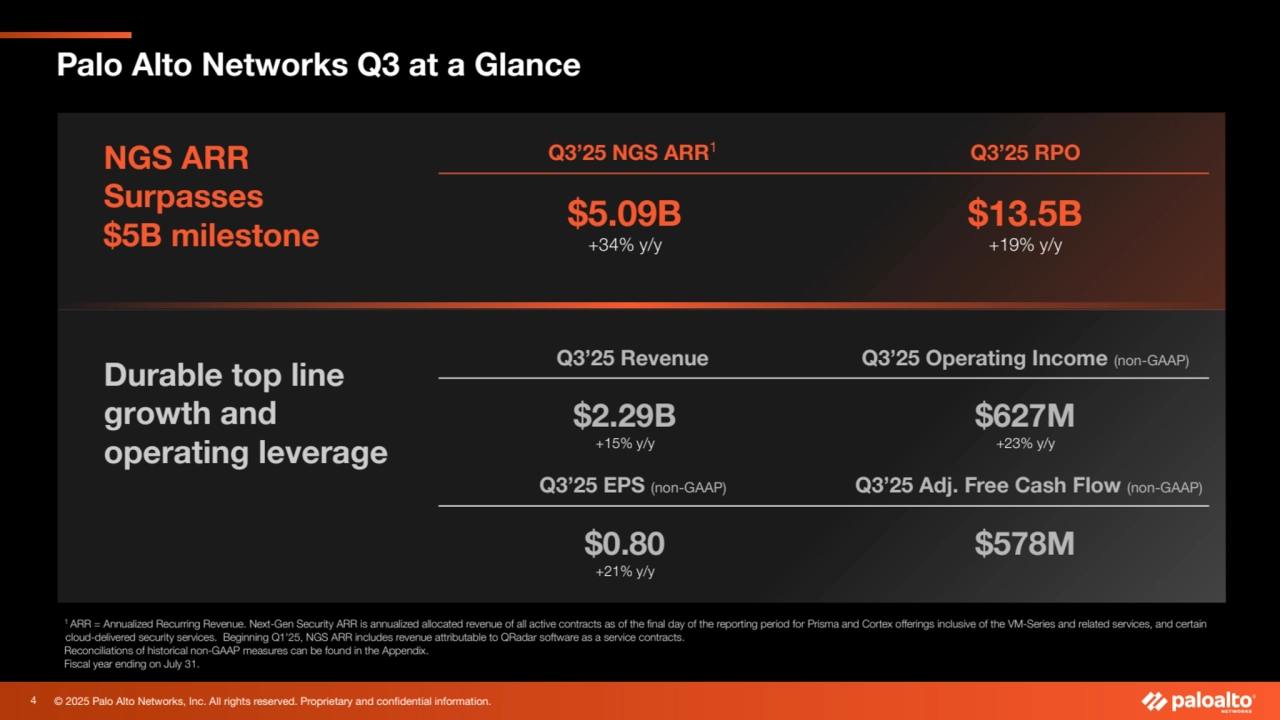
- 4. © 2025 Palo Alto Networks, Inc. All rights reserved. Proprietary and confidential information. 1 ARR = Annualized Recurring Revenue. Next-Gen Security ARR is annualized allocated revenue of all active contracts as of the final day of the reporting period for Prisma and Cortex offerings inclusive of the VM-Series and related services, and certain cloud-delivered security services. Beginning Q1'25, NGS ARR includes revenue attributable to QRadar software as a service contracts. Reconciliations of historical non-GAAP measures can be found in the Appendix. Fiscal year ending on July 31. Palo Alto Networks Q3 at a Glance NGS ARR Surpasses $5B milestone Durable top line growth and operating leverage Q3’25 NGS ARR1 Q3’25 RPO $5.09B +34% y/y $13.5B +19% y/y Q3’25 Revenue Q3’25 Operating Income (non-GAAP) $2.29B +15% y/y $627M +23% y/y Q3’25 EPS (non-GAAP) Q3’25 Adj. Free Cash Flow (non-GAAP) $0.80 +21% y/y $578M 4
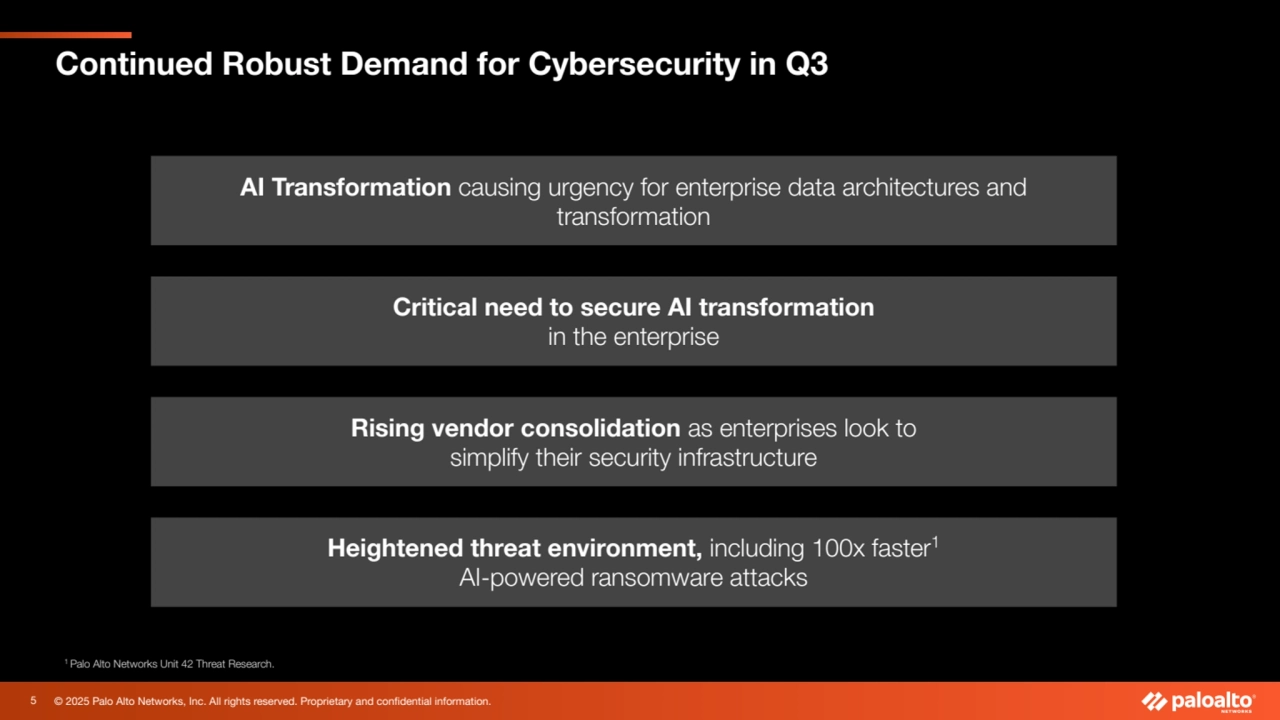
- 5. © 2025 Palo Alto Networks, Inc. All rights reserved. Proprietary and confidential information. Continued Robust Demand for Cybersecurity in Q3 Critical need to secure AI transformation in the enterprise Heightened threat environment, including 100x faster1 AI-powered ransomware attacks Rising vendor consolidation as enterprises look to simplify their security infrastructure 1 Palo Alto Networks Unit 42 Threat Research. AI Transformation causing urgency for enterprise data architectures and transformation 5
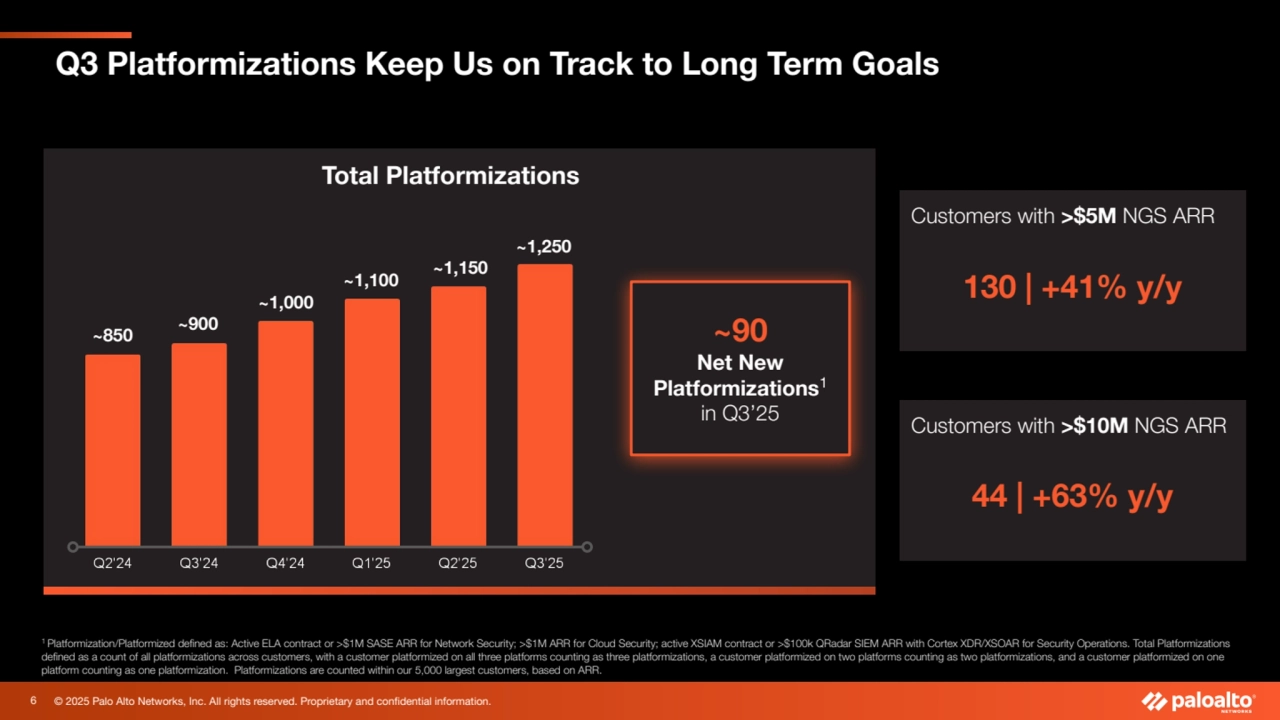
- 6. © 2025 Palo Alto Networks, Inc. All rights reserved. Proprietary and confidential information. ~900 ~90 Net New Platformizations1 in Q3’25 1 Platformization/Platformized defined as: Active ELA contract or >$1M SASE ARR for Network Security; >$1M ARR for Cloud Security; active XSIAM contract or >$100k QRadar SIEM ARR with Cortex XDR/XSOAR for Security Operations. Total Platformizations defined as a count of all platformizations across customers, with a customer platformized on all three platforms counting as three platformizations, a customer platformized on two platforms counting as two platformizations, and a customer platformized on one platform counting as one platformization. Platformizations are counted within our 5,000 largest customers, based on ARR. Total Platformizations Customers with >$5M NGS ARR 130 | +41% y/y Customers with >$10M NGS ARR 44 | +63% y/y Q3 Platformizations Keep Us on Track to Long Term Goals ~1,250 ~850 ~1,000 ~1,100 ~1,150 6
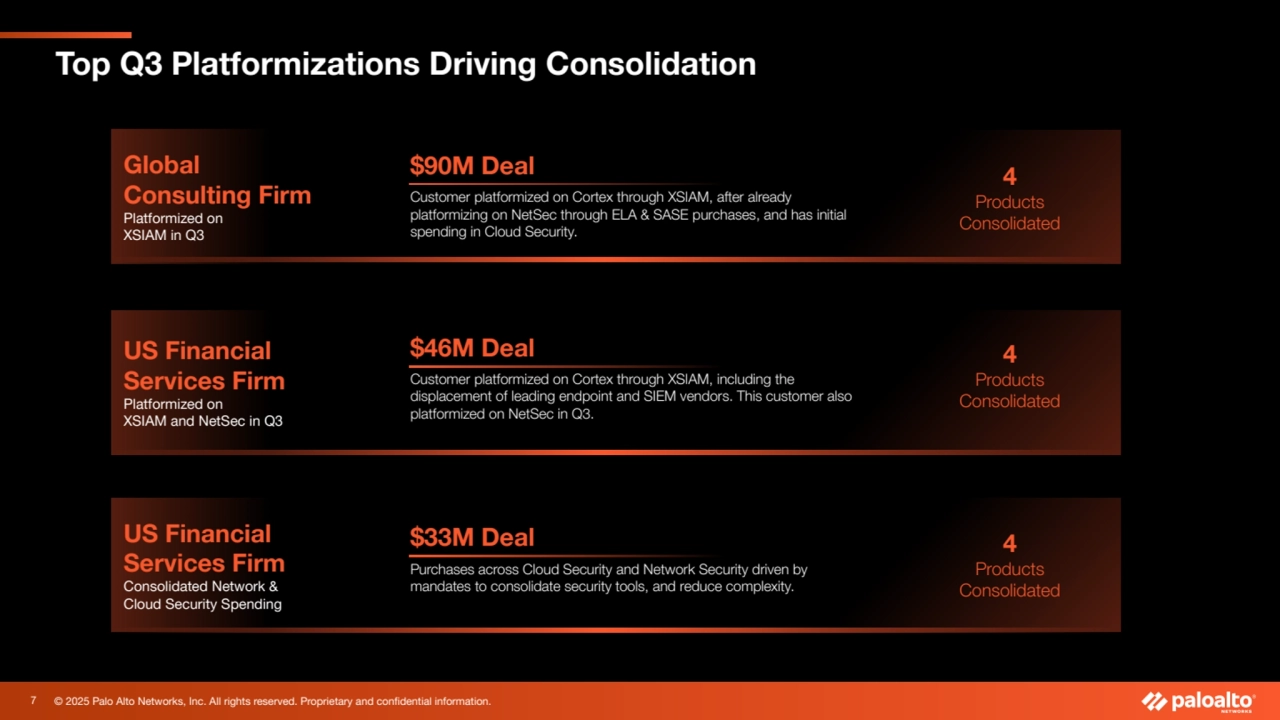
- 7. © 2025 Palo Alto Networks, Inc. All rights reserved. Proprietary and confidential information. Top Q3 Platformizations Driving Consolidation US Financial Services Firm Platformized on XSIAM and NetSec in Q3 Global Consulting Firm Platformized on XSIAM in Q3 US Financial Services Firm Consolidated Network & Cloud Security Spending Customer platformized on Cortex through XSIAM, including the displacement of leading endpoint and SIEM vendors. This customer also platformized on NetSec in Q3. Customer platformized on Cortex through XSIAM, after already platformizing on NetSec through ELA & SASE purchases, and has initial spending in Cloud Security. Purchases across Cloud Security and Network Security driven by mandates to consolidate security tools, and reduce complexity. $33M Deal $46M Deal $90M Deal 4 Products Consolidated 4 Products Consolidated 4 Products Consolidated 7
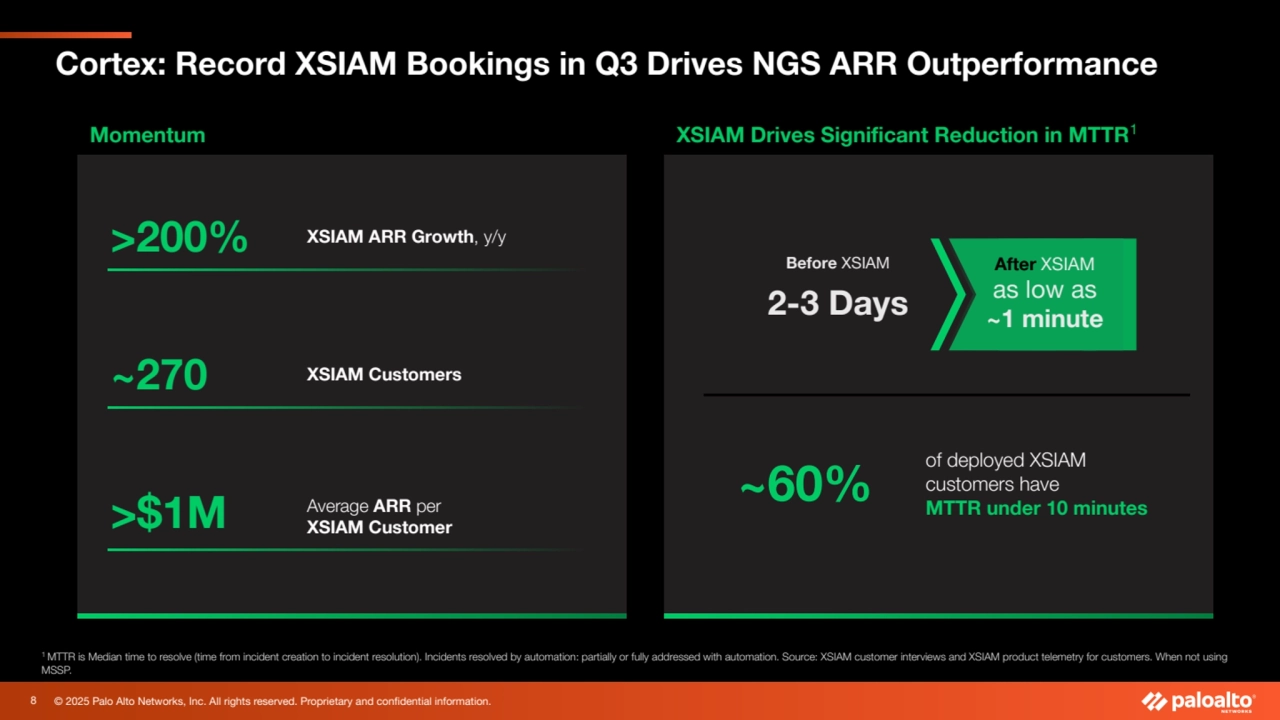
- 8. © 2025 Palo Alto Networks, Inc. All rights reserved. Proprietary and confidential information. 1 MTTR is Median time to resolve (time from incident creation to incident resolution). Incidents resolved by automation: partially or fully addressed with automation. Source: XSIAM customer interviews and XSIAM product telemetry for customers. When not using MSSP. Cortex: Record XSIAM Bookings in Q3 Drives NGS ARR Outperformance Momentum >200% XSIAM ARR Growth, y/y ~270 XSIAM Customers >$1M Average ARR per XSIAM Customer XSIAM Drives Significant Reduction in MTTR1 Before XSIAM 2-3 Days After XSIAM as low as ~1 minute ~60% of deployed XSIAM customers have MTTR under 10 minutes 8
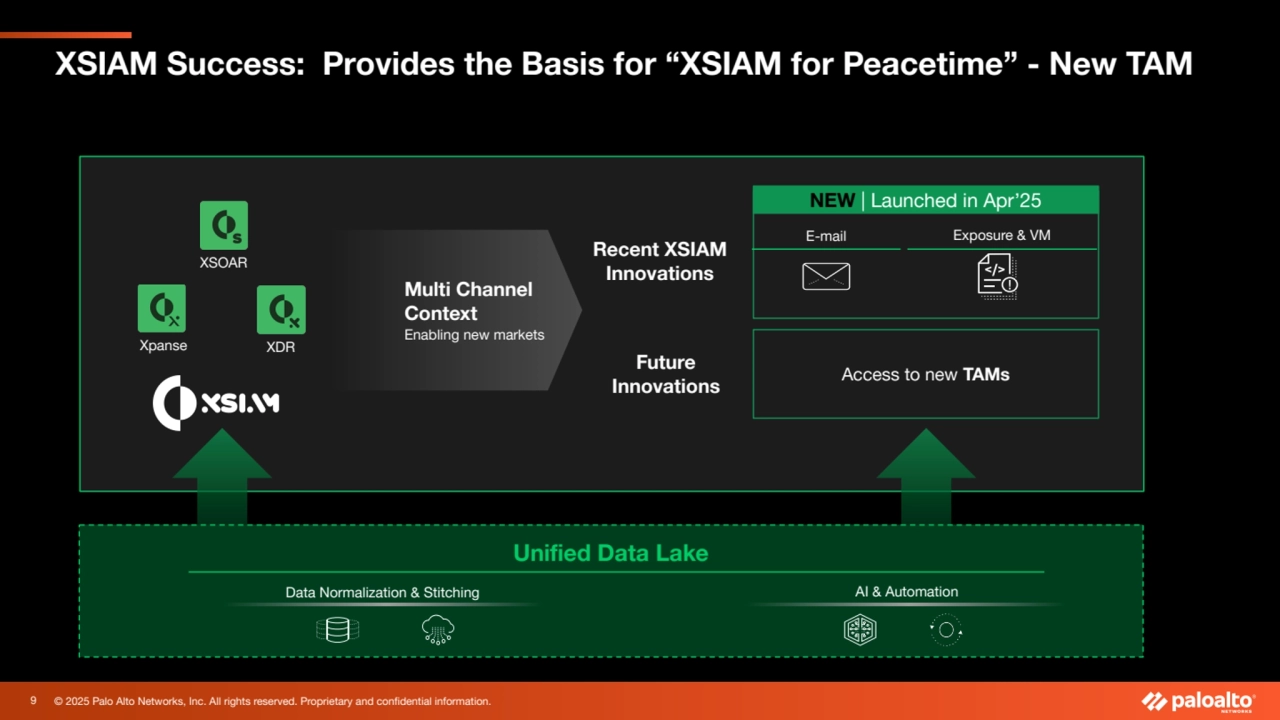
- 9. © 2025 Palo Alto Networks, Inc. All rights reserved. Proprietary and confidential information. XSIAM Success: Provides the Basis for “XSIAM for Peacetime” - New TAM E-mail Exposure & VM NEW | Launched in Apr’25 Recent XSIAM Innovations XSOAR Xpanse XDR Unified Data Lake Data Normalization & Stitching Multi Channel Context Enabling new markets Access to new TAMs Future Innovations AI & Automation 9
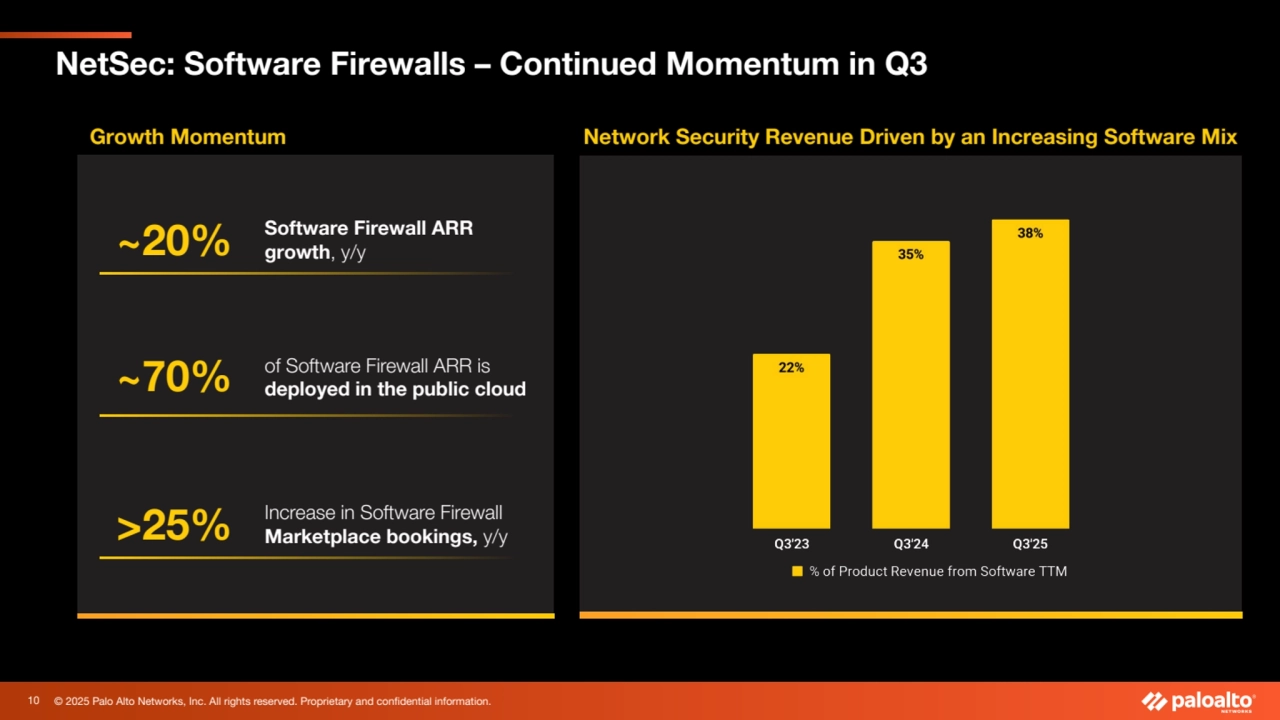
- 10. © 2025 Palo Alto Networks, Inc. All rights reserved. Proprietary and confidential information. Growth Momentum ~70% of Software Firewall ARR is deployed in the public cloud ~20% Software Firewall ARR growth, y/y NetSec: Software Firewalls – Continued Momentum in Q3 >25% Increase in Software Firewall Marketplace bookings, y/y Network Security Revenue Driven by an Increasing Software Mix 10
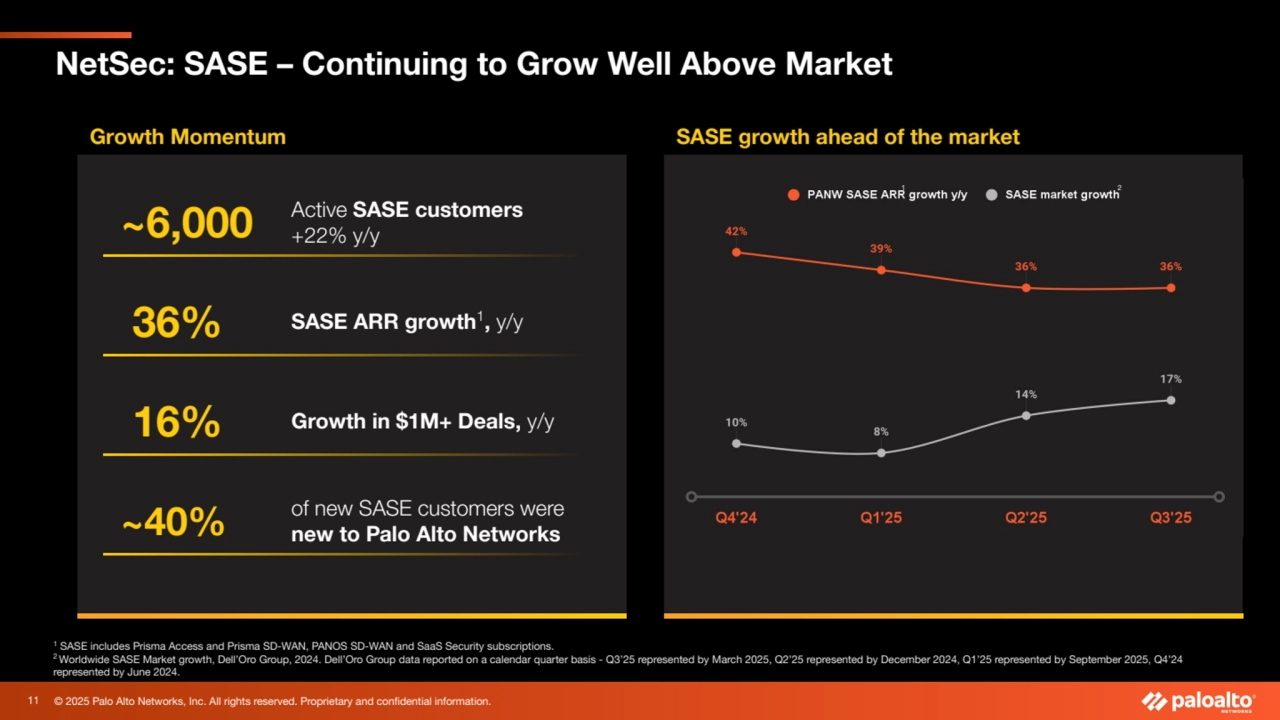
- 11. © 2025 Palo Alto Networks, Inc. All rights reserved. Proprietary and confidential information. NetSec: SASE – Continuing to Grow Well Above Market Growth Momentum SASE growth ahead of the market ~6,000 Active SASE customers +22% y/y 36% SASE ARR growth1 , y/y 16% Growth in $1M+ Deals, y/y ~40% of new SASE customers were new to Palo Alto Networks 1 SASE includes Prisma Access and Prisma SD-WAN, PANOS SD-WAN and SaaS Security subscriptions. 2 Worldwide SASE Market growth, Dell’Oro Group, 2024. Dell’Oro Group data reported on a calendar quarter basis - Q3’25 represented by March 2025, Q2’25 represented by December 2024, Q1’25 represented by September 2025, Q4’24 represented by June 2024. 1 2 11
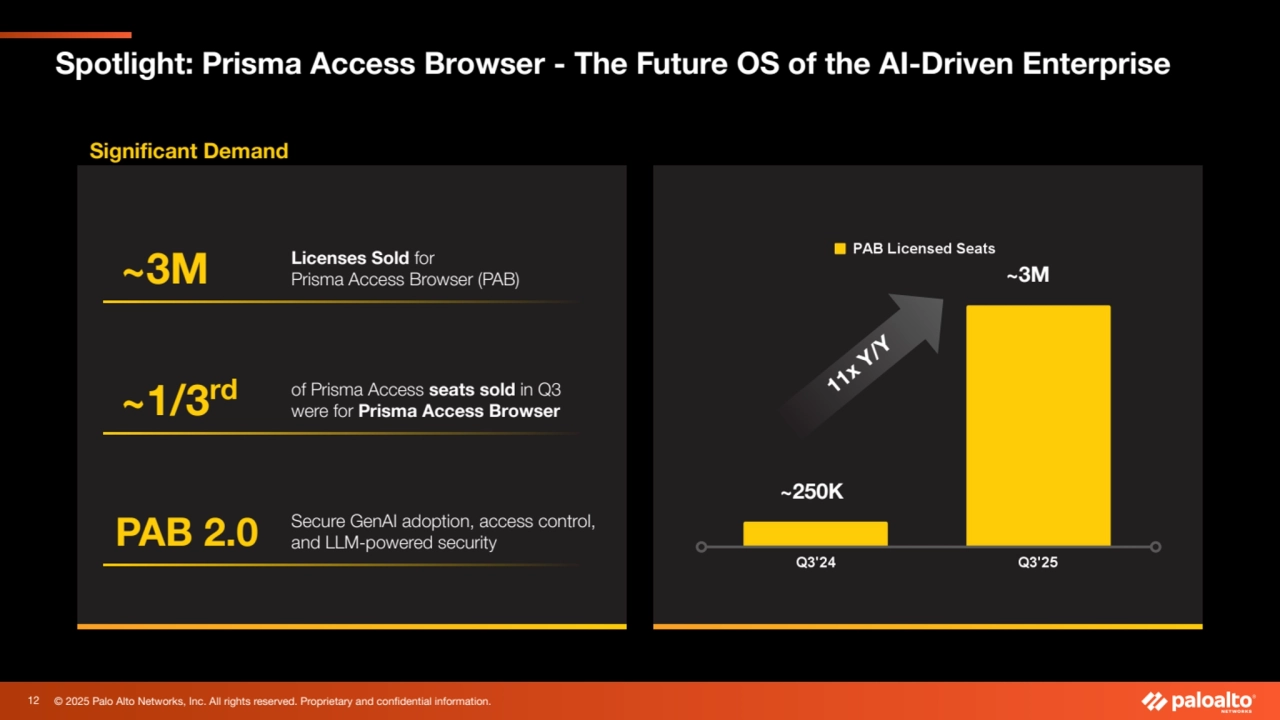
- 12. © 2025 Palo Alto Networks, Inc. All rights reserved. Proprietary and confidential information. Spotlight: Prisma Access Browser - The Future OS of the AI-Driven Enterprise Significant Demand ~3M Licenses Sold for Prisma Access Browser (PAB) ~1/3rd of Prisma Access seats sold in Q3 were for Prisma Access Browser PAB 2.0 Secure GenAI adoption, access control, and LLM-powered security 11x Y/Y ~250K ~3M 12
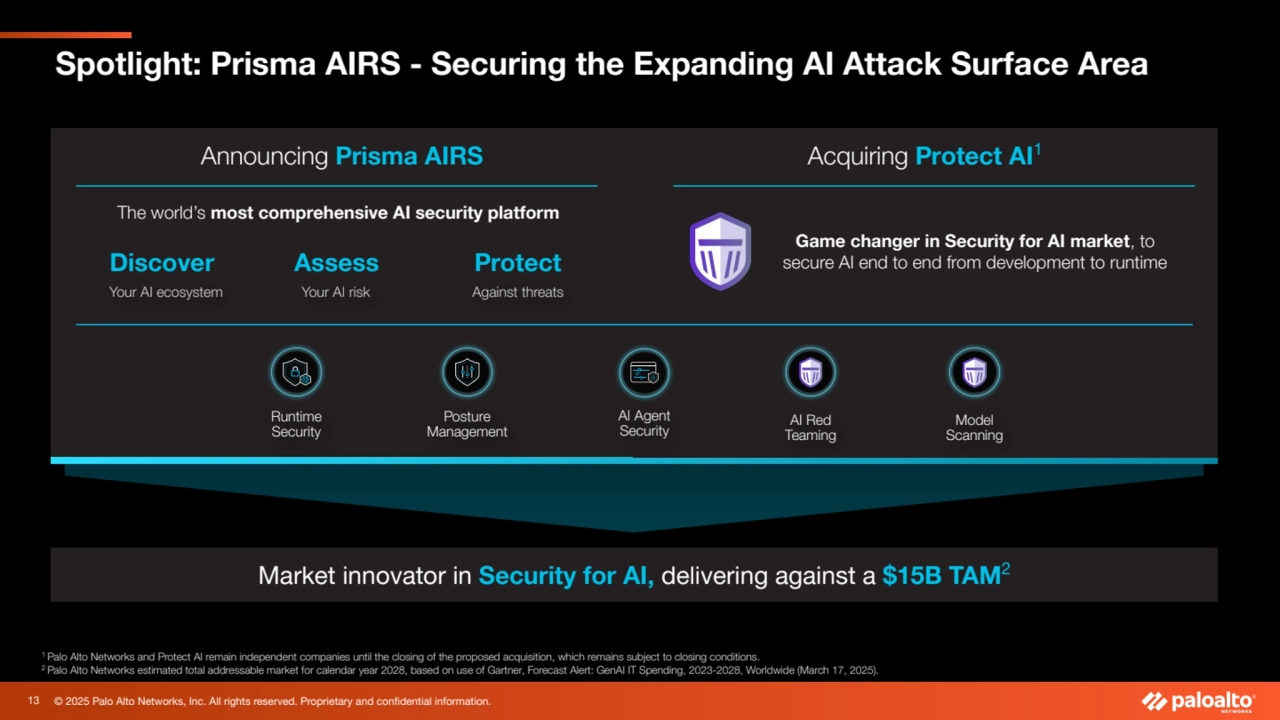
- 13. © 2025 Palo Alto Networks, Inc. All rights reserved. Proprietary and confidential information. Spotlight: Prisma AIRS - Securing the Expanding AI Attack Surface Area Announcing Prisma AIRS 1 Palo Alto Networks and Protect AI remain independent companies until the closing of the proposed acquisition, which remains subject to closing conditions. 2 Palo Alto Networks estimated total addressable market for calendar year 2028, based on use of Gartner, Forecast Alert: GenAI IT Spending, 2023-2028, Worldwide (March 17, 2025). Market innovator in Security for AI, delivering against a $15B TAM2 Acquiring Protect AI1 Runtime Security AI Agent Security Posture Management The world’s most comprehensive AI security platform Assess Your AI risk Protect Against threats Discover Your AI ecosystem Model Scanning AI Red Teaming Game changer in Security for AI market, to secure AI end to end from development to runtime 13
- 14. © 2025 Palo Alto Networks, Inc. All rights reserved. Proprietary and confidential information. Continued strong execution, robust pipeline opportunity in Q4 Strong momentum across our Platforms, driving durable NGS ARR growth Platformization has taken hold, customers are consolidating with us Relentless focus on innovation for the AI security era Sustaining Strong Momentum to Close Out the Year 14
- 15. © 2025 Palo Alto Networks, Inc. All rights reserved. Proprietary and confidential information.
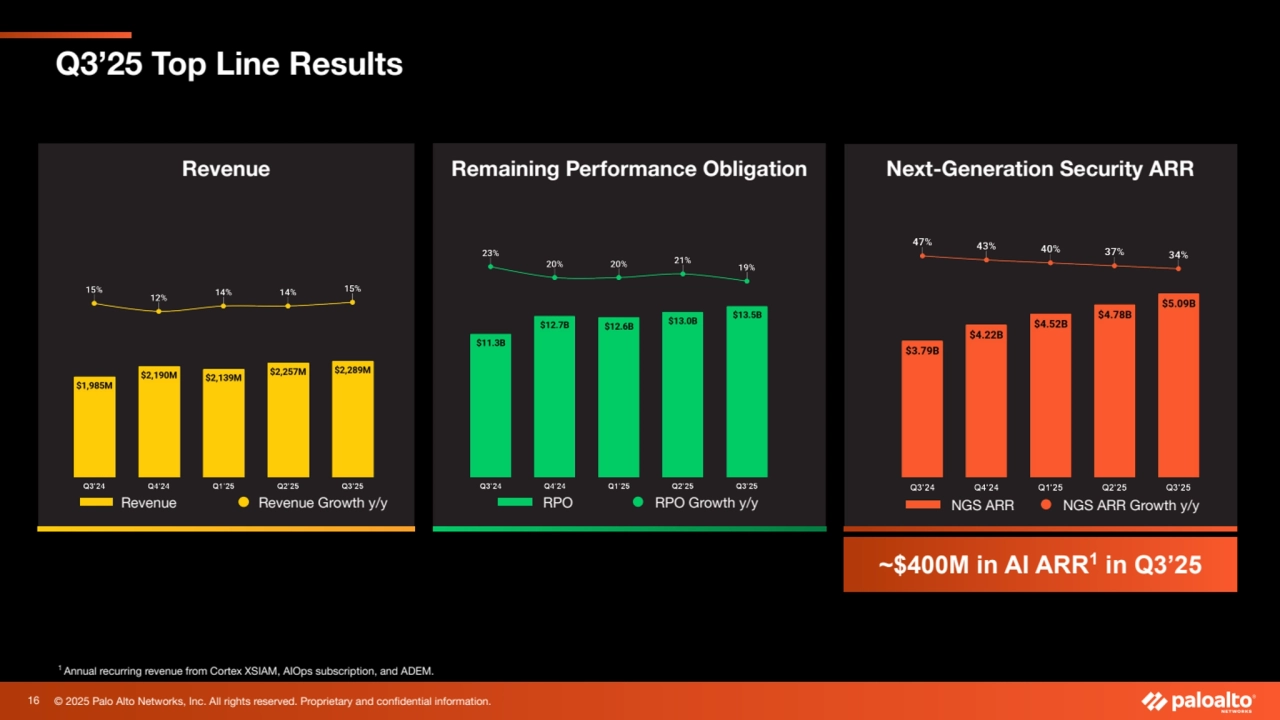
- 16. © 2025 Palo Alto Networks, Inc. All rights reserved. Proprietary and confidential information. Remaining Performance Obligation Q3’25 Top Line Results RPO RPO Growth y/y Next-Generation Security ARR NGS ARR NGS ARR Growth y/y Revenue Revenue Revenue Growth y/y ~$400M in AI ARR1 in Q3’25 1 Annual recurring revenue from Cortex XSIAM, AIOps subscription, and ADEM. 16
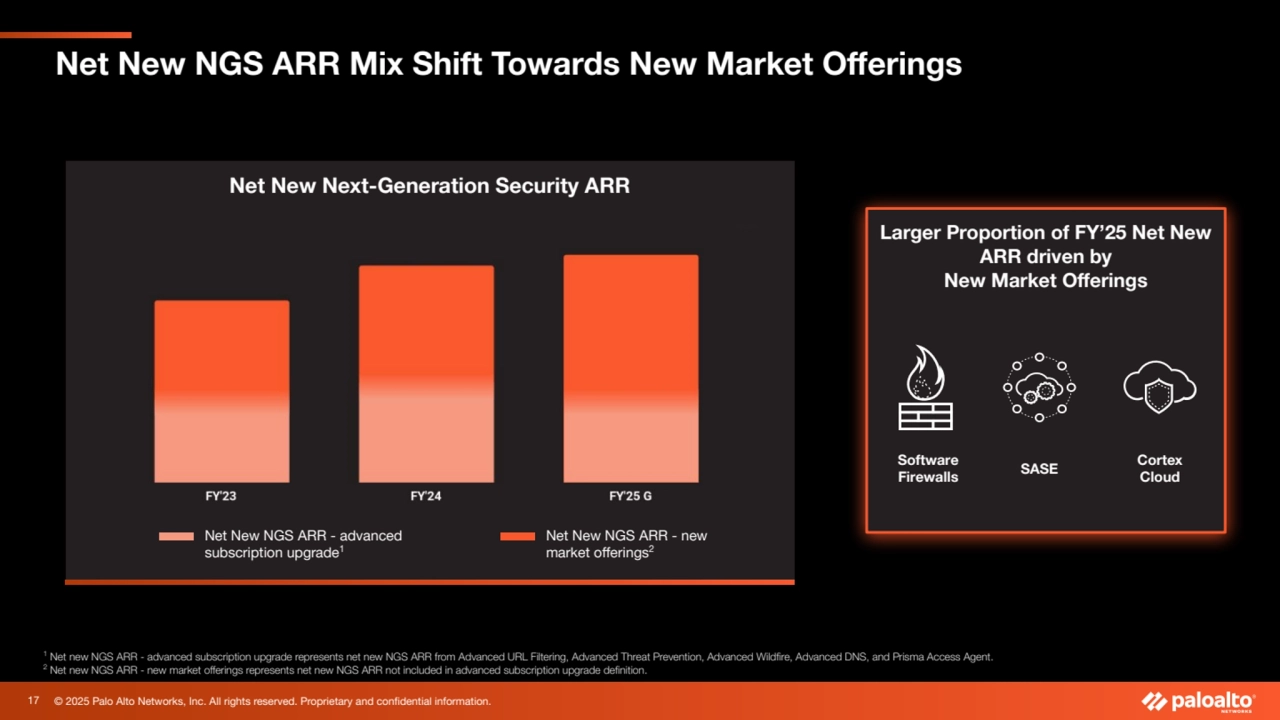
- 17. © 2025 Palo Alto Networks, Inc. All rights reserved. Proprietary and confidential information. Net New NGS ARR Mix Shift Towards New Market Offerings Net New Next-Generation Security ARR Net New NGS ARR - new market offerings2 Net New NGS ARR - advanced subscription upgrade1 1 Net new NGS ARR - advanced subscription upgrade represents net new NGS ARR from Advanced URL Filtering, Advanced Threat Prevention, Advanced Wildfire, Advanced DNS, and Prisma Access Agent. 2 Net new NGS ARR - new market offerings represents net new NGS ARR not included in advanced subscription upgrade definition. Larger Proportion of FY’25 Net New ARR driven by New Market Offerings Software Firewalls SASE Cortex Cloud 17
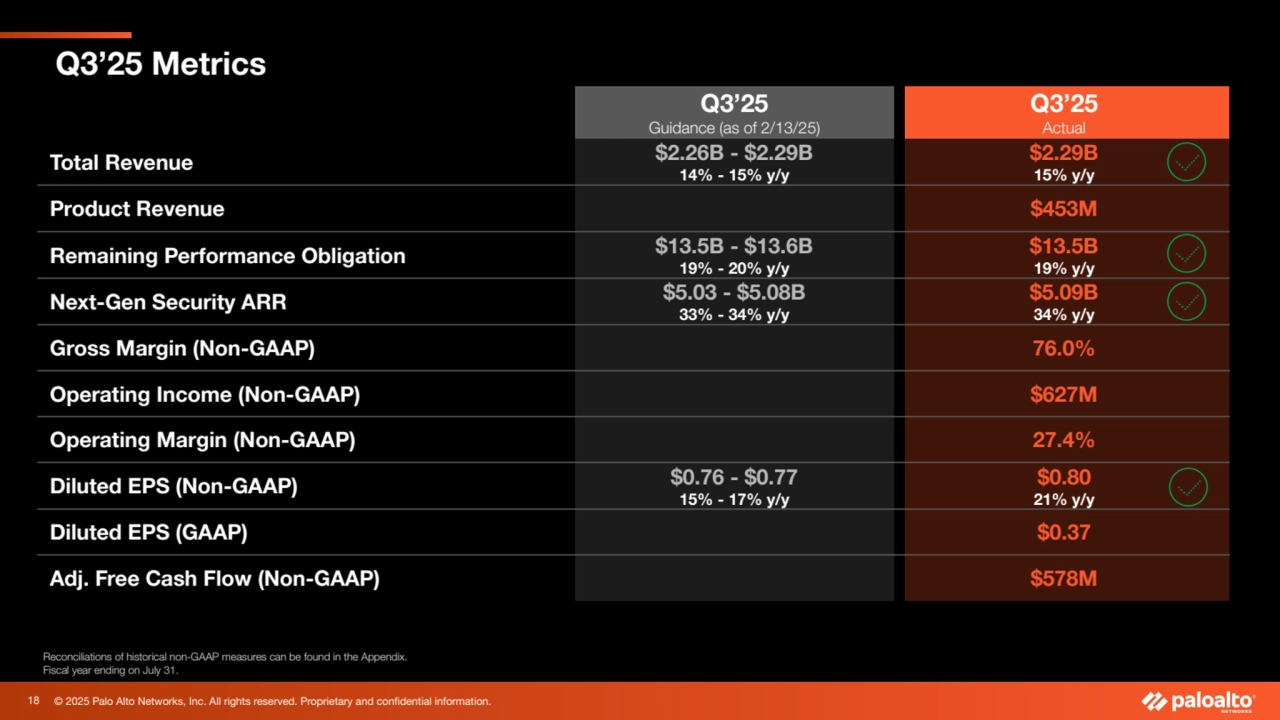
- 18. © 2025 Palo Alto Networks, Inc. All rights reserved. Proprietary and confidential information. Q3’25 Metrics Q3’25 Guidance (as of 2/13/25) Q3’25 Actual Total Revenue $2.26B - $2.29B 14% - 15% y/y $2.29B 15% y/y Product Revenue $453M Remaining Performance Obligation $13.5B - $13.6B 19% - 20% y/y $13.5B 19% y/y Next-Gen Security ARR $5.03 - $5.08B 33% - 34% y/y $5.09B 34% y/y Gross Margin (Non-GAAP) 76.0% Operating Income (Non-GAAP) $627M Operating Margin (Non-GAAP) 27.4% Diluted EPS (Non-GAAP) $0.76 - $0.77 15% - 17% y/y $0.80 21% y/y Diluted EPS (GAAP) $0.37 Adj. Free Cash Flow (Non-GAAP) $578M Reconciliations of historical non-GAAP measures can be found in the Appendix. Fiscal year ending on July 31. 18
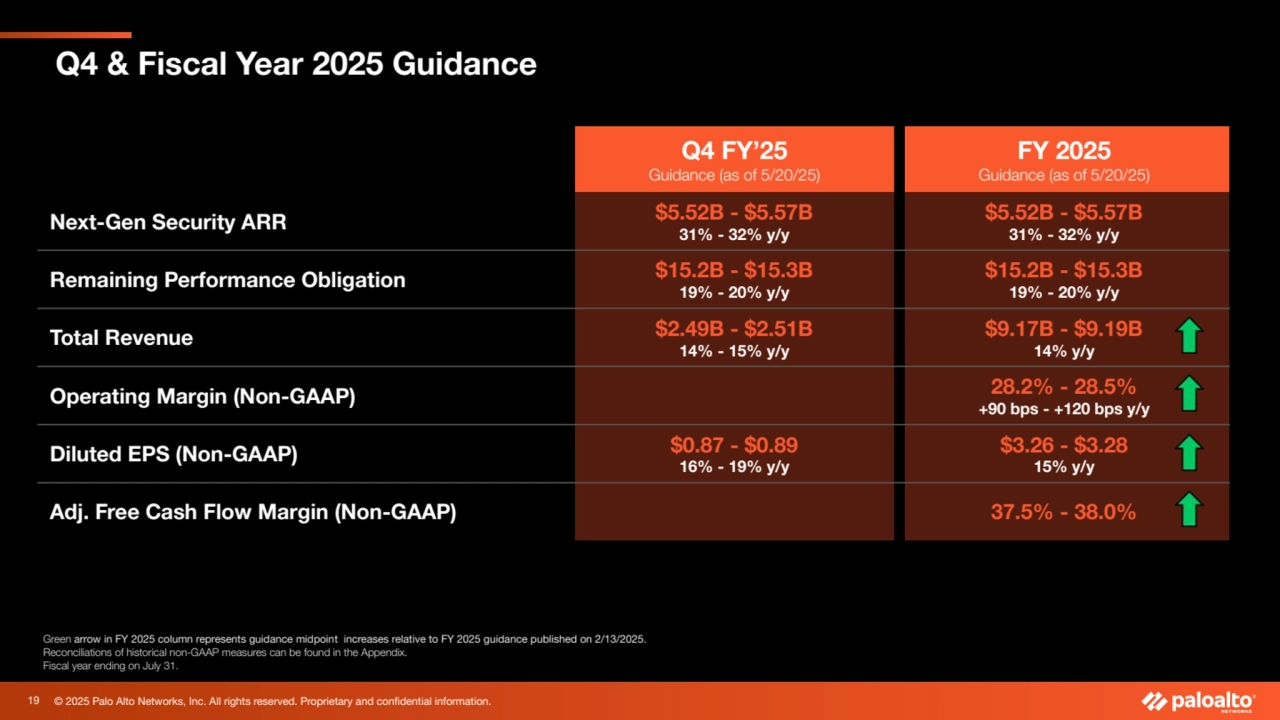
- 19. © 2025 Palo Alto Networks, Inc. All rights reserved. Proprietary and confidential information. Q4 & Fiscal Year 2025 Guidance Q4 FY’25 Guidance (as of 5/20/25) FY 2025 Guidance (as of 5/20/25) Next-Gen Security ARR $5.52B - $5.57B 31% - 32% y/y $5.52B - $5.57B 31% - 32% y/y Remaining Performance Obligation $15.2B - $15.3B 19% - 20% y/y $15.2B - $15.3B 19% - 20% y/y Total Revenue $2.49B - $2.51B 14% - 15% y/y $9.17B - $9.19B 14% y/y Operating Margin (Non-GAAP) 28.2% - 28.5% +90 bps - +120 bps y/y Diluted EPS (Non-GAAP) $0.87 - $0.89 16% - 19% y/y $3.26 - $3.28 15% y/y Adj. Free Cash Flow Margin (Non-GAAP) 37.5% - 38.0% Green arrow in FY 2025 column represents guidance midpoint increases relative to FY 2025 guidance published on 2/13/2025. Reconciliations of historical non-GAAP measures can be found in the Appendix. Fiscal year ending on July 31. 19
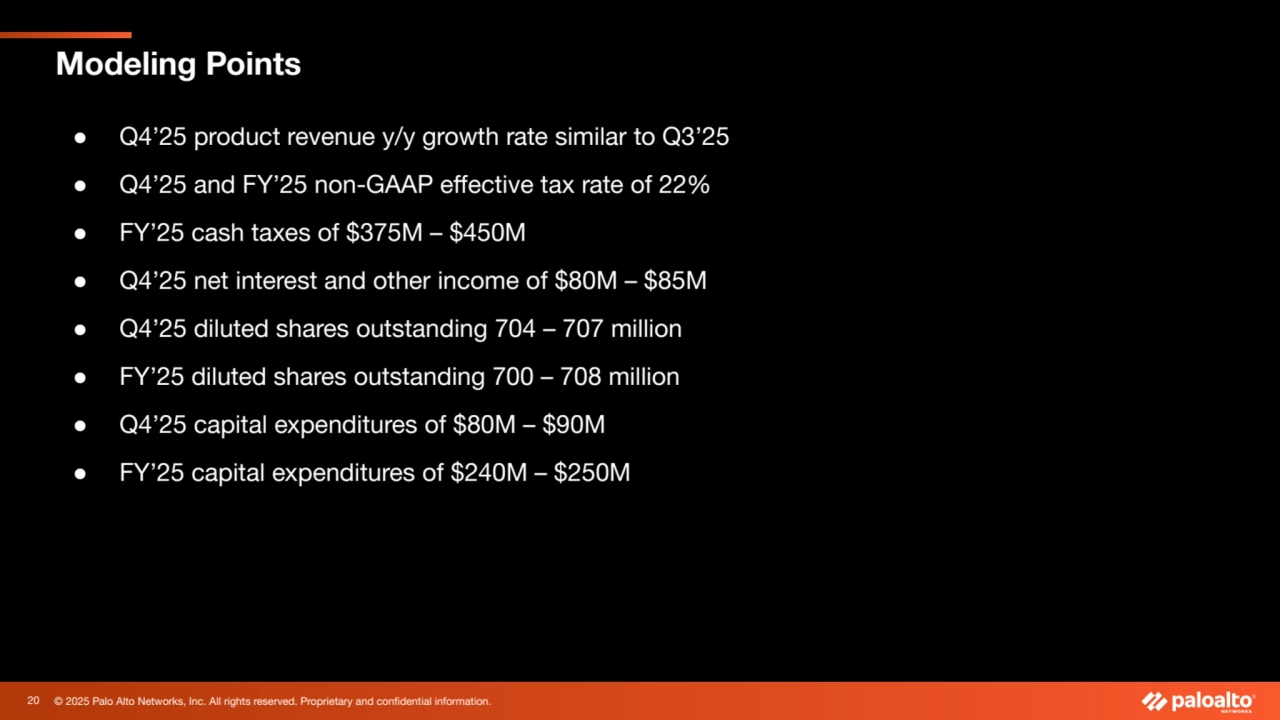
- 20. © 2025 Palo Alto Networks, Inc. All rights reserved. Proprietary and confidential information. Modeling Points ● Q4’25 product revenue y/y growth rate similar to Q3’25 ● Q4’25 and FY’25 non-GAAP effective tax rate of 22% ● FY’25 cash taxes of $375M – $450M ● Q4’25 net interest and other income of $80M – $85M ● Q4’25 diluted shares outstanding 704 – 707 million ● FY’25 diluted shares outstanding 700 – 708 million ● Q4’25 capital expenditures of $80M – $90M ● FY’25 capital expenditures of $240M – $250M 20
- 21. © 2025 Palo Alto Networks, Inc. All rights reserved. Proprietary and confidential information. Q&A
- 22. © 2025 Palo Alto Networks, Inc. All rights reserved. Proprietary and confidential information. Appendix
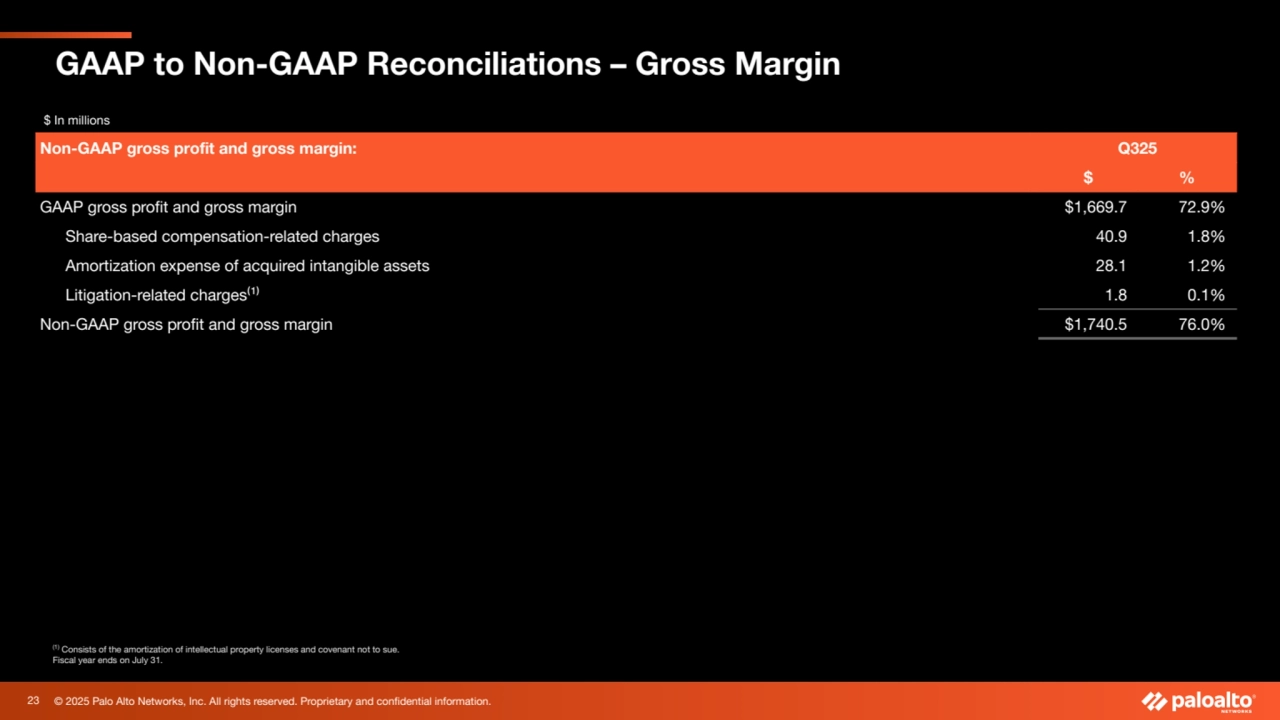
- 23. © 2025 Palo Alto Networks, Inc. All rights reserved. Proprietary and confidential information. GAAP to Non-GAAP Reconciliations – Gross Margin (1) Consists of the amortization of intellectual property licenses and covenant not to sue. Fiscal year ends on July 31. $ In millions Non-GAAP gross profit and gross margin: Q325 $ % GAAP gross profit and gross margin $1,669.7 72.9% Share-based compensation-related charges 40.9 1.8% Amortization expense of acquired intangible assets 28.1 1.2% Litigation-related charges⁽¹⁾ 1.8 0.1% Non-GAAP gross profit and gross margin $1,740.5 76.0% 23
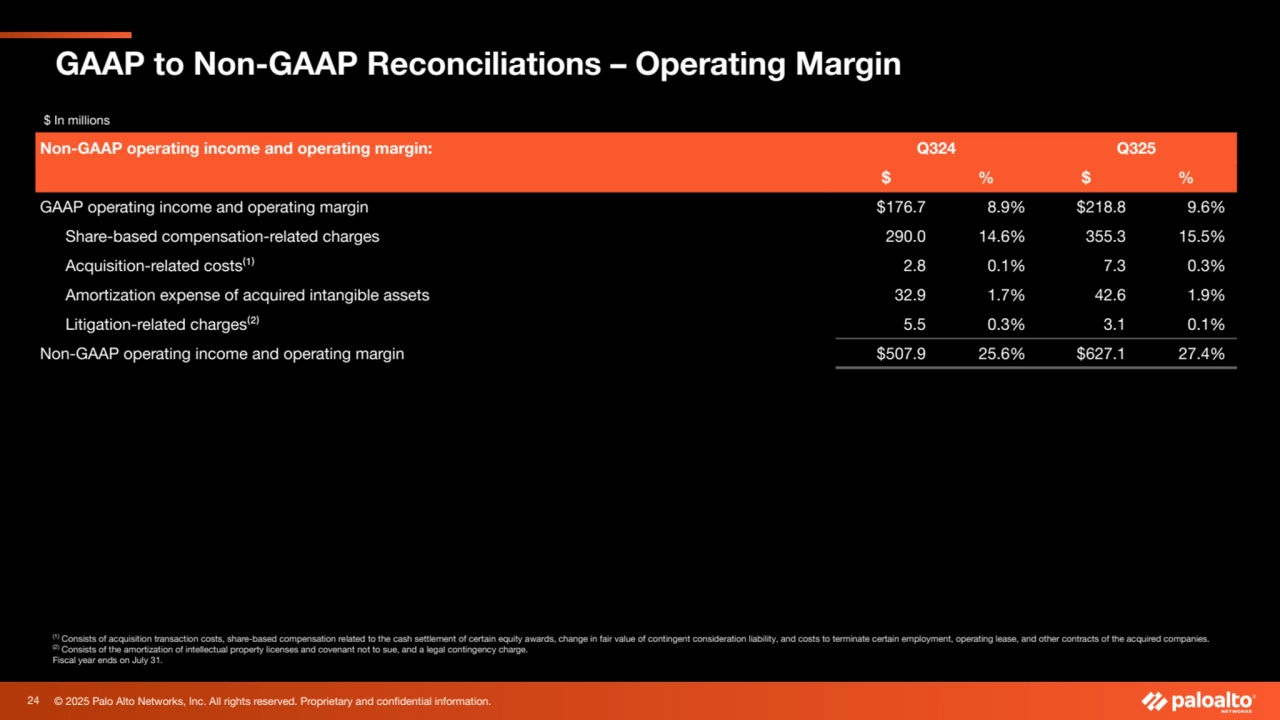
- 24. © 2025 Palo Alto Networks, Inc. All rights reserved. Proprietary and confidential information. (1) Consists of acquisition transaction costs, share-based compensation related to the cash settlement of certain equity awards, change in fair value of contingent consideration liability, and costs to terminate certain employment, operating lease, and other contracts of the acquired companies. (2) Consists of the amortization of intellectual property licenses and covenant not to sue, and a legal contingency charge. Fiscal year ends on July 31. GAAP to Non-GAAP Reconciliations – Operating Margin $ In millions Non-GAAP operating income and operating margin: Q324 Q325 $ % $ % GAAP operating income and operating margin $176.7 8.9% $218.8 9.6% Share-based compensation-related charges 290.0 14.6% 355.3 15.5% Acquisition-related costs⁽¹⁾ 2.8 0.1% 7.3 0.3% Amortization expense of acquired intangible assets 32.9 1.7% 42.6 1.9% Litigation-related charges⁽²⁾ 5.5 0.3% 3.1 0.1% Non-GAAP operating income and operating margin $507.9 25.6% $627.1 27.4% 24
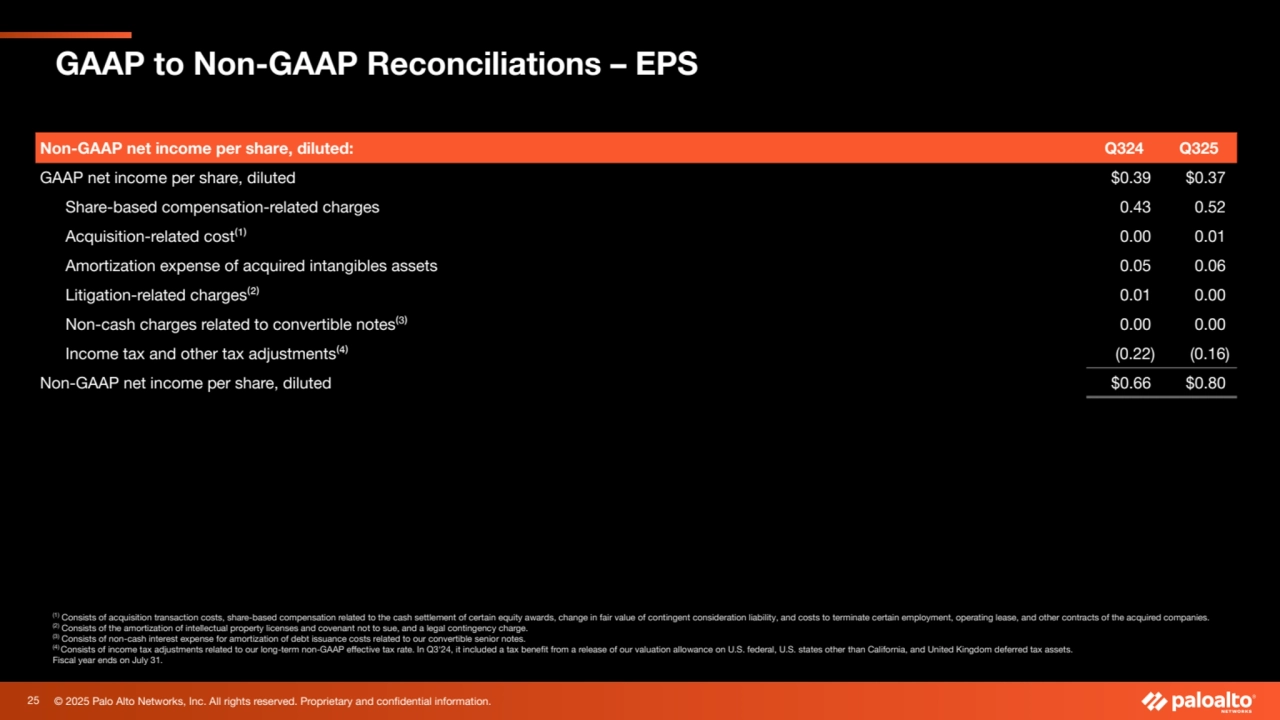
- 25. © 2025 Palo Alto Networks, Inc. All rights reserved. Proprietary and confidential information. GAAP to Non-GAAP Reconciliations – EPS (1) Consists of acquisition transaction costs, share-based compensation related to the cash settlement of certain equity awards, change in fair value of contingent consideration liability, and costs to terminate certain employment, operating lease, and other contracts of the acquired companies. (2) Consists of the amortization of intellectual property licenses and covenant not to sue, and a legal contingency charge. (3) Consists of non-cash interest expense for amortization of debt issuance costs related to our convertible senior notes. (4) Consists of income tax adjustments related to our long-term non-GAAP effective tax rate. In Q3'24, it included a tax benefit from a release of our valuation allowance on U.S. federal, U.S. states other than California, and United Kingdom deferred tax assets. Fiscal year ends on July 31. Non-GAAP net income per share, diluted: Q324 Q325 GAAP net income per share, diluted $0.39 $0.37 Share-based compensation-related charges 0.43 0.52 Acquisition-related cost⁽¹⁾ 0.00 0.01 Amortization expense of acquired intangibles assets 0.05 0.06 Litigation-related charges⁽²⁾ 0.01 0.00 Non-cash charges related to convertible notes⁽³⁾ 0.00 0.00 Income tax and other tax adjustments⁽⁴⁾ (0.22) (0.16) Non-GAAP net income per share, diluted $0.66 $0.80 25
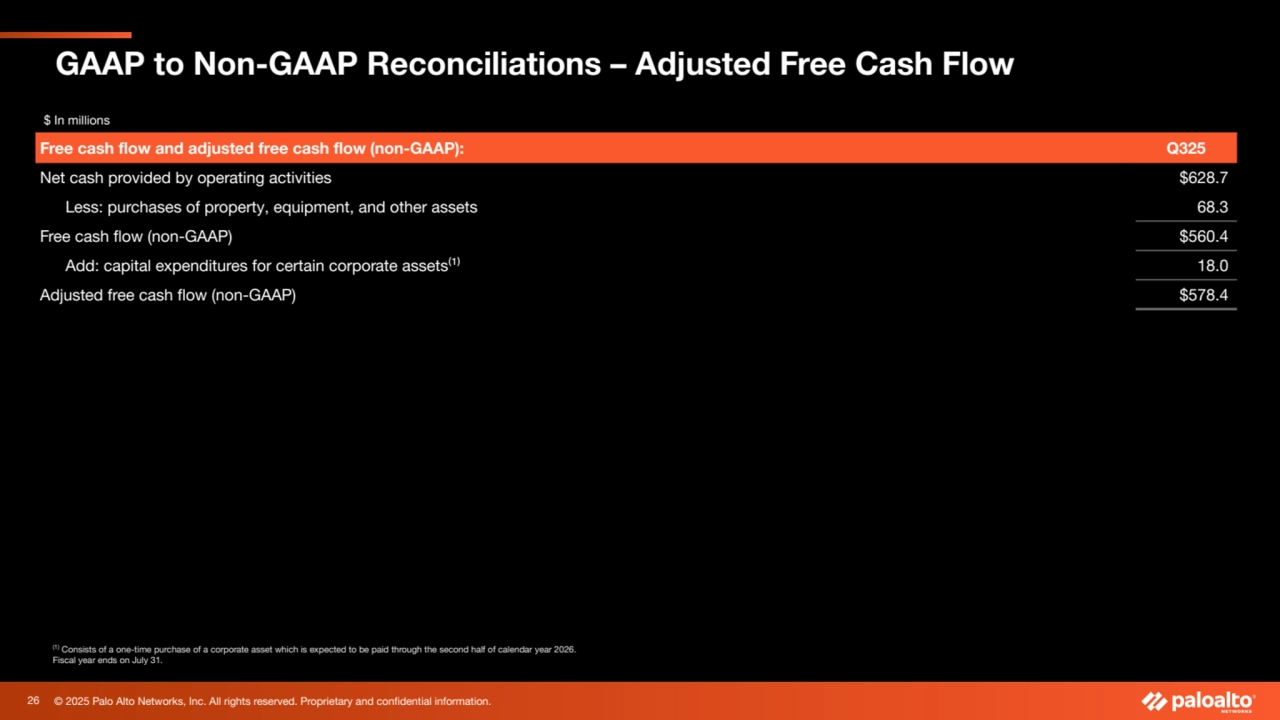
- 26. © 2025 Palo Alto Networks, Inc. All rights reserved. Proprietary and confidential information. (1) Consists of a one-time purchase of a corporate asset which is expected to be paid through the second half of calendar year 2026. Fiscal year ends on July 31. GAAP to Non-GAAP Reconciliations – Adjusted Free Cash Flow $ In millions Free cash flow and adjusted free cash flow (non-GAAP): Q325 Net cash provided by operating activities $628.7 Less: purchases of property, equipment, and other assets 68.3 Free cash flow (non-GAAP) $560.4 Add: capital expenditures for certain corporate assets⁽¹⁾ 18.0 Adjusted free cash flow (non-GAAP) $578.4 26