Palo Alto Networks: Q4 Fiscal Year 2025 Earnings Call
 AI Summary
Key Insights
- 🚀 Strong Q4 Performance: Palo Alto Networks capped a strong fiscal year with significant growth in RPO, NGS ARR, and revenue.
- 🤝 Platformization Success: Customers are increasingly platformizing with Palo Alto, driving better security outcomes.
- 🔒 Network Security Momentum: Higher software and SASE mix is boosting growth in network security business.
- ☁️ Cloud Security Growth: SASE deals and Cortex XSIAM adoption are leading to growth in cloud security offerings.
- 💰 Financial Outlook: PANW targets industry-leading adjusted FCF margin and provides guidance for Q1 and FY 2026.


Palo Alto Networks: Q4 Fiscal Year 2025 Earnings Call
- 1. © 2025 Palo Alto Networks, Inc. All rights reserved. Proprietary and confidential information. Q4 Fiscal Year 2025 Earnings Call August 18, 2025
- 2. © 2025 Palo Alto Networks, Inc. All rights reserved. Proprietary and confidential information. Safe Harbor This presentation contains “forward-looking” statements within the meaning of Section 27A of the Securities Act and Section 21E of the Exchange Act. All statements other than statements of historical or current facts, including, without limitation, statements regarding the cybersecurity threat landscape, our platformization strategy and related progress and opportunities, expectations regarding annual recurring revenue, remaining performance obligation, product development strategy and expectations regarding artificial intelligence (AI), financial outlook for the first quarter of fiscal 2026 and fiscal year 2026, mid- and long-term financial expectations, the expected future benefits to us, CyberArk Software Ltd. (“CyberArk”) and our and their respective customers from completing the proposed transaction with CyberArk, the anticipated future integration of our and CyberArk’s capabilities and the benefits they will deliver, the expected completion of the proposed transaction with CyberArk, the expected timing of the proposed transaction with CyberArk, the proposed accretion to free cash flow, revenue growth, and gross margin, the timing and amount of the synergies from the proposed transaction with CyberArk, modeling points, business and economic conditions and challenges, and other financial, operational and business expectations, made in this presentation are forward-looking. We use words such as “anticipates,” “believes,” “continue,” “estimate,” “expects,” “future,” “intends,” “may,” “plan,” and similar expressions to identify forward-looking statements, although not all forward-looking statements contain these identifying words. Actual results could differ materially for a variety of reasons that are beyond our control and changing rapidly. There are a significant number of factors that could cause actual results to differ materially from forward-looking statements made or implied in this presentation, including: developments and changes in general or worldwide market, geopolitical, economic, and business conditions; failure of our platformization product offerings; failure to achieve the expected benefits of our strategic partnerships and acquisitions, including the proposed transaction with CyberARk; changes in the fair value of our contingent consideration liability associated with acquisitions; the occurrence of any event, change or other circumstance that could give rise to the termination of the proposed transaction with CyberArk; our ability to successfully integrate CyberArk’s businesses and technologies; the risk that the expected benefits and synergies of the proposed transaction may not be fully achieved in a timely manner, or at all; the risk that we or CyberArk will be unable to retain and hire key personnel; the risk associated with CyberArk’s ability to obtain the approval of its shareholders required to consummate the proposed transaction; the risk that the conditions to the proposed transaction with CyberArk are not satisfied on a timely basis, or at all, or the failure of the proposed transaction with CyberArk to close for any other reason or to close on the anticipated terms; the risk that any regulatory approval, consent or authorization that may be required for the proposed transaction with CyberArk is not obtained or is obtained subject to conditions that are not anticipated or that could adversely affect the expected benefits of the transaction with CyberArk; significant and/or unanticipated difficulties, liabilities or expenditures relating to the transaction with CyberArk; the effect of the announcement, pendency or completion of the proposed transaction with CyberArk on our and CyberArk’s business relationships and business operations generally; the effect of the announcement or pendency of the proposed transaction with CyberArk on our common share price or CyberArk’s ordinary share price and uncertainty as to the long-term value of our or CyberArk’s common or ordinary share; risks related to disruption of management time from ongoing business operations due to the proposed transaction with CyberArk; the outcome of any legal proceedings that may be instituted against us, CyberArk or our respective directors; risks associated with managing our growth; risks associated with new product, subscription and support offerings, including our product offerings that leverage AI; shifts in priorities or delays in the development or release of new product or subscription or other offerings, or the failure to timely develop and achieve market acceptance of new products and subscriptions as well as existing products, subscriptions and support offerings; failure of our business strategies; rapidly evolving technological developments in the market for security products, subscriptions and support offerings; defects, errors, or vulnerabilities in our products, subscriptions, or support offerings; our customers’ purchasing decisions and the length of sales cycles; our competition; our ability to attract and retain new customers; our ability to acquire and integrate other companies, products, or technologies in a successful manner; our debt repayment obligations; and our share repurchase program, which may not be fully consummated or enhance shareholder value, and any share repurchases which could affect the price of our common stock. For additional risks and uncertainties on these and other factors that could affect our financial results and cause actual results to differ materially from those described in the forward-looking statements we make in this presentation are included under the captions “Risk Factors” and “Management’s Discussion and Analysis of Financial Condition and Results of Operations” and elsewhere in our Quarterly Report on Form 10-Q filed with the U.S. Securities and Exchange Commission (the “SEC”) on May 21, 2025, which is available on our website at investors.paloaltonetworks.com and on the SEC’s website at www.sec.gov. Please also refer to CyberArk’s periodic reports and other filings with the SEC, including the risk factors contained in CyberArk’s annual report on Form 20-F and reports of foreign private issuer on Form 6-K. Additional information will also be set forth in other documents that we file with or furnish to the SEC from time to time. All forward-looking statements in this presentation are based on our current beliefs and information available to management as of the date hereof and are inherently uncertain, and we do not assume any obligation to update the forward-looking statements provided to reflect events that occur or circumstances that exist after the date on which they were made. 2
- 3. © 2025 Palo Alto Networks, Inc. All rights reserved. Proprietary and confidential information. Safe Harbor - Continued Non-GAAP Financial Measures All information in this presentation is as of August 18, 2025. This presentation contains non-GAAP financial measures and key metrics relating to the company’s past and expected future performance. We have not reconciled diluted non-GAAP earnings per share guidance to GAAP earnings per diluted share, non-GAAP operating margin to GAAP operating margin or adjusted free cash flow margin guidance to GAAP net cash from operating activities because we do not provide guidance on GAAP operating margin, GAAP net income (loss) or net cash from operating activities and would not be able to present the various reconciling cash and non-cash items between GAAP and non-GAAP financial measures because certain items that impact these measures are uncertain or out of our control, or cannot be reasonably predicted, including share-based compensation expense, without unreasonable effort. The actual amounts of such reconciling items will have a significant impact on the company's GAAP net income per diluted share and GAAP net cash from operating activities. No Offer or Solicitation This presentation is not intended to and shall not constitute an offer to buy or sell or the solicitation of an offer to buy or sell any securities or a solicitation of any vote or approval, nor shall there be any sale of securities in any jurisdiction in which such offer, solicitation or sale would be unlawful prior to registration or qualification under the securities laws of any such jurisdiction. No offering of securities shall be made, except by means of a prospectus meeting the requirements of Section 10 of the U.S. Securities Act of 1933, as amended. Additional Information about the Merger and Where to Find It In connection with the proposed transaction with CyberArk, we intend to file with the SEC a registration statement on Form S-4, which will include a proxy statement of CyberArk that also constitutes a prospectus of our common shares to be offered in the proposed transaction. We and CyberArk may also file or furnish other relevant documents with the SEC regarding the proposed transaction. This presentation is not a substitute for the proxy statement/prospectus or registration statement or any other document that we or CyberArk may file or furnish with the SEC or send to security holders in connection with the proposed transaction. The registration statement will include a definitive proxy statement/prospectus, which will be sent to shareholders of CyberArk seeking their approval of the proposed transaction. INVESTORS AND SECURITY HOLDERS ARE URGED TO READ THE REGISTRATION STATEMENT ON FORM S-4, THE PROXY STATEMENT/PROSPECTUS INCLUDED WITHIN THE REGISTRATION STATEMENT ON FORM S-4 AND ANY OTHER RELEVANT DOCUMENTS THAT MAY BE FILED OR FURNISHED WITH THE SEC, AS WELL AS ANY AMENDMENTS OR SUPPLEMENTS TO THESE DOCUMENTS, CAREFULLY AND IN THEIR ENTIRETY WHEN THEY BECOME AVAILABLE BECAUSE THEY CONTAIN OR WILL CONTAIN IMPORTANT INFORMATION ABOUT THE PROPOSED TRANSACTION. Investors and security holders will be able to obtain free copies of the registration statement and proxy statement/prospectus, when available, and other documents containing important information about us, CyberArk and the proposed transaction, once such documents are filed or furnished with the SEC through the website maintained by the SEC at www.sec.gov. Copies of the documents filed with the SEC by us will be available free of charge on our website at www.paloaltonetworks.com or by contacting our Investor Relations Department by email at ir@paloaltonetworks.com. Copies of the documents filed or furnished with the SEC by CyberArk will be available free of charge on CyberArk’s website at www.cyberark.com or by contacting CyberArk’s Investor Relations department by email at ir@cyberark.com or by phone at 617-558-2132. 3
- 4. © 2025 Palo Alto Networks, Inc. All rights reserved. Proprietary and confidential information.
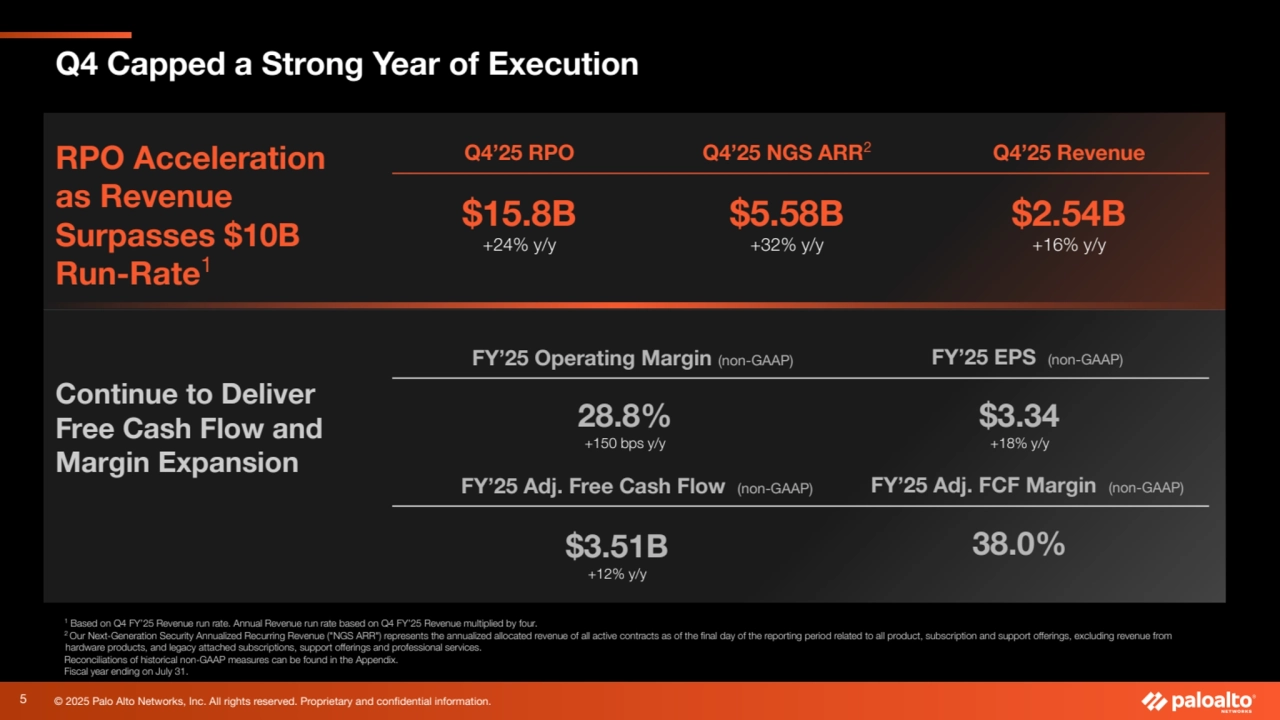
- 5. © 2025 Palo Alto Networks, Inc. All rights reserved. Proprietary and confidential information. RPO Acceleration as Revenue Surpasses $10B Run-Rate1 1 Based on Q4 FY’25 Revenue run rate. Annual Revenue run rate based on Q4 FY’25 Revenue multiplied by four. 2 Our Next-Generation Security Annualized Recurring Revenue ("NGS ARR") represents the annualized allocated revenue of all active contracts as of the final day of the reporting period related to all product, subscription and support offerings, excluding revenue from hardware products, and legacy attached subscriptions, support offerings and professional services. Reconciliations of historical non-GAAP measures can be found in the Appendix. Fiscal year ending on July 31. Q4 Capped a Strong Year of Execution Q4’25 NGS ARR2 $5.58B +32% y/y Q4’25 Revenue $2.54B +16% y/y FY’25 Operating Margin (non-GAAP) 28.8% +150 bps y/y 5 Q4’25 RPO $15.8B +24% y/y FY’25 EPS (non-GAAP) $3.34 +18% y/y Continue to Deliver Free Cash Flow and Margin Expansion FY’25 Adj. Free Cash Flow (non-GAAP) FY’25 Adj. FCF Margin (non-GAAP) $3.51B 38.0% +12% y/y
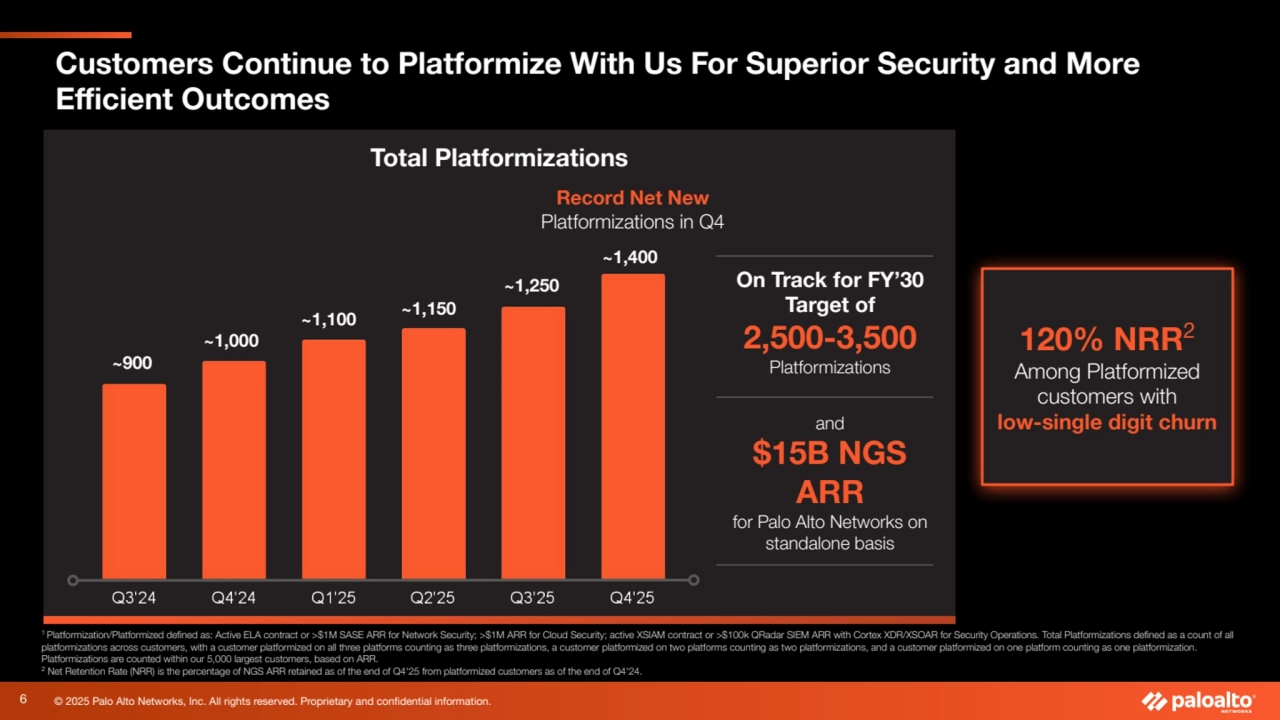
- 6. © 2025 Palo Alto Networks, Inc. All rights reserved. Proprietary and confidential information. 120% NRR2 Among Platformized customers with low-single digit churn Total Platformizations ~900 1 Platformization/Platformized defined as: Active ELA contract or >$1M SASE ARR for Network Security; >$1M ARR for Cloud Security; active XSIAM contract or >$100k QRadar SIEM ARR with Cortex XDR/XSOAR for Security Operations. Total Platformizations defined as a count of all platformizations across customers, with a customer platformized on all three platforms counting as three platformizations, a customer platformized on two platforms counting as two platformizations, and a customer platformized on one platform counting as one platformization. Platformizations are counted within our 5,000 largest customers, based on ARR. 2 Net Retention Rate (NRR) is the percentage of NGS ARR retained as of the end of Q4'25 from platformized customers as of the end of Q4'24. ~1,250 ~1,000 ~1,100 ~1,150 ~1,400 Record Net New Platformizations in Q4 On Track for FY’30 Target of 2,500-3,500 Platformizations and $15B NGS ARR for Palo Alto Networks on standalone basis Customers Continue to Platformize With Us For Superior Security and More Efficient Outcomes 6
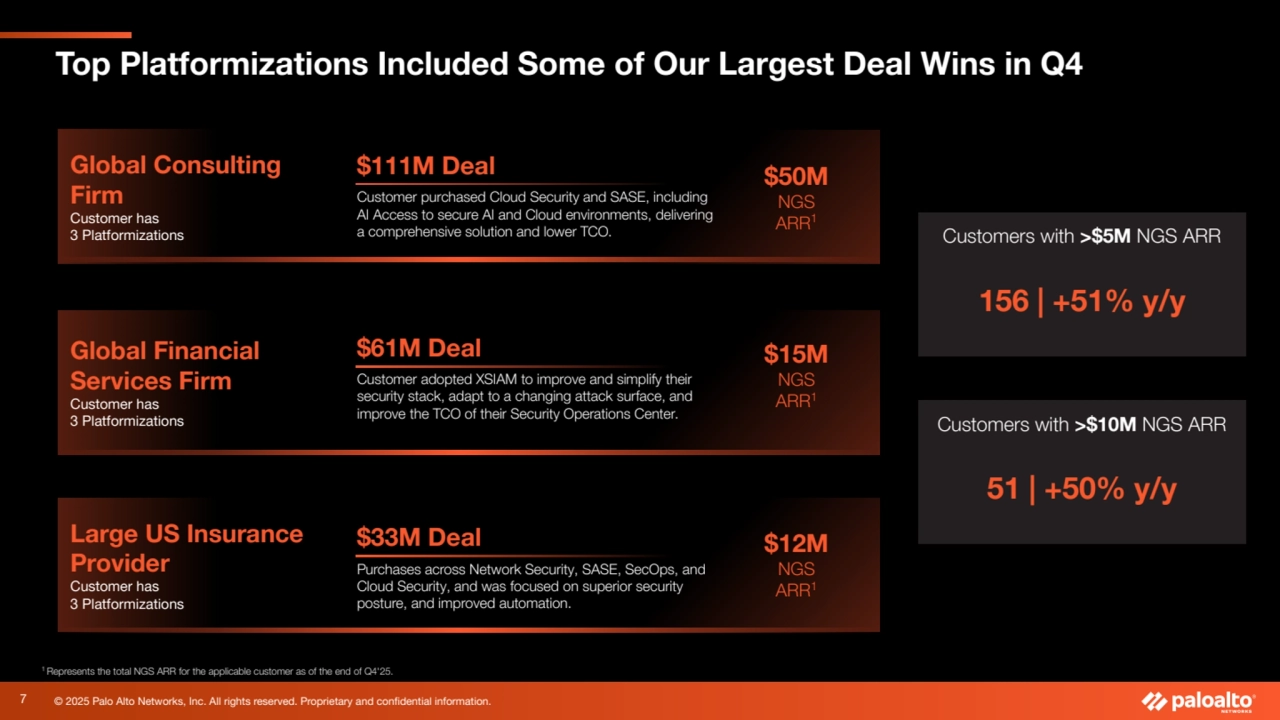
- 7. © 2025 Palo Alto Networks, Inc. All rights reserved. Proprietary and confidential information. Global Consulting Firm Customer has 3 Platformizations Large US Insurance Provider Customer has 3 Platformizations Global Financial Services Firm Customer has 3 Platformizations Customer adopted XSIAM to improve and simplify their security stack, adapt to a changing attack surface, and improve the TCO of their Security Operations Center. Customer purchased Cloud Security and SASE, including AI Access to secure AI and Cloud environments, delivering a comprehensive solution and lower TCO. Purchases across Network Security, SASE, SecOps, and Cloud Security, and was focused on superior security posture, and improved automation. $33M Deal $61M Deal $111M Deal $15M NGS ARR1 $50M NGS ARR1 $12M NGS ARR1 Customers with >$5M NGS ARR 156 | +51% y/y Customers with >$10M NGS ARR 51 | +50% y/y Top Platformizations Included Some of Our Largest Deal Wins in Q4 1 Represents the total NGS ARR for the applicable customer as of the end of Q4'25. 7
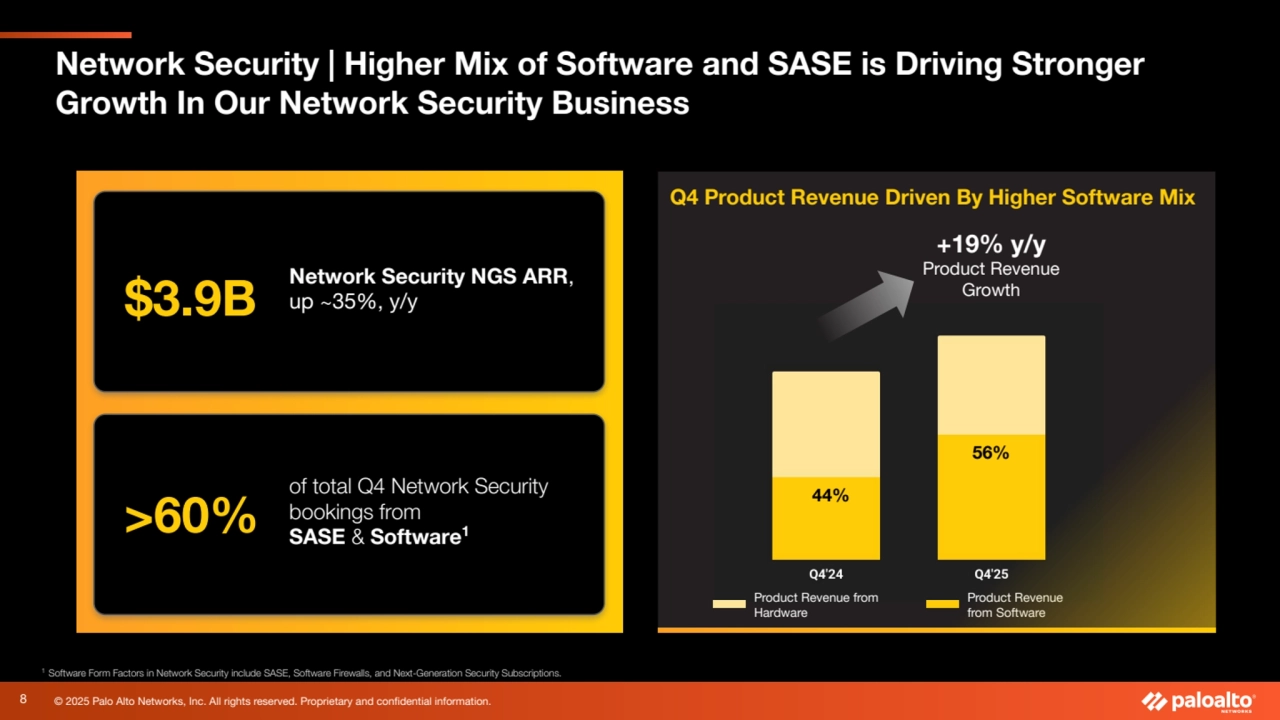
- 8. 8 © 2025 Palo Alto Networks, Inc. All rights reserved. Proprietary and confidential information. Q4 Product Revenue Driven By Higher Software Mix 1 Software Form Factors in Network Security include SASE, Software Firewalls, and Next-Generation Security Subscriptions. 44% 56% Product Revenue from Hardware Product Revenue from Software +19% y/y Product Revenue Growth Network Security NGS ARR, $3.9B up ~35%, y/y of total Q4 Network Security bookings from SASE & Software >60% 1 Network Security | Higher Mix of Software and SASE is Driving Stronger Growth In Our Network Security Business
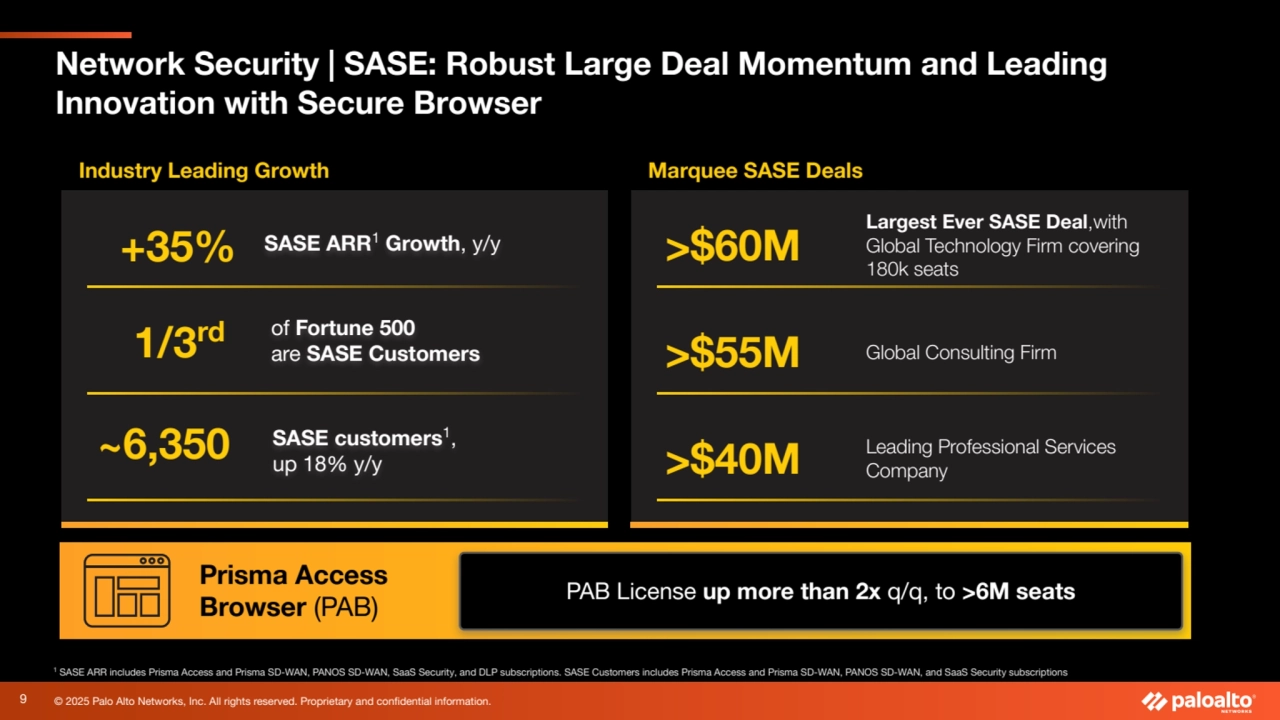
- 9. 9 © 2025 Palo Alto Networks, Inc. All rights reserved. Proprietary and confidential information. >$60M Largest Ever SASE Deal,with Global Technology Firm covering 180k seats Prisma Access Browser (PAB) Marquee SASE Deals >$55M Global Consulting Firm >$40M Leading Professional Services Company 1 SASE ARR includes Prisma Access and Prisma SD-WAN, PANOS SD-WAN, SaaS Security, and DLP subscriptions. SASE Customers includes Prisma Access and Prisma SD-WAN, PANOS SD-WAN, and SaaS Security subscriptions Industry Leading Growth PAB License up more than 2x q/q, to >6M seats SASE ARR1 Growth, y/y +35% 1/3rd of Fortune 500 are SASE Customers SASE customers1, ~6,350 up 18% y/y Network Security | SASE: Robust Large Deal Momentum and Leading Innovation with Secure Browser
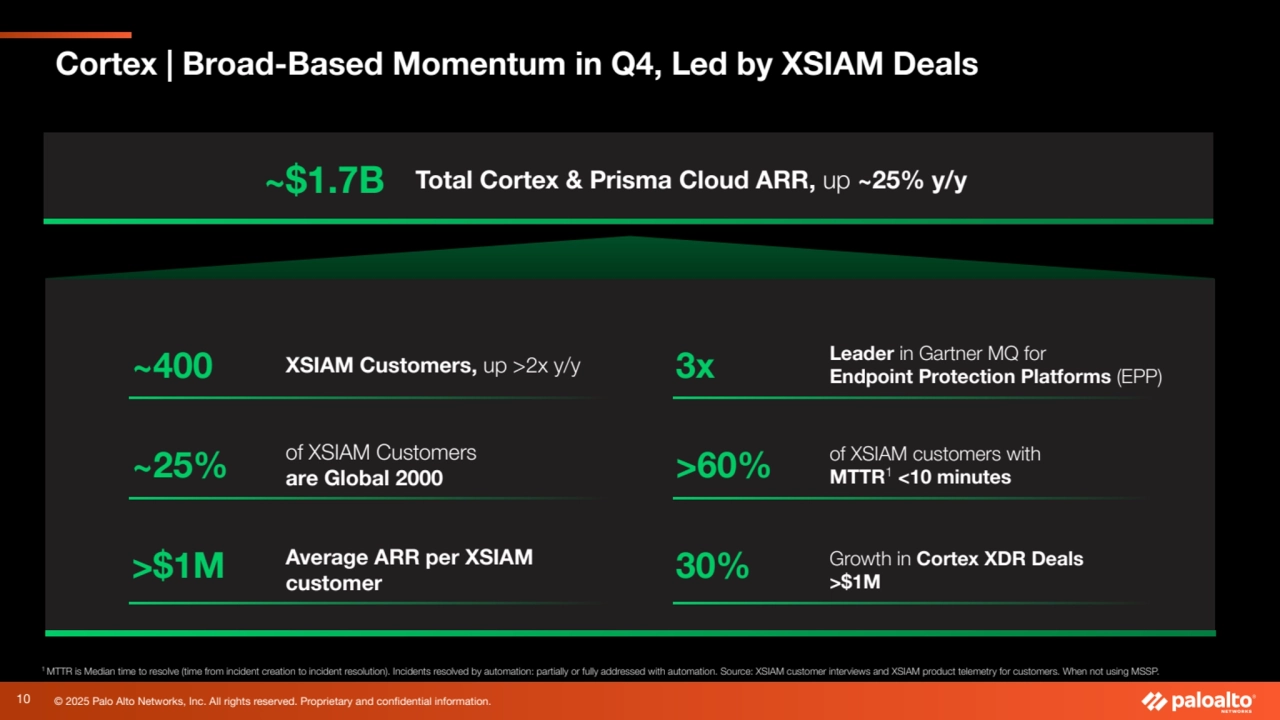
- 10. © 2025 Palo Alto Networks, Inc. All rights reserved. Proprietary and confidential information. 1 MTTR is Median time to resolve (time from incident creation to incident resolution). Incidents resolved by automation: partially or fully addressed with automation. Source: XSIAM customer interviews and XSIAM product telemetry for customers. When not using MSSP. Cortex | Broad-Based Momentum in Q4, Led by XSIAM Deals ~$1.7B Total Cortex & Prisma Cloud ARR, up ~25% y/y ~400 XSIAM Customers, up >2x y/y ~25% of XSIAM Customers are Global 2000 >$1M Average ARR per XSIAM customer 3x Leader in Gartner MQ for Endpoint Protection Platforms (EPP) >60% of XSIAM customers with MTTR1 <10 minutes 30% Growth in Cortex XDR Deals >$1M 10
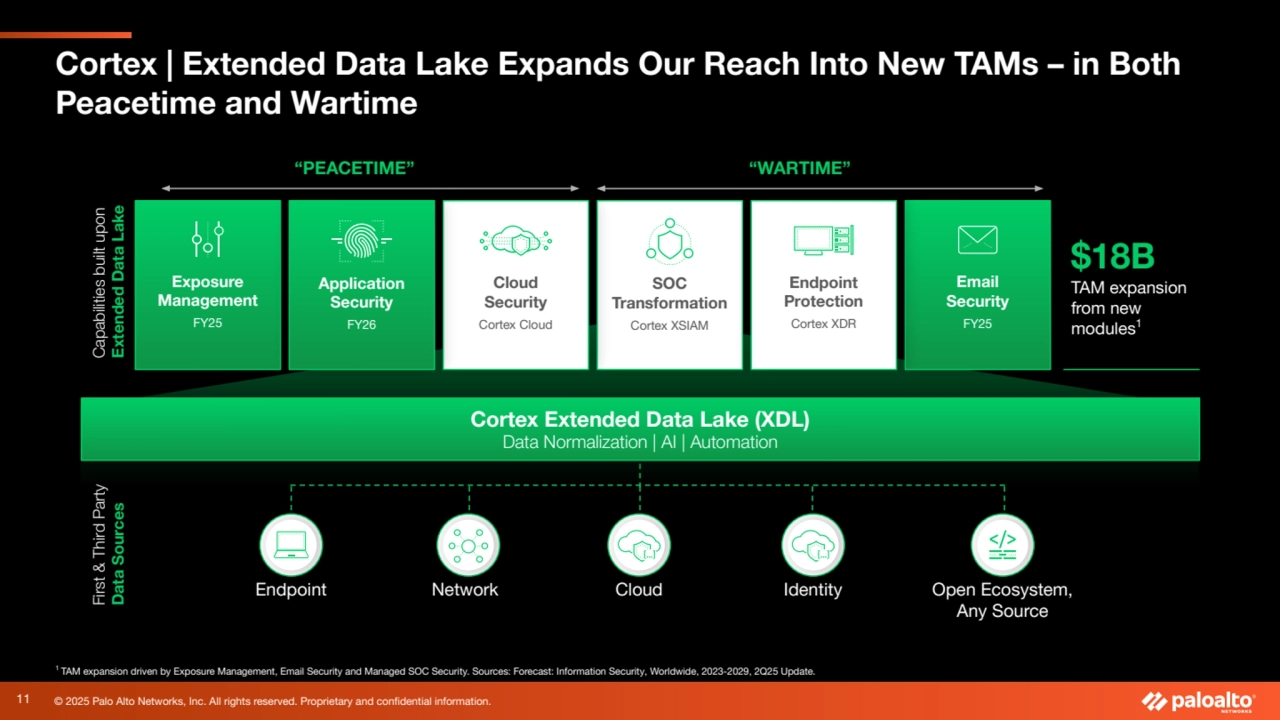
- 11. © 2025 Palo Alto Networks, Inc. All rights reserved. Proprietary and confidential information. Cortex | Extended Data Lake Expands Our Reach Into New TAMs – in Both Peacetime and Wartime $18B TAM expansion from new modules1 “PEACETIME” “WARTIME” Email Security FY25 Exposure Management FY25 SOC Transformation Cortex XSIAM Endpoint Protection Cortex XDR Cloud Security Cortex Cloud 1 TAM expansion driven by Exposure Management, Email Security and Managed SOC Security. Sources: Forecast: Information Security, Worldwide, 2023-2029, 2Q25 Update. Application Security FY26 Endpoint Network Open Ecosystem, Any Source Cloud Identity Cortex Extended Data Lake (XDL) Data Normalization | AI | Automation Capabilities built upon Extended Data Lake First & Third Party Data Sources 11
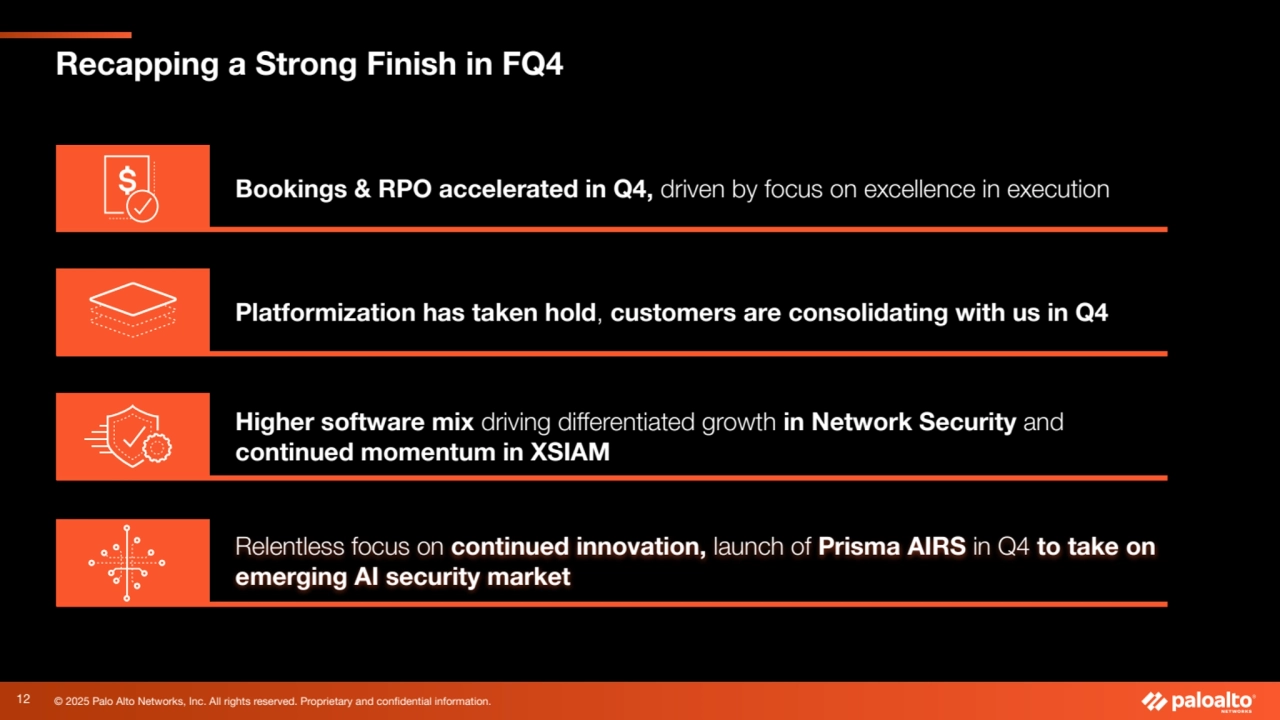
- 12. © 2025 Palo Alto Networks, Inc. All rights reserved. Proprietary and confidential information. Bookings & RPO accelerated in Q4, driven by focus on excellence in execution Higher software mix driving differentiated growth in Network Security and continued momentum in XSIAM Platformization has taken hold, customers are consolidating with us in Q4 Relentless focus on continued innovation, launch of Prisma AIRS in Q4 to take on emerging AI security market Recapping a Strong Finish in FQ4 12
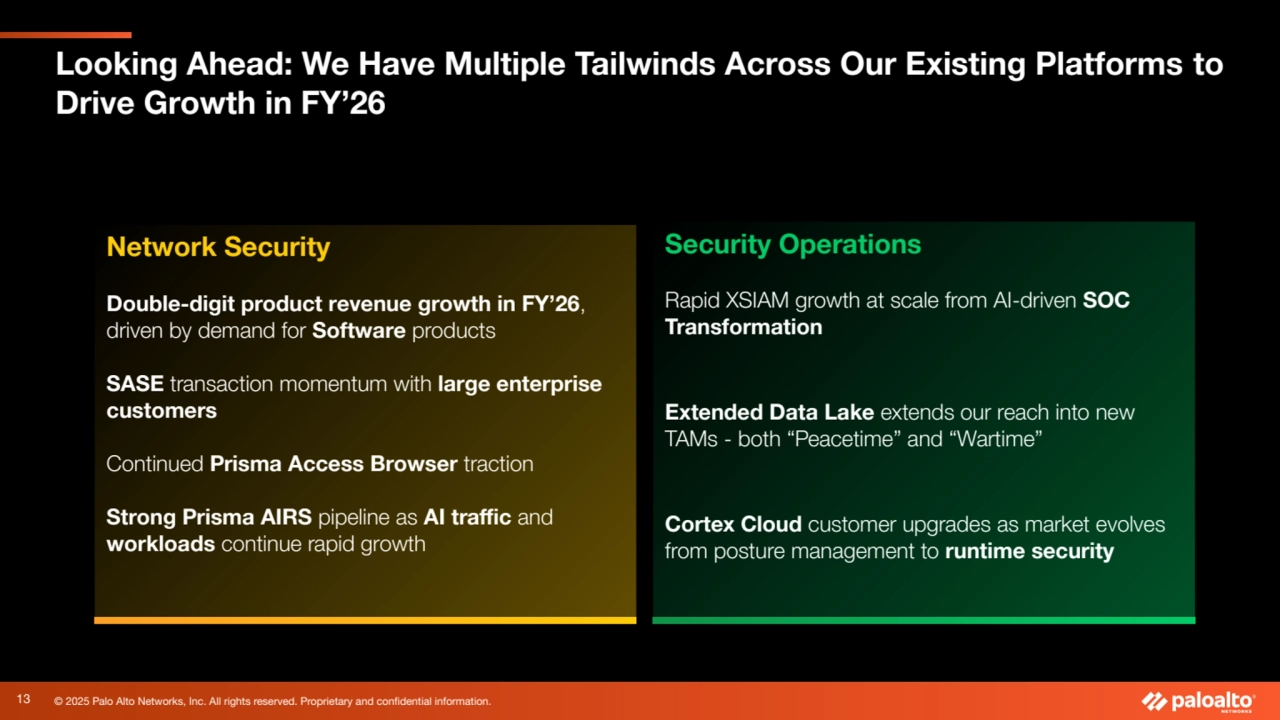
- 13. © 2025 Palo Alto Networks, Inc. All rights reserved. Proprietary and confidential information. Looking Ahead: We Have Multiple Tailwinds Across Our Existing Platforms to Drive Growth in FY’26 13 Network Security Double-digit product revenue growth in FY’26, driven by demand for Software products SASE transaction momentum with large enterprise customers Continued Prisma Access Browser traction Strong Prisma AIRS pipeline as AI traffic and workloads continue rapid growth Security Operations Rapid XSIAM growth at scale from AI-driven SOC Transformation Extended Data Lake extends our reach into new TAMs - both “Peacetime” and “Wartime” Cortex Cloud customer upgrades as market evolves from posture management to runtime security
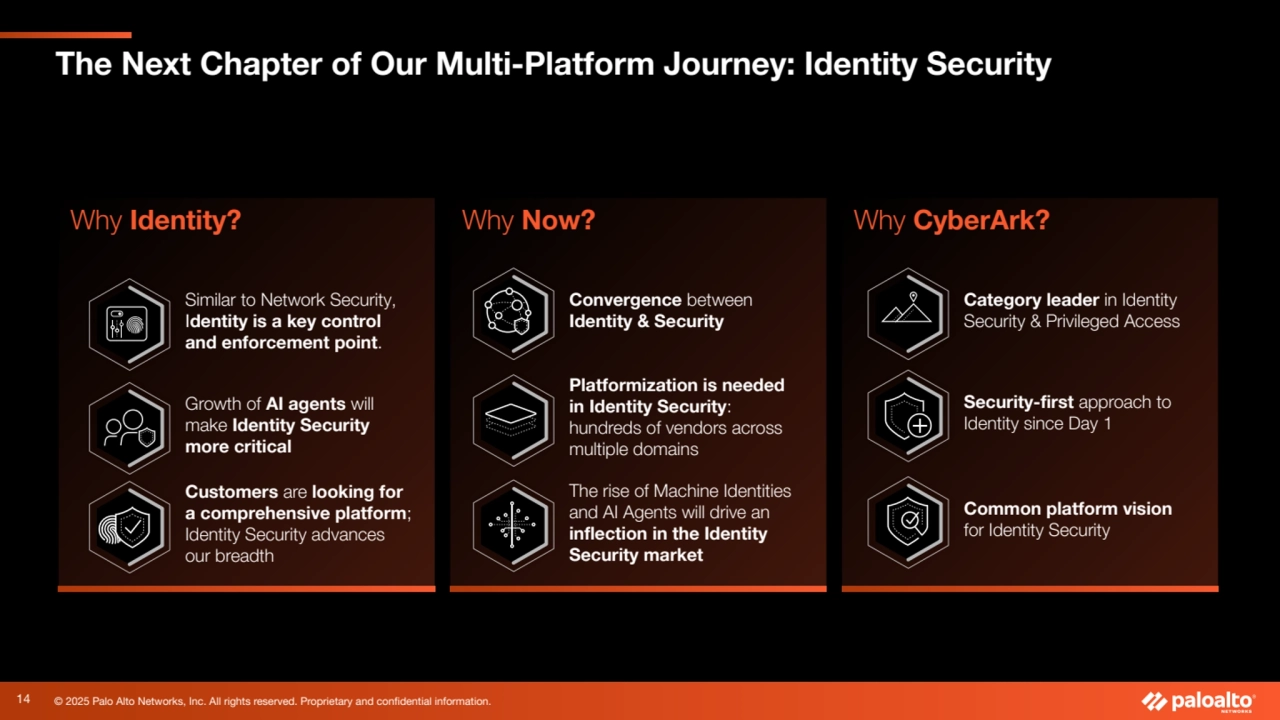
- 14. © 2025 Palo Alto Networks, Inc. All rights reserved. Proprietary and confidential information. Why Identity? Growth of AI agents will make Identity Security more critical The Next Chapter of Our Multi-Platform Journey: Identity Security 14 Why Now? Why CyberArk? Similar to Network Security, Identity is a key control and enforcement point. Convergence between Identity & Security Platformization is needed in Identity Security: hundreds of vendors across multiple domains The rise of Machine Identities and AI Agents will drive an inflection in the Identity Security market Category leader in Identity Security & Privileged Access Security-first approach to Identity since Day 1 Customers are looking for a comprehensive platform; Identity Security advances our breadth Common platform vision for Identity Security
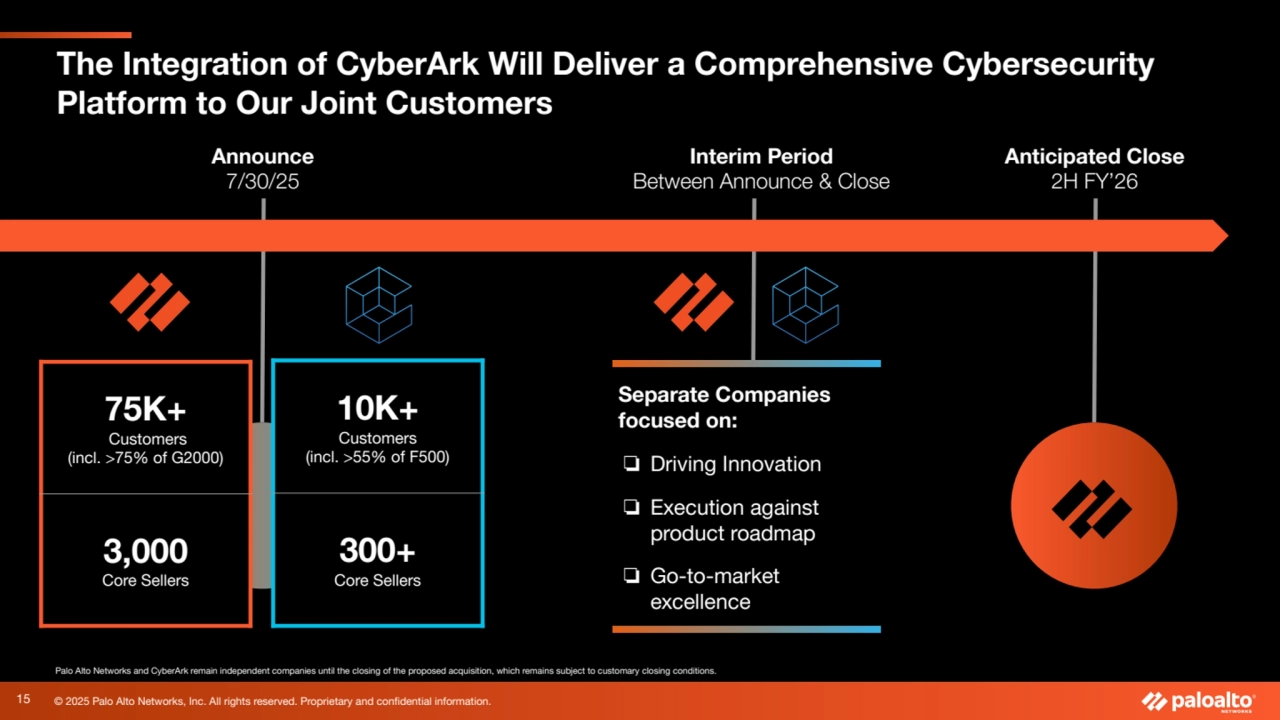
- 15. © 2025 Palo Alto Networks, Inc. All rights reserved. Proprietary and confidential information. The Integration of CyberArk Will Deliver a Comprehensive Cybersecurity Platform to Our Joint Customers 10K+ Customers (incl. >55% of F500) 300+ Core Sellers 15 Palo Alto Networks and CyberArk remain independent companies until the closing of the proposed acquisition, which remains subject to customary closing conditions. Announce 7/30/25 Anticipated Close 2H FY’26 Interim Period Between Announce & Close Separate Companies focused on: ❏ Driving Innovation ❏ Execution against product roadmap ❏ Go-to-market excellence 75K+ Customers (incl. >75% of G2000) 3,000 Core Sellers
- 16. © 2025 Palo Alto Networks, Inc. All rights reserved. Proprietary and confidential information.
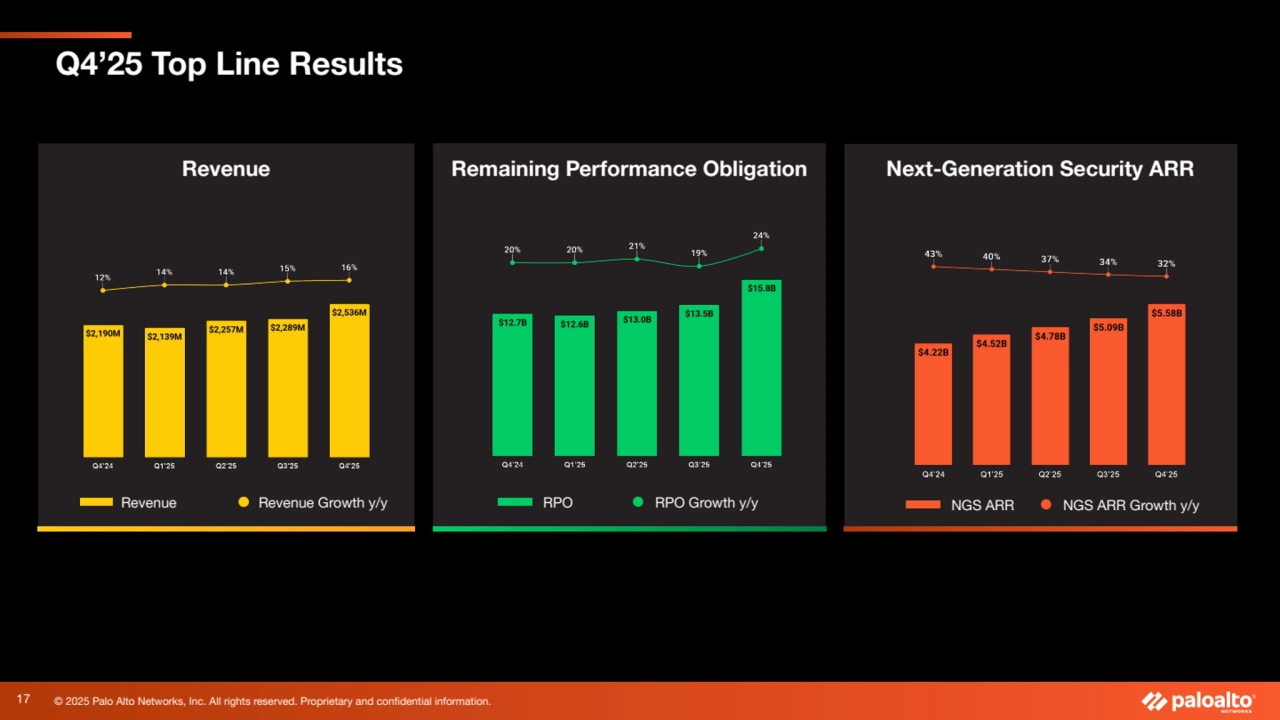
- 17. © 2025 Palo Alto Networks, Inc. All rights reserved. Proprietary and confidential information. Remaining Performance Obligation Next-Generation Security ARR Q4’25 Top Line Results RPO RPO Growth y/y NGS ARR NGS ARR Growth y/y Revenue Revenue Revenue Growth y/y 17
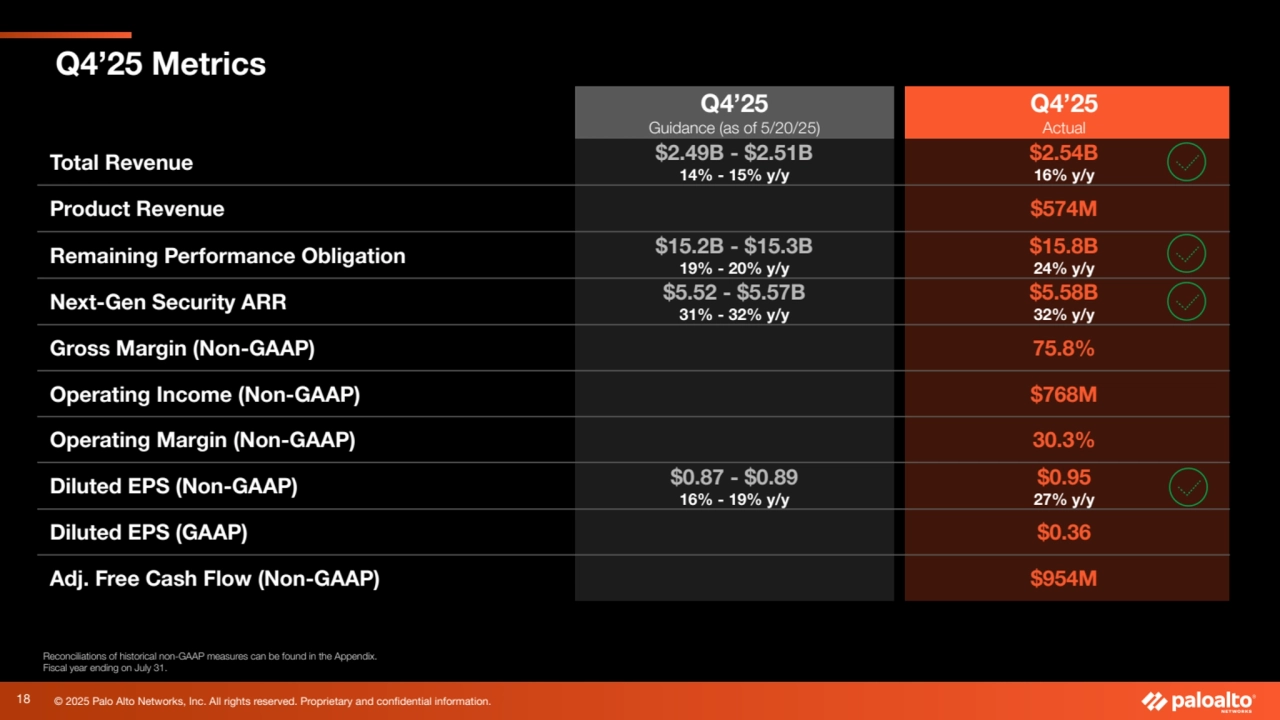
- 18. © 2025 Palo Alto Networks, Inc. All rights reserved. Proprietary and confidential information. Q4’25 Metrics Q4’25 Guidance (as of 5/20/25) Q4’25 Actual Total Revenue $2.49B - $2.51B 14% - 15% y/y $2.54B 16% y/y Product Revenue $574M Remaining Performance Obligation $15.2B - $15.3B 19% - 20% y/y $15.8B 24% y/y Next-Gen Security ARR $5.52 - $5.57B 31% - 32% y/y $5.58B 32% y/y Gross Margin (Non-GAAP) 75.8% Operating Income (Non-GAAP) $768M Operating Margin (Non-GAAP) 30.3% Diluted EPS (Non-GAAP) $0.87 - $0.89 16% - 19% y/y $0.95 27% y/y Diluted EPS (GAAP) $0.36 Adj. Free Cash Flow (Non-GAAP) $954M Reconciliations of historical non-GAAP measures can be found in the Appendix. Fiscal year ending on July 31. 18
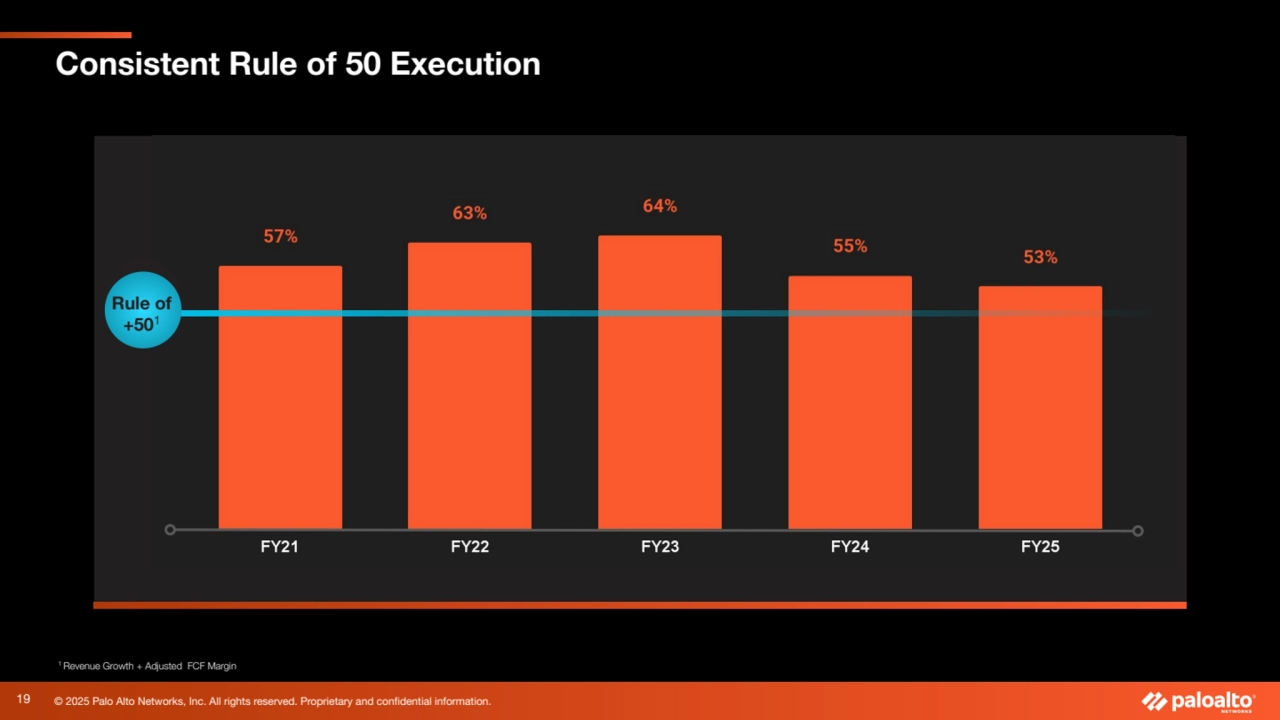
- 19. © 2025 Palo Alto Networks, Inc. All rights reserved. Proprietary and confidential information. Consistent Rule of 50 Execution 19 Rule of Rule of +50 +501 1 Revenue Growth + Adjusted FCF Margin
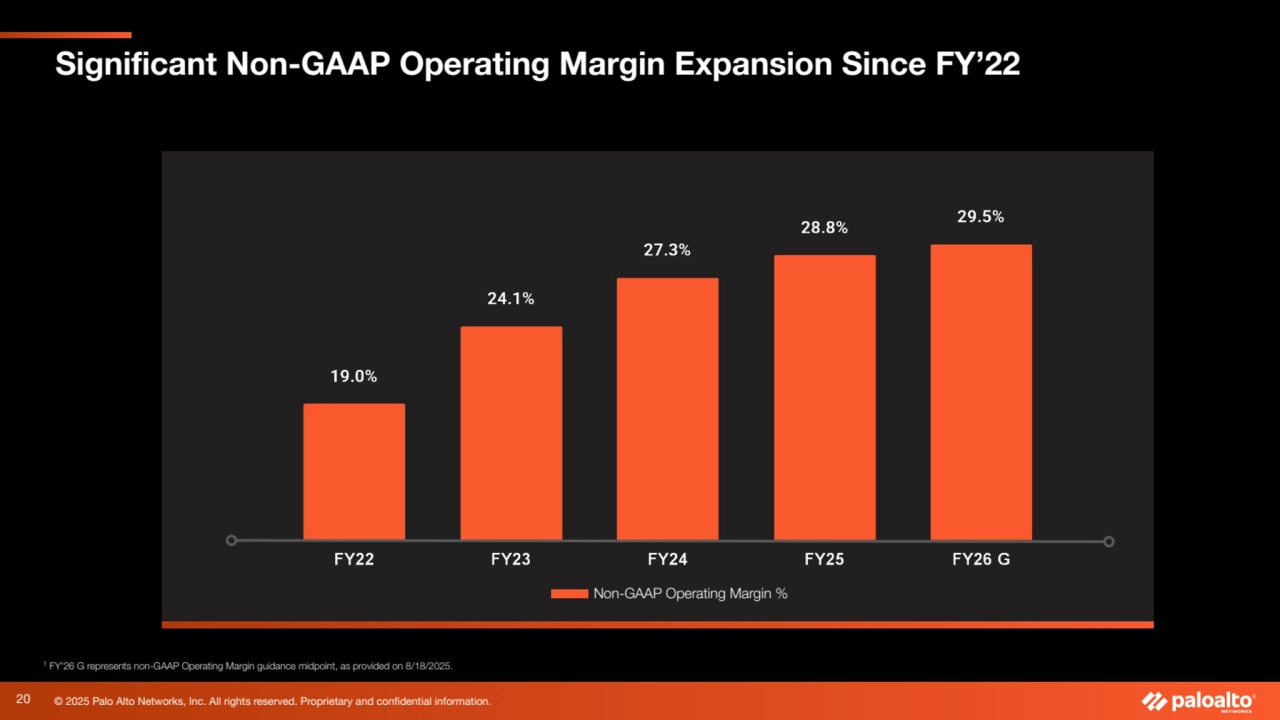
- 20. © 2025 Palo Alto Networks, Inc. All rights reserved. Proprietary and confidential information. Significant Non-GAAP Operating Margin Expansion Since FY’22 20 Non-GAAP Operating Margin % 1 FY’26 G represents non-GAAP Operating Margin guidance midpoint, as provided on 8/18/2025.
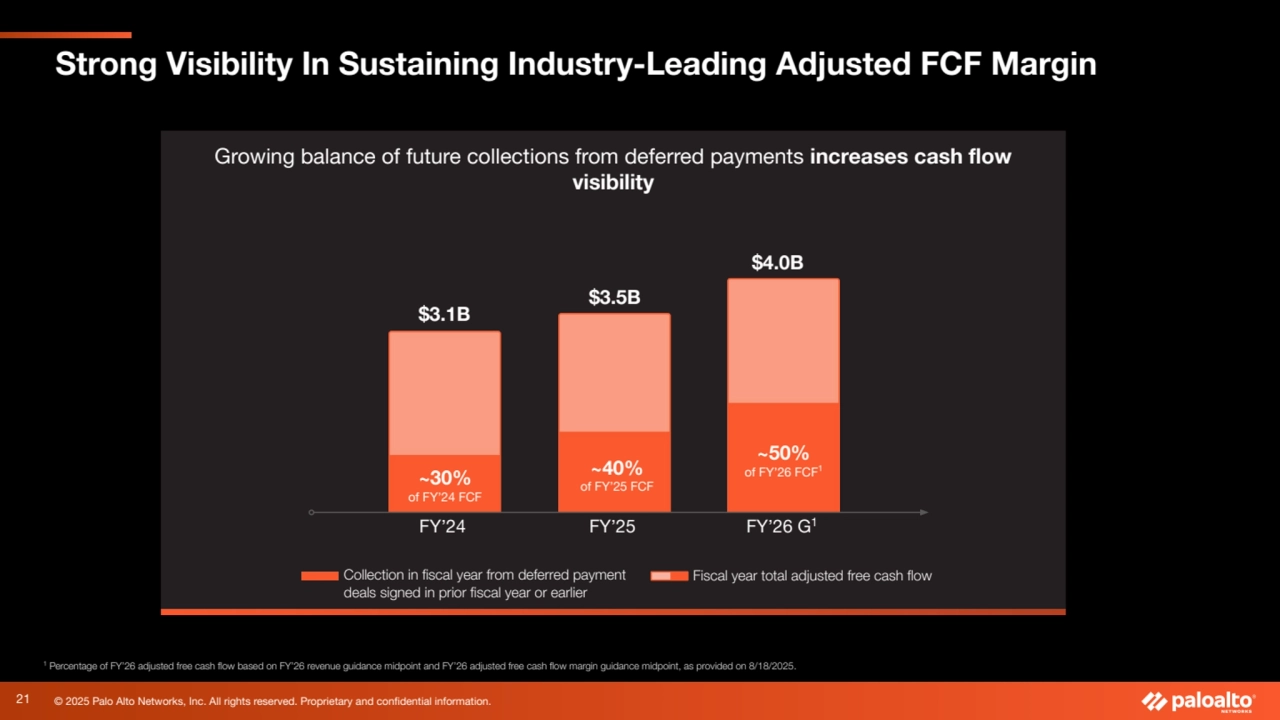
- 21. © 2025 Palo Alto Networks, Inc. All rights reserved. Proprietary and confidential information. Strong Visibility In Sustaining Industry-Leading Adjusted FCF Margin 21 Growing balance of future collections from deferred payments increases cash flow visibility 1 Percentage of FY’26 adjusted free cash flow based on FY’26 revenue guidance midpoint and FY’26 adjusted free cash flow margin guidance midpoint, as provided on 8/18/2025. FY’24 FY’25 FY’26 G1 Collection in fiscal year from deferred payment deals signed in prior fiscal year or earlier ~40% of FY’25 FCF ~30% of FY’24 FCF $3.1B $3.5B Fiscal year total adjusted free cash flow ~50% of FY’26 FCF1 $4.0B
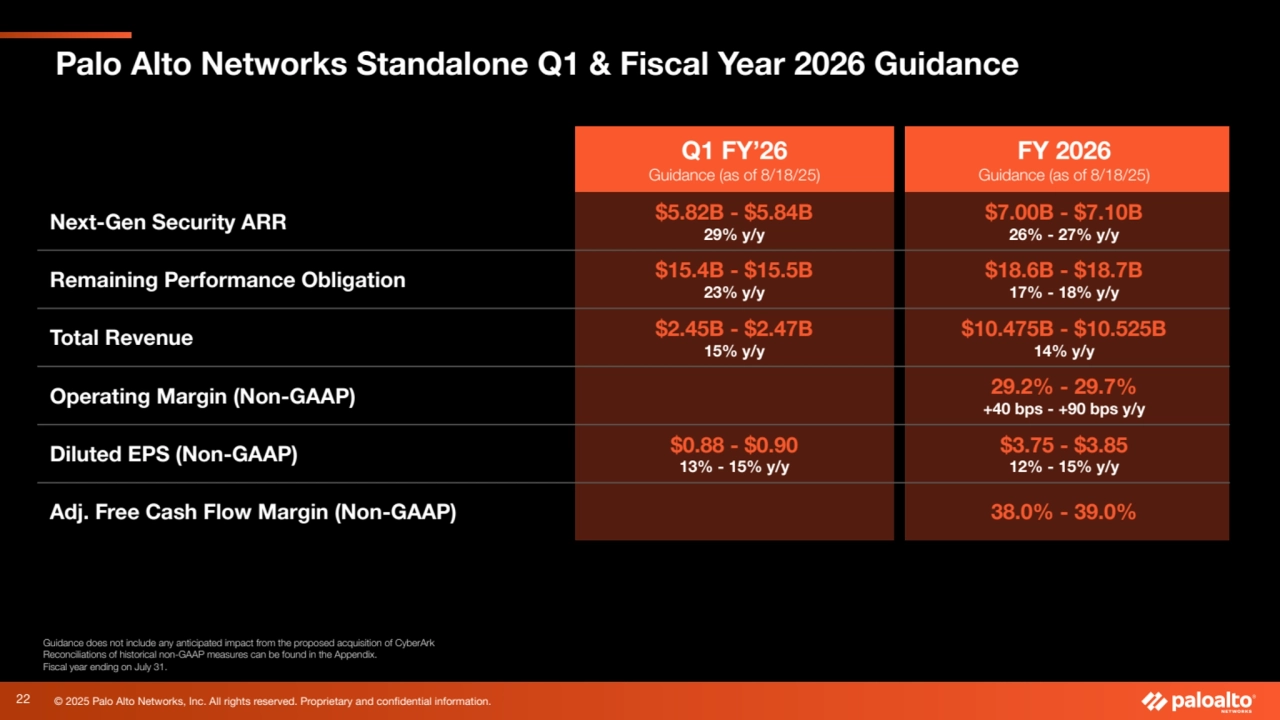
- 22. © 2025 Palo Alto Networks, Inc. All rights reserved. Proprietary and confidential information. Palo Alto Networks Standalone Q1 & Fiscal Year 2026 Guidance Q1 FY’26 Guidance (as of 8/18/25) FY 2026 Guidance (as of 8/18/25) Next-Gen Security ARR $5.82B - $5.84B 29% y/y $7.00B - $7.10B 26% - 27% y/y Remaining Performance Obligation $15.4B - $15.5B 23% y/y $18.6B - $18.7B 17% - 18% y/y Total Revenue $2.45B - $2.47B 15% y/y $10.475B - $10.525B 14% y/y Operating Margin (Non-GAAP) 29.2% - 29.7% +40 bps - +90 bps y/y Diluted EPS (Non-GAAP) $0.88 - $0.90 13% - 15% y/y $3.75 - $3.85 12% - 15% y/y Adj. Free Cash Flow Margin (Non-GAAP) 38.0% - 39.0% Guidance does not include any anticipated impact from the proposed acquisition of CyberArk Reconciliations of historical non-GAAP measures can be found in the Appendix. Fiscal year ending on July 31. 22
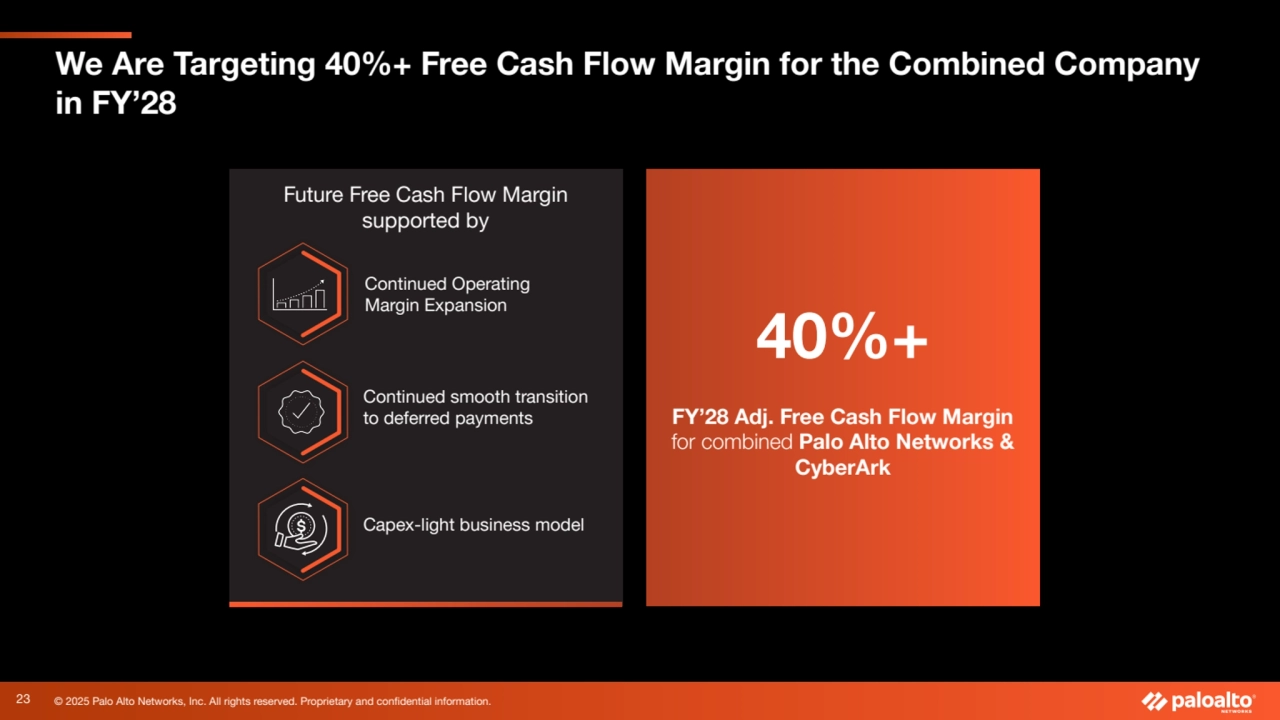
- 23. © 2025 Palo Alto Networks, Inc. All rights reserved. Proprietary and confidential information. We Are Targeting 40%+ Free Cash Flow Margin for the Combined Company in FY’28 23 Future Free Cash Flow Margin supported by Continued smooth transition to deferred payments Continued Operating Margin Expansion Capex-light business model 40%+ FY’28 Adj. Free Cash Flow Margin for combined Palo Alto Networks & CyberArk
- 24. © 2025 Palo Alto Networks, Inc. All rights reserved. Proprietary and confidential information. Appendix
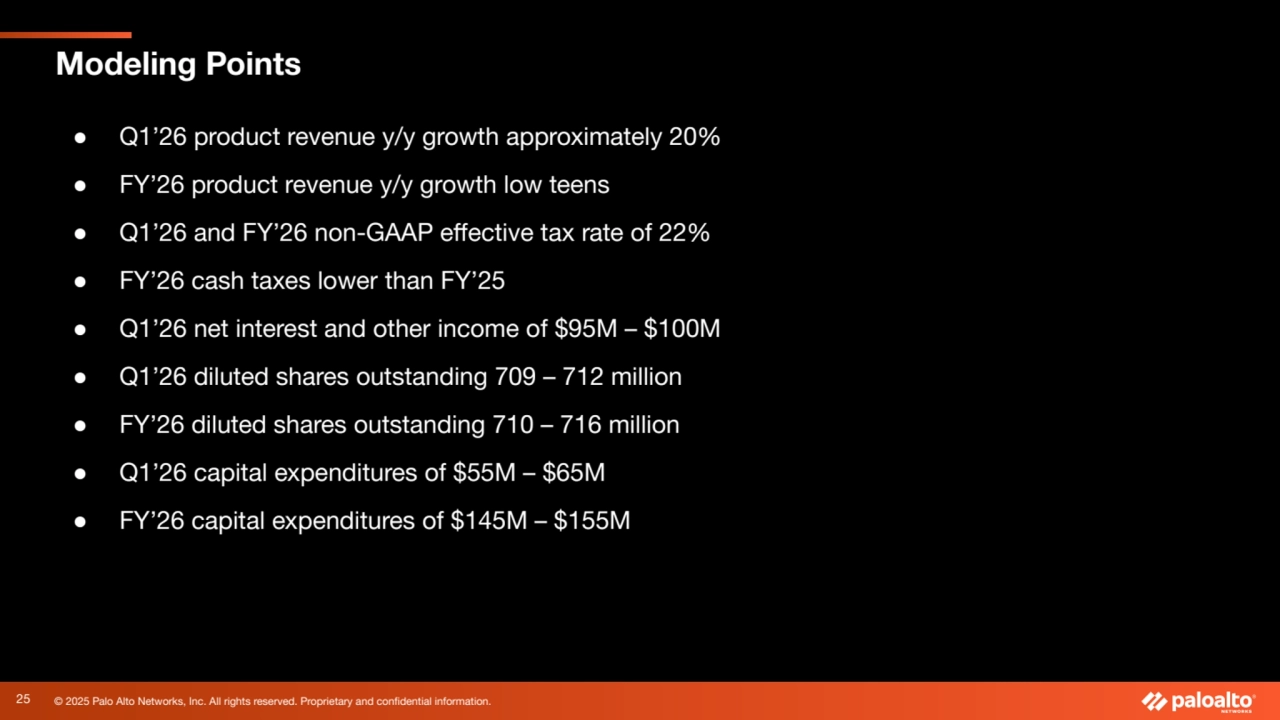
- 25. © 2025 Palo Alto Networks, Inc. All rights reserved. Proprietary and confidential information. Modeling Points ● Q1’26 product revenue y/y growth approximately 20% ● FY’26 product revenue y/y growth low teens ● Q1’26 and FY’26 non-GAAP effective tax rate of 22% ● FY’26 cash taxes lower than FY’25 ● Q1’26 net interest and other income of $95M – $100M ● Q1’26 diluted shares outstanding 709 – 712 million ● FY’26 diluted shares outstanding 710 – 716 million ● Q1’26 capital expenditures of $55M – $65M ● FY’26 capital expenditures of $145M – $155M 25
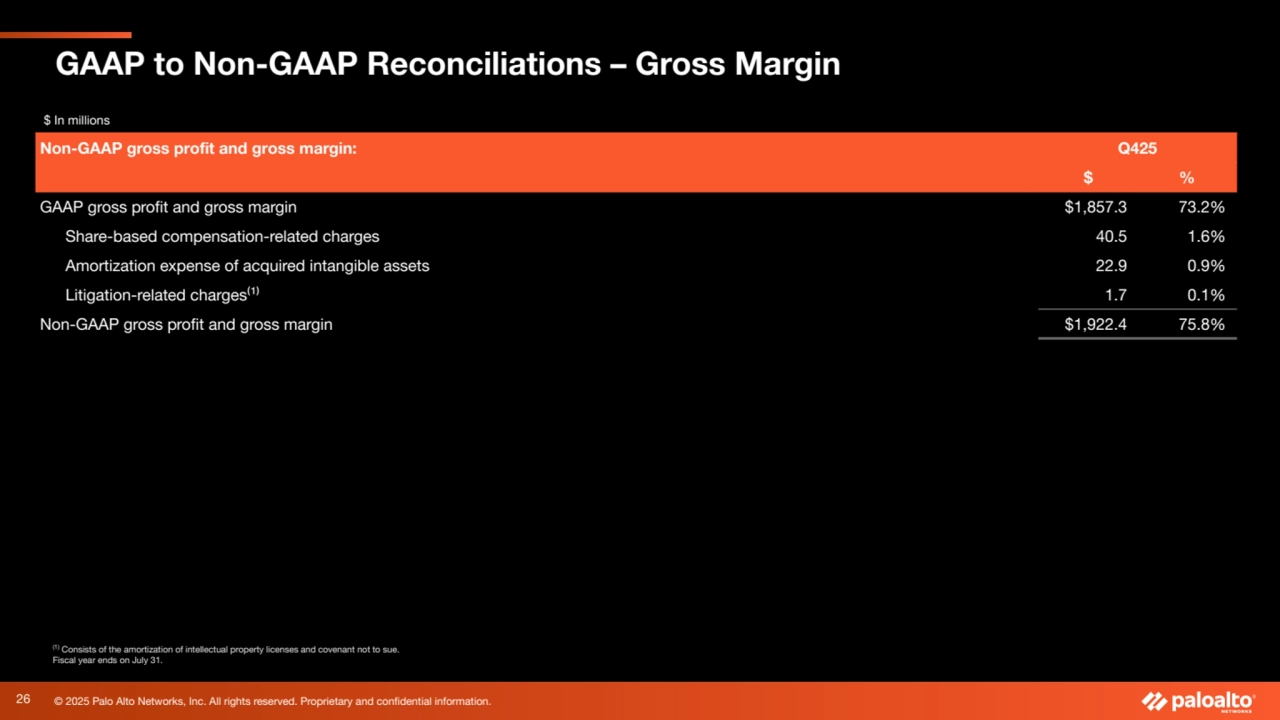
- 26. © 2025 Palo Alto Networks, Inc. All rights reserved. Proprietary and confidential information. GAAP to Non-GAAP Reconciliations – Gross Margin (1) Consists of the amortization of intellectual property licenses and covenant not to sue. Fiscal year ends on July 31. $ In millions Non-GAAP gross profit and gross margin: Q425 $ % GAAP gross profit and gross margin $1,857.3 73.2% Share-based compensation-related charges 40.5 1.6% Amortization expense of acquired intangible assets 22.9 0.9% Litigation-related charges⁽¹⁾ 1.7 0.1% Non-GAAP gross profit and gross margin $1,922.4 75.8% 26
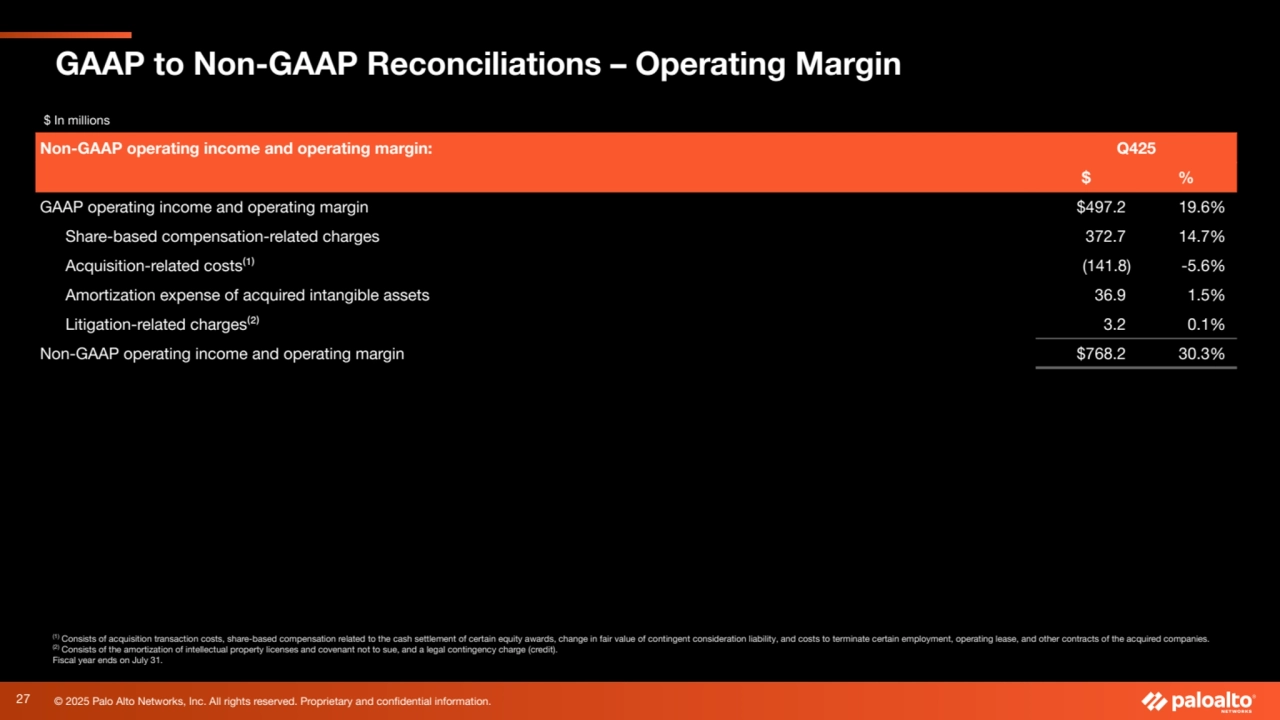
- 27. © 2025 Palo Alto Networks, Inc. All rights reserved. Proprietary and confidential information. (1) Consists of acquisition transaction costs, share-based compensation related to the cash settlement of certain equity awards, change in fair value of contingent consideration liability, and costs to terminate certain employment, operating lease, and other contracts of the acquired companies. (2) Consists of the amortization of intellectual property licenses and covenant not to sue, and a legal contingency charge (credit). Fiscal year ends on July 31. $ In millions Non-GAAP operating income and operating margin: Q425 $ % GAAP operating income and operating margin $497.2 19.6% Share-based compensation-related charges 372.7 14.7% Acquisition-related costs⁽¹⁾ (141.8) -5.6% Amortization expense of acquired intangible assets 36.9 1.5% Litigation-related charges⁽²⁾ 3.2 0.1% Non-GAAP operating income and operating margin $768.2 30.3% GAAP to Non-GAAP Reconciliations – Operating Margin 27
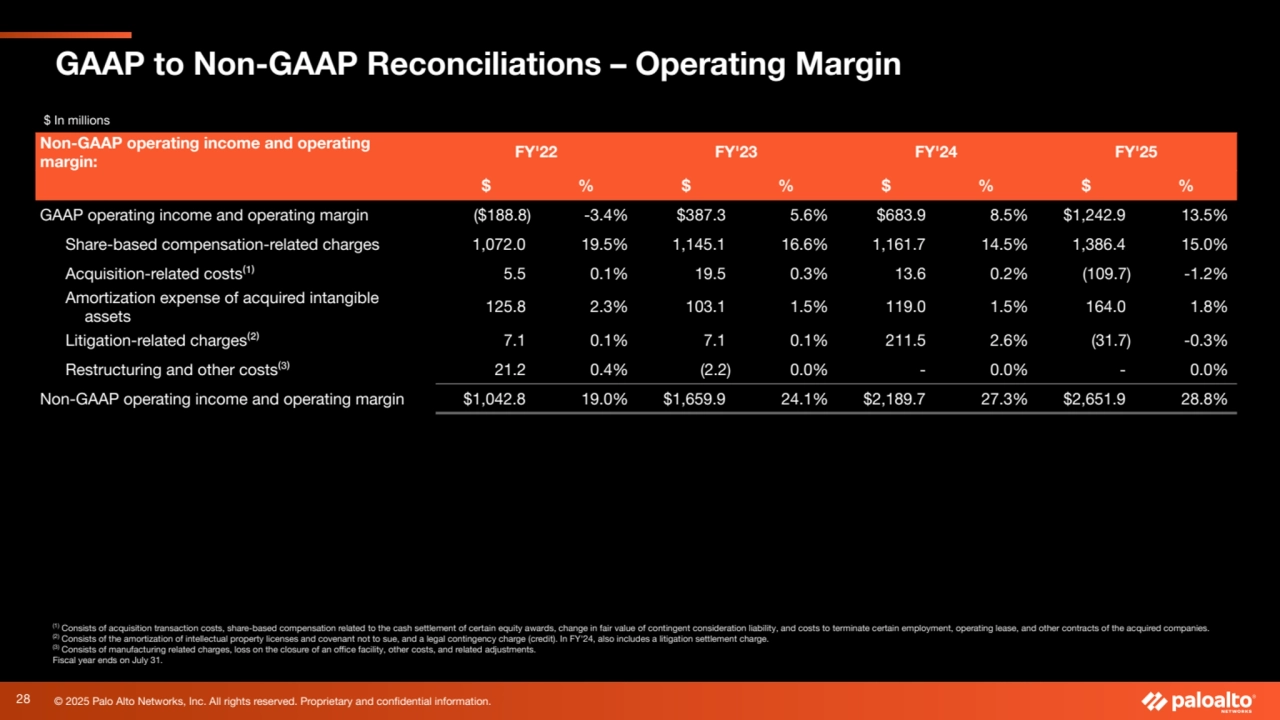
- 28. © 2025 Palo Alto Networks, Inc. All rights reserved. Proprietary and confidential information. (1) Consists of acquisition transaction costs, share-based compensation related to the cash settlement of certain equity awards, change in fair value of contingent consideration liability, and costs to terminate certain employment, operating lease, and other contracts of the acquired companies. (2) Consists of the amortization of intellectual property licenses and covenant not to sue, and a legal contingency charge (credit). In FY'24, also includes a litigation settlement charge. (3) Consists of manufacturing related charges, loss on the closure of an office facility, other costs, and related adjustments. Fiscal year ends on July 31. $ In millions GAAP to Non-GAAP Reconciliations – Operating Margin Non-GAAP operating income and operating margin: FY'22 FY'23 FY'24 FY'25 $ % $ % $ % $ % GAAP operating income and operating margin ($188.8) -3.4% $387.3 5.6% $683.9 8.5% $1,242.9 13.5% Share-based compensation-related charges 1,072.0 19.5% 1,145.1 16.6% 1,161.7 14.5% 1,386.4 15.0% Acquisition-related costs⁽¹⁾ 5.5 0.1% 19.5 0.3% 13.6 0.2% (109.7) -1.2% Amortization expense of acquired intangible assets 125.8 2.3% 103.1 1.5% 119.0 1.5% 164.0 1.8% Litigation-related charges⁽²⁾ 7.1 0.1% 7.1 0.1% 211.5 2.6% (31.7) -0.3% Restructuring and other costs⁽³⁾ 21.2 0.4% (2.2) 0.0% - 0.0% - 0.0% Non-GAAP operating income and operating margin $1,042.8 19.0% $1,659.9 24.1% $2,189.7 27.3% $2,651.9 28.8% 28
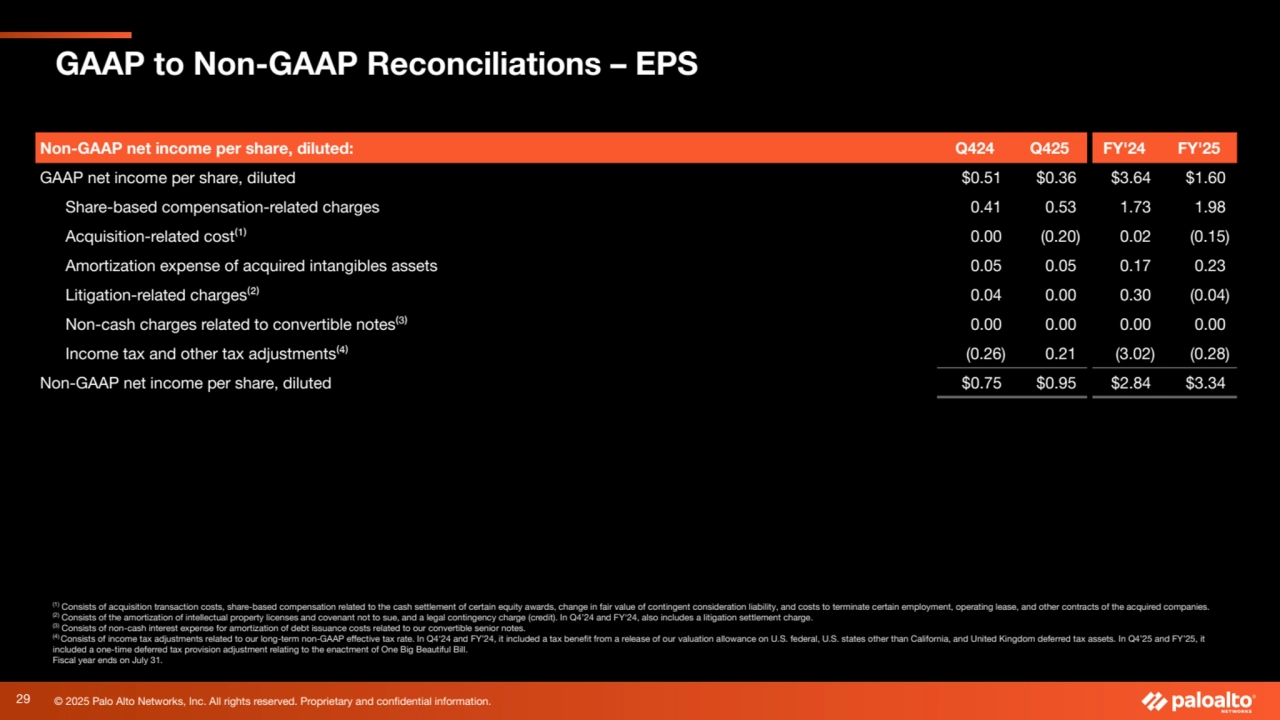
- 29. © 2025 Palo Alto Networks, Inc. All rights reserved. Proprietary and confidential information. GAAP to Non-GAAP Reconciliations – EPS (1) Consists of acquisition transaction costs, share-based compensation related to the cash settlement of certain equity awards, change in fair value of contingent consideration liability, and costs to terminate certain employment, operating lease, and other contracts of the acquired companies. (2) Consists of the amortization of intellectual property licenses and covenant not to sue, and a legal contingency charge (credit). In Q4’24 and FY'24, also includes a litigation settlement charge. (3) Consists of non-cash interest expense for amortization of debt issuance costs related to our convertible senior notes. (4) Consists of income tax adjustments related to our long-term non-GAAP effective tax rate. In Q4'24 and FY’24, it included a tax benefit from a release of our valuation allowance on U.S. federal, U.S. states other than California, and United Kingdom deferred tax assets. In Q4’25 and FY’25, it included a one-time deferred tax provision adjustment relating to the enactment of One Big Beautiful Bill. Fiscal year ends on July 31. Non-GAAP net income per share, diluted: Q424 Q425 FY'24 FY'25 GAAP net income per share, diluted $0.51 $0.36 $3.64 $1.60 Share-based compensation-related charges 0.41 0.53 1.73 1.98 Acquisition-related cost⁽¹⁾ 0.00 (0.20) 0.02 (0.15) Amortization expense of acquired intangibles assets 0.05 0.05 0.17 0.23 Litigation-related charges⁽²⁾ 0.04 0.00 0.30 (0.04) Non-cash charges related to convertible notes⁽³⁾ 0.00 0.00 0.00 0.00 Income tax and other tax adjustments⁽⁴⁾ (0.26) 0.21 (3.02) (0.28) Non-GAAP net income per share, diluted $0.75 $0.95 $2.84 $3.34 29
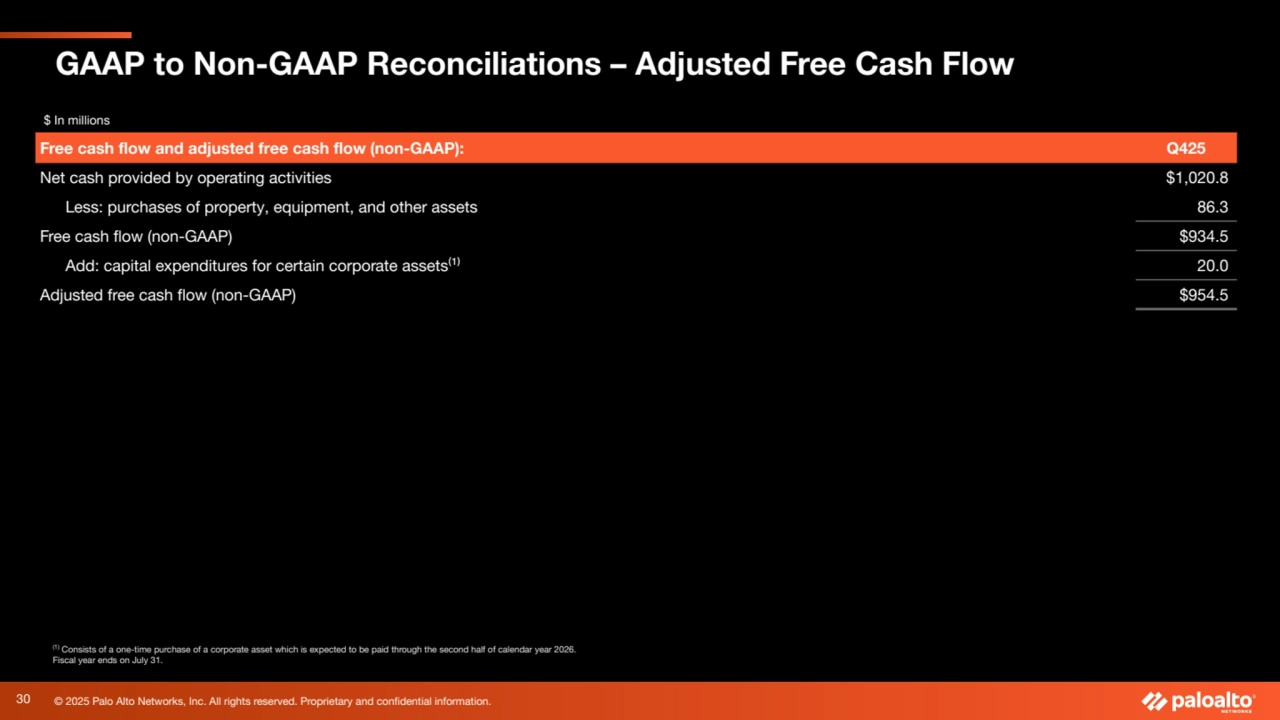
- 30. © 2025 Palo Alto Networks, Inc. All rights reserved. Proprietary and confidential information. (1) Consists of a one-time purchase of a corporate asset which is expected to be paid through the second half of calendar year 2026. Fiscal year ends on July 31. GAAP to Non-GAAP Reconciliations – Adjusted Free Cash Flow $ In millions Free cash flow and adjusted free cash flow (non-GAAP): Q425 Net cash provided by operating activities $1,020.8 Less: purchases of property, equipment, and other assets 86.3 Free cash flow (non-GAAP) $934.5 Add: capital expenditures for certain corporate assets⁽¹⁾ 20.0 Adjusted free cash flow (non-GAAP) $954.5 30
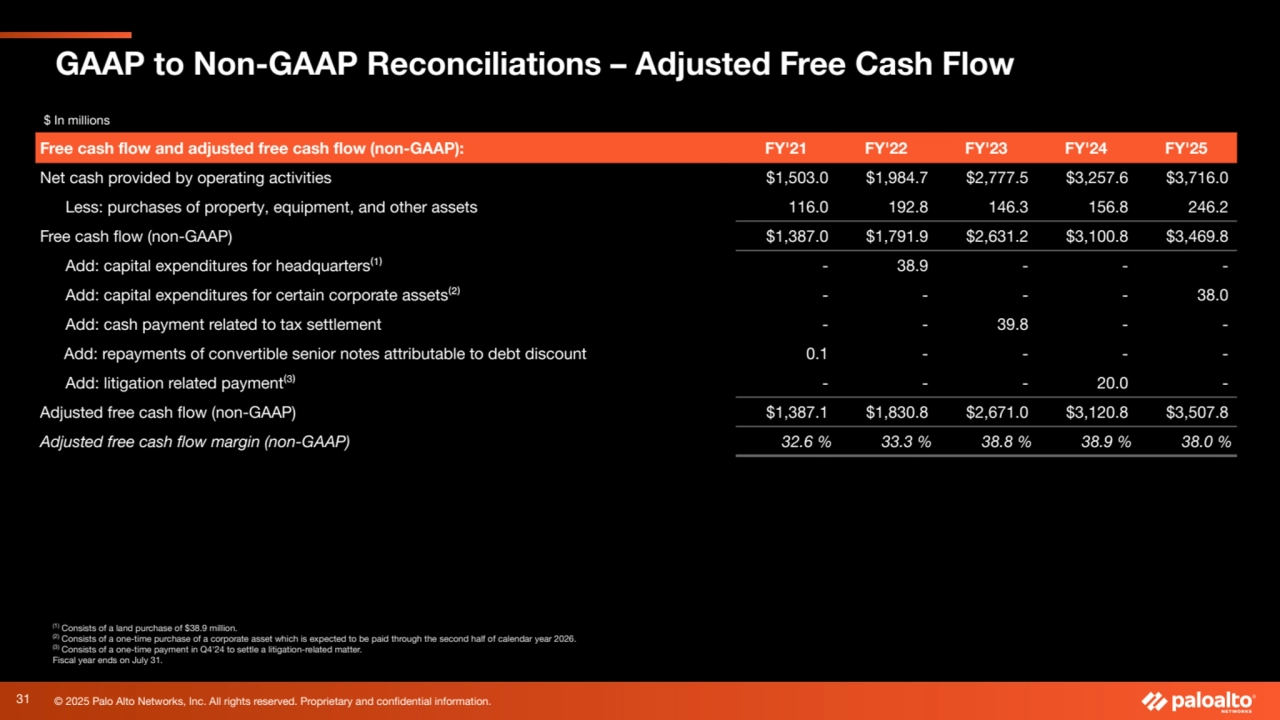
- 31. © 2025 Palo Alto Networks, Inc. All rights reserved. Proprietary and confidential information. (1) Consists of a land purchase of $38.9 million. (2) Consists of a one-time purchase of a corporate asset which is expected to be paid through the second half of calendar year 2026. (3) Consists of a one-time payment in Q4'24 to settle a litigation-related matter. Fiscal year ends on July 31. GAAP to Non-GAAP Reconciliations – Adjusted Free Cash Flow $ In millions Free cash flow and adjusted free cash flow (non-GAAP): FY'21 FY'22 FY'23 FY'24 FY'25 Net cash provided by operating activities $1,503.0 $1,984.7 $2,777.5 $3,257.6 $3,716.0 Less: purchases of property, equipment, and other assets 116.0 192.8 146.3 156.8 246.2 Free cash flow (non-GAAP) $1,387.0 $1,791.9 $2,631.2 $3,100.8 $3,469.8 Add: capital expenditures for headquarters⁽¹⁾ - 38.9 - - - Add: capital expenditures for certain corporate assets⁽²⁾ - - - - 38.0 Add: cash payment related to tax settlement - - 39.8 - - Add: repayments of convertible senior notes attributable to debt discount 0.1 - - - - Add: litigation related payment⁽³⁾ - - - 20.0 - Adjusted free cash flow (non-GAAP) $1,387.1 $1,830.8 $2,671.0 $3,120.8 $3,507.8 Adjusted free cash flow margin (non-GAAP) 32.6 % 33.3 % 38.8 % 38.9 % 38.0 % 31
- 32. © 2025 Palo Alto Networks, Inc. All rights reserved. Proprietary and confidential information. Thank You paloaltonetworks.com 32