Pinterest Q2 2025 Earnings Report
 AI Summary
Key Insights
- 📈 Revenue Growth: The document highlights a 17% year-over-year increase in global revenue for Q2 2025.
- 🌎 Global User Growth: There is an 11% increase in global monthly active users (MAUs) year-over-year.
- 💰 ARPU Improvement: The average revenue per user (ARPU) increased globally by 6% year-over-year.
- 📊 Non-GAAP Metrics: Presents detailed non-GAAP financial measures, including adjusted EBITDA and related reconciliations.
- 🔄 Free Cash Flow: Mentions a free cash flow conversion rate, indicating the efficiency of converting earnings into cash.


Pinterest Q2 2025 Earnings Report
- 1. © 2025 Pinterest. All rights reserved. Q2 2025 Earnings Report
- 2. Non-GAAP Financial Measures Limitation of Key Metrics and Other Data 2 To supplement our condensed consolidated financial statements, which are prepared and presented in accordance with generally accepted accounting principles in the United States ("GAAP"), we use the following non-GAAP financial measures: Adjusted EBITDA, Adjusted EBITDA margin, non-GAAP costs and expenses (including non-GAAP cost of revenue, research and development, sales and marketing, and general and administrative), non-GAAP income (loss) from operations, non-GAAP net income (loss), non-GAAP net income (loss) per share, constant currency revenue, non-GAAP operating expense, and free cash flow. The presentation of these financial measures is not intended to be considered in isolation, as a substitute for or superior to the financial information prepared and presented in accordance with GAAP. Investors are cautioned that there are material limitations associated with the use of non-GAAP financial measures as an analytical tool. In addition, these measures may be different from non-GAAP financial measures used by other companies, limiting their usefulness for comparative purposes. We compensate for these limitations by providing specific information regarding GAAP amounts excluded from these non-GAAP financial measures. For a reconciliation of these non-GAAP financial measures to the most directly comparable GAAP financial measures, please see the Appendix. The numbers for our key metrics, which include our monthly active users (MAUs) and average revenue per user (ARPU), are calculated using internal company data based on the activity of user accounts. We define an MAU as an authenticated Pinterest user who visits our website, opens our mobile application or interacts with Pinterest through one of our browser or site extensions, such as the Save button, at least once during the 30-day period ending on the date of measurement. The number of MAUs does not include Shuffles users unless they would otherwise qualify as MAUs. Unless otherwise indicated, we present MAUs based on the number of MAUs measured on the last day of the current period. We measure monetization of our platform through our ARPU metric. We define ARPU as our total revenue in a given geography during a period divided by the average of the number of MAUs in that geography during the period. We calculate average MAUs based on the average of the number of MAUs measured on the last day of the current period and the last day prior to the beginning of the current period. We calculate ARPU by geography based on our estimate of the geography in which revenue-generating activities occur. We use these metrics to assess the growth and health of the overall business and believe that MAUs and ARPU best reflect our ability to attract, retain, engage and monetize our users, and thereby drive revenue. While these numbers are based on what we believe to be reasonable estimates of our user base for the applicable period of measurement, there are inherent challenges in measuring usage of our products across large online and mobile populations around the world. In addition, we are continually seeking to improve our estimates of our user base, and such estimates may change due to improvements or changes in technology or our methodology. All information provided in this presentation is as of August 7th, 2025. We undertake no duty to update this information unless required by law. All information provided in this presentation is unaudited. © 2025 Pinterest. All rights reserved.
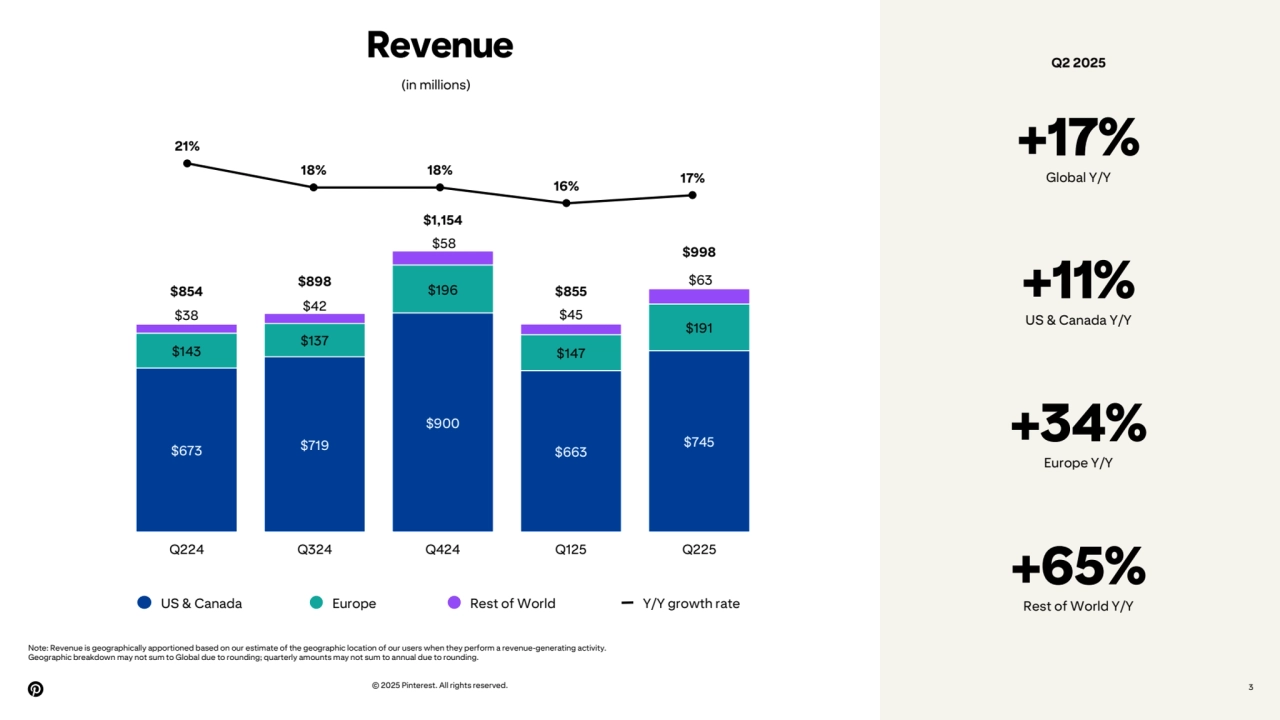
- 3. © 2025 Pinterest. All rights reserved. 3 Revenue +17% Global Y/Y +11% US & Canada Y/Y +34% Europe Y/Y +65% Rest of World Y/Y (in millions) 21% 18% 18% 16% 17% US & Canada Europe Rest of World Y/Y growth rate Note: Revenue is geographically apportioned based on our estimate of the geographic location of our users when they perform a revenue-generating activity. Geographic breakdown may not sum to Global due to rounding; quarterly amounts may not sum to annual due to rounding. $673 $719 $900 $663 $745 $143 $137 $196 $147 $191 $38 $42 $58 $45 $63 $854 $898 $1,154 $855 $998 Q224 Q324 Q424 Q125 Q225 Q2 2025
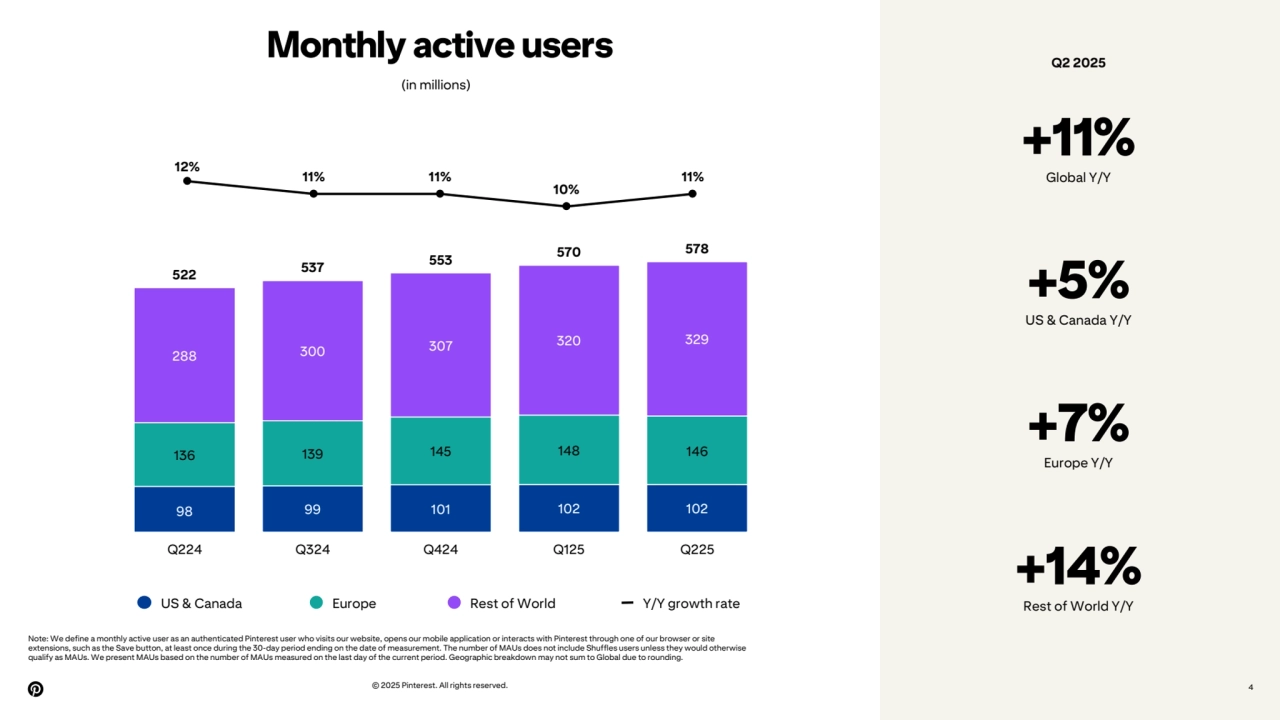
- 4. © 2025 Pinterest. All rights reserved. 4 Monthly active users (in millions) Note: We define a monthly active user as an authenticated Pinterest user who visits our website, opens our mobile application or interacts with Pinterest through one of our browser or site extensions, such as the Save button, at least once during the 30-day period ending on the date of measurement. The number of MAUs does not include Shuffles users unless they would otherwise qualify as MAUs. We present MAUs based on the number of MAUs measured on the last day of the current period. Geographic breakdown may not sum to Global due to rounding. 12% 11% 11% 10% 11% 98 99 101 102 102 136 139 145 148 146 288 300 307 320 329 522 537 553 570 578 Q224 Q324 Q424 Q125 Q225 US & Canada Europe Rest of World Y/Y growth rate +11% Global Y/Y +5% US & Canada Y/Y +7% Europe Y/Y +14% Rest of World Y/Y Q2 2025
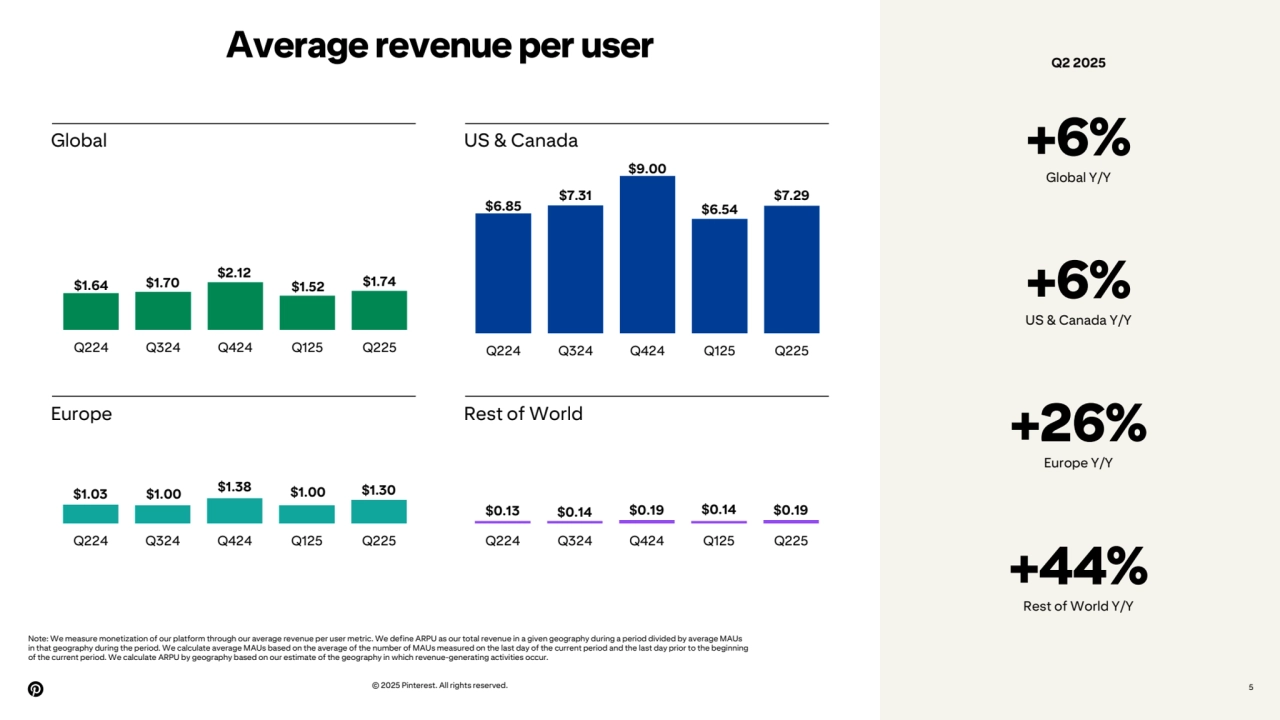
- 5. © 2025 Pinterest. All rights reserved. 5 Average revenue per user Note: We measure monetization of our platform through our average revenue per user metric. We define ARPU as our total revenue in a given geography during a period divided by average MAUs in that geography during the period. We calculate average MAUs based on the average of the number of MAUs measured on the last day of the current period and the last day prior to the beginning of the current period. We calculate ARPU by geography based on our estimate of the geography in which revenue-generating activities occur. +6% Global Y/Y +6% US & Canada Y/Y +26% Europe Y/Y +44% Rest of World Y/Y $1.64 $1.70 $2.12 $1.52 $1.74 Q224 Q324 Q424 Q125 Q225 Global US & Canada Europe Rest of World $6.85 $7.31 $9.00 $6.54 $7.29 Q224 Q324 Q424 Q125 Q225 $0.13 $0.14 $0.19 $0.14 $0.19 Q224 Q324 Q424 Q125 Q225 $1.03 $1.00 $1.38 $1.00 $1.30 Q224 Q324 Q424 Q125 Q225 Q2 2025
- 6. © 2025 Pinterest. All rights reserved. 6 Non-GAAP costs and expenses (in millions) *Comprise Non-GAAP Operating Expenses Note: Costs and expenses are non-GAAP financial measures, which exclude share-based compensation (SBC), amortization of acquired intangible assets, payroll tax expense related to share-based compensation, legal settlement expense, and non-cash charitable contributions. For a reconciliation of these non-GAAP financial measures to the most directly comparable GAAP financial measures, please see the tables included in the Appendix at the end of this release. +10% COR Y/Y +16% R&D Y/Y +17% S&M Y/Y (4%) G&A Y/Y $179 $182 $191 $193 $197 Q224 Q324 Q424 Q125 Q225 21% 20% 17% 23% 20% Cost of Revenue % of revenue $179 $185 $190 $203 $209 Q224 Q324 Q424 Q125 Q225 21% 21% 16% 24% 21% R&D* % of revenue $233 $215 $236 $221 $272 Q224 Q324 Q424 Q125 Q225 S&M* % of revenue $77 $73 $70 $70 $74 Q224 Q324 Q424 Q125 Q225 9% 8% 6% 8% 7% G&A* % of revenue 27% 24% 20% 26% 27% Q2 2025
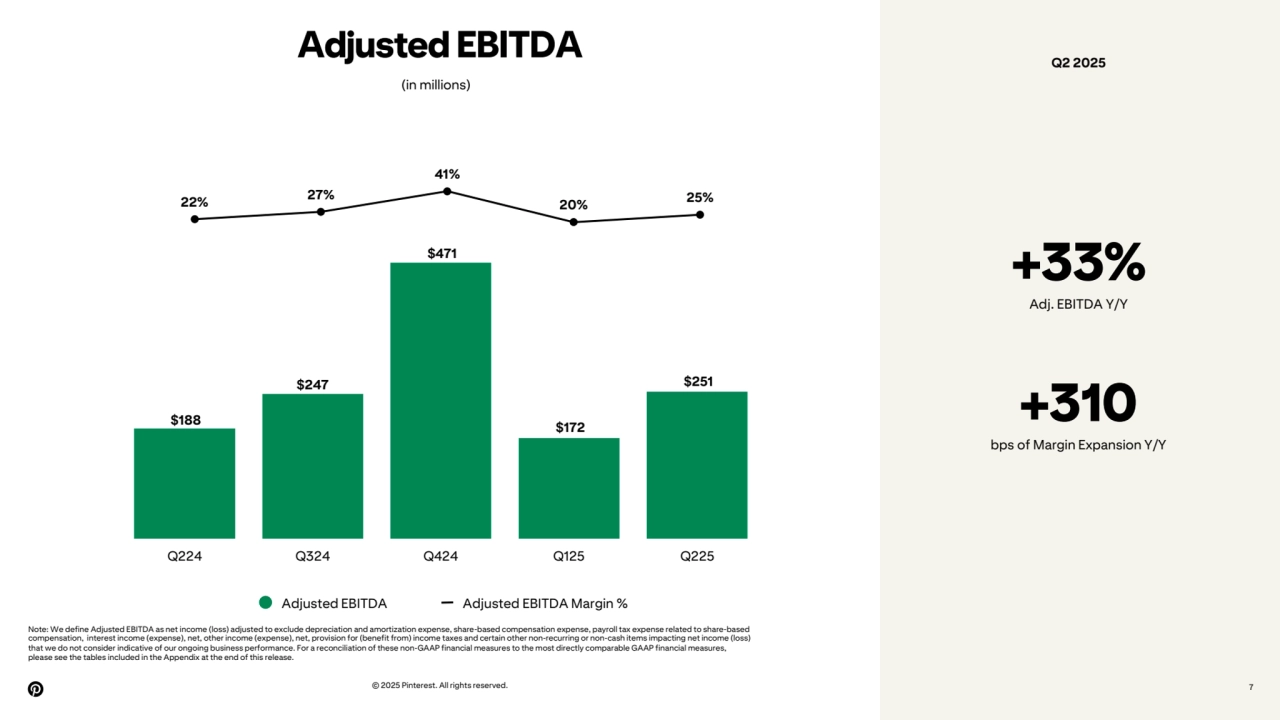
- 7. 22% 27% 41% 20% 25% © 2025 Pinterest. All rights reserved. 7 Adjusted EBITDA (in millions) +33% Adj. EBITDA Y/Y Note: We define Adjusted EBITDA as net income (loss) adjusted to exclude depreciation and amortization expense, share-based compensation expense, payroll tax expense related to share-based compensation, interest income (expense), net, other income (expense), net, provision for (benefit from) income taxes and certain other non-recurring or non-cash items impacting net income (loss) that we do not consider indicative of our ongoing business performance. For a reconciliation of these non-GAAP financial measures to the most directly comparable GAAP financial measures, please see the tables included in the Appendix at the end of this release. $188 $247 $471 $172 $251 Q224 Q324 Q424 Q125 Q225 Adjusted EBITDA Adjusted EBITDA Margin % +310 bps of Margin Expansion Y/Y Q2 2025
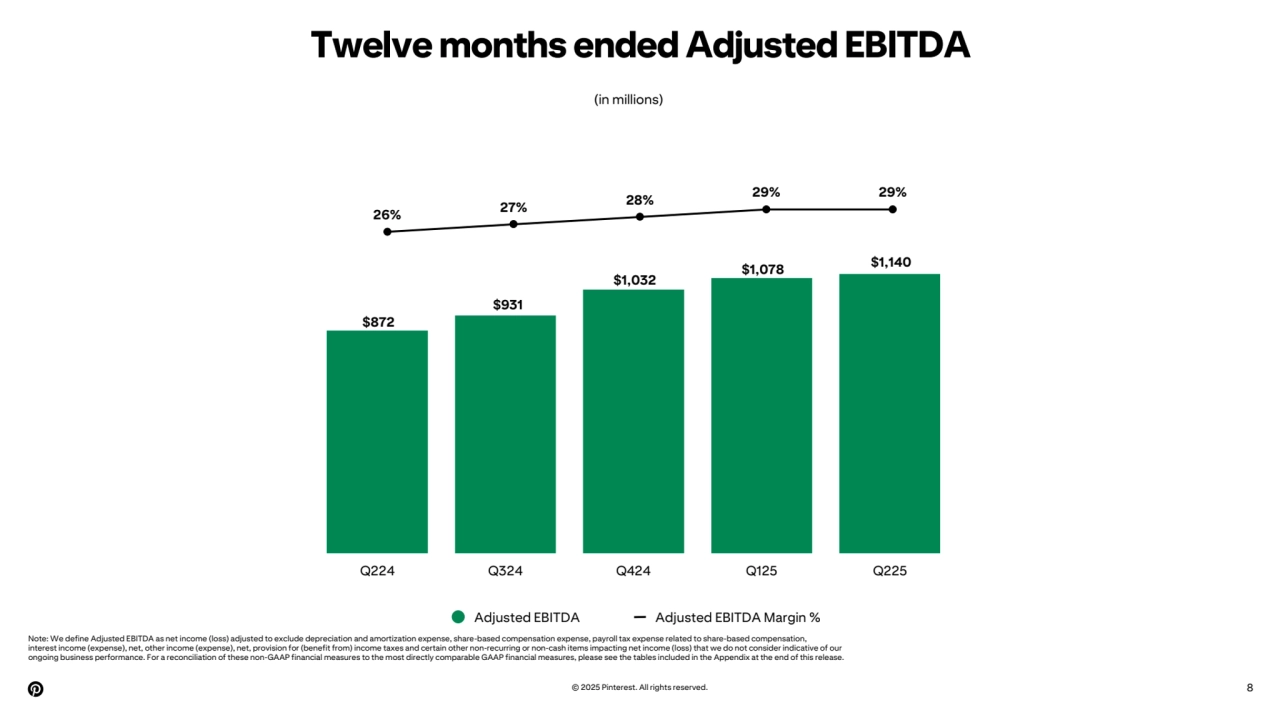
- 8. 26% 27% 28% 29% 29% Twelve months ended Adjusted EBITDA © 2025 Pinterest. All rights reserved. 8 (in millions) $872 $931 $1,032 $1,078 $1,140 Q224 Q324 Q424 Q125 Q225 Adjusted EBITDA Adjusted EBITDA Margin % Note: We define Adjusted EBITDA as net income (loss) adjusted to exclude depreciation and amortization expense, share-based compensation expense, payroll tax expense related to share-based compensation, interest income (expense), net, other income (expense), net, provision for (benefit from) income taxes and certain other non-recurring or non-cash items impacting net income (loss) that we do not consider indicative of our ongoing business performance. For a reconciliation of these non-GAAP financial measures to the most directly comparable GAAP financial measures, please see the tables included in the Appendix at the end of this release.
- 9. Appendix © 2025 Pinterest. All rights reserved.
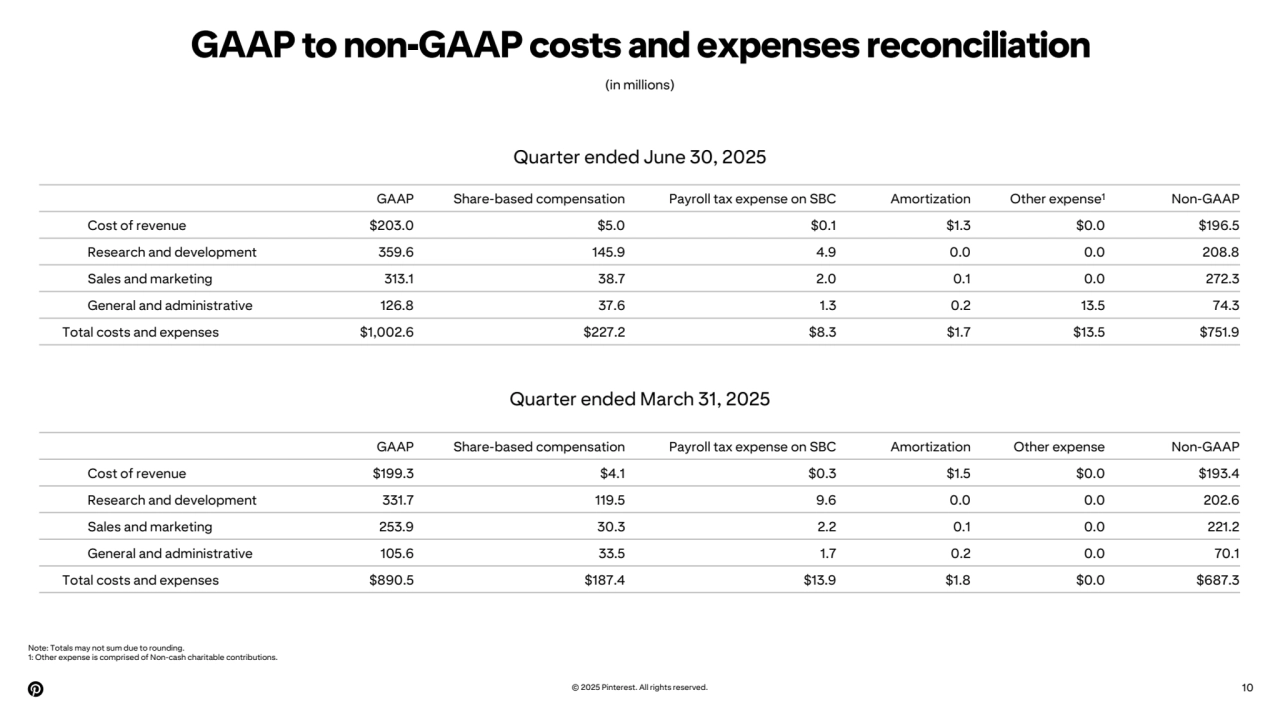
- 10. GAAP to non-GAAP costs and expenses reconciliation © 2025 Pinterest. All rights reserved. 10 (in millions) Note: Totals may not sum due to rounding. 1: Other expense is comprised of Non-cash charitable contributions. Quarter ended March 31, 2025 GAAP Share-based compensation Payroll tax expense on SBC Amortization Other expense1 Non-GAAP Cost of revenue $203.0 $5.0 $0.1 $1.3 $0.0 $196.5 Research and development 359.6 145.9 4.9 0.0 0.0 208.8 Sales and marketing 313.1 38.7 2.0 0.1 0.0 272.3 General and administrative 126.8 37.6 1.3 0.2 13.5 74.3 Total costs and expenses $1,002.6 $227.2 $8.3 $1.7 $13.5 $751.9 GAAP Share-based compensation Payroll tax expense on SBC Amortization Other expense Non-GAAP Cost of revenue $199.3 $4.1 $0.3 $1.5 $0.0 $193.4 Research and development 331.7 119.5 9.6 0.0 0.0 202.6 Sales and marketing 253.9 30.3 2.2 0.1 0.0 221.2 General and administrative 105.6 33.5 1.7 0.2 0.0 70.1 Total costs and expenses $890.5 $187.4 $13.9 $1.8 $0.0 $687.3 Quarter ended June 30, 2025
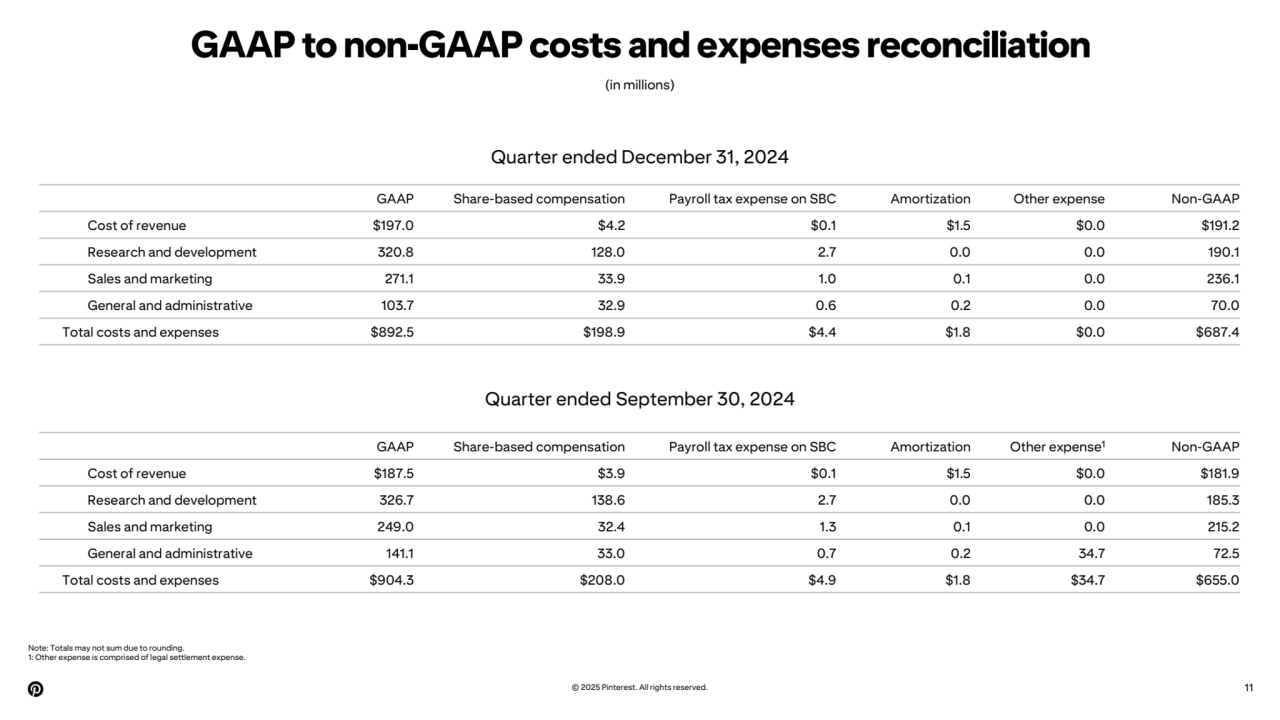
- 11. GAAP to non-GAAP costs and expenses reconciliation Note: Totals may not sum due to rounding. 1: Other expense is comprised of legal settlement expense. © 2025 Pinterest. All rights reserved. 11 (in millions) Quarter ended September 30, 2024 GAAP Share-based compensation Payroll tax expense on SBC Amortization Other expense Non-GAAP Cost of revenue $197.0 $4.2 $0.1 $1.5 $0.0 $191.2 Research and development 320.8 128.0 2.7 0.0 0.0 190.1 Sales and marketing 271.1 33.9 1.0 0.1 0.0 236.1 General and administrative 103.7 32.9 0.6 0.2 0.0 70.0 Total costs and expenses $892.5 $198.9 $4.4 $1.8 $0.0 $687.4 GAAP Share-based compensation Payroll tax expense on SBC Amortization Other expense1 Non-GAAP Cost of revenue $187.5 $3.9 $0.1 $1.5 $0.0 $181.9 Research and development 326.7 138.6 2.7 0.0 0.0 185.3 Sales and marketing 249.0 32.4 1.3 0.1 0.0 215.2 General and administrative 141.1 33.0 0.7 0.2 34.7 72.5 Total costs and expenses $904.3 $208.0 $4.9 $1.8 $34.7 $655.0 Quarter ended December 31, 2024
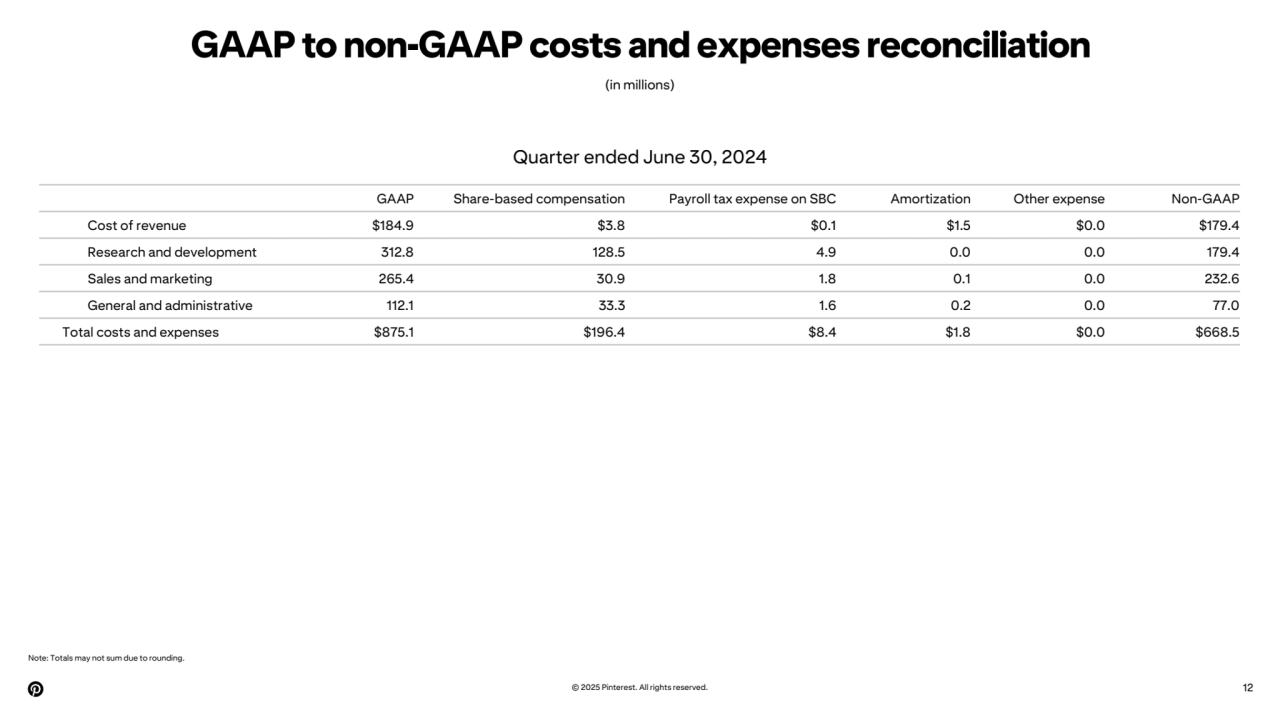
- 12. GAAP to non-GAAP costs and expenses reconciliation (in millions) Note: Totals may not sum due to rounding. © 2025 Pinterest. All rights reserved. 12 GAAP Share-based compensation Payroll tax expense on SBC Amortization Other expense Non-GAAP Cost of revenue $184.9 $3.8 $0.1 $1.5 $0.0 $179.4 Research and development 312.8 128.5 4.9 0.0 0.0 179.4 Sales and marketing 265.4 30.9 1.8 0.1 0.0 232.6 General and administrative 112.1 33.3 1.6 0.2 0.0 77.0 Total costs and expenses $875.1 $196.4 $8.4 $1.8 $0.0 $668.5 Quarter ended June 30, 2024
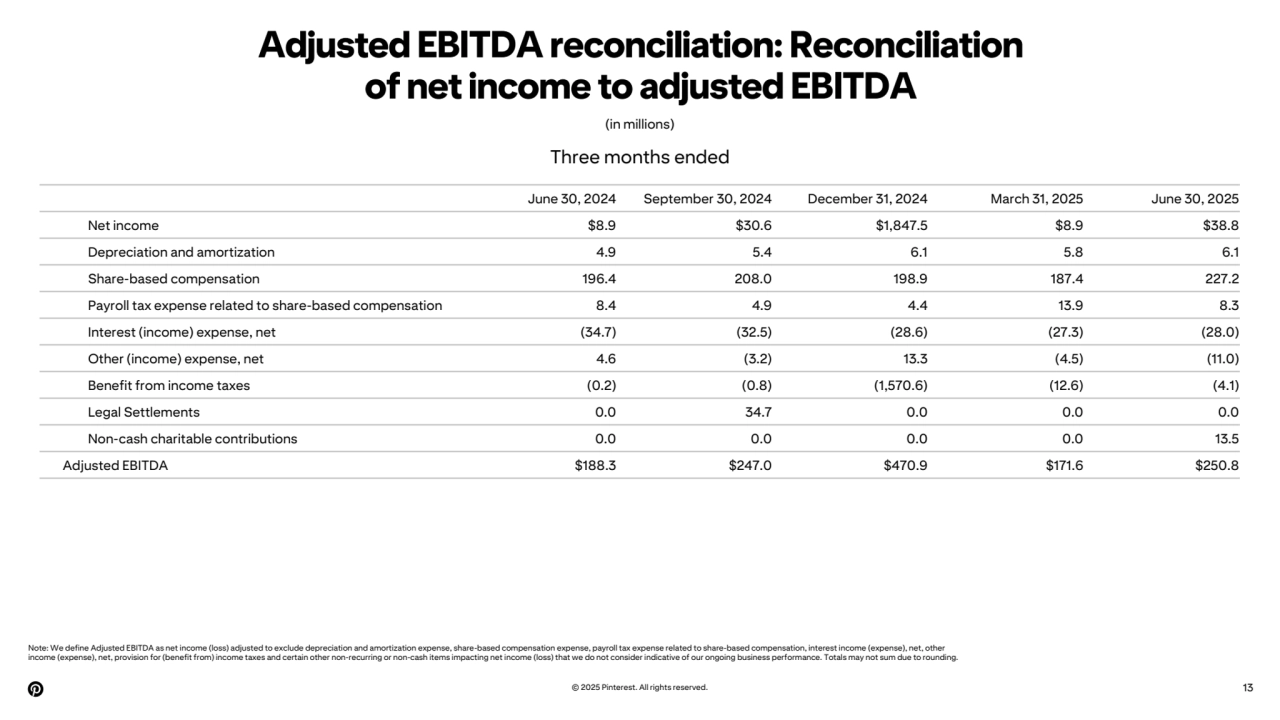
- 13. Adjusted EBITDA reconciliation: Reconciliation of net income to adjusted EBITDA (in millions) Note: We define Adjusted EBITDA as net income (loss) adjusted to exclude depreciation and amortization expense, share-based compensation expense, payroll tax expense related to share-based compensation, interest income (expense), net, other income (expense), net, provision for (benefit from) income taxes and certain other non-recurring or non-cash items impacting net income (loss) that we do not consider indicative of our ongoing business performance. Totals may not sum due to rounding. © 2025 Pinterest. All rights reserved. 13 June 30, 2024 September 30, 2024 December 31, 2024 March 31, 2025 June 30, 2025 Net income $8.9 $30.6 $1,847.5 $8.9 $38.8 Depreciation and amortization 4.9 5.4 6.1 5.8 6.1 Share-based compensation 196.4 208.0 198.9 187.4 227.2 Payroll tax expense related to share-based compensation 8.4 4.9 4.4 13.9 8.3 Interest (income) expense, net (34.7) (32.5) (28.6) (27.3) (28.0) Other (income) expense, net 4.6 (3.2) 13.3 (4.5) (11.0) Benefit from income taxes (0.2) (0.8) (1,570.6) (12.6) (4.1) Legal Settlements 0.0 34.7 0.0 0.0 0.0 Non-cash charitable contributions 0.0 0.0 0.0 0.0 13.5 Adjusted EBITDA $188.3 $247.0 $470.9 $171.6 $250.8 Three months ended
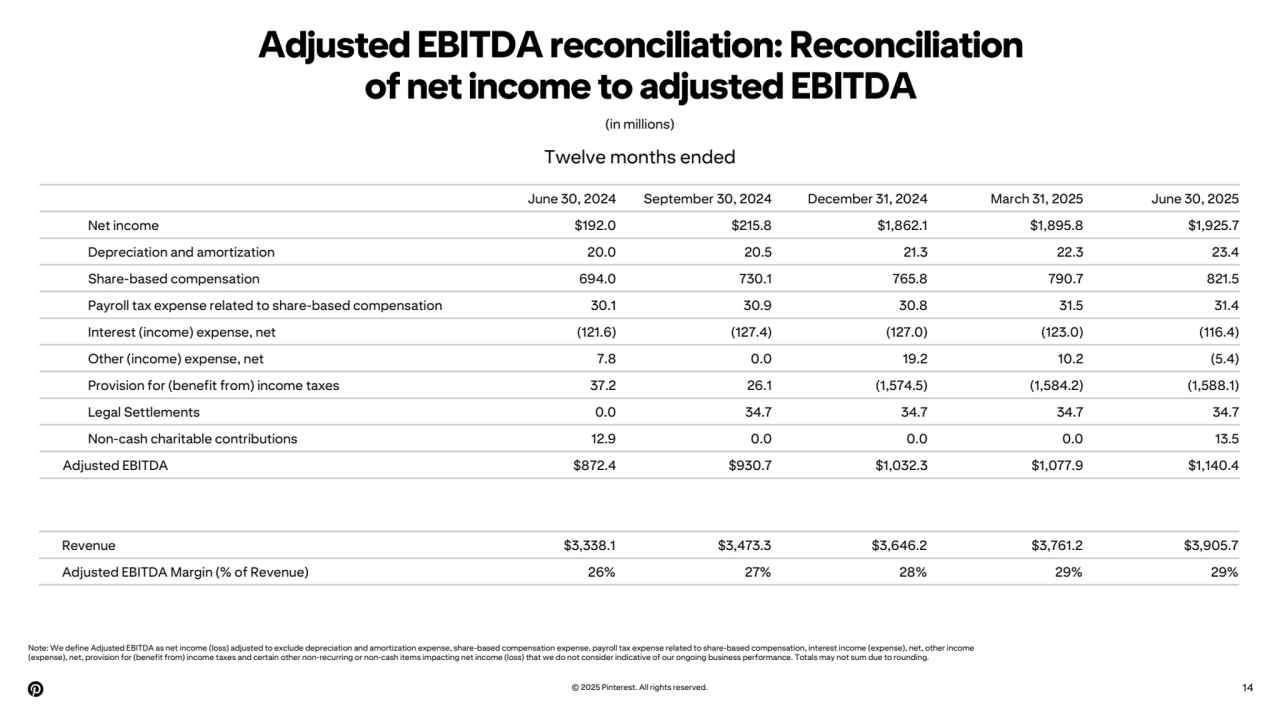
- 14. Adjusted EBITDA reconciliation: Reconciliation of net income to adjusted EBITDA (in millions) Note: We define Adjusted EBITDA as net income (loss) adjusted to exclude depreciation and amortization expense, share-based compensation expense, payroll tax expense related to share-based compensation, interest income (expense), net, other income (expense), net, provision for (benefit from) income taxes and certain other non-recurring or non-cash items impacting net income (loss) that we do not consider indicative of our ongoing business performance. Totals may not sum due to rounding. © 2025 Pinterest. All rights reserved. 14 June 30, 2024 September 30, 2024 December 31, 2024 March 31, 2025 June 30, 2025 Net income $192.0 $215.8 $1,862.1 $1,895.8 $1,925.7 Depreciation and amortization 20.0 20.5 21.3 22.3 23.4 Share-based compensation 694.0 730.1 765.8 790.7 821.5 Payroll tax expense related to share-based compensation 30.1 30.9 30.8 31.5 31.4 Interest (income) expense, net (121.6) (127.4) (127.0) (123.0) (116.4) Other (income) expense, net 7.8 0.0 19.2 10.2 (5.4) Provision for (benefit from) income taxes 37.2 26.1 (1,574.5) (1,584.2) (1,588.1) Legal Settlements 0.0 34.7 34.7 34.7 34.7 Non-cash charitable contributions 12.9 0.0 0.0 0.0 13.5 Adjusted EBITDA $872.4 $930.7 $1,032.3 $1,077.9 $1,140.4 Twelve months ended Revenue $3,338.1 $3,473.3 $3,646.2 $3,761.2 $3,905.7 Adjusted EBITDA Margin (% of Revenue) 26% 27% 28% 29% 29%
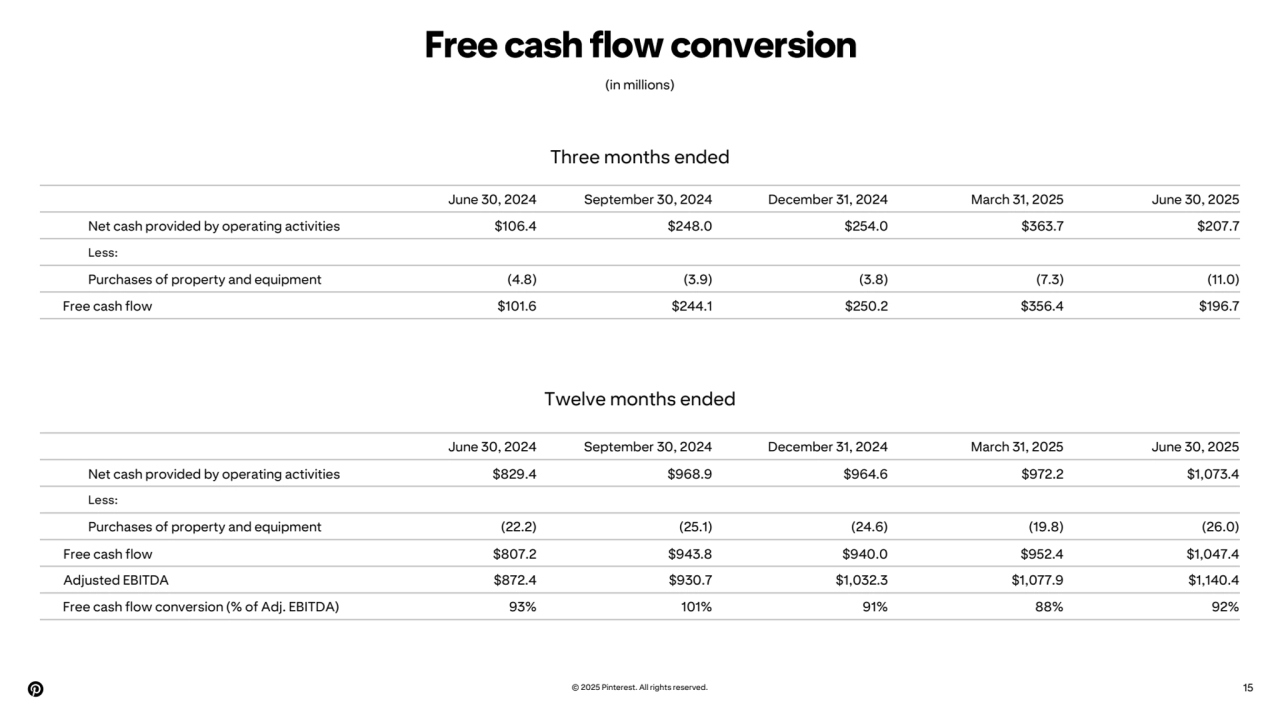
- 15. Free cash flow conversion © 2025 Pinterest. All rights reserved. 15 (in millions) June 30, 2024 September 30, 2024 December 31, 2024 March 31, 2025 June 30, 2025 Net cash provided by operating activities $829.4 $968.9 $964.6 $972.2 $1,073.4 Less: Purchases of property and equipment (22.2) (25.1) (24.6) (19.8) (26.0) Free cash flow $807.2 $943.8 $940.0 $952.4 $1,047.4 Adjusted EBITDA $872.4 $930.7 $1,032.3 $1,077.9 $1,140.4 Free cash flow conversion (% of Adj. EBITDA) 93% 101% 91% 88% 92% June 30, 2024 September 30, 2024 December 31, 2024 March 31, 2025 June 30, 2025 Net cash provided by operating activities $106.4 $248.0 $254.0 $363.7 $207.7 Less: Purchases of property and equipment (4.8) (3.9) (3.8) (7.3) (11.0) Free cash flow $101.6 $244.1 $250.2 $356.4 $196.7 Twelve months ended Three months ended
- 16. © 2025 Pinterest. All rights reserved.