Q1 2024 Earnings Presentation microstrategy
 AI Summary
Key Insights
- MicroStrategy's Q2 2024 total revenues decreased by 7% YoY to $111.4M, while subscription services revenues increased by 21% YoY to $24.1M.
- MicroStrategy holds 226,500 bitcoins, acquired at a total cost of $8.34 billion, with a current market value of $14.7 billion as of July 31, 2024.
- MicroStrategy is focusing on AI and Cloud initiatives with the expansion of their MicroStrategy AI and MicroStrategy Cloud offerings.
- The company is actively managing its capital structure, having issued $800M in convertible senior notes due in 2032 and announcing a 10:1 stock split of Class A and Class B common stock.


Q1 2024 Earnings Presentation microstrategy
- 1. Copyright © 2024 MicroStrategy Incorporated. All Rights Reserved. August 1, 2024 Q2 2024 Financial Results
- 2. 2 MicroStrategy Q2 2024 Earnings Call Safe Harbor Statement Some of the information we provide in this presentation regarding our future expectations, plans, and prospects may constitute forward-looking statements. Actual results may differ materially from these forward-looking statements due to various important factors, including the risk factors discussed in our most recent 10-Q filed with the SEC. We assume no obligation to update these forward-looking statements, which speak only as of today. Also, in this presentation, we will refer to certain non-GAAP financial measures. Reconciliations showing GAAP versus non-GAAP results are available in our earnings release and the appendix of this presentation, which were issued today and are available on our website at www.microstrategy.com. FORWARD-LOOKING STATEMENTS 2
- 3. Copyright © 2024 MicroStrategy Incorporated. All Rights Reserved. Business Results Phong Le, President & Chief Executive Officer
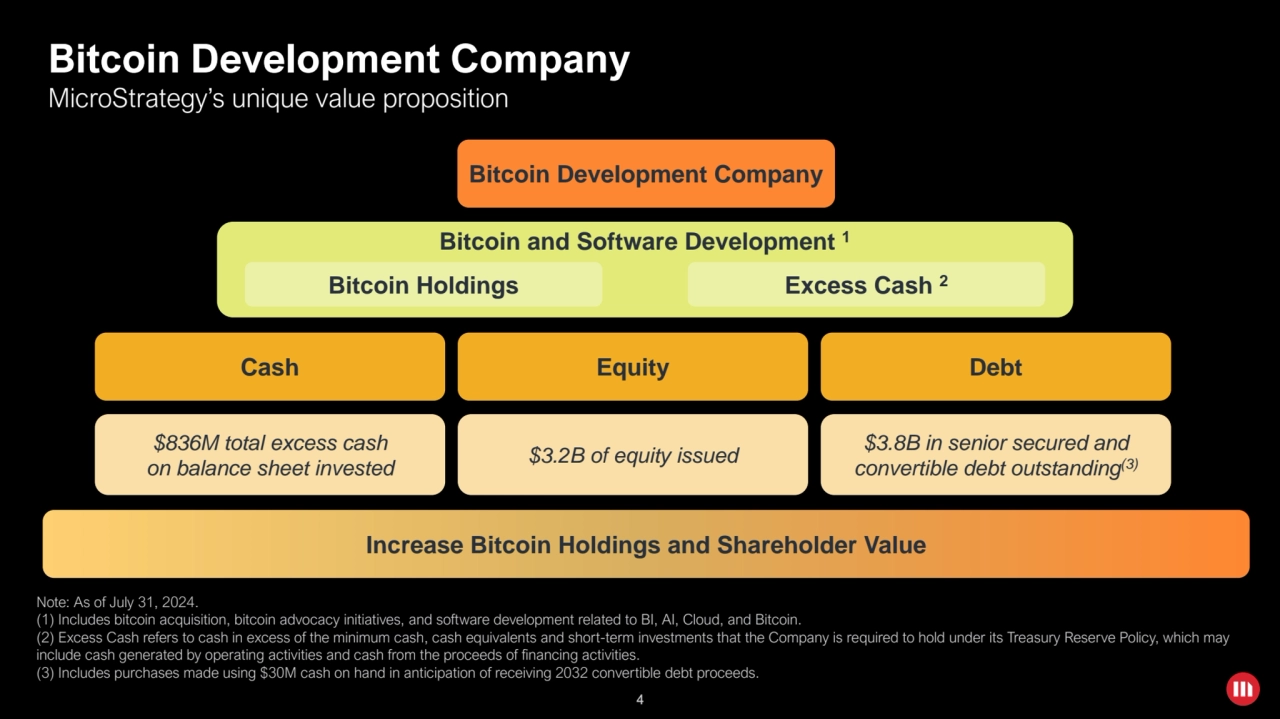
- 4. 4 Bitcoin Development Company MicroStrategy’s unique value proposition Cash Equity Debt Bitcoin Development Company Bitcoin and Software Development 1 Note: As of July 31, 2024. (1) Includes bitcoin acquisition, bitcoin advocacy initiatives, and software development related to BI, AI, Cloud, and Bitcoin. (2) Excess Cash refers to cash in excess of the minimum cash, cash equivalents and short-term investments that the Company is required to hold under its Treasury Reserve Policy, which may include cash generated by operating activities and cash from the proceeds of financing activities. (3) Includes purchases made using $30M cash on hand in anticipation of receiving 2032 convertible debt proceeds. Bitcoin Holdings Excess Cash 2 $836M total excess cash on balance sheet invested $3.2B of equity issued $3.8B in senior secured and convertible debt outstanding (3) Increase Bitcoin Holdings and Shareholder Value
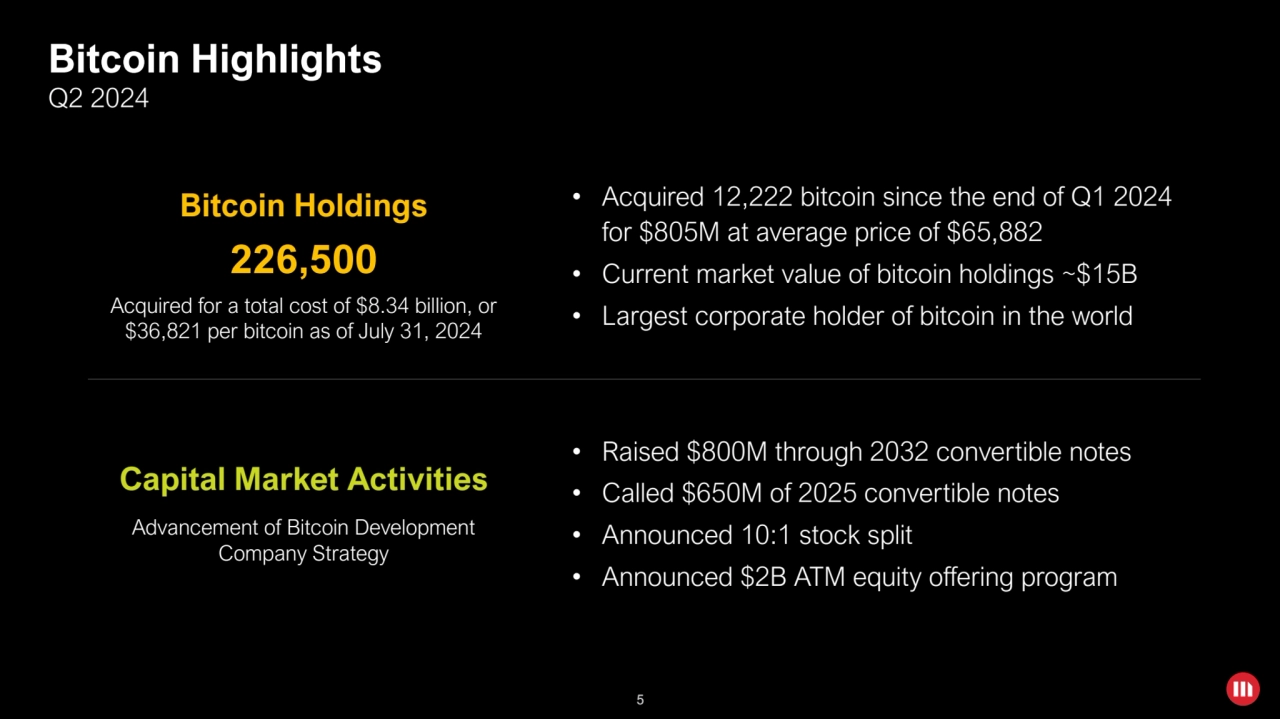
- 5. 5 Bitcoin Highlights 226,500 Bitcoin Holdings • Acquired 12,222 bitcoin since the end of Q1 2024 for $805M at average price of $65,882 • Current market value of bitcoin holdings ~$15B • Largest corporate holder of bitcoin in the world Acquired for a total cost of $8.34 billion, or $36,821 per bitcoin as of July 31, 2024 Q2 2024 • Raised $800M through 2032 convertible notes • Called $650M of 2025 convertible notes • Announced 10:1 stock split • Announced $2B ATM equity offering program Capital Market Activities Advancement of Bitcoin Development Company Strategy
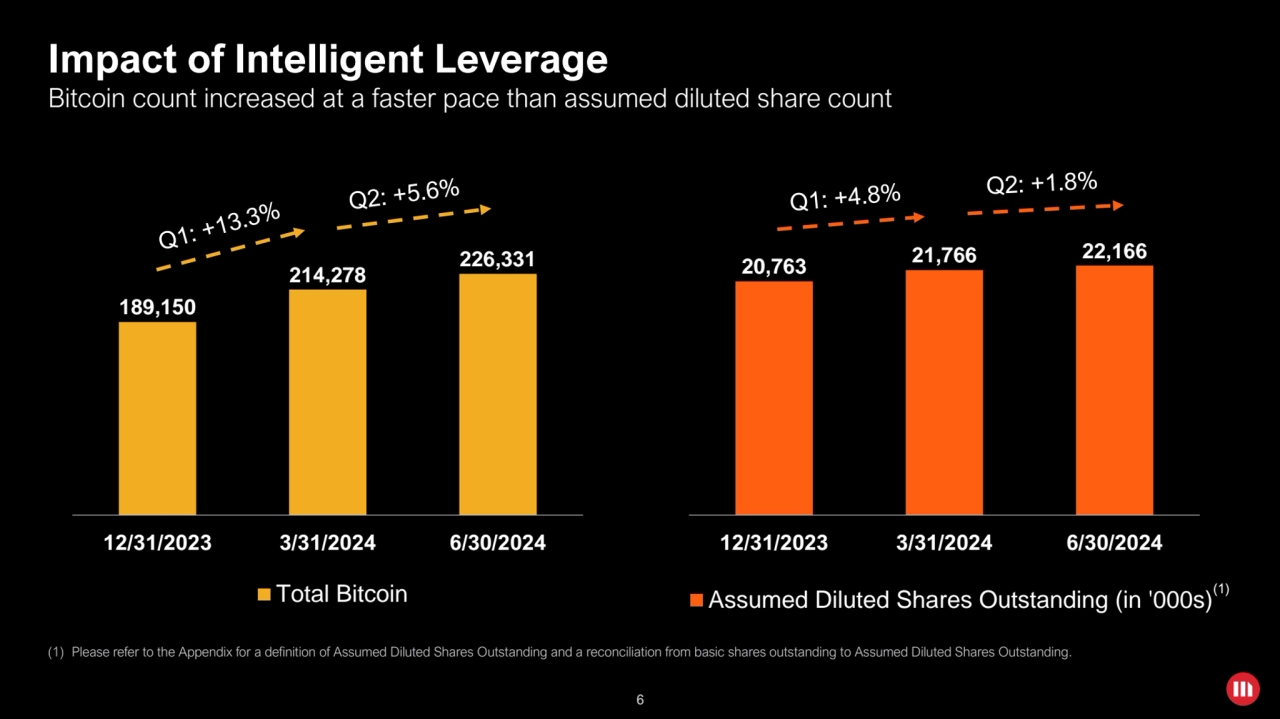
- 6. 6 Impact of Intelligent Leverage 189,150 214,278 226,331 12/31/2023 3/31/2024 6/30/2024 Total Bitcoin 20,763 21,766 22,166 12/31/2023 3/31/2024 6/30/2024 Assumed Diluted Shares Outstanding (in '000s) Bitcoin count increased at a faster pace than assumed diluted share count (1) Please refer to the Appendix for a definition of Assumed Diluted Shares Outstanding and a reconciliation from basic shares outstanding to Assumed Diluted Shares Outstanding. (1)
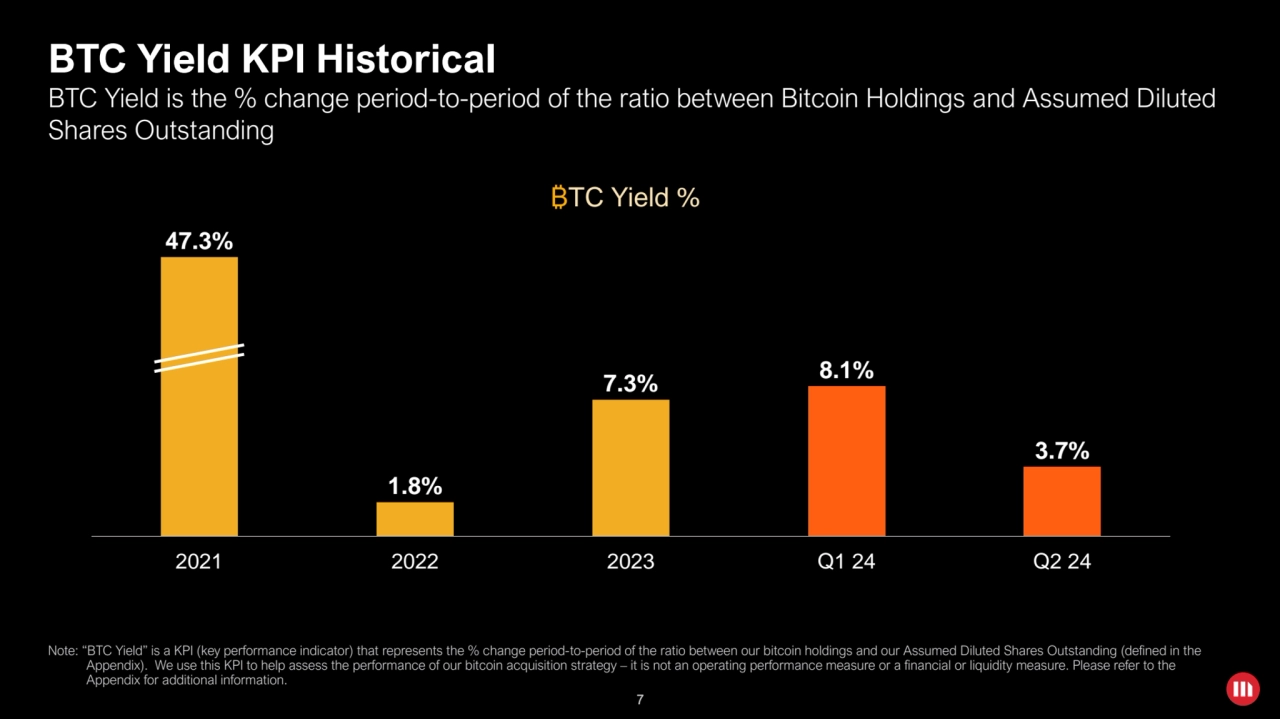
- 7. 7 BTC Yield KPI Historical Note: “BTC Yield” is a KPI (key performance indicator) that represents the % change period-to-period of the ratio between our bitcoin holdings and our Assumed Diluted Shares Outstanding (defined in the Appendix). We use this KPI to help assess the performance of our bitcoin acquisition strategy – it is not an operating performance measure or a financial or liquidity measure. Please refer to the Appendix for additional information. 47.3% 1.8% 7.3% 8.1% 3.7% 2021 2022 2023 Q1 24 Q2 24 BTC Yield is the % change period-to-period of the ratio between Bitcoin Holdings and Assumed Diluted Shares Outstanding ₿TC Yield %
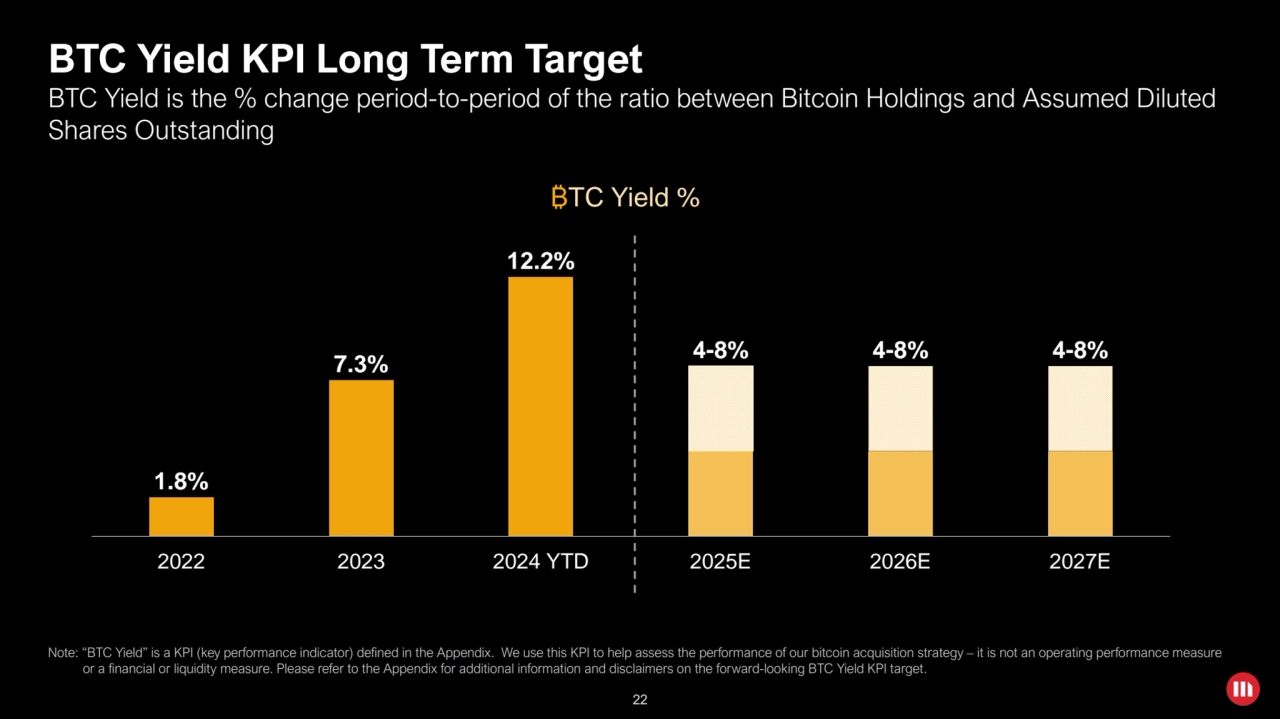
- 8. 8 BTC Yield KPI Long Term Target 8 1.8% 7.3% 12.2% 4-8% 4-8% 4-8% 2022 2023 2024 YTD 2025E 2026E 2027E ₿TC Yield % BTC Yield is the % change period-to-period of the ratio between Bitcoin Holdings and Assumed Diluted Shares Outstanding Note: “BTC Yield” is a KPI (key performance indicator) defined in the Appendix. We use this KPI to help assess the performance of our bitcoin acquisition strategy – it is not an operating performance measure or a financial or liquidity measure. Please refer to the Appendix for additional information and disclaimers on the forward-looking BTC Yield KPI target.
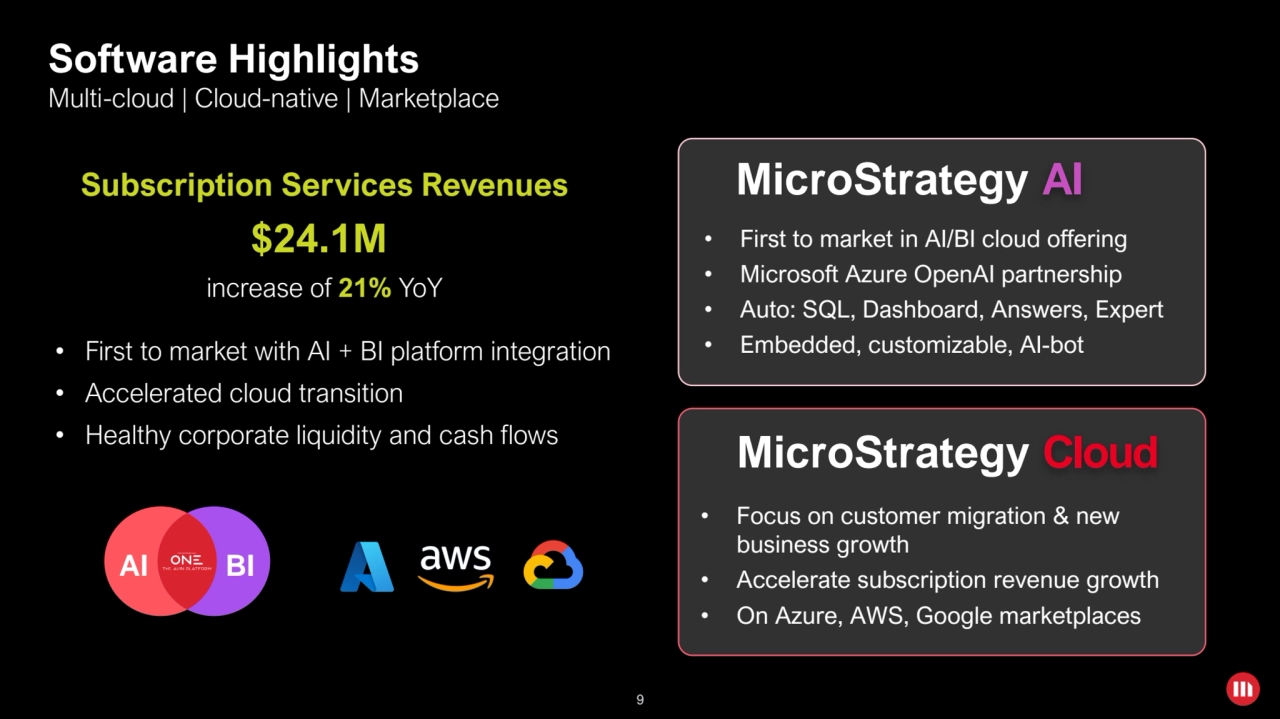
- 9. 9 Software Highlights • First to market with AI + BI platform integration • Accelerated cloud transition • Healthy corporate liquidity and cash flows $24.1M increase of 21% YoY Subscription Services Revenues • Focus on customer migration & new business growth • Accelerate subscription revenue growth • On Azure, AWS, Google marketplaces MicroStrategy Cloud • First to market in AI/BI cloud offering • Microsoft Azure OpenAI partnership • Auto: SQL, Dashboard, Answers, Expert • Embedded, customizable, AI-bot MicroStrategy AI AI BI Multi-cloud | Cloud-native | Marketplace
- 10. Copyright © 2024 MicroStrategy Incorporated. All Rights Reserved. Financial Results Andrew Kang, Senior Executive VP & Chief Financial Officer
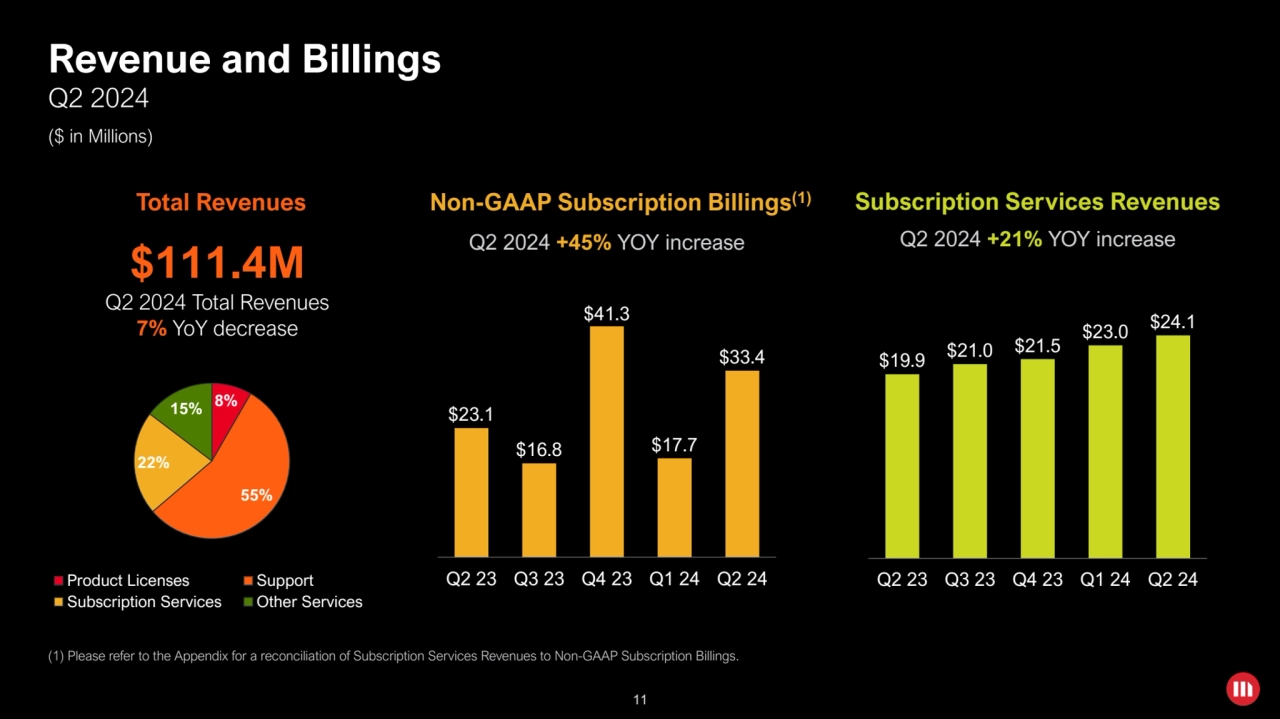
- 11. 11 $23.1 $16.8 $41.3 $17.7 $33.4 Q2 23 Q3 23 Q4 23 Q1 24 Q2 24 Non-GAAP Subscription Billings (1) Q2 2024 +45% YOY increase Revenue and Billings Q2 2024 ($ in Millions) 11 Q2 2024 Total Revenues 7% YoY decrease $111.4M Total Revenues 8% 55% 22% 15% Product Licenses Support Subscription Services Other Services (1) Please refer to the Appendix for a reconciliation of Subscription Services Revenues to Non-GAAP Subscription Billings. $19.9 $21.0 $21.5 $23.0 $24.1 Q2 23 Q3 23 Q4 23 Q1 24 Q2 24 Subscription Services Revenues Q2 2024 +21% YOY increase
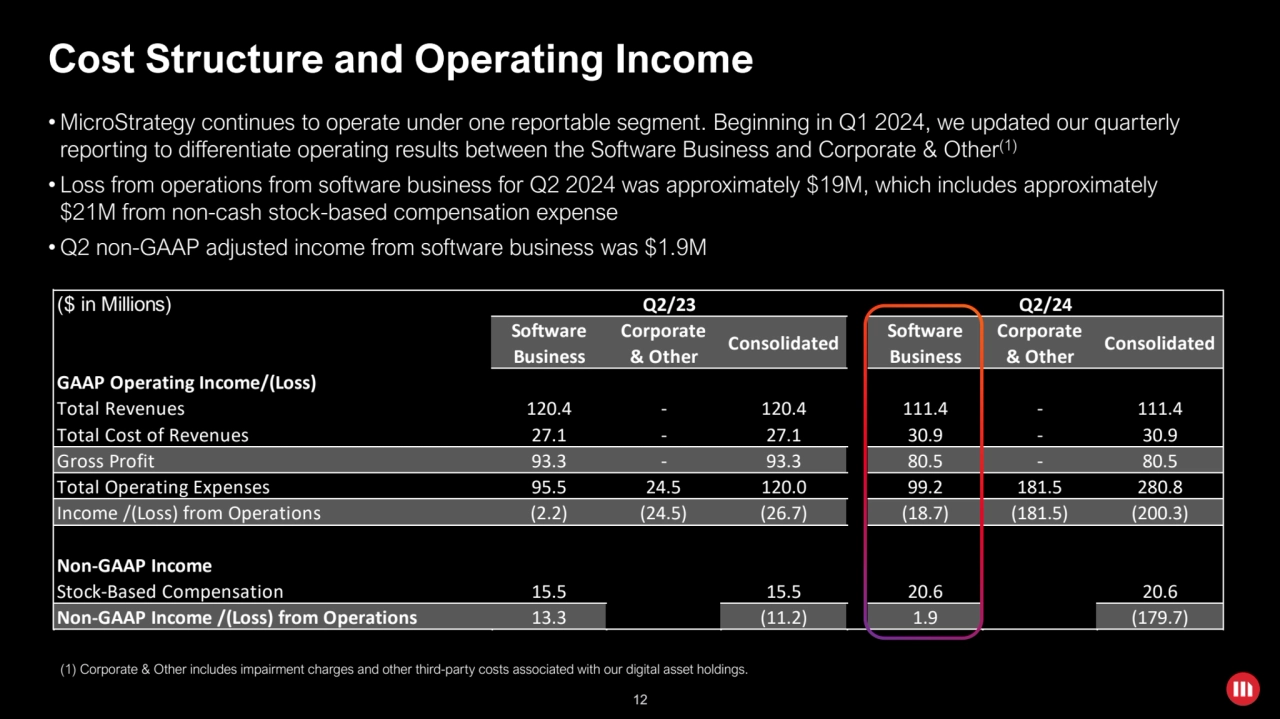
- 12. 12 ($ in Millions) Q2/23 Q2/24 Software Business Corporate & Other Consolidated Software Business Corporate & Other Consolidated GAAP Operating Income/(Loss) Total Revenues 120.4 - 120.4 111.4 - 111.4 Total Cost of Revenues 27.1 - 27.1 30.9 - 30.9 Gross Profit 93.3 - 93.3 80.5 - 80.5 Total Operating Expenses 95.5 24.5 120.0 99.2 181.5 280.8 Income /(Loss) from Operations (2.2) (24.5) (26.7) (18.7) (181.5) (200.3) Non-GAAP Income Stock-Based Compensation 15.5 15.5 20.6 20.6 Non-GAAP Income /(Loss) from Operations 13.3 (11.2) 1.9 (179.7) Cost Structure and Operating Income • MicroStrategy continues to operate under one reportable segment. Beginning in Q1 2024, we updated our quarterly reporting to differentiate operating results between the Software Business and Corporate & Other (1) • Loss from operations from software business for Q2 2024 was approximately $19M, which includes approximately $21M from non-cash stock-based compensation expense • Q2 non-GAAP adjusted income from software business was $1.9M (1) Corporate & Other includes impairment charges and other third-party costs associated with our digital asset holdings.
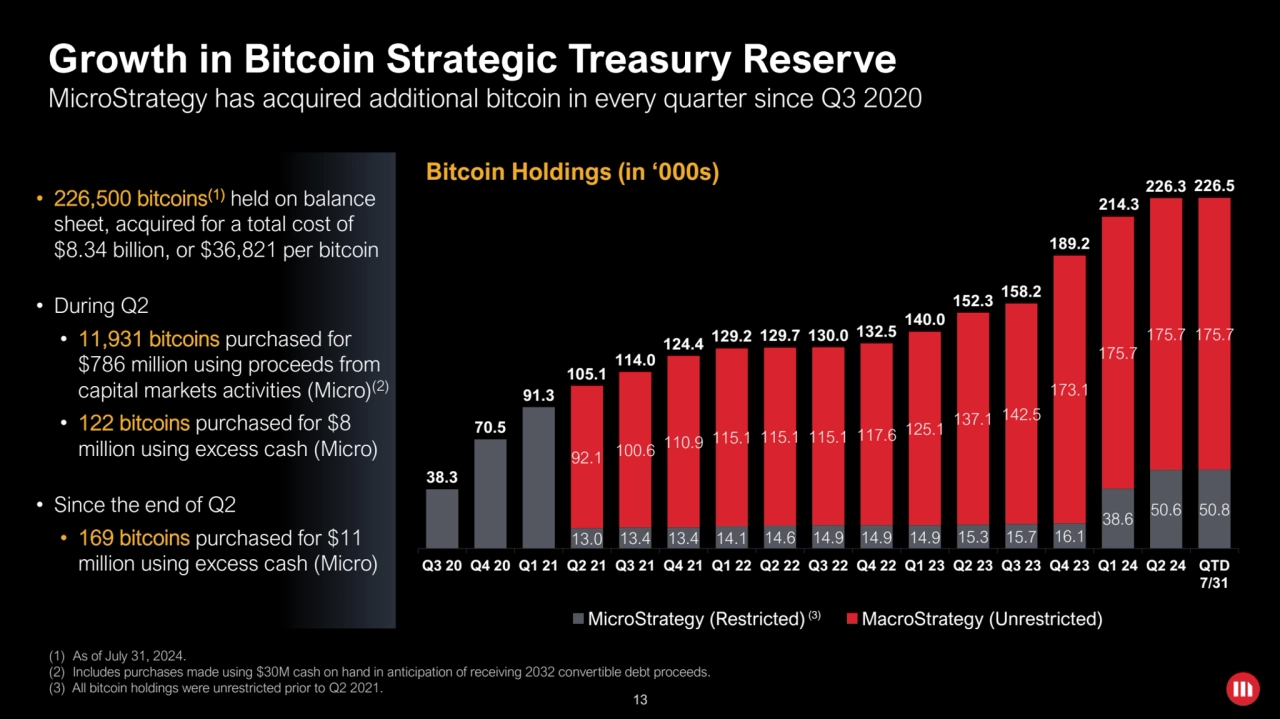
- 13. 13 Growth in Bitcoin Strategic Treasury Reserve 13.0 13.4 13.4 14.1 14.6 14.9 14.9 14.9 15.3 15.7 16.1 38.6 50.6 50.8 92.1 100.6 110.9 115.1 115.1 115.1 117.6 125.1 137.1 142.5 173.1 175.7 175.7 175.7 38.3 70.5 91.3 105.1 114.0 124.4 129.2 129.7 130.0 132.5 140.0 152.3 158.2 189.2 214.3 226.3 226.5 Q3 20 Q4 20 Q1 21 Q2 21 Q3 21 Q4 21 Q1 22 Q2 22 Q3 22 Q4 22 Q1 23 Q2 23 Q3 23 Q4 23 Q1 24 Q2 24 QTD 7/31 MicroStrategy (Restricted) MacroStrategy (Unrestricted) • 226,500 bitcoins(1) held on balance sheet, acquired for a total cost of $8.34 billion, or $36,821 per bitcoin • During Q2 • 11,931 bitcoins purchased for $786 million using proceeds from capital markets activities (Micro)(2) • 122 bitcoins purchased for $8 million using excess cash (Micro) • Since the end of Q2 • 169 bitcoins purchased for $11 million using excess cash (Micro) MicroStrategy has acquired additional bitcoin in every quarter since Q3 2020 (1) As of July 31, 2024. (2) Includes purchases made using $30M cash on hand in anticipation of receiving 2032 convertible debt proceeds. (3) All bitcoin holdings were unrestricted prior to Q2 2021. (3) Bitcoin Holdings (in ‘000s)
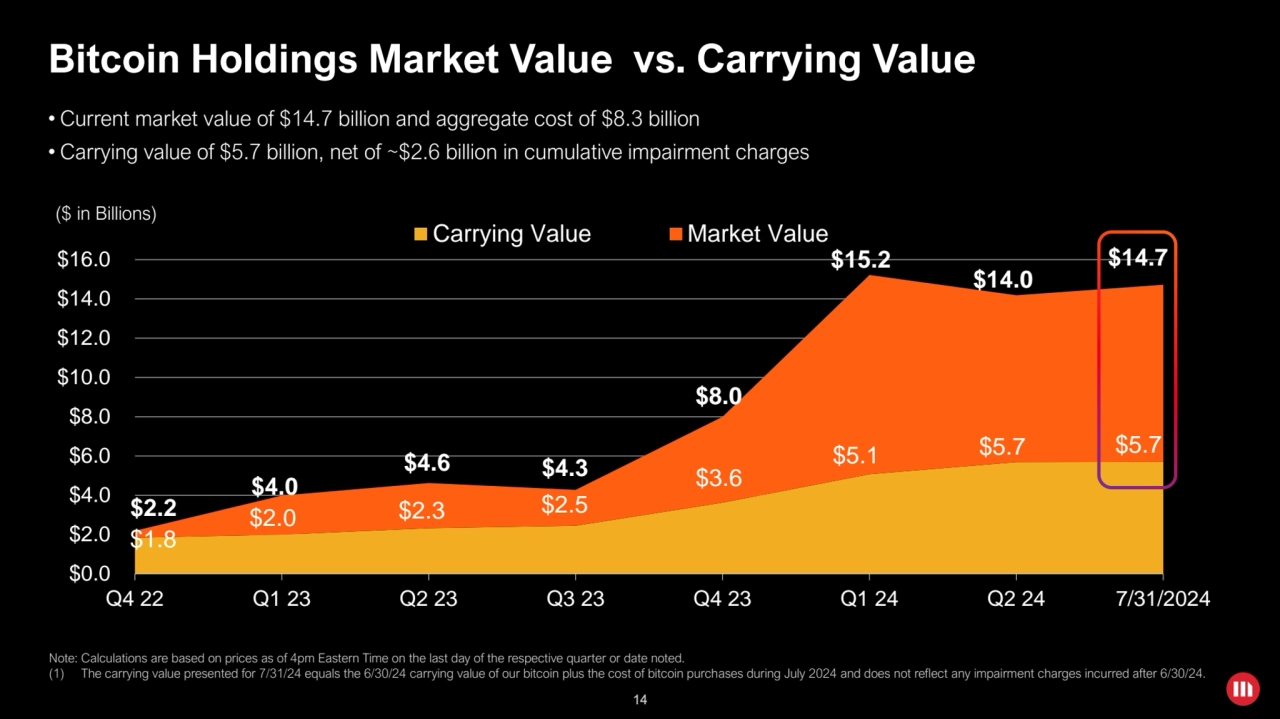
- 14. 14 Bitcoin Holdings Market Value vs. Carrying Value ($ in Billions) $1.8 $2.0 $2.3 $2.5 $3.6 $5.1 $5.7 $5.7 $0.0 $2.0 $4.0 $6.0 $8.0 $10.0 $12.0 $14.0 $16.0 Q4 22 Q1 23 Q2 23 Q3 23 Q4 23 Q1 24 Q2 24 7/31/2024 Carrying Value Market Value $8.0 $15.2 $2.2 $4.0 $4.6 $4.3 • Current market value of $14.7 billion and aggregate cost of $8.3 billion • Carrying value of $5.7 billion, net of ~$2.6 billion in cumulative impairment charges Note: Calculations are based on prices as of 4pm Eastern Time on the last day of the respective quarter or date noted. (1) The carrying value presented for 7/31/24 equals the 6/30/24 carrying value of our bitcoin plus the cost of bitcoin purchases during July 2024 and does not reflect any impairment charges incurred after 6/30/24. $14.7 $14.0
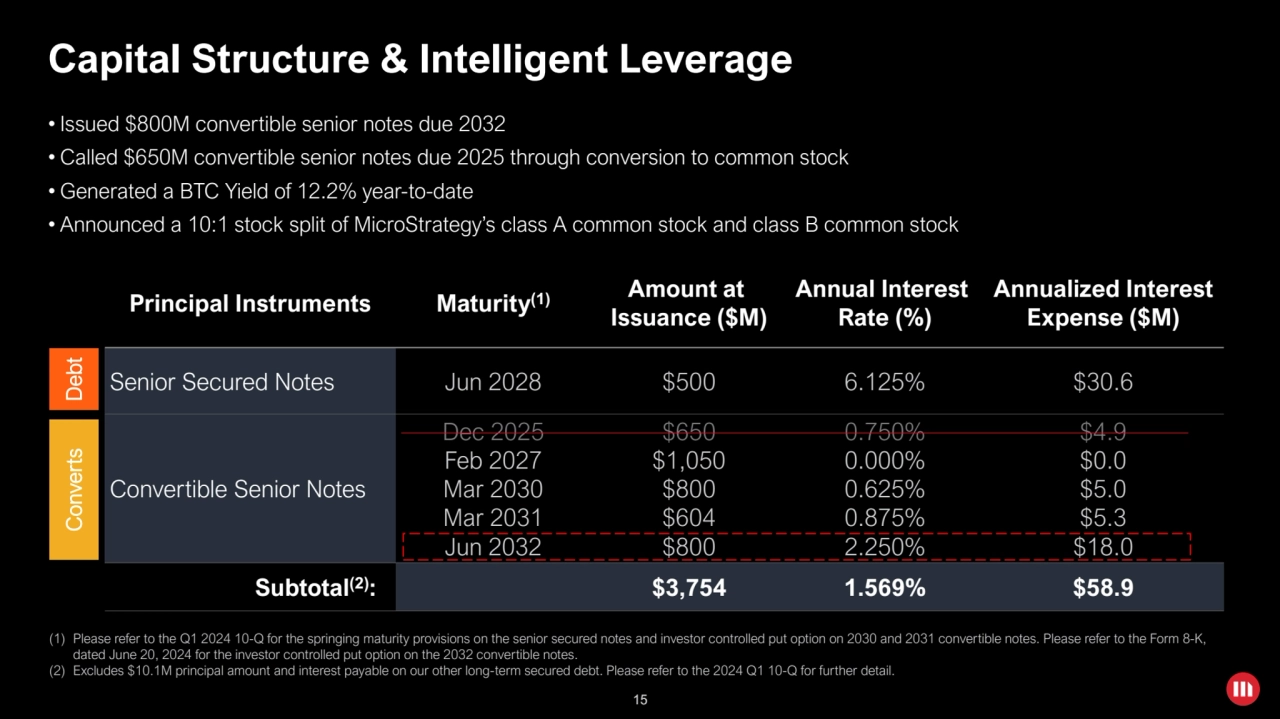
- 15. 15 Principal Instruments Maturity(1) Amount at Issuance ($M) Annual Interest Rate (%) Annualized Interest Expense ($M) Senior Secured Notes Jun 2028 $500 6.125% $30.6 Convertible Senior Notes Dec 2025 Feb 2027 Mar 2030 Mar 2031 Jun 2032 $650 $1,050 $800 $604 $800 0.750% 0.000% 0.625% 0.875% 2.250% $4.9 $0.0 $5.0 $5.3 $18.0 Subtotal(2): $3,754 1.569% $58.9 Capital Structure & Intelligent Leverage 15 (1) Please refer to the Q1 2024 10-Q for the springing maturity provisions on the senior secured notes and investor controlled put option on 2030 and 2031 convertible notes. Please refer to the Form 8-K, dated June 20, 2024 for the investor controlled put option on the 2032 convertible notes. (2) Excludes $10.1M principal amount and interest payable on our other long-term secured debt. Please refer to the 2024 Q1 10-Q for further detail. • Issued $800M convertible senior notes due 2032 • Called $650M convertible senior notes due 2025 through conversion to common stock • Generated a BTC Yield of 12.2% year-to-date • Announced a 10:1 stock split of MicroStrategy’s class A common stock and class B common stock Debt Converts
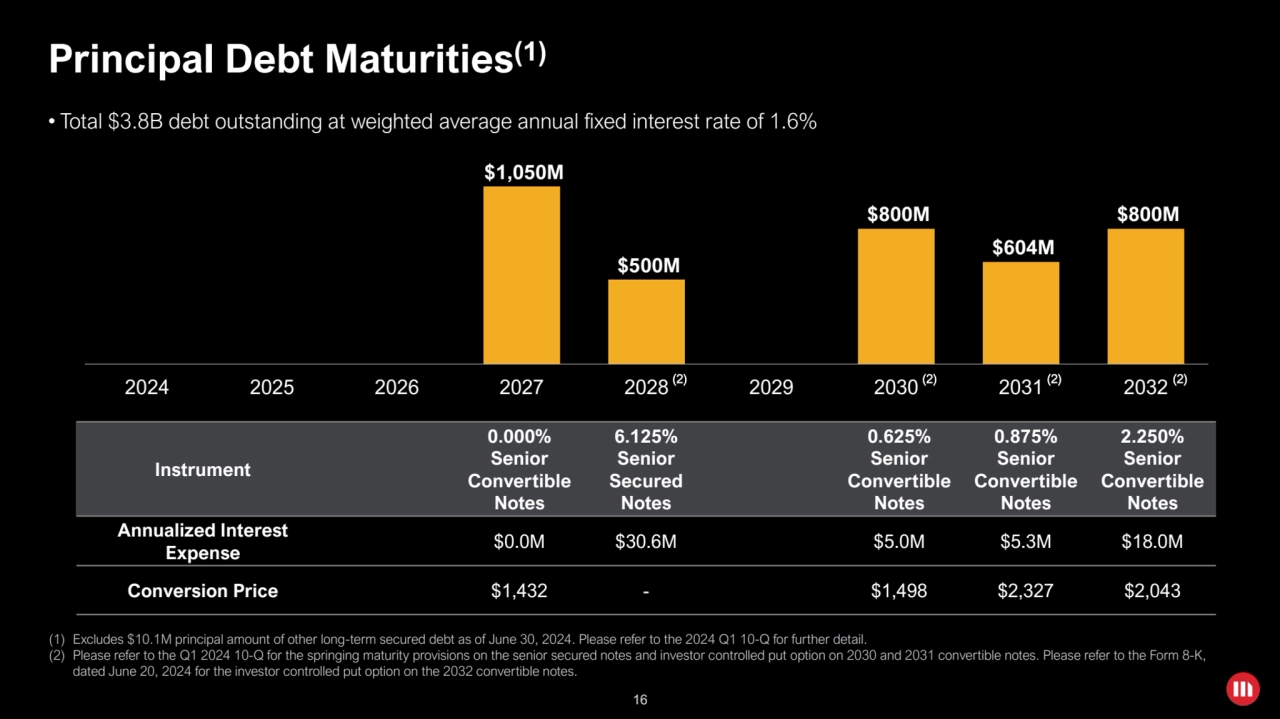
- 16. 16 $1,050M $500M $800M $604M $800M 2024 2025 2026 2027 2028 2029 2030 2031 2032 Principal Debt Maturities(1) (1) Excludes $10.1M principal amount of other long-term secured debt as of June 30, 2024. Please refer to the 2024 Q1 10-Q for further detail. (2) Please refer to the Q1 2024 10-Q for the springing maturity provisions on the senior secured notes and investor controlled put option on 2030 and 2031 convertible notes. Please refer to the Form 8-K, dated June 20, 2024 for the investor controlled put option on the 2032 convertible notes. 16 • Total $3.8B debt outstanding at weighted average annual fixed interest rate of 1.6% Instrument 0.000% Senior Convertible Notes 6.125% Senior Secured Notes 0.625% Senior Convertible Notes 0.875% Senior Convertible Notes 2.250% Senior Convertible Notes Annualized Interest Expense $0.0M $30.6M $5.0M $5.3M $18.0M Conversion Price $1,432 - $1,498 $2,327 $2,043 (2) (2) (2) (2)
- 17. Copyright © 2024 MicroStrategy Incorporated. All Rights Reserved. Strategy & Bitcoin Michael Saylor, Executive Chairman
- 18. 18 Bitcoin Conference 2024 Nashville, TN
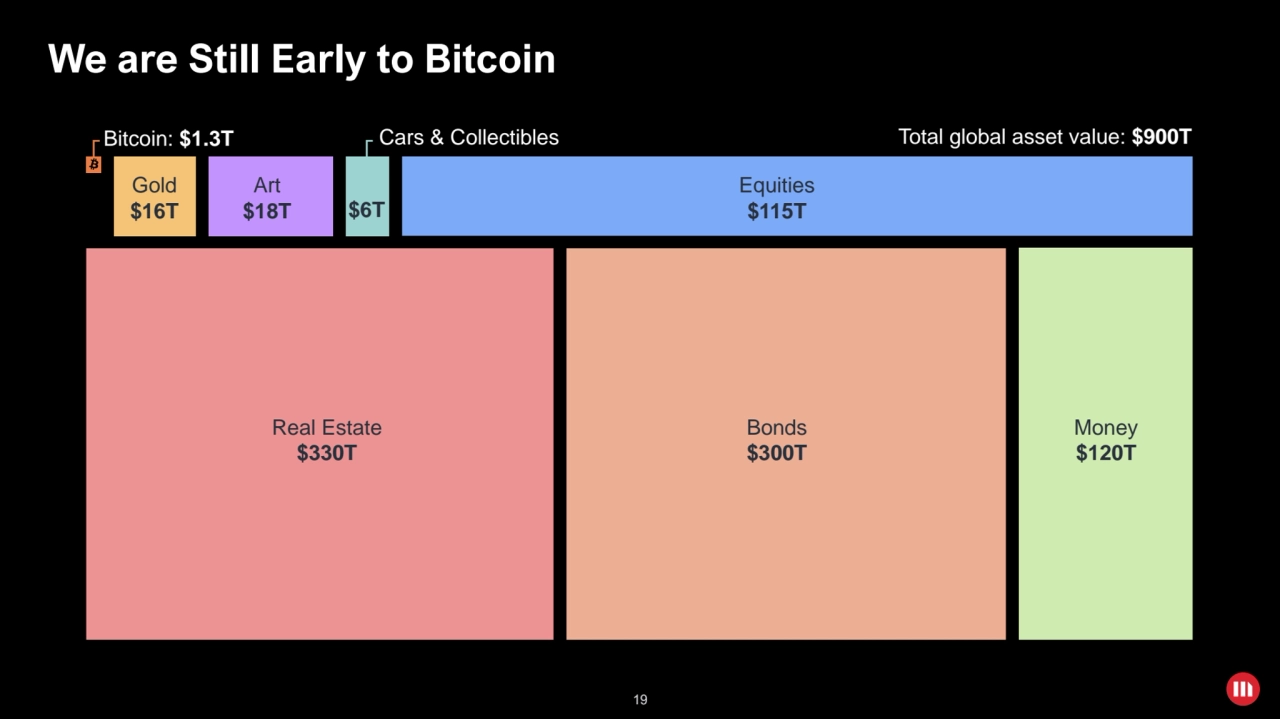
- 19. 19 We are Still Early to Bitcoin Total global asset value: $900T Equities $115T Gold $16T Art $18T $6T Real Estate $330T Bonds $300T Money $120T Bitcoin: $1.3T Cars & Collectibles
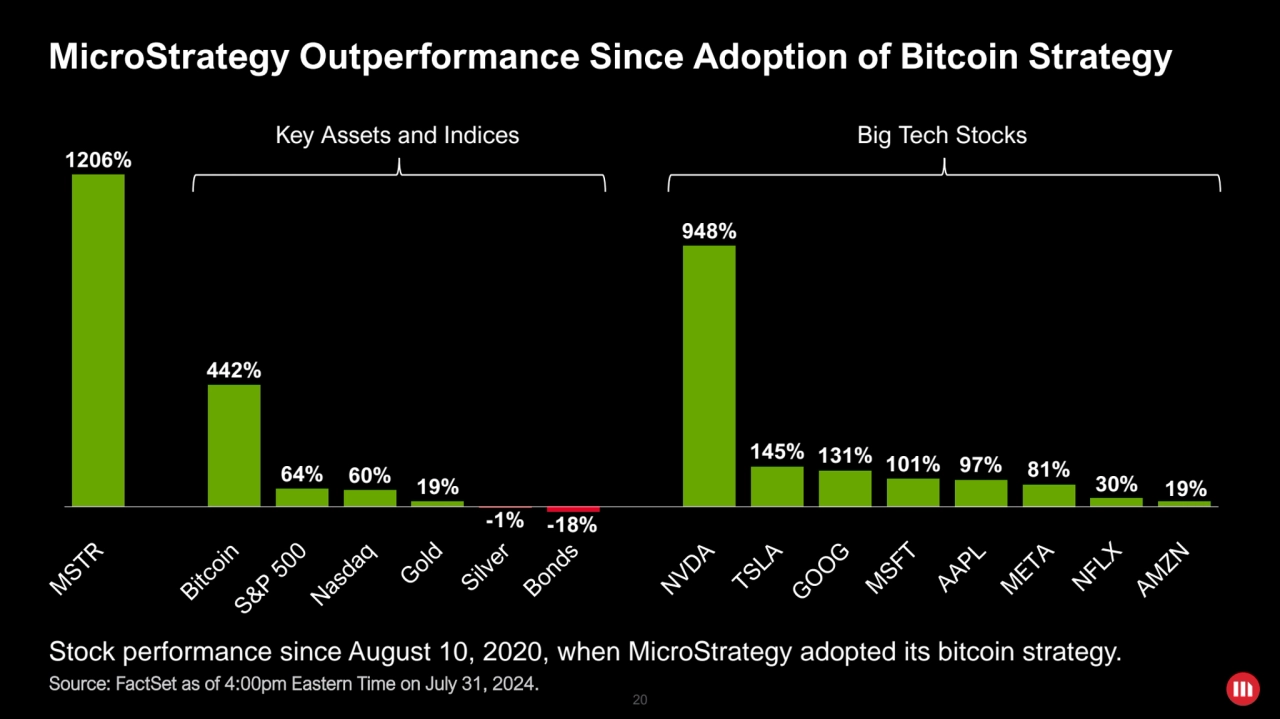
- 20. 20 MicroStrategy Outperformance Since Adoption of Bitcoin Strategy Stock performance since August 10, 2020, when MicroStrategy adopted its bitcoin strategy. Source: FactSet as of 4:00pm Eastern Time on July 31, 2024. 1206% 442% 64% 60% 19% -1% -18% 948% 145% 131% 101% 97% 81% 30% 19% Key Assets and Indices Big Tech Stocks
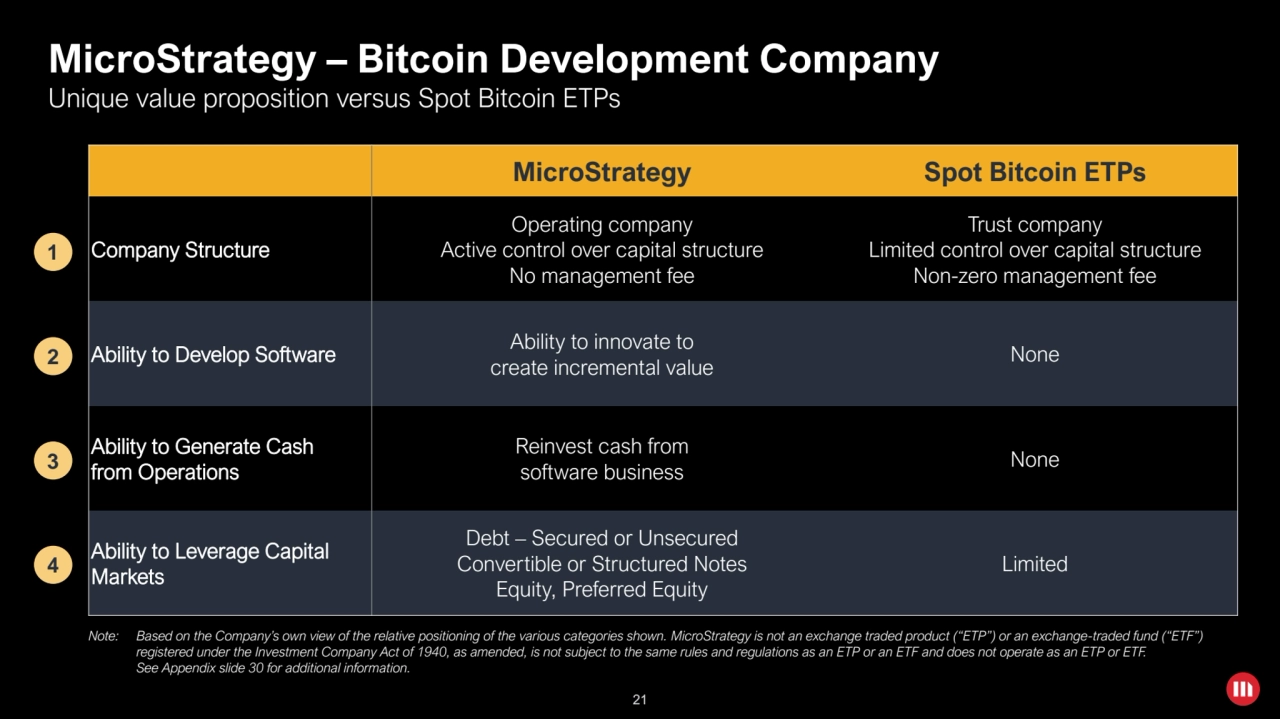
- 21. 21 MicroStrategy – Bitcoin Development Company Unique value proposition versus Spot Bitcoin ETPs MicroStrategy Spot Bitcoin ETPs Company Structure Operating company Active control over capital structure No management fee Trust company Limited control over capital structure Non-zero management fee Ability to Develop Software Ability to innovate to create incremental value None Ability to Generate Cash from Operations Reinvest cash from software business None Ability to Leverage Capital Markets Debt – Secured or Unsecured Convertible or Structured Notes Equity, Preferred Equity Limited Note: Based on the Company’s own view of the relative positioning of the various categories shown. MicroStrategy is not an exchange traded product (“ETP”) or an exchange-traded fund (“ETF”) registered under the Investment Company Act of 1940, as amended, is not subject to the same rules and regulations as an ETP or an ETF and does not operate as an ETP or ETF. See Appendix slide 30 for additional information. 21 1 2 3 4
- 22. 22 BTC Yield KPI Long Term Target 22 1.8% 7.3% 12.2% 4-8% 4-8% 4-8% 2022 2023 2024 YTD 2025E 2026E 2027E ₿TC Yield % BTC Yield is the % change period-to-period of the ratio between Bitcoin Holdings and Assumed Diluted Shares Outstanding Note: “BTC Yield” is a KPI (key performance indicator) defined in the Appendix. We use this KPI to help assess the performance of our bitcoin acquisition strategy – it is not an operating performance measure or a financial or liquidity measure. Please refer to the Appendix for additional information and disclaimers on the forward-looking BTC Yield KPI target.
- 23. Copyright © 2024 MicroStrategy Incorporated. All Rights Reserved. Appendix
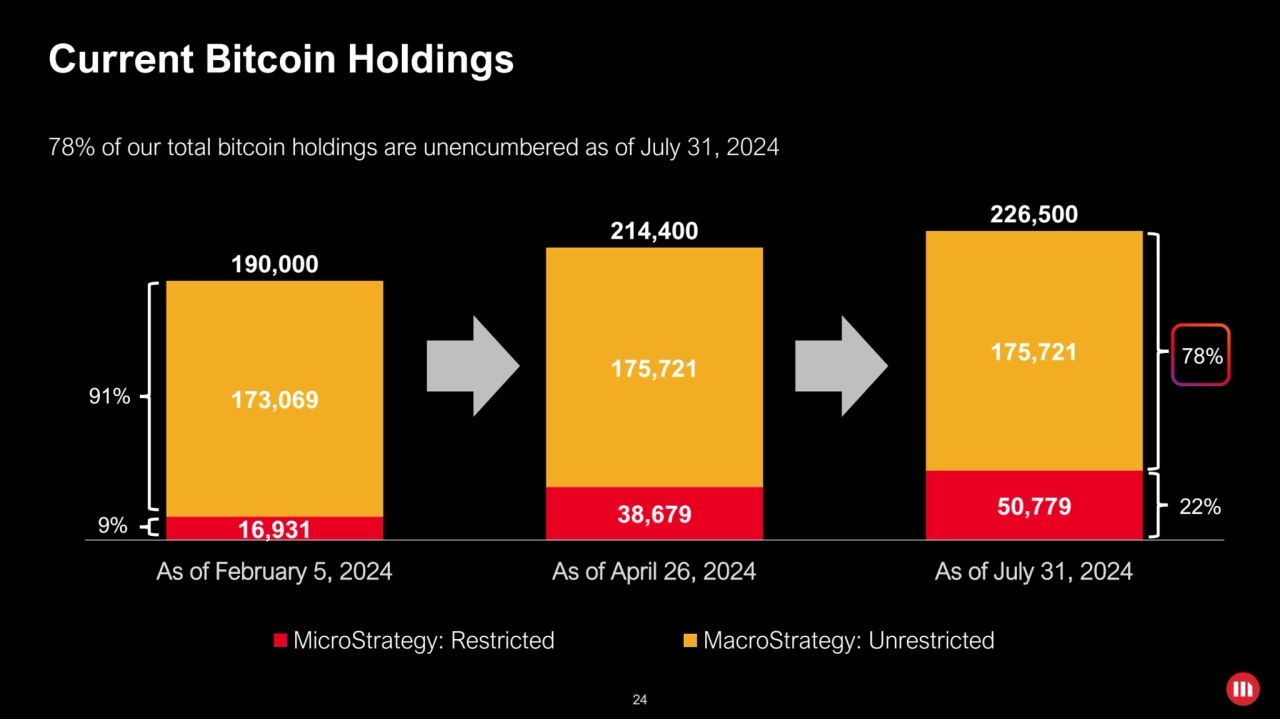
- 24. 24 16,931 38,679 50,779 173,069 175,721 175,721 190,000 214,400 226,500 As of February 5, 2024 As of April 26, 2024 As of July 31, 2024 MicroStrategy: Restricted MacroStrategy: Unrestricted Current Bitcoin Holdings 24 91% 9% 78% 22% 78% of our total bitcoin holdings are unencumbered as of July 31, 2024
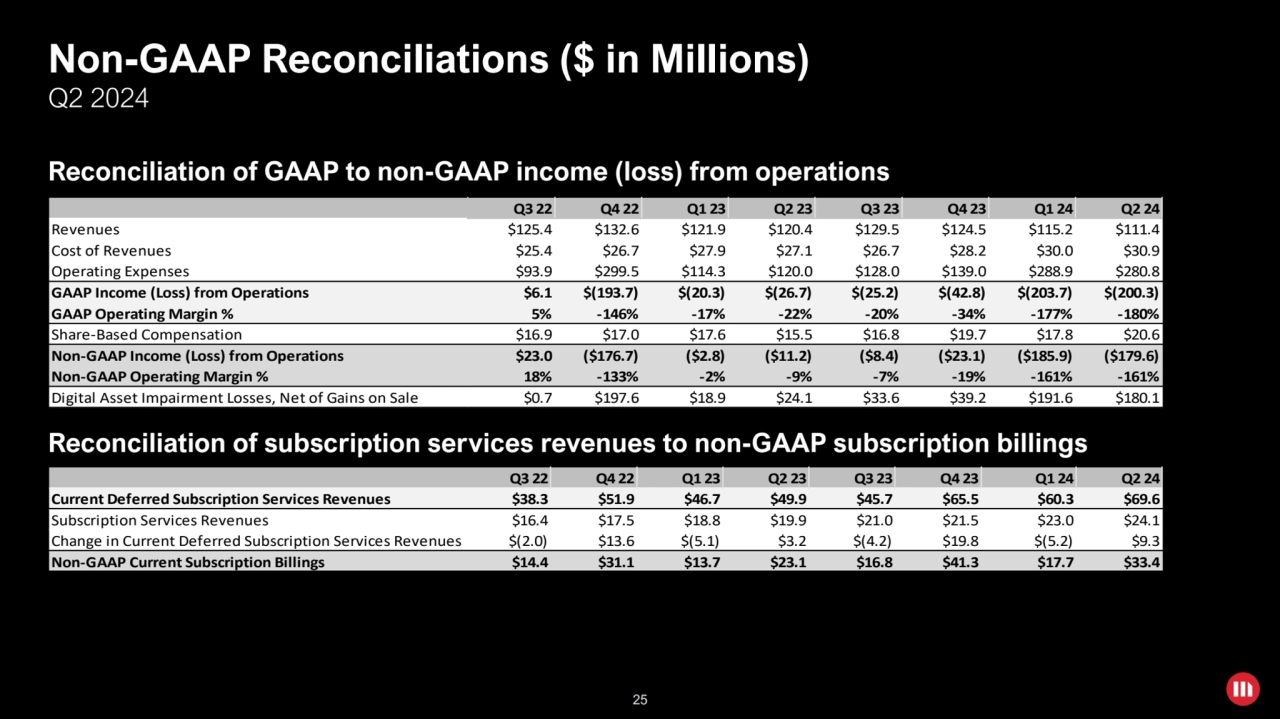
- 25. 25 Q3 22 Q4 22 Q1 23 Q2 23 Q3 23 Q4 23 Q1 24 Q2 24 Current Deferred Subscription Services Revenues $38.3 $51.9 $46.7 $49.9 $45.7 $65.5 $60.3 $69.6 Subscription Services Revenues $16.4 $17.5 $18.8 $19.9 $21.0 $21.5 $23.0 $24.1 Change in Current Deferred Subscription Services Revenues $(2.0) $13.6 $(5.1) $3.2 $(4.2) $19.8 $(5.2) $9.3 Non-GAAP Current Subscription Billings $14.4 $31.1 $13.7 $23.1 $16.8 $41.3 $17.7 $33.4 Q3 22 Q4 22 Q1 23 Q2 23 Q3 23 Q4 23 Q1 24 Q2 24 Revenues $125.4 $132.6 $121.9 $120.4 $129.5 $124.5 $115.2 $111.4 Cost of Revenues $25.4 $26.7 $27.9 $27.1 $26.7 $28.2 $30.0 $30.9 Operating Expenses $93.9 $299.5 $114.3 $120.0 $128.0 $139.0 $288.9 $280.8 GAAP Income (Loss) from Operations $6.1 $(193.7) $(20.3) $(26.7) $(25.2) $(42.8) $(203.7) $(200.3) GAAP Operating Margin % 5% -146% -17% -22% -20% -34% -177% -180% Share-Based Compensation $16.9 $17.0 $17.6 $15.5 $16.8 $19.7 $17.8 $20.6 Non-GAAP Income (Loss) from Operations $23.0 ($176.7) ($2.8) ($11.2) ($8.4) ($23.1) ($185.9) ($179.6) Non-GAAP Operating Margin % 18% -133% -2% -9% -7% -19% -161% -161% Digital Asset Impairment Losses, Net of Gains on Sale $0.7 $197.6 $18.9 $24.1 $33.6 $39.2 $191.6 $180.1 Non-GAAP Reconciliations ($ in Millions) Q2 2024 Reconciliation of GAAP to non-GAAP income (loss) from operations Reconciliation of subscription services revenues to non-GAAP subscription billings 25
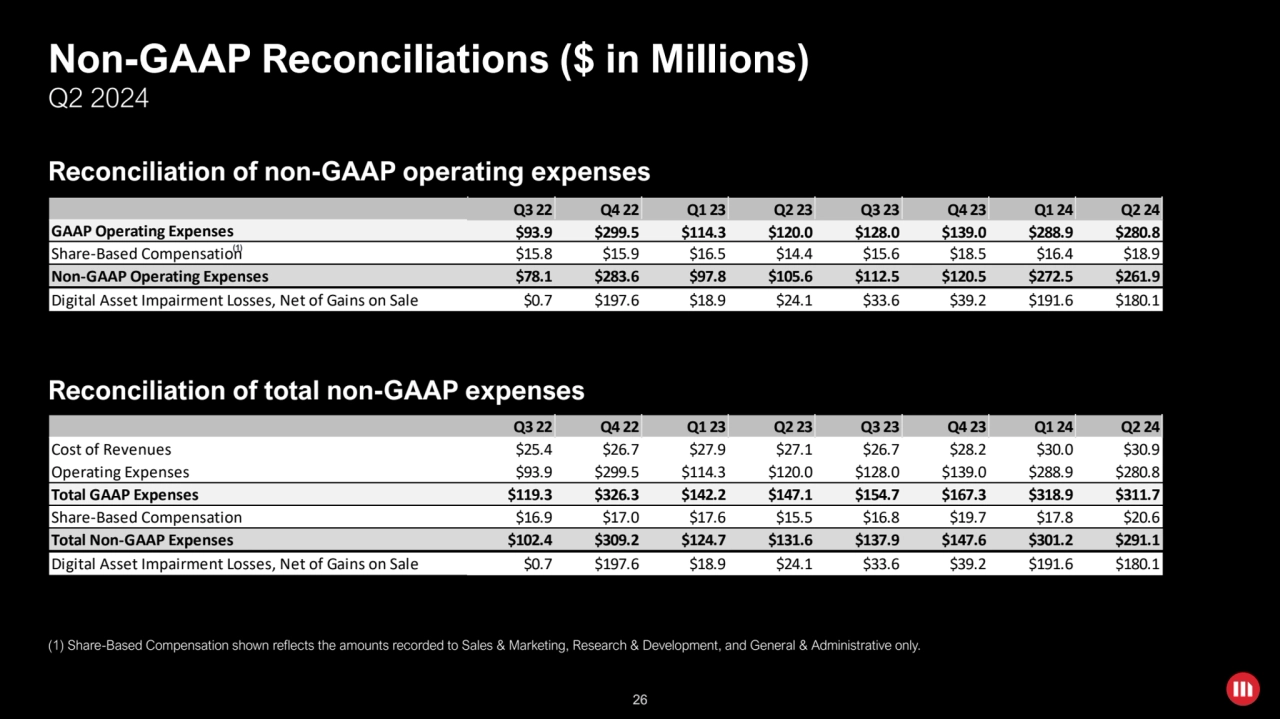
- 26. 26 Q3 22 Q4 22 Q1 23 Q2 23 Q3 23 Q4 23 Q1 24 Q2 24 Cost of Revenues $25.4 $26.7 $27.9 $27.1 $26.7 $28.2 $30.0 $30.9 Operating Expenses $93.9 $299.5 $114.3 $120.0 $128.0 $139.0 $288.9 $280.8 Total GAAP Expenses $119.3 $326.3 $142.2 $147.1 $154.7 $167.3 $318.9 $311.7 Share-Based Compensation $16.9 $17.0 $17.6 $15.5 $16.8 $19.7 $17.8 $20.6 Total Non-GAAP Expenses $102.4 $309.2 $124.7 $131.6 $137.9 $147.6 $301.2 $291.1 Digital Asset Impairment Losses, Net of Gains on Sale $0.7 $197.6 $18.9 $24.1 $33.6 $39.2 $191.6 $180.1 Q3 22 Q4 22 Q1 23 Q2 23 Q3 23 Q4 23 Q1 24 Q2 24 GAAP Operating Expenses $93.9 $299.5 $114.3 $120.0 $128.0 $139.0 $288.9 $280.8 Share-Based Compensation $15.8 $15.9 $16.5 $14.4 $15.6 $18.5 $16.4 $18.9 Non-GAAP Operating Expenses $78.1 $283.6 $97.8 $105.6 $112.5 $120.5 $272.5 $261.9 Digital Asset Impairment Losses, Net of Gains on Sale $0.7 $197.6 $18.9 $24.1 $33.6 $39.2 $191.6 $180.1 Reconciliation of non-GAAP operating expenses (1) Share-Based Compensation shown reflects the amounts recorded to Sales & Marketing, Research & Development, and General & Administrative only. Reconciliation of total non-GAAP expenses (1) Non-GAAP Reconciliations ($ in Millions) Q2 2024 26
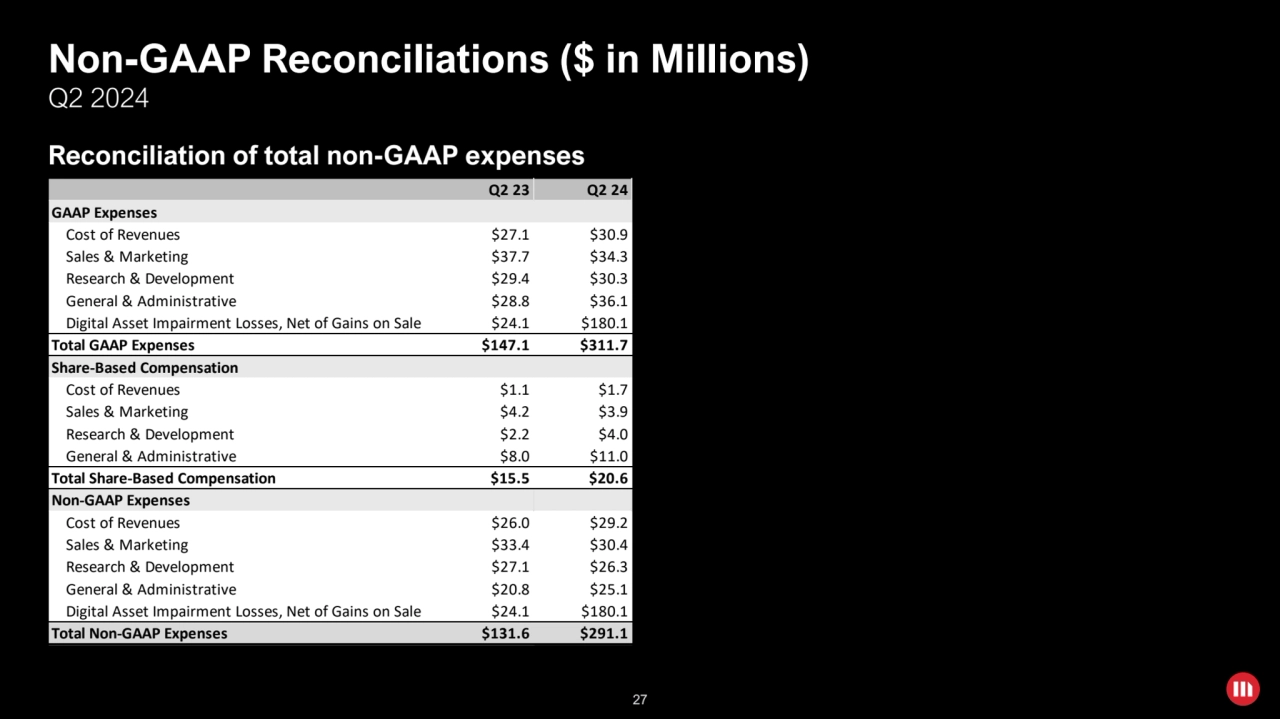
- 27. 27 Q2 23 Q2 24 GAAP Expenses Cost of Revenues $27.1 $30.9 Sales & Marketing $37.7 $34.3 Research & Development $29.4 $30.3 General & Administrative $28.8 $36.1 Digital Asset Impairment Losses, Net of Gains on Sale $24.1 $180.1 Total GAAP Expenses $147.1 $311.7 Share-Based Compensation Cost of Revenues $1.1 $1.7 Sales & Marketing $4.2 $3.9 Research & Development $2.2 $4.0 General & Administrative $8.0 $11.0 Total Share-Based Compensation $15.5 $20.6 Non-GAAP Expenses Cost of Revenues $26.0 $29.2 Sales & Marketing $33.4 $30.4 Research & Development $27.1 $26.3 General & Administrative $20.8 $25.1 Digital Asset Impairment Losses, Net of Gains on Sale $24.1 $180.1 Total Non-GAAP Expenses $131.6 $291.1 Reconciliation of total non-GAAP expenses Non-GAAP Reconciliations ($ in Millions) Q2 2024 27
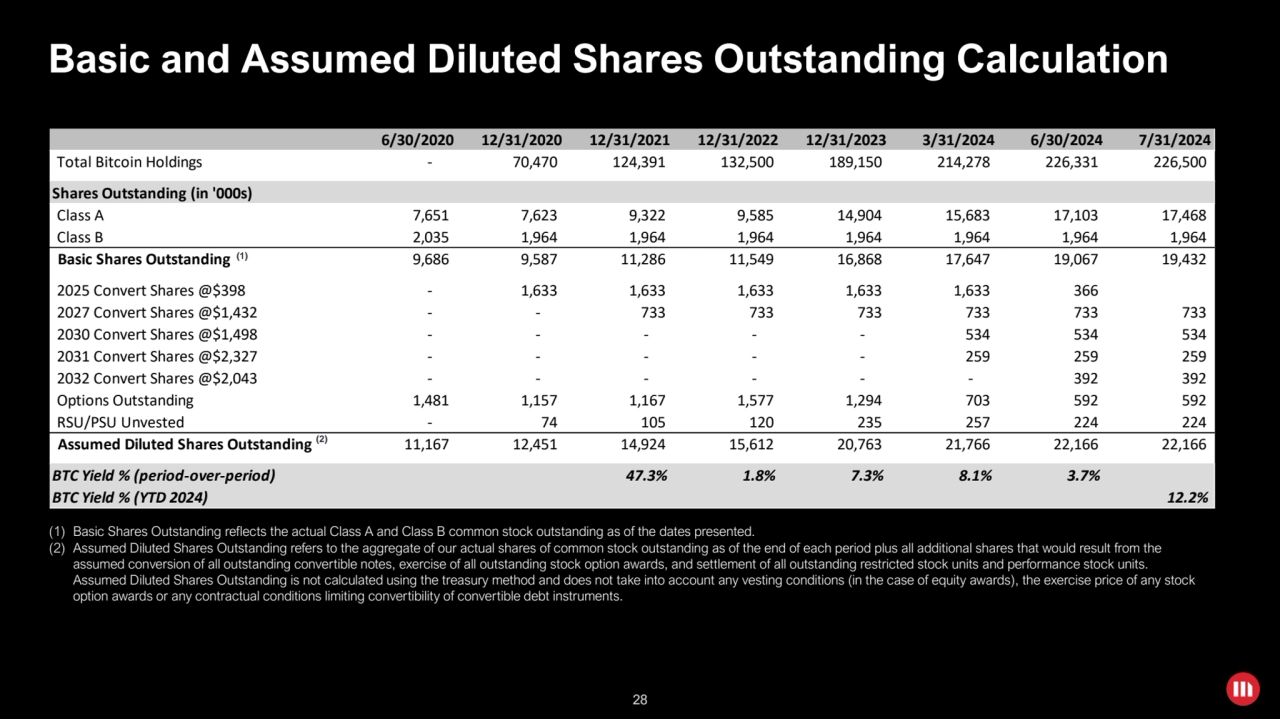
- 28. 28 6/30/2020 12/31/2020 12/31/2021 12/31/2022 12/31/2023 3/31/2024 6/30/2024 7/31/2024 Total Bitcoin Holdings - 70,470 124,391 132,500 189,150 214,278 226,331 226,500 Shares Outstanding (in '000s) Class A 7,651 7,623 9,322 9,585 14,904 15,683 17,103 17,468 Class B 2,035 1,964 1,964 1,964 1,964 1,964 1,964 1,964 Basic Shares Outstanding 9,686 9,587 11,286 11,549 16,868 17,647 19,067 19,432 2025 Convert Shares @$398 - 1,633 1,633 1,633 1,633 1,633 366 2027 Convert Shares @$1,432 - - 733 733 733 733 733 733 2030 Convert Shares @$1,498 - - - - - 534 534 534 2031 Convert Shares @$2,327 - - - - - 259 259 259 2032 Convert Shares @$2,043 - - - - - - 392 392 Options Outstanding 1,481 1,157 1,167 1,577 1,294 703 592 592 RSU/PSU Unvested - 74 105 120 235 257 224 224 Assumed Diluted Shares Outstanding 11,167 12,451 14,924 15,612 20,763 21,766 22,166 22,166 BTC Yield % (period-over-period) 47.3% 1.8% 7.3% 8.1% 3.7% BTC Yield % (YTD 2024) 12.2% Basic and Assumed Diluted Shares Outstanding Calculation (1) Basic Shares Outstanding reflects the actual Class A and Class B common stock outstanding as of the dates presented. (2) Assumed Diluted Shares Outstanding refers to the aggregate of our actual shares of common stock outstanding as of the end of each period plus all additional shares that would result from the assumed conversion of all outstanding convertible notes, exercise of all outstanding stock option awards, and settlement of all outstanding restricted stock units and performance stock units. Assumed Diluted Shares Outstanding is not calculated using the treasury method and does not take into account any vesting conditions (in the case of equity awards), the exercise price of any stock option awards or any contractual conditions limiting convertibility of convertible debt instruments. (1) (2) 28
- 29. 29 Important Information About BTC Yield KPI BTC Yield is a key performance indicator (“KPI”) that represents the % change period-to-period of the ratio between our bitcoin holdings and our Assumed Diluted Shares Outstanding. Assumed Diluted Shares Outstanding refers to the aggregate of our actual shares of common stock outstanding as of the end of each period plus all additional shares that would result from the assumed conversion of all outstanding convertible notes, exercise of all outstanding stock option awards, and settlement of all outstanding restricted stock units and performance stock units. Assumed Diluted Shares Outstanding is not calculated using the treasury method and does not take into account any vesting conditions (in the case of equity awards), the exercise price of any stock option awards or any contractual conditions limiting convertibility of convertible debt instruments. We use BTC Yield as a KPI to help assess the performance of our strategy of acquiring bitcoin in a manner we believe is accretive to shareholders. We believe this KPI can be used to supplement an investor’s understanding of our decision to fund the purchase of bitcoin by issuing additional shares of our common stock or instruments convertible to common stock. When we use this KPI, management also takes into account the various limitations of this metric, including that it does not take into account debt and other liabilities and claims on company assets that would be senior to common equity and that it assumes that all indebtedness will be refinanced or, in the case of our senior convertible debt instruments, converted into shares of common stock in accordance with their respective terms. Additionally, this KPI is not, and should not be understood as, an operating performance measure or a financial or liquidity measure. In particular, BTC Yield is not equivalent to “yield” in the traditional financial context. It is not a measure of the return on investment our shareholders may have achieved historically or can achieve in the future by purchasing our stock, or a measure of income generated by our operations or our bitcoin holdings, return on investment on our bitcoin holdings, or any other similar financial measure of the performance of our business or assets. The trading price of our class A common stock is informed by numerous factors in addition to the amount of bitcoins we hold and number of actual or potential shares of our stock outstanding, and as a result, the market value of our shares may trade at a discount or a premium relative to the market value of the bitcoin we hold, and BTC Yield is not indicative nor predictive of the trading price of our shares of class A common stock. As noted above, this KPI is narrow in its purpose and is used by management to assist it in assessing whether we are using equity capital in a manner accretive to shareholders solely as it pertains to our bitcoin holdings. In calculating this KPI, we do not take into account the source of capital used for the acquisition of our bitcoin. We note in particular, we have acquired bitcoin using proceeds from the offerings of our 6.125% Senior Secured Notes due 2028 (the “Senior Secured Notes”) as well as convertible senior notes, which currently are not exercisable or have conversion prices above our current trading prices, each of which would have the effect of increasing the BTC Yield without taking into account the corresponding debt. Conversely, if any of our convertible senior notes mature or are redeemed without being converted into common stock or we need cash to repay the Senior Secured Notes, we may be required to sell shares in quantities greater than the shares such notes are convertible into or generate cash proceeds from the sale of bitcoin, either of which would have the effect of decreasing the BTC Yield due to changes in our bitcoin holdings and shares in ways that were not contemplated by the assumptions in calculating BTC Yield. Accordingly, this metric might overstate or understate the accretive nature of our use of equity capital to buy bitcoin because not all bitcoin may be acquired using proceeds of equity offerings and not all issuances of equity may involve the acquisition of bitcoin. We determine our KPI targets based on our history and future goals. Our ability to achieve positive BTC Yield may depend on a variety of factors, including our ability to generate cash from operations in excess of our fixed charges and other expenses, as well as factors outside of our control, such as the availability of debt and equity financing on favorable terms. Past performance is not indicative of future results. We have historically not paid any dividends on our shares of common stock, and by presenting this KPI we make no suggestion that we intend to do so in the future. Ownership of common stock does not represent an ownership interest in the bitcoin we hold. Investors should rely on our financial statements and other disclosures contained in our SEC filings. This KPI is merely a supplement, not a substitute. It should be used only by sophisticated investors who understand its limited purpose and many limitations.
- 30. 30 Additional Information MicroStrategy is not an exchange traded product (“ETP”) or an exchange-traded fund (“ETF”) registered under the Investment Company Act of 1940, as amended, is not subject to the same rules and regulations as an ETP or an ETF, and does not operate as an ETP or ETF. In particular, unlike spot bitcoin ETPs, we (i) do not seek for our shares of Class A common stock to track the value of the underlying bitcoin we hold before payment of expenses and liabilities, (ii) do not benefit from various exemptions and relief under the Securities Exchange Act of 1934, as amended, including Regulation M, and other securities laws, which enable spot bitcoin ETPs to continuously align the value of their shares to the price of the underlying bitcoin they hold through share creation and redemption, (iii) are a Delaware corporation rather than a statutory trust, and do not operate pursuant to a trust agreement that would require us to pursue one or more stated investment objectives, (iv) are subject to federal income tax at the entity level and the other risk factors applicable to an operating business, such as ours, and (v) are not required to provide daily transparency as to our bitcoin holdings or our daily NAV.