Q1'25 Earnings Presentation Palo Alto network
 AI Summary
Key Insights
- Palo Alto Networks reported strong Q1 FY'25 financial results, exceeding guidance with top-line metrics.
- The company is seeing success in its platformization strategy, with increased customer adoption and large deal sizes.
- NetSec is driven by SASE and ELA growth, along with innovation, and Cortex growth is fueled by XSIAM momentum.
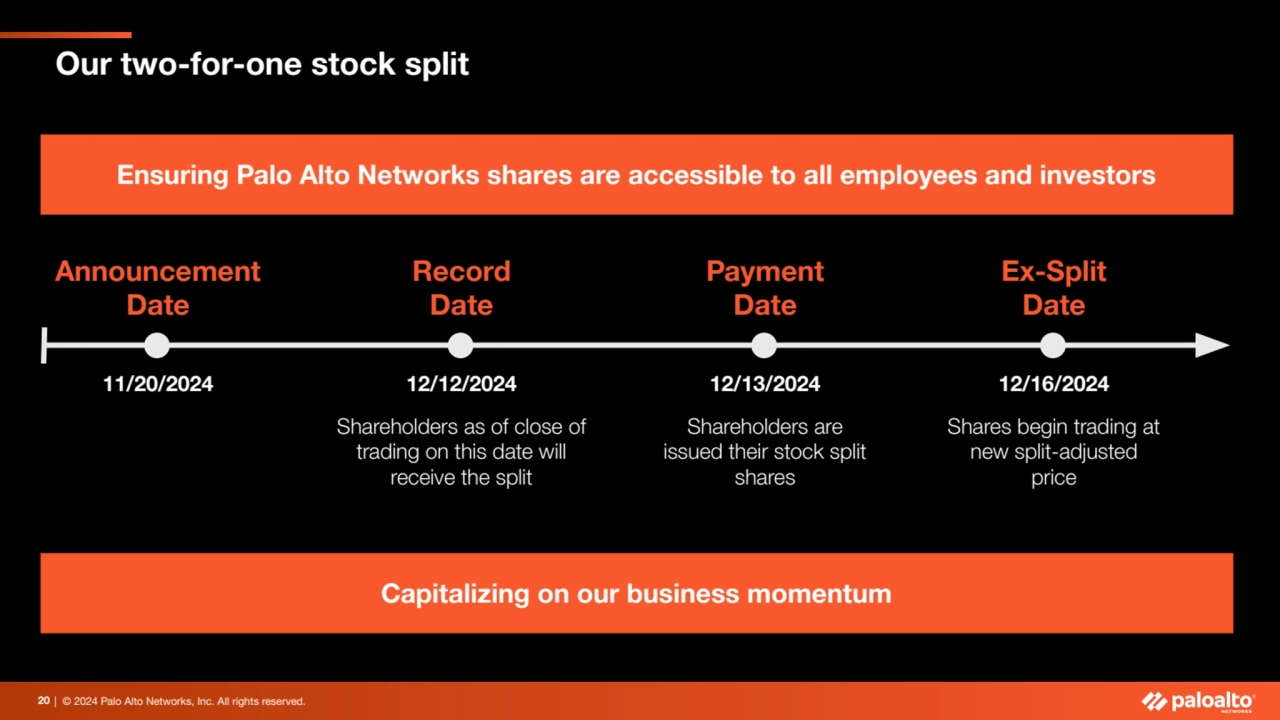
- Q2 FY'25 and FY 2025 guidance were provided, including expectations for NGS ARR, Remaining Performance Obligation (RPO), and revenue. They also announced a two-for-one stock split to increase accessibility for employees and investors.


Q1'25 Earnings Presentation Palo Alto network
- 1. | © 2024 Palo Alto Networks, Inc. All rights reserved. © 2024 Palo Alto Networks, Inc. All rights reserved. Q1 Fiscal Year 2025 Earnings Call November 20, 2024
- 2. | © 2024 Palo Alto Networks, Inc. All rights reserved. Safe Harbor 2 This presentation contains “forward-looking” statements within the meaning of Section 27A of the Securities Act and Section 21E of the Exchange Act, including the cybersecurity threat landscape, expectations regarding our platformization strategy and related progress and opportunities, long-term expectations regarding annual recurring revenue, remaining performance obligation, product development strategy and expectations regarding artificial intelligence (AI), financial guidance for the second quarter of fiscal 2025 and fiscal year 2025, mid and long-term financial expectations, modeling points, business and economic conditions and challenges, and other financial, operational and business expectations. Many of these assumptions relate to matters that are beyond our control and changing rapidly. There are a significant number of factors that could cause actual results to differ materially from forward-looking statements made or implied in this presentation, including: developments and changes in general market, political, economic, and business conditions; failure of our platformization product offerings; failure to achieve the expected benefits of our strategic partnerships and acquisitions; changes in the fair value of our contingence consideration liability associated with such partnerships and acquisitions; risks associated with managing our growth; risks associated with new product, subscription and support offerings, including our product offerings that leverage AI; shifts in priorities or delays in the development or release of new product or subscription or other offerings, or the failure to timely develop and achieve market acceptance of new products and subscriptions as well as existing product, subscription and support offerings; failure of our business strategies, rapidly evolving technological developments in the market for security products, subscriptions and support offerings; defects, errors, or vulnerabilities in our products, subscriptions, or support offerings; our customers’ purchasing decisions and the length of sales cycles; our competition; our ability to attract and retain new customers; our ability to acquire and integrate other companies, products, or technologies in a successful manner; our debt repayment obligations; and our share repurchase program, which may not be fully consummated or enhance shareholder value, and any share repurchases which could affect the price of our common stock. Additional risks and uncertainties on these and other factors that could affect our financial results and the forward-looking statements we make in this presentation are included under the captions “Risk Factors” and “Management’s Discussion and Analysis of Financial Condition and Results of Operations” and elsewhere in our Annual Report on Form 10-K filed with the U.S. Securities and Exchange Commission (“SEC”) on September 6, 2024, which is available on our website at investors.paloaltonetworks.com and on the SEC’s website at www.sec.gov. Additional information will also be set forth in other documents that we file with or furnish to the SEC from time to time. All forward-looking statements in this presentation are based on our beliefs and information available to management as of the date hereof, and we do not assume any obligation to update the forward-looking statements provided to reflect events that occur or circumstances that exist after the date on which they were made. All information in this presentation is as of November 20, 2024. This presentation contains non-GAAP financial measures and key metrics relating to the company’s past and expected future performance. We have not reconciled diluted non-GAAP earnings per share guidance to GAAP earnings per diluted share, non-GAAP operating margin to GAAP operating margin or adjusted free cash flow margin guidance to GAAP net cash from operating activities because we do not provide guidance on GAAP net income (loss) or net cash from operating activities and would not be able to present the various reconciling cash and non-cash items between GAAP and non-GAAP financial measures, including share-based compensation expense, without unreasonable effort.
- 3. | © 2024 Palo Alto Networks, Inc. All rights reserved.
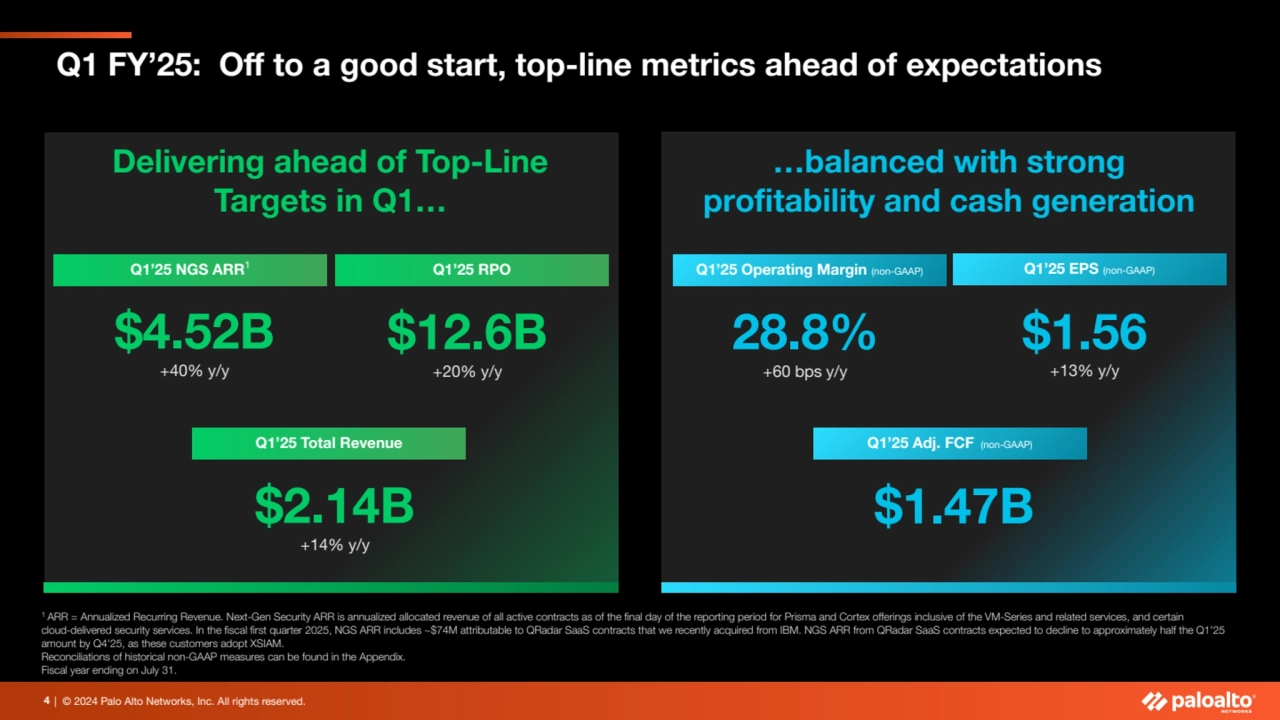
- 4. | © 2024 Palo Alto Networks, Inc. All rights reserved. Q1 FY’25: Off to a good start, top-line metrics ahead of expectations 4 Delivering ahead of Top-Line Targets in Q1… …balanced with strong profitability and cash generation $12.6B +20% y/y $4.52B +40% y/y Q1’25 NGS ARR1 Q1’25 RPO $1.56 +13% y/y 28.8% +60 bps y/y Q1’25 Operating Margin (non-GAAP) Q1’25 EPS (non-GAAP) 1 ARR = Annualized Recurring Revenue. Next-Gen Security ARR is annualized allocated revenue of all active contracts as of the final day of the reporting period for Prisma and Cortex offerings inclusive of the VM-Series and related services, and certain cloud-delivered security services. In the fiscal first quarter 2025, NGS ARR includes ~$74M attributable to QRadar SaaS contracts that we recently acquired from IBM. NGS ARR from QRadar SaaS contracts expected to decline to approximately half the Q1'25 amount by Q4'25, as these customers adopt XSIAM. Reconciliations of historical non-GAAP measures can be found in the Appendix. Fiscal year ending on July 31. $2.14B +14% y/y Q1’25 Total Revenue $1.47B Q1’25 Adj. FCF (non-GAAP)
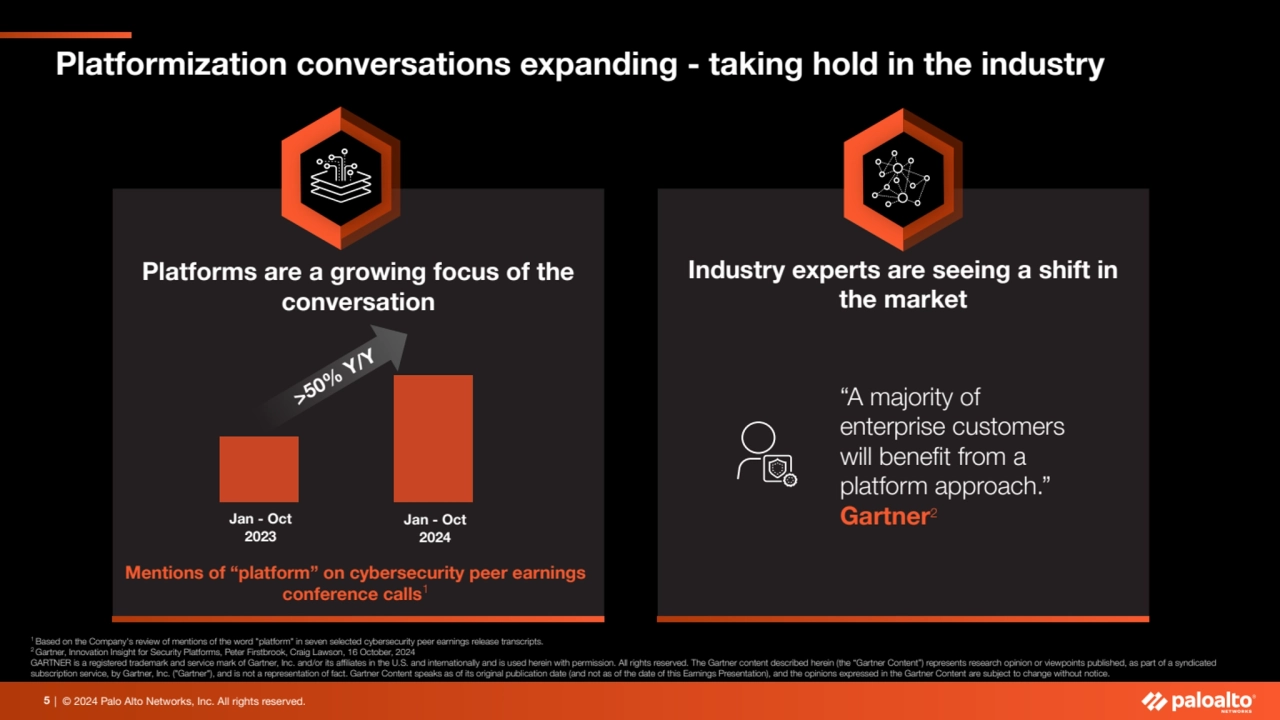
- 5. | © 2024 Palo Alto Networks, Inc. All rights reserved. Platformization conversations expanding - taking hold in the industry Platforms are a growing focus of the conversation 5 Jan - Oct 2023 Jan - Oct 2024 >50% Y/Y Mentions of “platform” on cybersecurity peer earnings conference calls1 1 Based on the Company's review of mentions of the word "platform" in seven selected cybersecurity peer earnings release transcripts. 2 Gartner, Innovation Insight for Security Platforms, Peter Firstbrook, Craig Lawson, 16 October, 2024 GARTNER is a registered trademark and service mark of Gartner, Inc. and/or its affiliates in the U.S. and internationally and is used herein with permission. All rights reserved. The Gartner content described herein (the “Gartner Content”) represents research opinion or viewpoints published, as part of a syndicated subscription service, by Gartner, Inc. ("Gartner"), and is not a representation of fact. Gartner Content speaks as of its original publication date (and not as of the date of this Earnings Presentation), and the opinions expressed in the Gartner Content are subject to change without notice. Industry experts are seeing a shift in the market “A majority of enterprise customers will benefit from a platform approach.” Gartner2
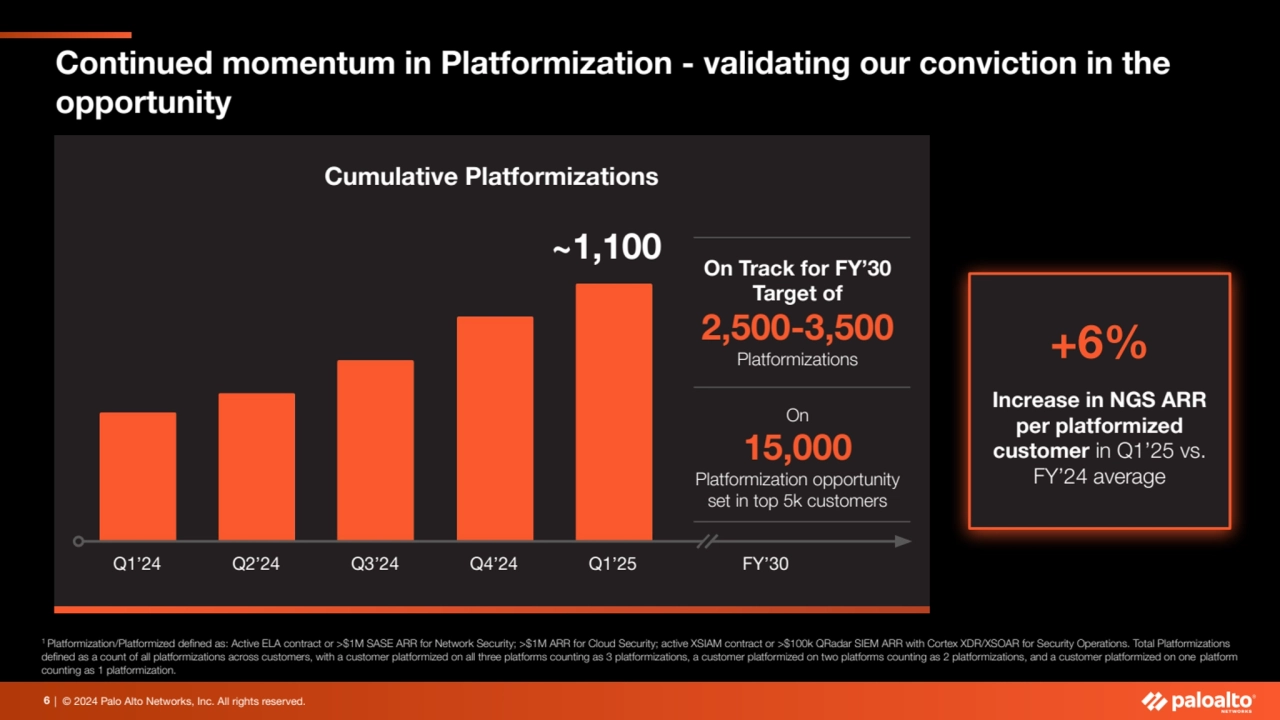
- 6. | © 2024 Palo Alto Networks, Inc. All rights reserved. Cumulative Platformizations Continued momentum in Platformization - validating our conviction in the opportunity 6 1 Platformization/Platformized defined as: Active ELA contract or >$1M SASE ARR for Network Security; >$1M ARR for Cloud Security; active XSIAM contract or >$100k QRadar SIEM ARR with Cortex XDR/XSOAR for Security Operations. Total Platformizations defined as a count of all platformizations across customers, with a customer platformized on all three platforms counting as 3 platformizations, a customer platformized on two platforms counting as 2 platformizations, and a customer platformized on one platform counting as 1 platformization. +6% Increase in NGS ARR per platformized customer in Q1’25 vs. FY’24 average On Track for FY’30 Target of 2,500-3,500 Platformizations On 15,000 Platformization opportunity set in top 5k customers Q1’24 Q2’24 Q3’24 Q4’24 Q1’25 FY’30 ~1,100
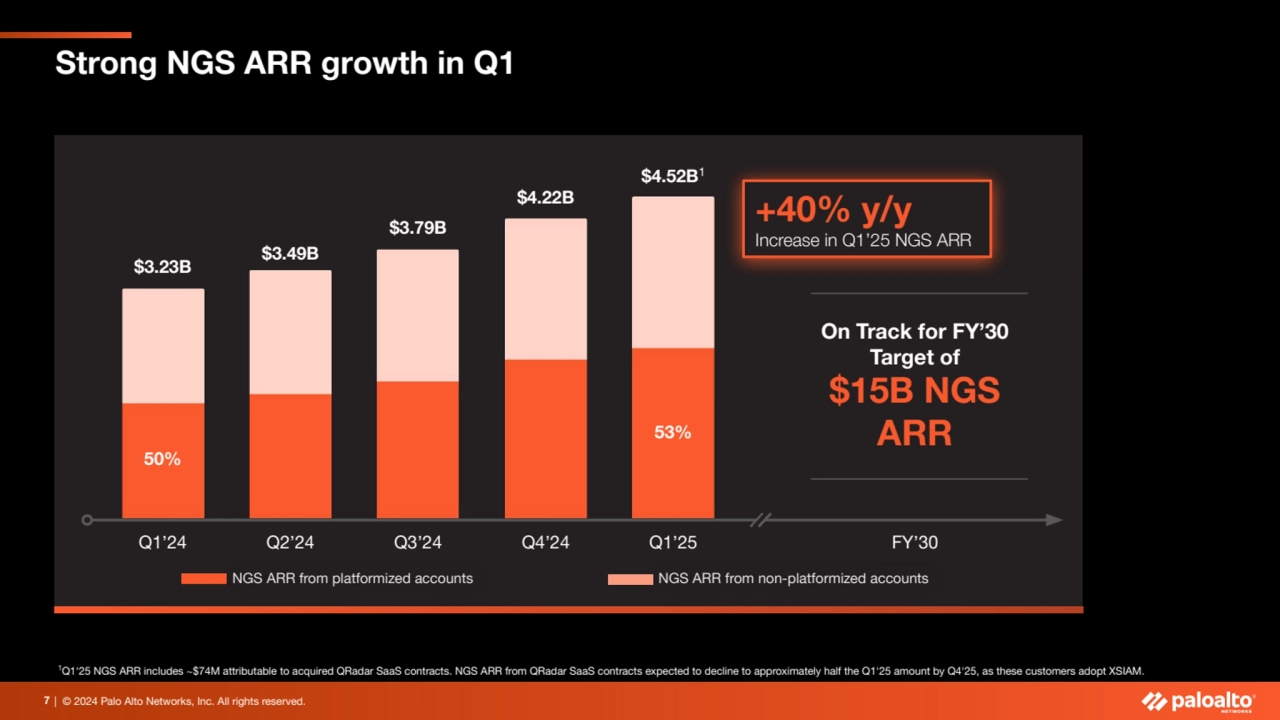
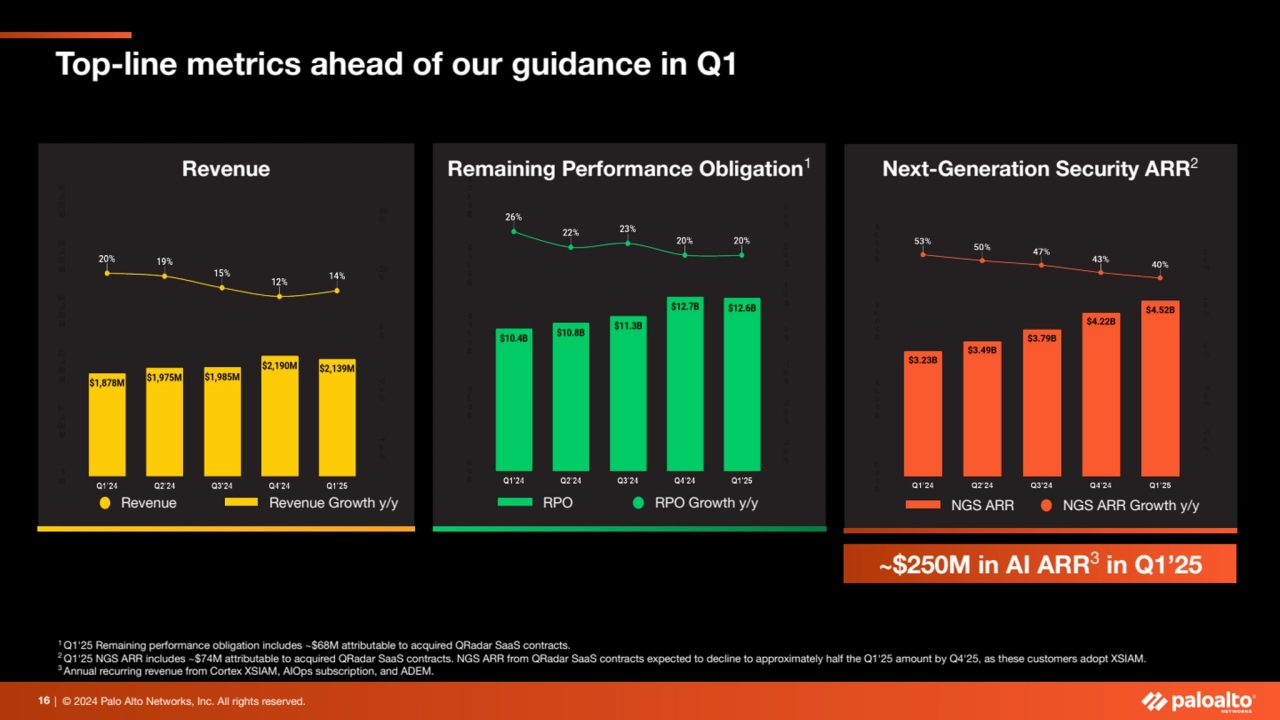
- 7. 7 | © 2024 Palo Alto Networks, Inc. All rights reserved. Q1’24 Q2’24 Q3’24 Q4’24 Q1’25 $3.23B $3.49B $3.79B $4.22B $4.52B1 NGS ARR from platformized accounts NGS ARR from non-platformized accounts FY’30 On Track for FY’30 Target of $15B NGS ARR +40% y/y Increase in Q1’25 NGS ARR 1Q1'25 NGS ARR includes ~$74M attributable to acquired QRadar SaaS contracts. NGS ARR from QRadar SaaS contracts expected to decline to approximately half the Q1'25 amount by Q4'25, as these customers adopt XSIAM. 50% 53% Strong NGS ARR growth in Q1
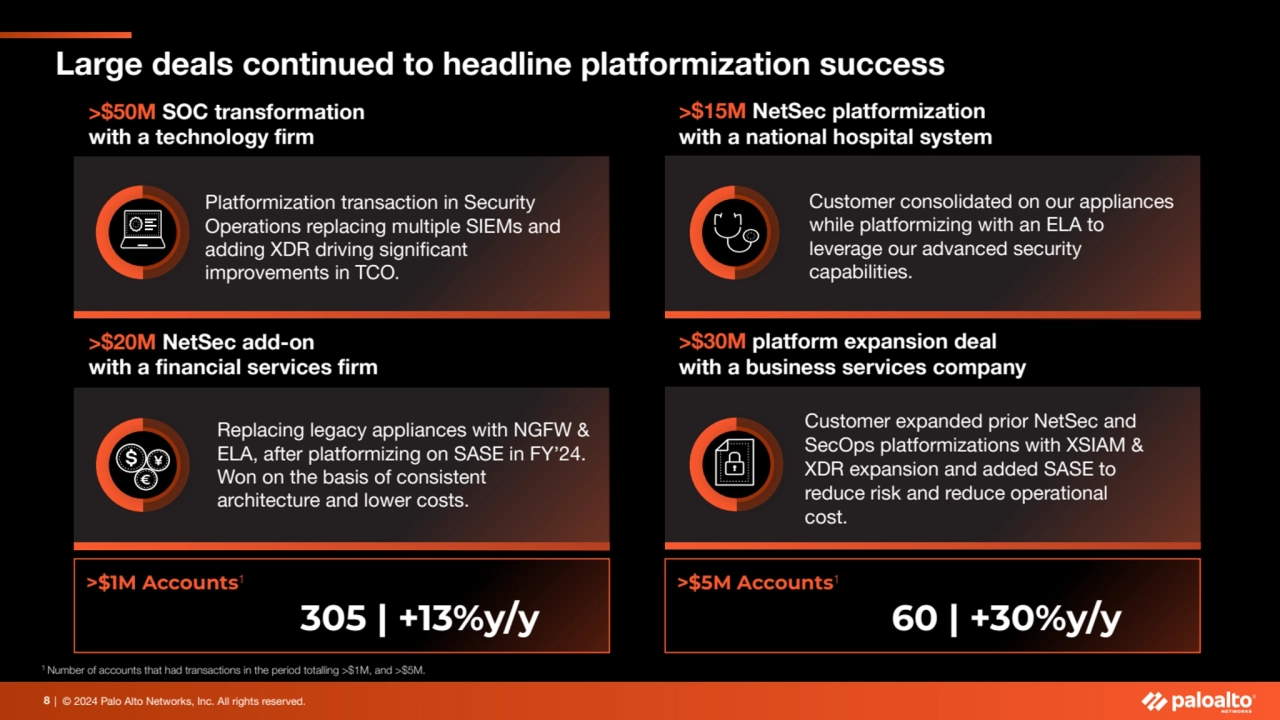
- 8. | © 2024 Palo Alto Networks, Inc. All rights reserved. Customer consolidated on our appliances while platformizing with an ELA to leverage our advanced security capabilities. 8 Replacing legacy appliances with NGFW & ELA, after platformizing on SASE in FY’24. Won on the basis of consistent architecture and lower costs. Large deals continued to headline platformization success Customer expanded prior NetSec and SecOps platformizations with XSIAM & XDR expansion and added SASE to reduce risk and reduce operational cost. >$30M platform expansion deal with a business services company >$15M NetSec platformization with a national hospital system >$20M NetSec add-on with a financial services firm Platformization transaction in Security Operations replacing multiple SIEMs and adding XDR driving significant improvements in TCO. >$50M SOC transformation with a technology firm >$1M Accounts1 >$5M Accounts1 305 | +13%y/y 60 | +30%y/y 1 Number of accounts that had transactions in the period totalling >$1M, and >$5M.
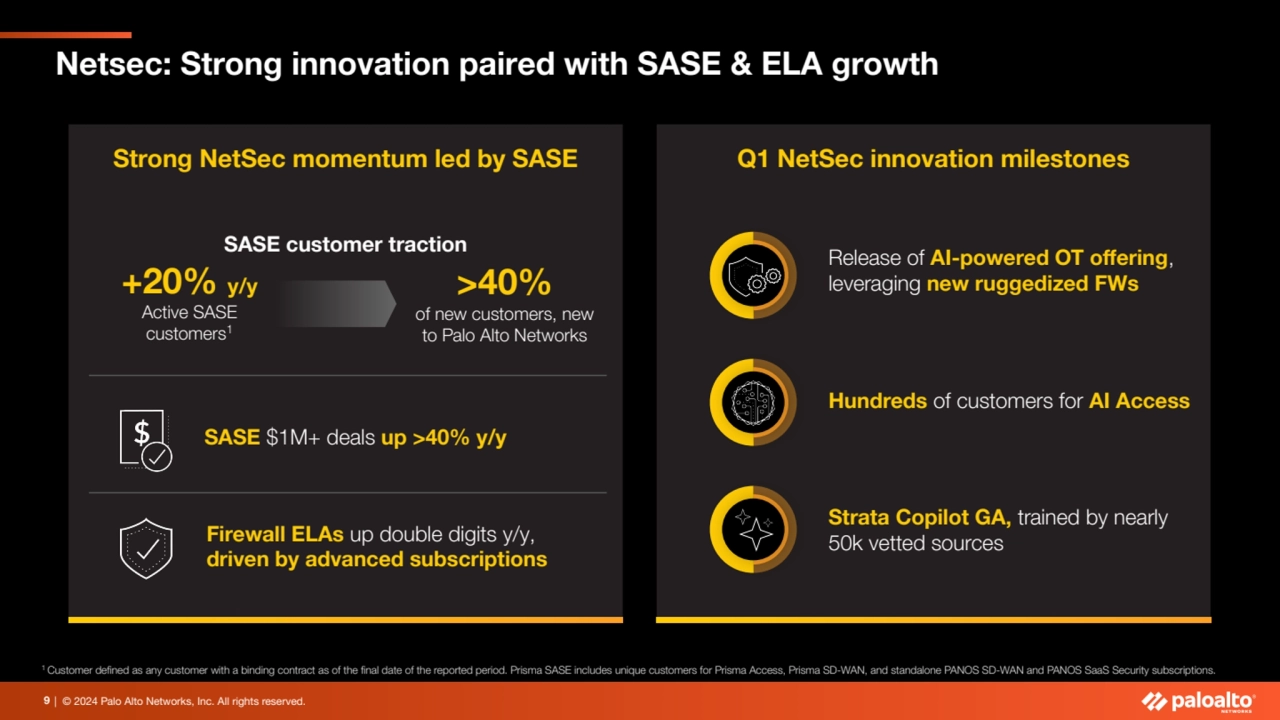
- 9. | © 2024 Palo Alto Networks, Inc. All rights reserved. Strong NetSec momentum led by SASE 9 Q1 NetSec innovation milestones Firewall ELAs up double digits y/y, driven by advanced subscriptions SASE $1M+ deals up >40% y/y Hundreds of customers for AI Access Release of AI-powered OT offering, leveraging new ruggedized FWs Strata Copilot GA, trained by nearly 50k vetted sources 1 Customer defined as any customer with a binding contract as of the final date of the reported period. Prisma SASE includes unique customers for Prisma Access, Prisma SD-WAN, and standalone PANOS SD-WAN and PANOS SaaS Security subscriptions. +20% y/y Active SASE customers1 SASE customer traction >40% of new customers, new to Palo Alto Networks Netsec: Strong innovation paired with SASE & ELA growth
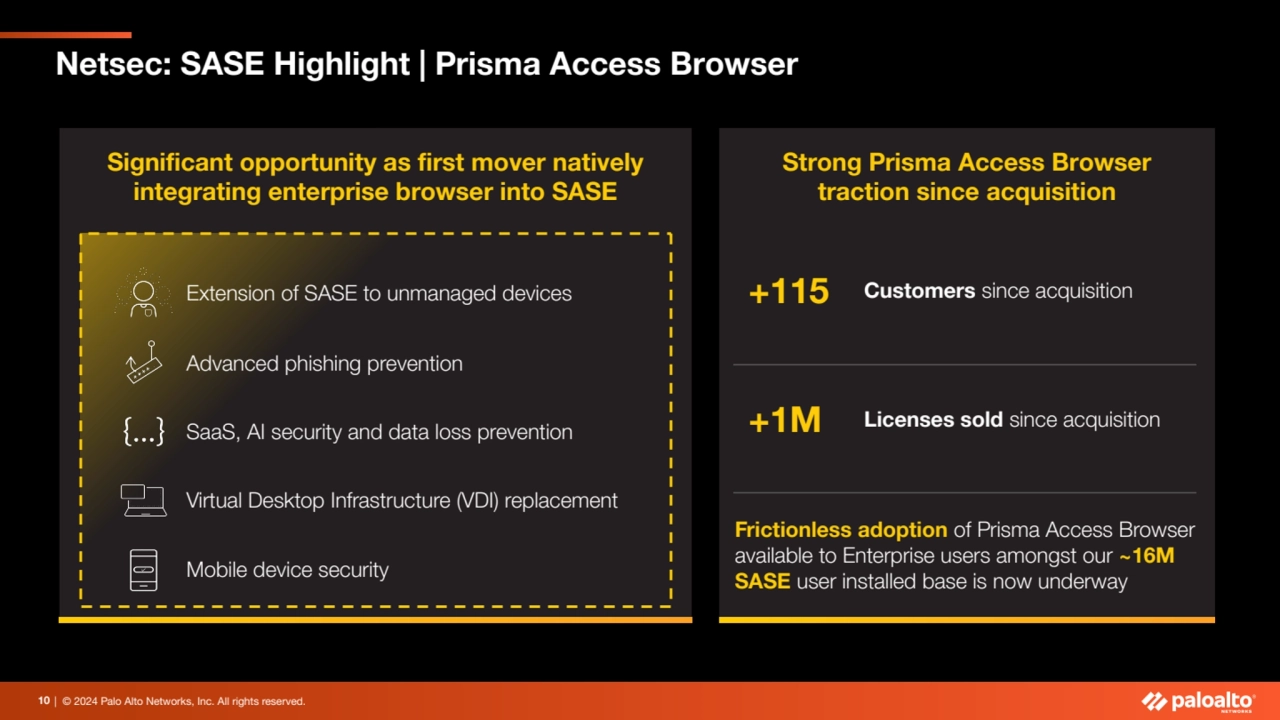
- 10. 10 | © 2024 Palo Alto Networks, Inc. All rights reserved. Strong Prisma Access Browser traction since acquisition +1M Licenses sold since acquisition Significant opportunity as first mover natively integrating enterprise browser into SASE Virtual Desktop Infrastructure (VDI) replacement Advanced phishing prevention Mobile device security SaaS, AI security and data loss prevention +115 Customers since acquisition Frictionless adoption of Prisma Access Browser available to Enterprise users amongst our ~16M SASE user installed base is now underway Extension of SASE to unmanaged devices Netsec: SASE Highlight | Prisma Access Browser
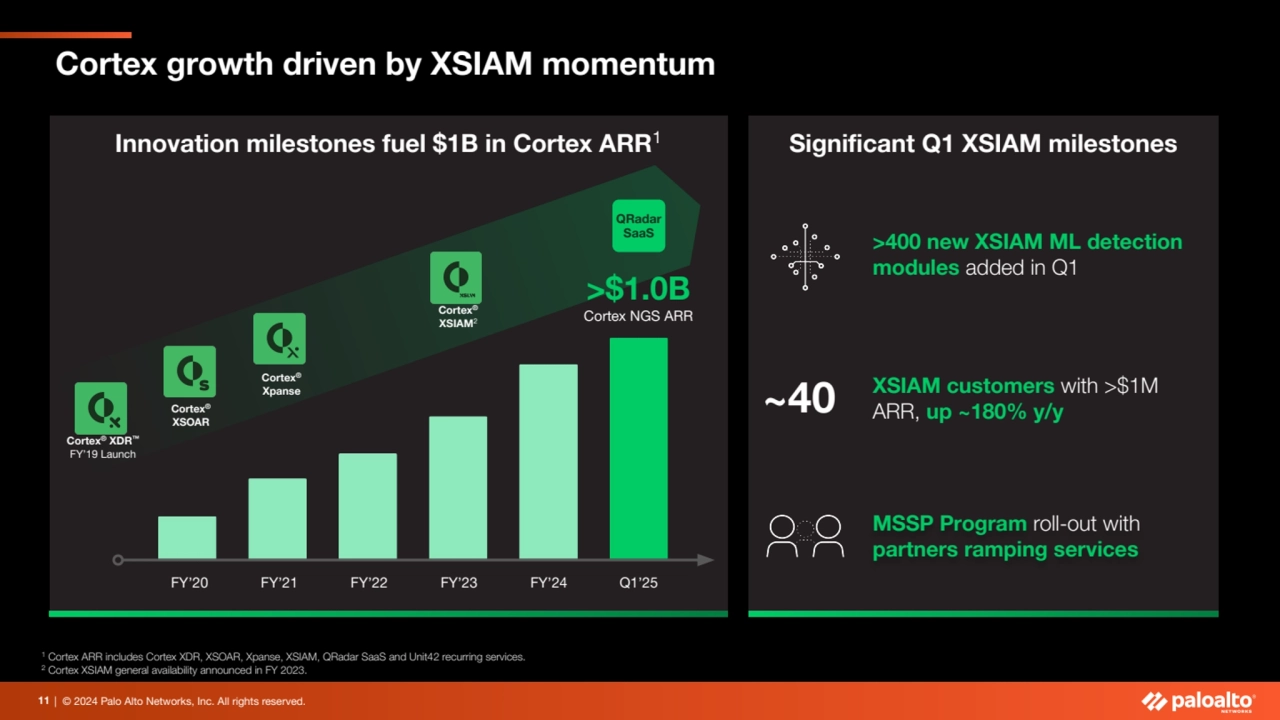
- 11. | © 2024 Palo Alto Networks, Inc. All rights reserved. Innovation milestones fuel $1B in Cortex ARR1 Significant Q1 XSIAM milestones 11 1 Cortex ARR includes Cortex XDR, XSOAR, Xpanse, XSIAM, QRadar SaaS and Unit42 recurring services. 2 Cortex XSIAM general availability announced in FY 2023. MSSP Program roll-out with partners ramping services XSIAM customers with >$1M ARR, up ~180% y/y >400 new XSIAM ML detection modules added in Q1 ~40 FY’20 Cortex® XDR™ FY’19 Launch FY’21 FY’22 FY’23 FY’24 Q1’25 >$1.0B Cortex NGS ARR Cortex® XSOAR Cortex® Xpanse Cortex® XSIAM2 Cortex growth driven by XSIAM momentum QRadar SaaS
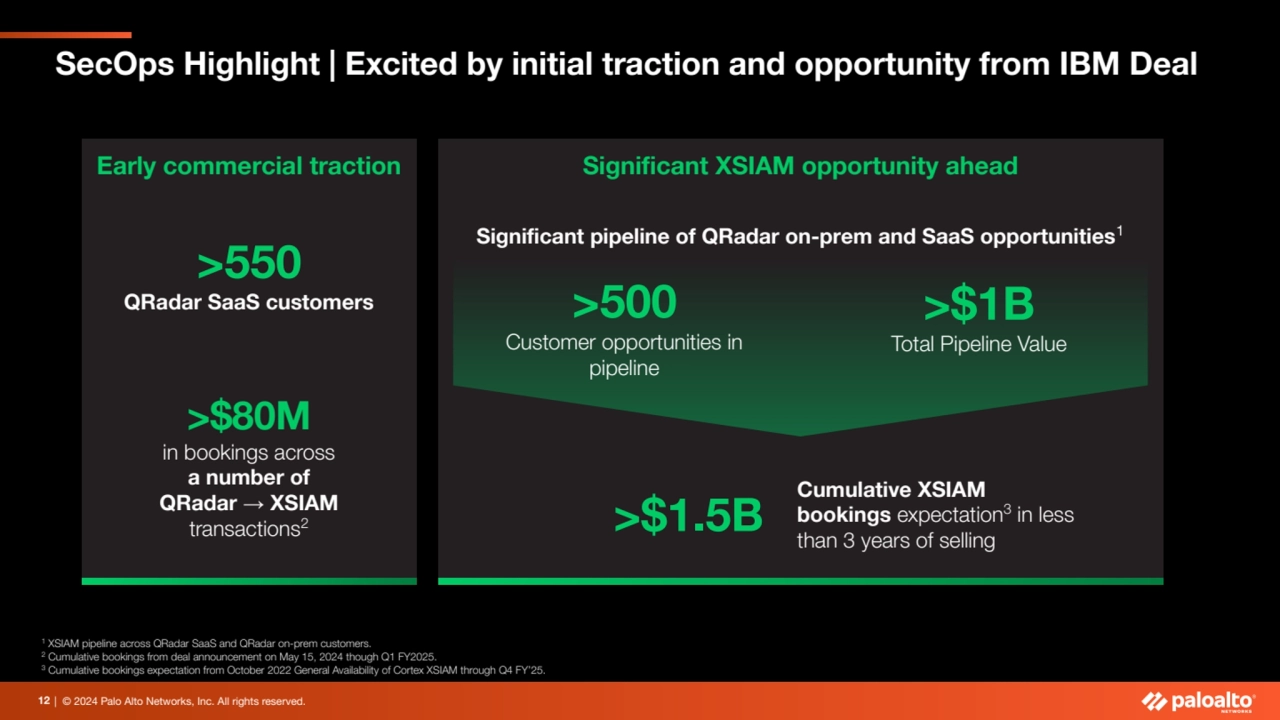
- 12. | © 2024 Palo Alto Networks, Inc. All rights reserved. Early commercial traction Significant XSIAM opportunity ahead SecOps Highlight | Excited by initial traction and opportunity from IBM Deal 12 >500 Customer opportunities in pipeline 1 XSIAM pipeline across QRadar SaaS and QRadar on-prem customers. 2 Cumulative bookings from deal announcement on May 15, 2024 though Q1 FY2025. 3 Cumulative bookings expectation from October 2022 General Availability of Cortex XSIAM through Q4 FY’25. Significant pipeline of QRadar on-prem and SaaS opportunities1 >$1B Total Pipeline Value >550 QRadar SaaS customers >$80M in bookings across a number of QRadar → XSIAM transactions2 Cumulative XSIAM bookings expectation3 in less than 3 years of selling >$1.5B
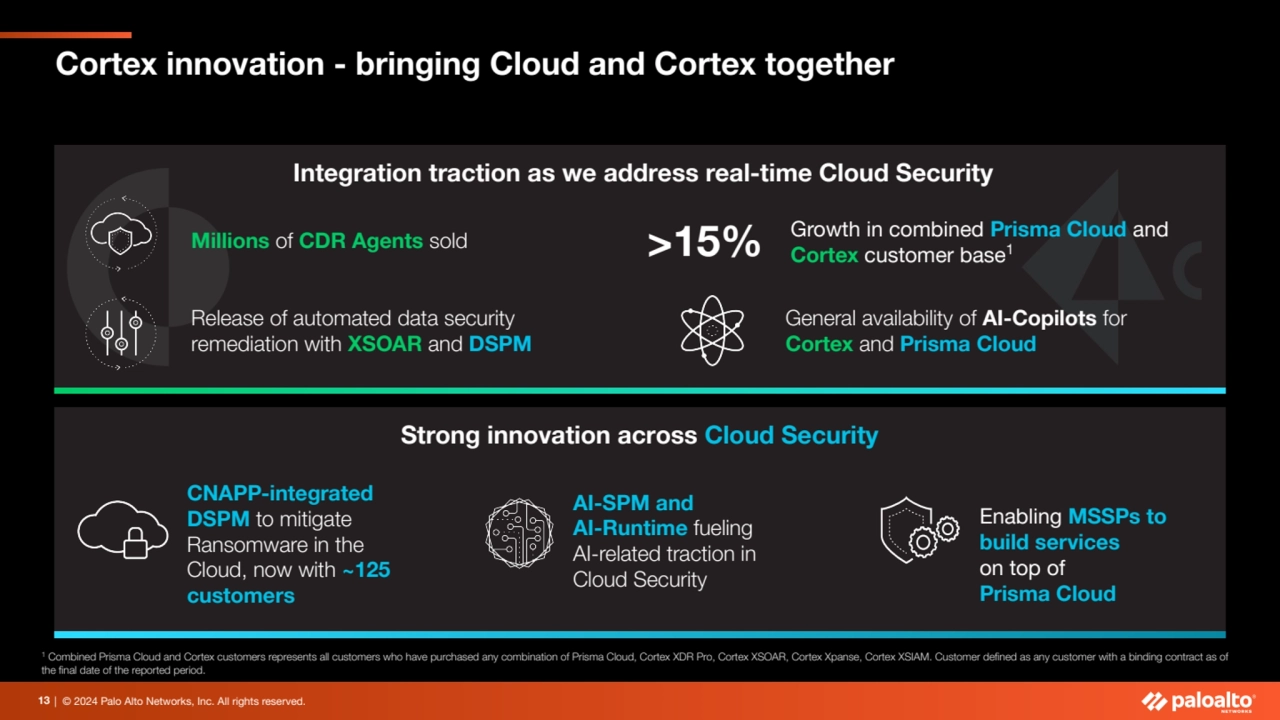
- 13. | © 2024 Palo Alto Networks, Inc. All rights reserved. Strong innovation across Cloud Security Integration traction as we address real-time Cloud Security 13 >15% Growth in combined Prisma Cloud and Cortex customer base Millions 1 of CDR Agents sold General availability of AI-Copilots for Cortex and Prisma Cloud CNAPP-integrated DSPM to mitigate Ransomware in the Cloud, now with ~125 customers AI-SPM and AI-Runtime fueling AI-related traction in Cloud Security Release of automated data security remediation with XSOAR and DSPM Enabling MSSPs to build services on top of Prisma Cloud 1 Combined Prisma Cloud and Cortex customers represents all customers who have purchased any combination of Prisma Cloud, Cortex XDR Pro, Cortex XSOAR, Cortex Xpanse, Cortex XSIAM. Customer defined as any customer with a binding contract as of the final date of the reported period. Cortex innovation - bringing Cloud and Cortex together
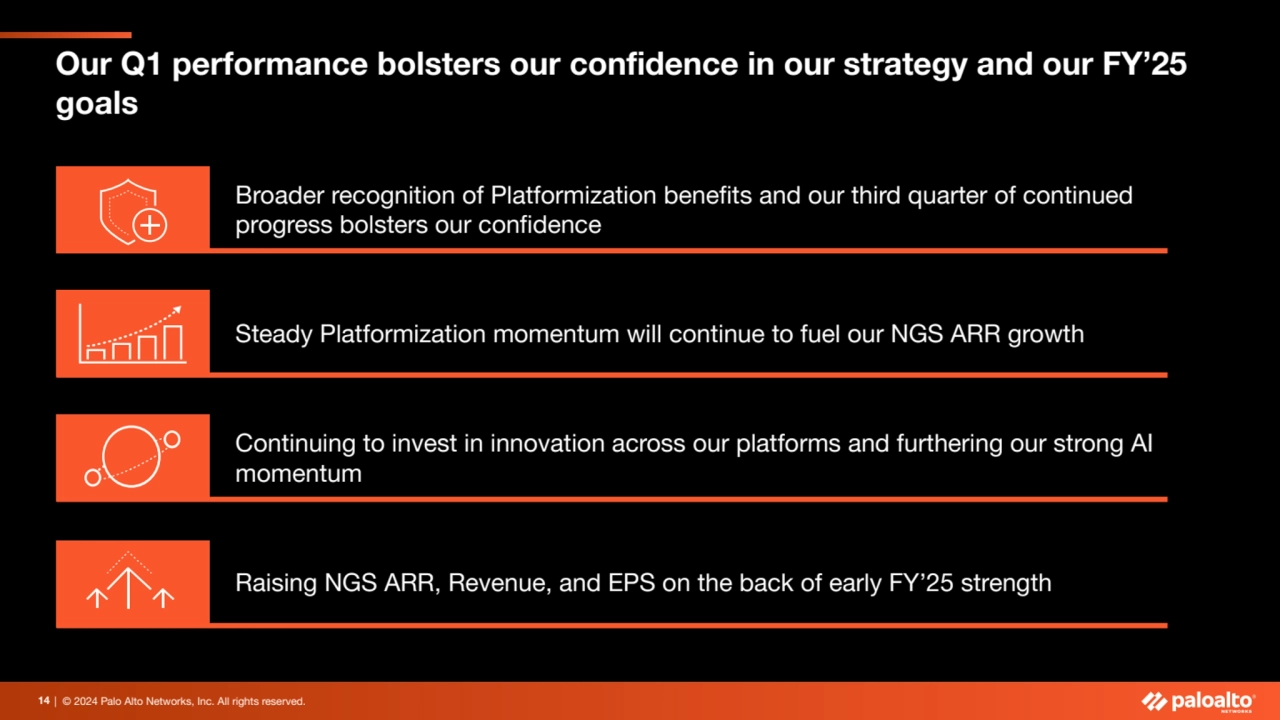
- 14. 14 | © 2024 Palo Alto Networks, Inc. All rights reserved. Our Q1 performance bolsters our confidence in our strategy and our FY’25 goals Continuing to invest in innovation across our platforms and furthering our strong AI momentum Broader recognition of Platformization benefits and our third quarter of continued progress bolsters our confidence Raising NGS ARR, Revenue, and EPS on the back of early FY’25 strength Steady Platformization momentum will continue to fuel our NGS ARR growth
- 15. | © 2024 Palo Alto Networks, Inc. All rights reserved.
- 16. 16 | © 2024 Palo Alto Networks, Inc. All rights reserved. Top-line metrics ahead of our guidance in Q1 Remaining Performance Obligation1 RPO ~$250M in AI ARR3 in Q1’25 RPO Growth y/y Next-Generation Security ARR2 NGS ARR NGS ARR Growth y/y Revenue Revenue Revenue Growth y/y 1 Q1'25 Remaining performance obligation includes ~$68M attributable to acquired QRadar SaaS contracts. 2 Q1'25 NGS ARR includes ~$74M attributable to acquired QRadar SaaS contracts. NGS ARR from QRadar SaaS contracts expected to decline to approximately half the Q1'25 amount by Q4'25, as these customers adopt XSIAM. 3 Annual recurring revenue from Cortex XSIAM, AIOps subscription, and ADEM.
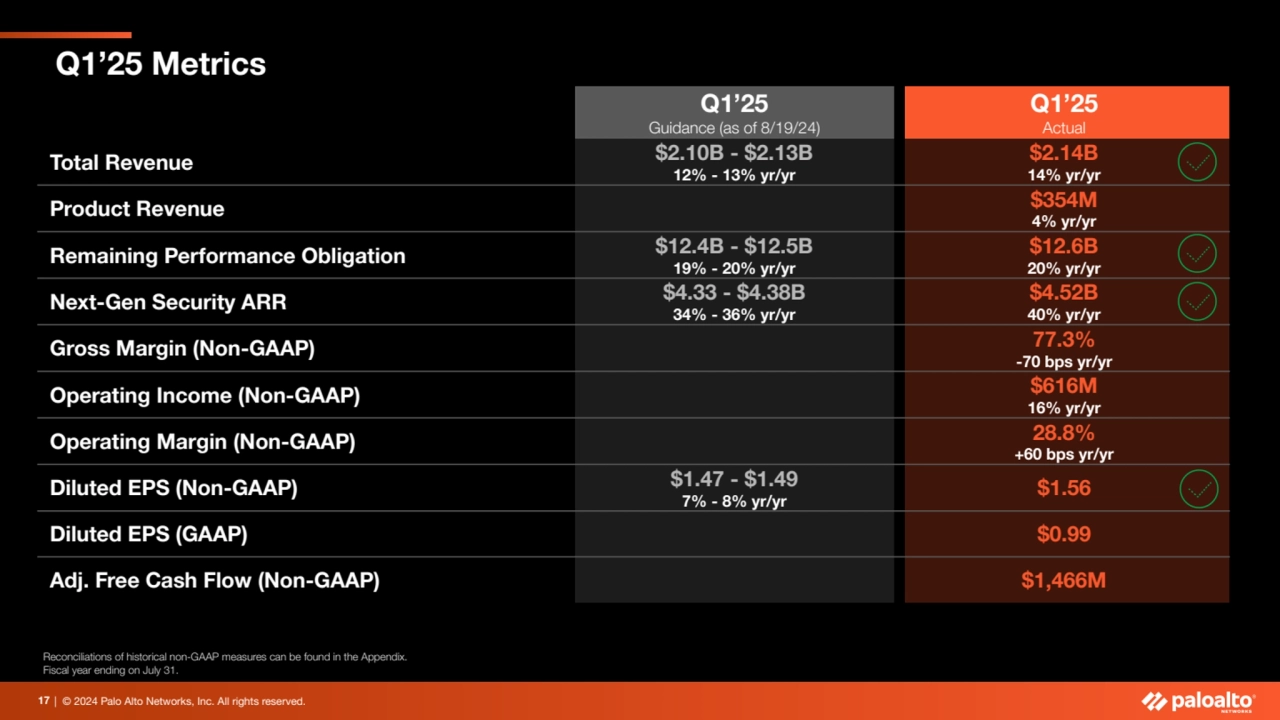
- 17. | © 2024 Palo Alto Networks, Inc. All rights reserved. Q1’25 Metrics 17 Q1’25 Guidance (as of 8/19/24) Q1’25 Actual Total Revenue $2.10B - $2.13B 12% - 13% yr/yr $2.14B 14% yr/yr Product Revenue $354M 4% yr/yr Remaining Performance Obligation $12.4B - $12.5B 19% - 20% yr/yr $12.6B 20% yr/yr Next-Gen Security ARR $4.33 - $4.38B 34% - 36% yr/yr $4.52B 40% yr/yr Gross Margin (Non-GAAP) 77.3% -70 bps yr/yr Operating Income (Non-GAAP) $616M 16% yr/yr Operating Margin (Non-GAAP) 28.8% +60 bps yr/yr Diluted EPS (Non-GAAP) $1.47 - $1.49 7% - 8% yr/yr $1.56 Diluted EPS (GAAP) $0.99 Adj. Free Cash Flow (Non-GAAP) $1,466M Reconciliations of historical non-GAAP measures can be found in the Appendix. Fiscal year ending on July 31.
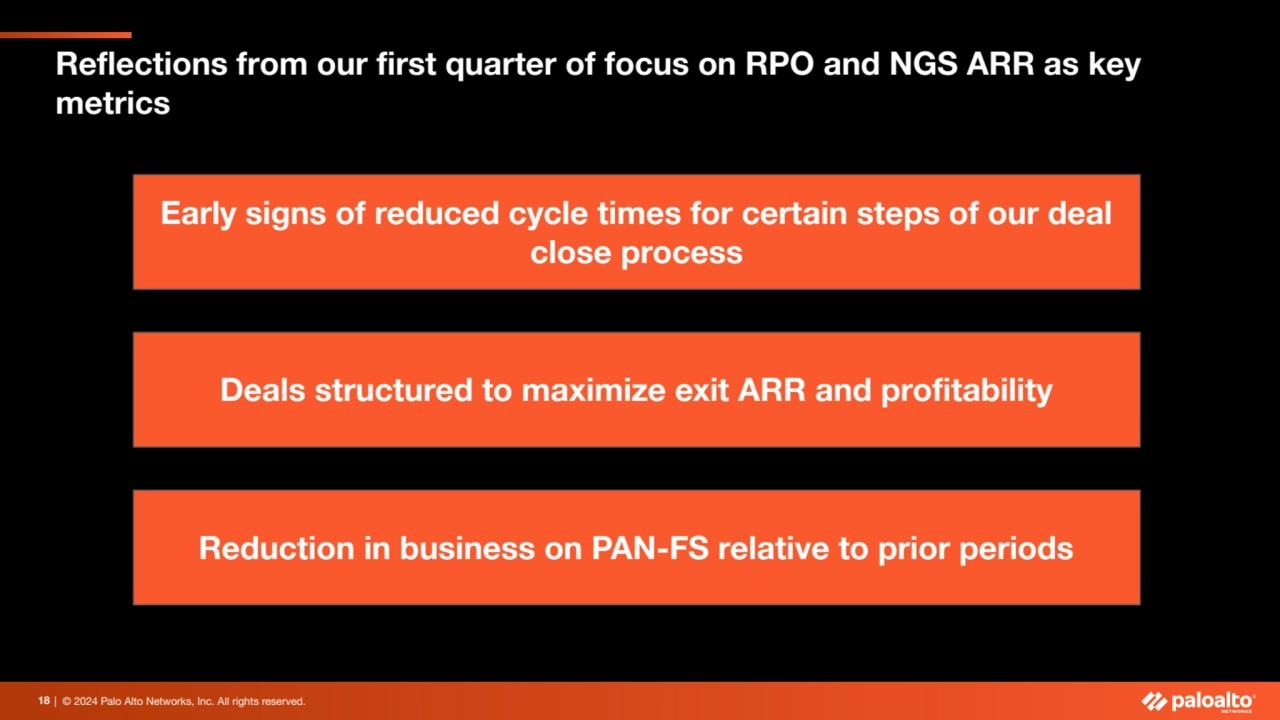
- 18. | © 2024 Palo Alto Networks, Inc. All rights reserved. Reflections from our first quarter of focus on RPO and NGS ARR as key metrics Deals structured to maximize exit ARR and profitability 18 Early signs of reduced cycle times for certain steps of our deal close process Reduction in business on PAN-FS relative to prior periods
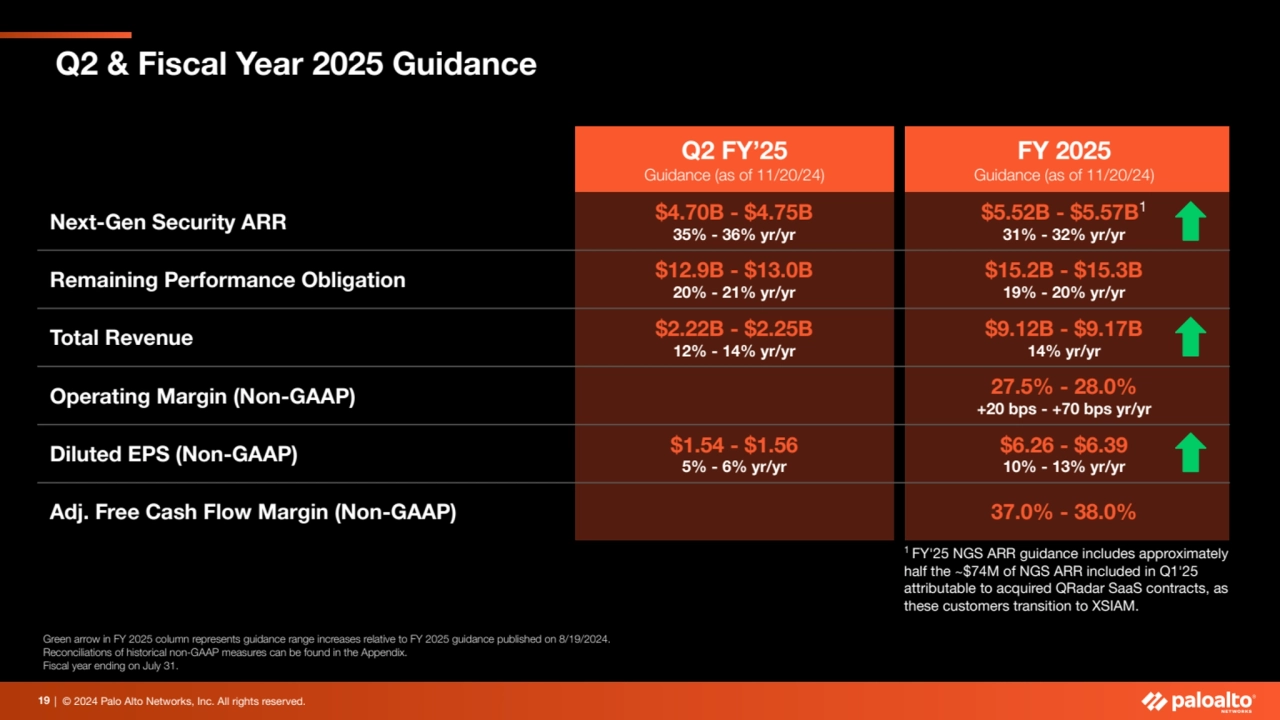
- 19. | © 2024 Palo Alto Networks, Inc. All rights reserved. Q2 & Fiscal Year 2025 Guidance 19 Q2 FY’25 Guidance (as of 11/20/24) FY 2025 Guidance (as of 11/20/24) Next-Gen Security ARR $4.70B - $4.75B 35% - 36% yr/yr $5.52B - $5.57B1 31% - 32% yr/yr Remaining Performance Obligation $12.9B - $13.0B 20% - 21% yr/yr $15.2B - $15.3B 19% - 20% yr/yr Total Revenue $2.22B - $2.25B 12% - 14% yr/yr $9.12B - $9.17B 14% yr/yr Operating Margin (Non-GAAP) 27.5% - 28.0% +20 bps - +70 bps yr/yr Diluted EPS (Non-GAAP) $1.54 - $1.56 5% - 6% yr/yr $6.26 - $6.39 10% - 13% yr/yr Adj. Free Cash Flow Margin (Non-GAAP) 37.0% - 38.0% Green arrow in FY 2025 column represents guidance range increases relative to FY 2025 guidance published on 8/19/2024. Reconciliations of historical non-GAAP measures can be found in the Appendix. Fiscal year ending on July 31. 1 FY'25 NGS ARR guidance includes approximately half the ~$74M of NGS ARR included in Q1'25 attributable to acquired QRadar SaaS contracts, as these customers transition to XSIAM.
- 20. 20 | © 2024 Palo Alto Networks, Inc. All rights reserved. Our two-for-one stock split Announcement Date 11/20/2024 12/12/2024 Record Date Shareholders as of close of trading on this date will receive the split 12/13/2024 Payment Date Shareholders are issued their stock split shares 12/16/2024 Ex-Split Date Shares begin trading at new split-adjusted price Ensuring Palo Alto Networks shares are accessible to all employees and investors Capitalizing on our business momentum
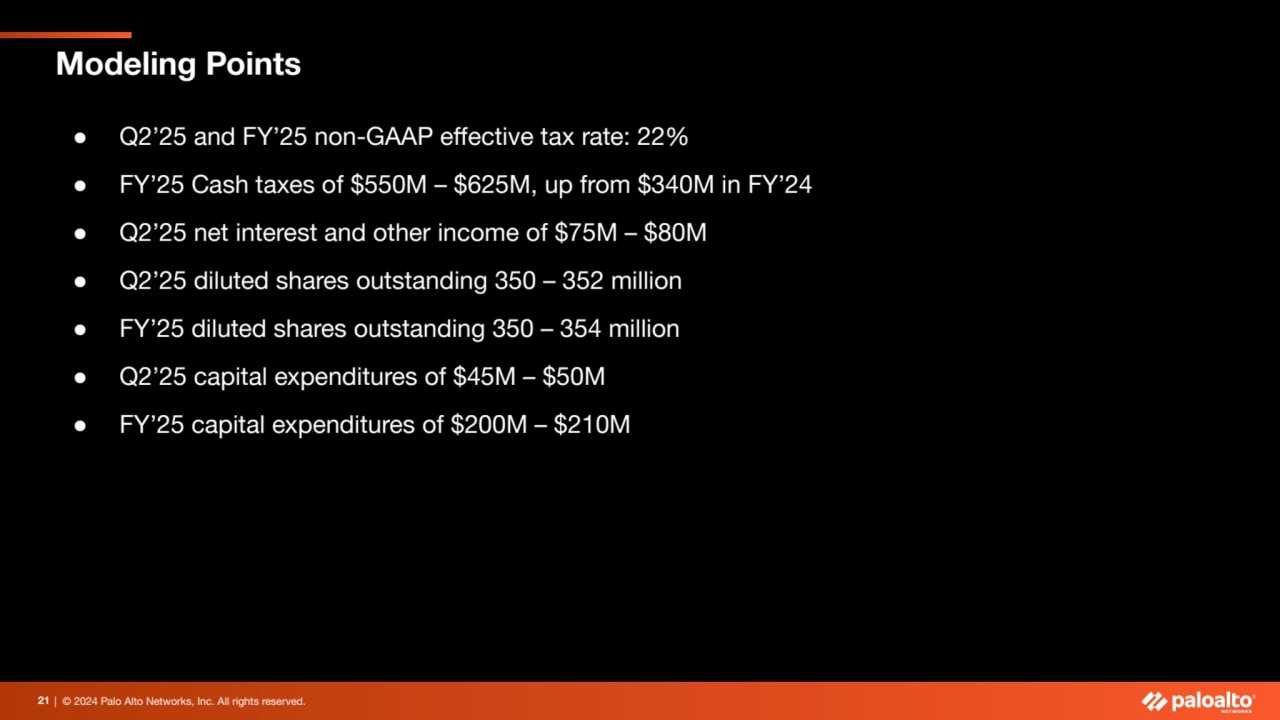
- 21. | © 2024 Palo Alto Networks, Inc. All rights reserved. Modeling Points 21 ● Q2’25 and FY’25 non-GAAP effective tax rate: 22% ● FY’25 Cash taxes of $550M – $625M, up from $340M in FY’24 ● Q2’25 net interest and other income of $75M – $80M ● Q2’25 diluted shares outstanding 350 – 352 million ● FY’25 diluted shares outstanding 350 – 354 million ● Q2’25 capital expenditures of $45M – $50M ● FY’25 capital expenditures of $200M – $210M
- 22. | © 2024 Palo Alto Networks, Inc. All rights reserved. © 2024 Palo Alto Networks, Inc. Q&A
- 23. | © 2024 Palo Alto Networks, Inc. All rights reserved. © 2024 Palo Alto Networks, Inc. Appendix
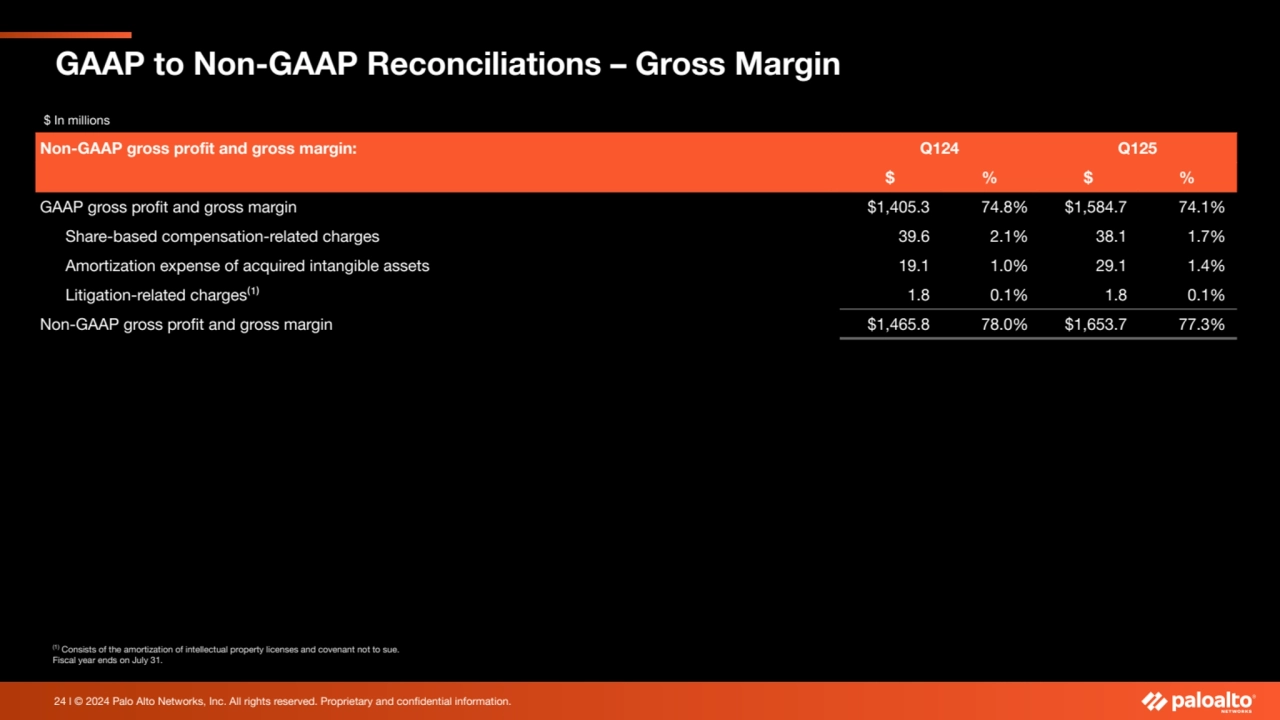
- 24. 24 l © 2024 Palo Alto Networks, Inc. All rights reserved. Proprietary and confidential information. GAAP to Non-GAAP Reconciliations – Gross Margin (1) Consists of the amortization of intellectual property licenses and covenant not to sue. Fiscal year ends on July 31. $ In millions Non-GAAP gross profit and gross margin: Q124 Q125 $ % $ % GAAP gross profit and gross margin $1,405.3 74.8% $1,584.7 74.1% Share-based compensation-related charges 39.6 2.1% 38.1 1.7% Amortization expense of acquired intangible assets 19.1 1.0% 29.1 1.4% Litigation-related charges⁽¹⁾ 1.8 0.1% 1.8 0.1% Non-GAAP gross profit and gross margin $1,465.8 78.0% $1,653.7 77.3%
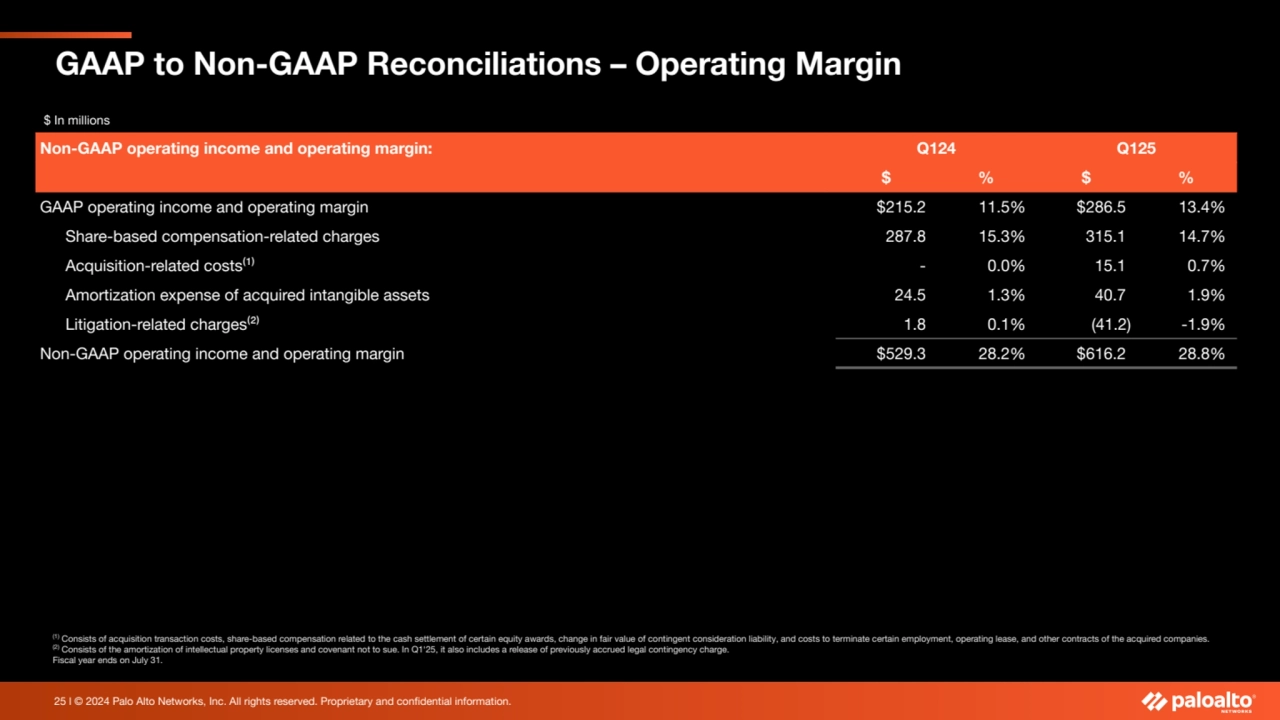
- 25. 25 l © 2024 Palo Alto Networks, Inc. All rights reserved. Proprietary and confidential information. (1) Consists of acquisition transaction costs, share-based compensation related to the cash settlement of certain equity awards, change in fair value of contingent consideration liability, and costs to terminate certain employment, operating lease, and other contracts of the acquired companies. (2) Consists of the amortization of intellectual property licenses and covenant not to sue. In Q1'25, it also includes a release of previously accrued legal contingency charge. Fiscal year ends on July 31. GAAP to Non-GAAP Reconciliations – Operating Margin $ In millions Non-GAAP operating income and operating margin: Q124 Q125 $ % $ % GAAP operating income and operating margin $215.2 11.5% $286.5 13.4% Share-based compensation-related charges 287.8 15.3% 315.1 14.7% Acquisition-related costs⁽¹⁾ - 0.0% 15.1 0.7% Amortization expense of acquired intangible assets 24.5 1.3% 40.7 1.9% Litigation-related charges⁽²⁾ 1.8 0.1% (41.2) -1.9% Non-GAAP operating income and operating margin $529.3 28.2% $616.2 28.8%
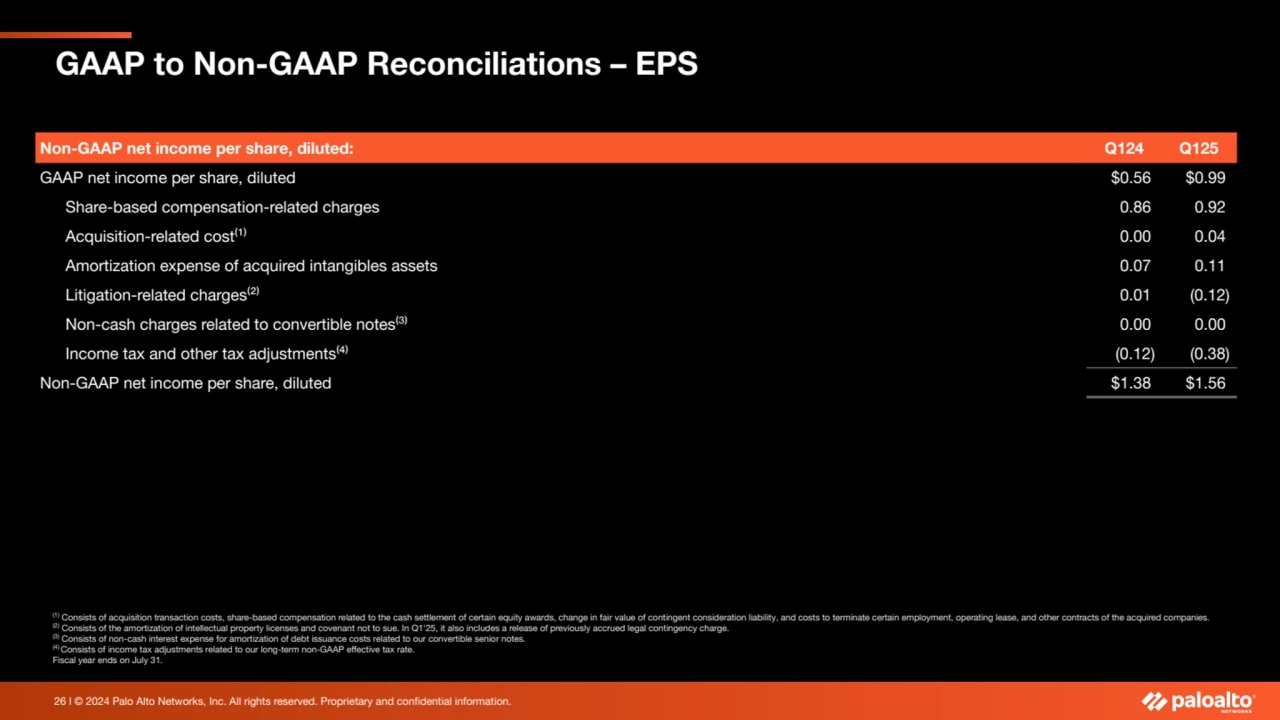
- 26. 26 l © 2024 Palo Alto Networks, Inc. All rights reserved. Proprietary and confidential information. GAAP to Non-GAAP Reconciliations – EPS (1) Consists of acquisition transaction costs, share-based compensation related to the cash settlement of certain equity awards, change in fair value of contingent consideration liability, and costs to terminate certain employment, operating lease, and other contracts of the acquired companies. (2) Consists of the amortization of intellectual property licenses and covenant not to sue. In Q1'25, it also includes a release of previously accrued legal contingency charge. (3) Consists of non-cash interest expense for amortization of debt issuance costs related to our convertible senior notes. (4) Consists of income tax adjustments related to our long-term non-GAAP effective tax rate. Fiscal year ends on July 31. Non-GAAP net income per share, diluted: Q124 Q125 GAAP net income per share, diluted $0.56 $0.99 Share-based compensation-related charges 0.86 0.92 Acquisition-related cost⁽¹⁾ 0.00 0.04 Amortization expense of acquired intangibles assets 0.07 0.11 Litigation-related charges⁽²⁾ 0.01 (0.12) Non-cash charges related to convertible notes⁽³⁾ 0.00 0.00 Income tax and other tax adjustments⁽⁴⁾ (0.12) (0.38) Non-GAAP net income per share, diluted $1.38 $1.56
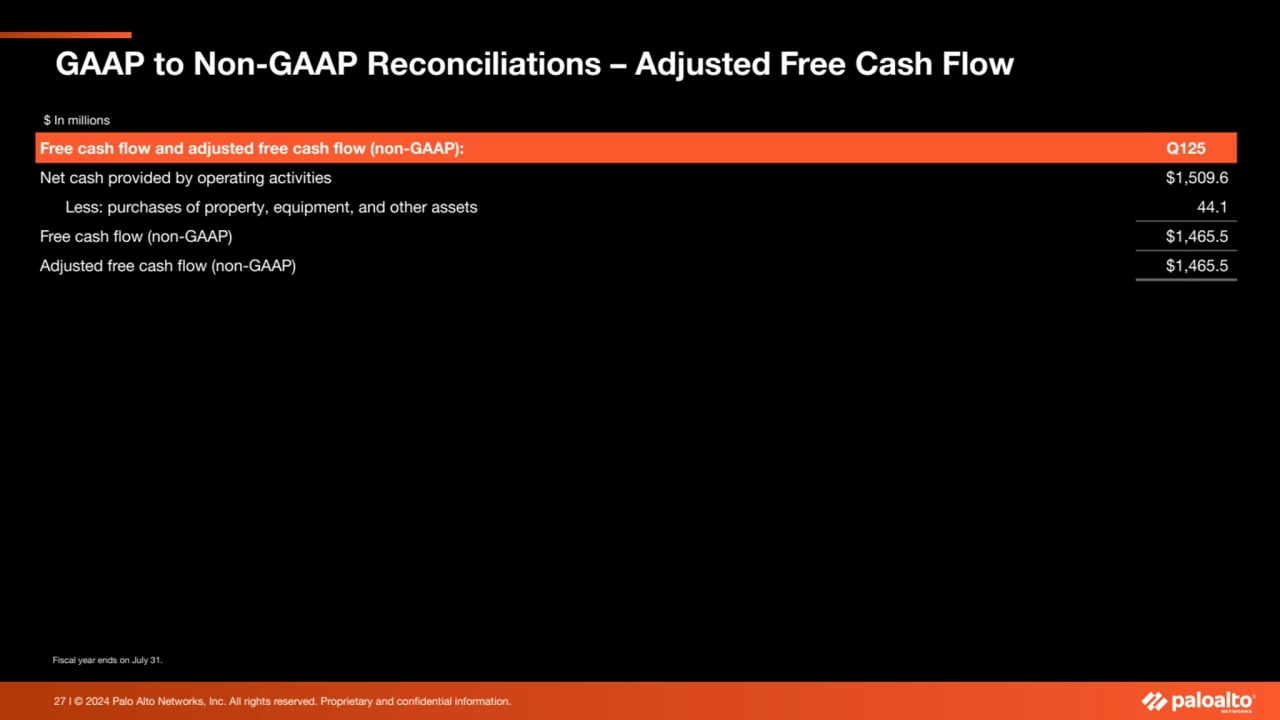
- 27. 27 l © 2024 Palo Alto Networks, Inc. All rights reserved. Proprietary and confidential information. Fiscal year ends on July 31. GAAP to Non-GAAP Reconciliations – Adjusted Free Cash Flow $ In millions Free cash flow and adjusted free cash flow (non-GAAP): Q125 Net cash provided by operating activities $1,509.6 Less: purchases of property, equipment, and other assets 44.1 Free cash flow (non-GAAP) $1,465.5 Adjusted free cash flow (non-GAAP) $1,465.5
- 28. | © 2024 Palo Alto Networks, Inc. All rights reserved. Thank You paloaltonetworks.com © 2024 Palo Alto Networks, Inc. All rights reserved.