Q2 2025 Earnings Conference Call Carrier Corporation

    Q2 2025 Earnings Conference Call Carrier Corporation

    F2 weeks ago 6

    AIAI Summary

    toggle
    Bulleted
    toggle
    Text

    Key Insights

    Loading...

    Q2 2025 Earnings 
Conference Call
July 29, 2025
    1/31

    Loading...

    2025 Q2 Earnings | July 29, 2025 2
This communication contains statements which, to the extent they are not statements of historical or present fact, constitute "forward-looking statements" under the securities laws. From time to time,
oral or written forward-looking statements may also be included in other information released to the public. These forward-looking statements are intended to provide management’s current
expectations or plans for our future operating and financial performance, based on assumptions currently believed to be valid. Forward-looking statements can be identified by the use of words such
as "believe," "expect," "expectations," "plans," "strategy," "prospects," "estimate," "project," "target," "anticipate," "will," "should," "see," "guidance," "outlook," "confident," "scenario" and other words of
similar meaning in connection with a discussion of future operating or financial performance. Forward-looking statements may include, among other things, statements relating to future sales,
earnings, cash flow, results of operations, uses of cash, share repurchases, tax rates and other measures of financial performance or potential future plans, strategies or transactions of Carrier,
Carrier’s guidance for full-year 2025, Carrier's plans with respect to our indebtedness and other statements that are not historical facts. All forward-looking statements involve risks, uncertainties and
other factors that may cause actual results to differ materially from those expressed or implied in the forward-looking statements. For those statements, we claim the protection of the safe harbor for
forward-looking statements contained in the U.S. Private Securities Litigation Reform Act of 1995. Such risks, uncertainties and other factors include, without limitation, those described below and
under the section titled “Risk Factors” in our most recent Annual Report on Form 10-K and in subsequent reports that we file with the SEC: the effect of economic conditions in the industries and
markets in which Carrier and our businesses operate in the U.S. and globally and any changes therein, including financial market conditions, inflationary cost pressures, fluctuations in commodity
prices, interest rates and foreign currency exchange rates, levels of end market demand in construction, the impact of weather conditions, pandemic health issues, natural disasters and the financial
condition of our customers and suppliers; challenges in the development, production, delivery, support, performance and realization of the anticipated benefits of advanced technologies and new
products and services; future levels of capital spending and research and development spending; future availability of credit and factors that may affect such availability, including credit market
conditions and Carrier's capital structure and credit ratings; the timing and scope of future repurchases of Carrier's common stock, including market conditions and the level of other investing activities
and uses of cash; delays and disruption in the delivery of materials and services from suppliers; cost reduction efforts and restructuring costs and savings and other consequences thereof; new
business and investment opportunities; the outcome of legal proceedings, investigations and other contingencies; the impact of pension plan assumptions on future cash contributions and earnings;
the impact of the negotiation of collective bargaining agreements and labor disputes; the effect of changes in political conditions in the U.S. and other countries in which Carrier and our businesses
operate, including the effect of ongoing uncertainty and/or changes in U.S. trade policies, on general market conditions, global trade policies, the imposition of tariffs, and currency exchange rates in
the near term and beyond; the effect of changes in tax, environmental, regulatory (including among other things import/export) and other laws and regulations in the U.S. and other countries in which
we and our businesses operate; the ability of Carrier to retain and hire key personnel; the scope, nature, impact or timing of acquisition and divestiture activity, such as our portfolio transformation
transactions, including among other things integration of acquired businesses into existing businesses and realization of synergies and opportunities for growth and innovation and incurrence of related
costs; a determination by the IRS and other tax authorities that the distribution of Carrier from RTX Corporation (f/k/a United Technologies Corporation) or certain related transactions should be treated
as taxable transactions; and risks associated with current and future indebtedness, as well as our ability to reduce indebtedness and the timing thereof. The forward-looking statements speak only as
of the date of this communication. We undertake no obligation to publicly update or revise any forward-looking statements, whether as a result of new information, future events or otherwise, except as
required by applicable law. Additional information as to factors that may cause actual results to differ materially from those expressed or implied in the forward-looking statements is disclosed from
time to time in our other filings with the SEC.
Cautionary statement
    2/31

    Loading...

    CSA sales up MT with commercial3 sales up ~45%
Global aftermarket3 sales up 13%
Residential Europe heat pump sales up >10% including Germany up 
>50%
Very strong growth in CSAME in India, Japan and the Middle East
~30% core earnings conversion driven by strong organic sales 
growth and productivity 
$1.9B4in share repurchases year-to-date; on track to repurchase 
$3B by end of 2025
Solid organic growth and continued margin expansion position Carrier for another strong year
Q2 2025 Summary
3
Sales $6,113M
Organic1 +6% Y/Y
Adjusted 
Operating Profit1
$1,166M
+10% Y/Y
Adjusted 
Operating Margin1
19.1%
+130 bps Y/Y
Adjusted EPS1 $0.92
+26% Y/Y
Free cash flow1,2 $568M
Highlights
1. See appendix for additional information regarding non-GAAP measures
2. Includes results of continuing operations and discontinued operations
3. Excludes NORESCO
4. Includes $300M block trade entered into with an affiliate of Viessmann on June 5, 2025 with payment in July 2025
2025 Q2 Earnings | July 29, 2025
    3/31

    Loading...

    Growth Q2 2025 Results
Best-in-class products, channels and 
brands
• New mag-bearing air cooled chiller with top-tier efficiency
• $45M data center win in the Middle East
• Received 2025 Sustainable Product of the Year1 award for the integrated air-to-water heat pump / 
domestic hot water heater in North America and will launch in Q3 2025 
Digitally-enabled lifecycle solutions
• +13% aftermarket growth2
• ~63k connected chillers,3 up 40% 
• Enhanced Abound app with AI insights to optimize chiller performance and maintenance
Fully-integrated systems
• Strong progress on HEMS solutions for Europe and North America
• Providing a complete end-to-end fully integrated heating and cooling equipment and building 
management system for Shanghai Oriental Hub infrastructure project
Margin expansion and productivity • 130 bps of adjusted operating margin expansion driven by continued strong productivity
Disciplined capital deployment • Returned $2.3B4
to shareholders YTD through dividends and share repurchases
Strong progress on strategic focus areas
2025 Q2 Earnings | July 29, 2025 4
1. Awarded by 2025 Green Builder
2. Excludes NORESCO
3. Includes Toshiba chillers
4. Includes $300M block trade entered into with VGG on June 5, 2025 with expected payment in July 2025
    4/31

    Loading...

    Leveraging world-class combination Q2 Highlights
• Home Energy Management System
• Hydronics
• Component designs
• Sales in-line with expectations 
• Germany heat pump units up >50%
• Sales outside of Germany up LSD year-over-year
• Delivering cost and revenue synergies
• Strong growth in air-conditioning sales
• On-track for full-year double-digit aftermarket growth
• Integration with commercial HVAC Europe to yield strong sales growth 
and margin expansion opportunities
• Further increasing number of “Viessmann Systems Profi” partners; on 
average realizing stronger growth with these partners
• Global controls rationalization
• One Base: over 1 million connected 
devices on ViCare
• One Base global integration
• Dual and best-cost sourcing
• One Europe consolidation
• Multi-brand, multi-channel 
• Global talent pool
Residential and light commercial (RLC) Europe
2025 Q2 Earnings | July 29, 2025 5
Differentiated 
technology
Global 
platforming
Synergies
Talent
    5/31

    Loading...

    $17B
~$23B
2022A 2025 Guidance
Continued growth momentum and margin expansion
2025 Q2 Earnings | July 29, 2025 6
Accelerating organic sales growth and delivering continued mid-teens+ adj. EPS growth
13.6%
16.5 – 17.0%
2022A 2025 Guidance2 2
Sales Adj. operating margin3 Adj. EPS3
$1.89
$3.00 – 3.10
2022A 2025 Guidance 2
~300 
bps
~17%
CAGR
1. Actuals are reflective of continuing operations
2. Guidance as of July 29, 2025
3. See appendix for additional information regarding non-GAAP measures
1 1 1
    6/31

    Loading...

    Q2 2025 Results
7
Q2 2025 Q2 2024 Y/Y 
Sales $6,113M $5,934M 3%
Organic sales1 6%
Acquisitions / Divestitures, net (4%)
FX 1%
Adjusted operating profit1 $1,166M $1,056M 10%
Adjusted operating margin1 19.1% 17.8% 130 bps
Adjusted effective tax rate1 22.1% 22.7%
Adjusted EPS1 $0.92 $0.73 26%
Free cash flow1,2 $568M $549M
2025 Q2 Earnings | July 29, 2025
1. See appendix for additional information regarding non-GAAP measures
2. Includes results of continuing operations and discontinued operations
    7/31

    Loading...

    Q2 2025 Climate Solutions Americas (CSA)
8
Q2 2025 Q2 2024 Y/Y
Sales $3,252M $2,865M 14%
Organic sales1 14%
Acq / div, net 0%
FX 0%
Segment operating profit $879M $713M 23%
Segment operating margin 27.0% 24.9% 210 bps
Highlights
Very strong organic growth at 14%
Continued strength in commercial2, sales up 45%
Residential sales up 11%
Light commercial sales down ~20%, in-line with 
expectations
Significant margin expansion driven by strong 
organic sales growth and productivity
2025 Q2 Earnings | July 29, 2025
1. See appendix for additional information regarding non-GAAP measures
2. Excludes NORESCO
    8/31

    Loading...

    Q2 2025 Climate Solutions Europe (CSE)
9
Highlights
Residential and light commercial sales flattish
• Heat pump units in Germany up >50%
Commercial sales up LSD 
Margin expansion driven by cost synergies, partially 
offset by unfavorable regional and product mix
Q2 2025 Q2 2024 Y/Y
Sales $1,253M $1,194M 5%
Organic sales1 0%
Acq / div, net 0%
FX 5%
Segment operating profit $99M $93M 6%
Segment operating margin 7.9% 7.8% 10 bps
1. See appendix for additional information regarding non-GAAP measures 2025 Q2 Earnings | July 29, 2025
    9/31

    Loading...

    Q2 2025 Climate Solutions Asia Pacific Middle East & Africa (CSAME)
10
Highlights
Very strong sales growth in India, Japan and the 
Middle East
Continued weakness in China, sales down 11%
Margin in-line with expectations, driven by a prior 
year favorable currency impact and lower volume, 
partially offset by productivity
Q2 2025 Q2 2024 Y/Y
Sales $882M $902M (2%)
Organic sales1(4%)
Acq / div, net 0%
FX 2%
Segment operating profit $135M $157M (14%)
Segment operating margin 15.3% 17.4% (210 bps)
1. See appendix for additional information regarding non-GAAP measures 2025 Q2 Earnings | July 29, 2025
    10/31

    Loading...

    Q2 2025 Climate Solutions Transportation (CST)
11
Highlights
Global Truck & Trailer sales down MSD; North 
America returned to growth
Container sales up MSD
Sensitech sales up HSD
Strong margin expansion mainly due to the 
Commercial Refrigeration exit
Q2 2025 Q2 2024 Y/Y
Sales $726M $973M (25%)
Organic sales1(1%)
Acq / div, net (25%)
FX 1%
Segment operating profit $128M $138M (7%)
Segment operating margin 17.6% 14.2% 340 bps
1. See appendix for additional information regarding non-GAAP measures 2025 Q2 Earnings | July 29, 2025
    11/31

    Loading...

    Q2 2025 Organic orders down HT
2025 Q2 Earnings | July 29, 2025 12
Excluding CSA residential, total company orders up mid-single digits
Climate Solutions Americas (CSA)1(~30%)
Residential (~60%)
vs. >100% PY
Light commercial >+20%
Commercial1 +HT
Climate Solutions Europe (CSE) (MSD)
Residential and light commercial (MSD)
Commercial (HSD)
Climate Solutions Asia Pacific MEA (CSAME) (LSD)
China (HSD)
Balance of segment +LSD
Climate Solutions Transportation (CST)2 +HSD
Global Truck & Trailer (MSD)
Container ~+40%
2022 2023 2024 2025
Q2 CHVAC Backlog
1. Excludes NORESCO
2. Excludes Commercial Refrigeration
    12/31

    Loading...

    Reaffirming FY 2025 guidance
2025 Q2 Earnings | July 29, 2025 13
February Guidance May Guidance Current Guidance
Sales $22.5B - $23.0B
Organic +MSD
~$23B
Organic +MSD
~$23B
Organic +MSD
Adjusted Operating 
Margin
16.5 – 17.0% 
+~100 bps
16.5 – 17.0% 
+~100 bps
16.5 – 17.0% 
+~100 bps
Adjusted EPS $2.95 – $3.05
+15-19%
$3.00 – $3.10
+17-21%
$3.00 – $3.10
+17-21%
Free cash flow $2.4 - $2.6B $2.4 - $2.6B $2.4 - $2.6B
Strong first half of 2025 – On-track to deliver about 20% adjusted EPS growth
1. See appendix for additional information regarding non-GAAP measures
    13/31

    Loading...

    FY 2025 Organic sales1 guidance
14
Segment Current guide
(July 2025)
Prior guide
(May 2025)
Climate Solutions Americas (CSA)
Residential
Light commercial
Commercial
+HSD
+MSD
(MT)
>+20%
+HSD
+HSD - DD
(DD)
+DD
Climate Solutions Europe (CSE)
Residential and Light commercial
Commercial
+LSD
~Flat
+DD
+LSD
~Flat
+DD
Climate Solutions Asia Pacific MEA (CSAME)
China
Balance of segment
+LSD
~(MSD)
+MSD-HSD
+LSD
~Flat
+MSD
Climate Solutions Transportation (CST) +MSD
~(20%) reported
+MSD
~(20%) reported
Carrier
~$23B
Organic +MSD
FX 1%
Acquisitions 0%
Divestitures (3%)
+LSD reported
~$23B
Organic +MSD
FX 1%
Acquisitions 0%
Divestitures (3%)
+LSD reported
Change vs. prior guide
1. See appendix for additional information regarding non-GAAP measures 2025 Q2 Earnings | July 29, 2025
    14/31

    Loading...

    FY 2025 Profit and cash guidance
15
Segment Current guide
(July 2025)
Prior guide
(May 2025)
CS Americas ~22.75% Margin
+~75 bps
~22.5% Margin
+~50 bps
CS Europe ~10.0% Margin
+~50 bps
~10.5% Margin
+~100 bps
CS Asia Pacific Middle East & Africa ~13.5% Margin
~Flattish
~13.5% Margin
~Flattish
CS Transportation ~16.5% Margin
+~250 bps
~16.5% Margin
+~250 bps
Carrier adj. operating margin1 16.5 – 17.0% Margin
+~100 bps
16.5 – 17.0% Margin
+~100 bps
Adj. EPS1 $3.00 – $3.10 $3.00 – $3.10
Free cash flow1,2 $2.4 – $2.6B $2.4 – $2.6B
Share repurchases ~$3B ~$3B
Change vs. prior guide
2025 Q2 Earnings | July 29, 2025
1. See appendix for additional information regarding non-GAAP measures
2. Includes results of continuing operations and discontinued operations
    15/31

    Loading...

    Summary
2025 Q2 Earnings | July 29, 2025 16
• Strong Q2 with +6% organic growth and +26% adjusted EPS growth
• Exceptional +45% CSA commercial1 growth and +13% global aftermarket1 growth
• Traction on all key growth initiatives: products, aftermarket and systems
• Continued productivity drove 130 basis points of margin expansion in Q2
• Reaffirming full-year guidance; expecting another year of mid-teens+ adjusted EPS growth
• On-track to return ~$3.8B to shareholders in 2025 through dividends and share repurchases
1. Excludes NORESCO
    16/31

    Loading...

    APPENDIX
17
    17/31

    Loading...

    Q2 2025 Adjusted EPS1 bridge
1. See appendix for additional information regarding non-GAAP measures 2025 Q2 Earnings | July 29, 2025 18
$0.73
$0.11 
$0.04 $0.00 $0.04
$0.92
Q2 2024 Adj. EPS Operational Net interest Tax rate / other Share count Q2 2025 Adj. EPS
    18/31

    Loading...

    FY 2025 Adjusted EPS1 guidance bridge
19
Projecting third consecutive year of at least mid to high-teens adjusted EPS growth
2025 Q2 Earnings | July 29, 2025
$2.56 
$3.05 
Midpoint
2024 Adj. EPS Operational Foreign exchange Net interest Share count / Other 2025E Adj. EPS
outlook
$0.05 – $0.10
$0.10 – $0.15
Share repurchases
Tax ~22%
NCI
~$0.30 ~$0.00
1. See appendix for additional information regarding non-GAAP measures
Volume
Price / Mix
Net productivity
Tariffs - net
Stranded cost 
elimination
Investments
~
    19/31

    Loading...

    20
Additional items
Current Guidance
(July 2025)
Prior Guidance
(May 2025)
Average shares outstanding (diluted) ~865M ~865M
Corporate expenses / eliminations and other ~$225M ~$225M
Interest expense, net1 $350 – $360M $350 – $360M
Adjusted effective tax rate1 ~22.0% ~22.0%
Non-controlling interest ~$110M ~$110M
Capital expenditures ~$500M ~$500M
Depreciation and amortization ~$1.2B ~$1.2B
1. See appendix for additional information regarding non-GAAP measures 2025 Q2 Earnings | July 29, 2025
    20/31

    Loading...

    21
Use and definitions of non-GAAP financial measures
Carrier reports its financial results in accordance with accounting principles generally accepted in the United States ("GAAP"). We supplement the reporting of our financial information determined under GAAP with
certain non-GAAP financial information. The non-GAAP information presented provides investors with additional useful information, but should not be considered in isolation or as substitutes for the related GAAP
measures. Moreover, other companies may define non-GAAP measures differently, which limits the usefulness of these measures for comparisons with such other companies. We encourage investors to review
our financial statements and publicly filed reports in their entirety and not to rely on any single financial measure. A reconciliation of the non-GAAP measures to the corresponding amounts prepared in accordance
with GAAP appears in the tables in this Appendix. The tables provide additional information as to the items and amounts that have been excluded from the adjusted measures.
Organic sales, adjusted operating profit, adjusted operating margin, adjusted net income, adjusted earnings per share (“EPS”), adjusted effective tax rate and net debt are non-GAAP financial measures and are
associated with Carrier's continuing operations unless specifically noted.
Organic sales represents consolidated net sales (a GAAP measure), excluding the impact of foreign currency translation, acquisitions and divestitures completed in the preceding twelve months and other
significant items of a nonoperational nature (hereinafter referred to as “other significant items”). Adjusted operating profit represents consolidated operating profit (a GAAP measure), excluding restructuring costs,
amortization of acquired intangibles and other significant items. Adjusted operating margin represents adjusted operating profit as a percentage of consolidated net sales (a GAAP measure). Adjusted net income
represents net income attributable to common shareowners (a GAAP measure), excluding restructuring costs, amortization of acquired intangibles and other significant items. Adjusted EPS represents diluted
earnings per share (a GAAP measure), excluding restructuring costs, amortization of acquired intangibles and other significant items. The adjusted effective tax rate represents the effective tax rate (a GAAP
measure), excluding restructuring costs, amortization of acquired intangibles and other significant items. Net debt represents long-term debt (a GAAP measure) less cash and cash equivalents (a GAAP measure).
Free cash flow is a non-GAAP financial measure that represents net cash flows provided by continuing operating activities (a GAAP measure) less capital expenditures. Management believes free cash flow is a
useful measure of liquidity and an additional basis for assessing Carrier’s ability to fund its activities, including the financing of acquisitions, debt service, repurchases of Carrier's common stock and distribution of
earnings to shareowners. Orders are contractual commitments with customers to provide specified goods or services for an agreed upon price and may not be subject to penalty if cancelled.
When Carrier provides our expectations for organic sales, adjusted operating profit, adjusted operating margin, adjusted effective tax rate, adjusted EPS and free cash flow on a forward-looking basis, a
reconciliation of the differences between the non-GAAP expectations and the corresponding GAAP measures generally is not available without unreasonable effort due to potentially high variability, complexity and
low visibility as to the items that would be excluded from the GAAP measure in the relevant future period, such as unusual gains and losses, the ultimate outcome of pending litigation, fluctuations in foreign
currency exchange rates, the impact and timing of potential acquisitions and divestitures, future restructuring costs, and other structural changes or their probable significance. The variability of the excluded items
may have a significant, and potentially unpredictable, impact on our future GAAP results.
As a result of Carrier's portfolio transformation, Carrier revised its reportable segments during the first quarter of 2025 to better reflect its business strategy, align its management reporting and increase
transparency for investors. In connection with the revised structure, the Chief Operating Decision Maker changed the measure used to evaluate segment profitability from Operating profit to Segment operating
profit. It represents operating profit (a GAAP measure) adjusted to exclude restructuring costs, amortization of acquired intangible assets and other significant items of a nonoperational nature. All prior period
comparative information has been recast to reflect the revised segment structure.
2025 Q2 Earnings | July 29, 2025
    21/31

    Loading...

    22
Segment summary
2025 Q2 Earnings | July 29, 2025
(Unaudited)
Three Months Ended 
June 30,
Six Months Ended 
June 30,
(In millions) 2025 2024 2025 2024
Segment net sales
Climate Solutions Americas $ 3,252 $ 2,865 $ 5,824 $ 5,225
Climate Solutions Europe 1,253 1,194 2,422 2,486
Climate Solutions Asia Pacific, Middle East & Africa 882 902 1,708 1,786
Climate Solutions Transportation 726 973 1,377 1,857
Segment net sales $ 6,113 $ 5,934 $ 11,331 $ 11,354
Segment operating profit
Climate Solutions Americas $ 879 $ 713 $ 1,449 $ 1,138
Climate Solutions Europe 99 93 204 260
Climate Solutions Asia Pacific, Middle East & Africa 135 157 256 265
Climate Solutions Transportation 128 138 225 251
Segment operating profit $ 1,241 $ 1,101 $ 2,134 $ 1,914
Segment operating margin
Climate Solutions Americas 27.0 % 24.9 % 24.9 % 21.8 %
Climate Solutions Europe 7.9 % 7.8 % 8.4 % 10.5 %
Climate Solutions Asia Pacific, Middle East & Africa 15.3 % 17.4 % 15.0 % 14.8 %
Climate Solutions Transportation 17.6 % 14.2 % 16.3 % 13.5 %
    22/31

    Loading...

    23
Organic sales reconciliation
2025 Q2 Earnings | July 29, 2025
Three Months Ended June 30, 2025 Compared with Three Months Ended June 30, 2024
(Unaudited)
Factors Contributing to Total % change in Net Sales
Organic
FX 
Translation
Acquisitions / 
Divestitures, net Other Total
Climate Solutions Americas 14 % — % — % — % 14 %
Climate Solutions Europe — % 5 % — % — % 5 %
Climate Solutions Asia Pacific, Middle East & Africa (4) % 2 % — % — % (2) %
Climate Solutions Transportation (1) % 1 % (25) % — % (25) %
Consolidated 6 % 1 % (4)% — % 3 %
    23/31

    Loading...

    24
Earnings before income taxes reconciliation
2025 Q2 Earnings | July 29, 2025
(Unaudited) (Unaudited)
Three Months Ended 
June 30,
Six Months Ended June 
30,
(In millions) 2025 2024 2025 2024
Reconciliation to Earnings before income taxes
Segment operating profit $ 1,241 $ 1,101 $ 2,134 $ 1,914
Corporate and other (75) (45) (120) (94)
Restructuring costs (47) (29) (55) (37)
Amortization of acquired intangibles (214) (170) (415) (342)
Acquisition step-up amortization — (109) — (220)
Acquisition/divestiture-related costs (9) (24) (19) (72)
CCR gain 7 — 7 —
Viessmann-related hedges — — — (86)
Gain on liability adjustment — — — 46
Non-service pension (expense) benefit — — 1 —
Interest (expense) income, net (91) (157) (173) (298)
Earnings before income taxes $ 812 $ 567 $ 1,360 $ 811
    24/31

    Loading...

    25
Adjusted operating profit reconciliation
2025 Q2 Earnings | July 29, 2025
(Unaudited)
Three Months Ended 
June 30,
Six Months Ended June 
30,
(In millions) 2025 2024 2025 2024
Reconciliation of Segment operating profit to Adjusted operating profit
Climate Solutions Americas $ 879 $ 713 $ 1,449 $ 1,138
Climate Solutions Europe 99 93 204 260
Climate Solutions Asia Pacific, Middle East & Africa 135 157 256 265
Climate Solutions Transportation 128 138 225 251
Segment operating profit $ 1,241 $ 1,101 $ 2,134 $ 1,914
Corporate and other (75) (45) (120) (94)
Adjusted operating profit $ 1,166 $ 1,056 $ 2,014 $ 1,820
    25/31

    Loading...

    26
Q2 and YTD 2025 EPS reconciliation
2025 Q2 Earnings | July 29, 2025
(Unaudited)
Three Months Ended June 30, 2025 Six Months Ended June 30, 2025
(In millions, except per share amounts) Reported Adjustments Adjusted Reported Adjustments Adjusted
Net sales $ 6,113 $ — $ 6,113 $ 11,331 $ — $ 11,331
Operating profit $ 903 263 a $ 1,166 $ 1,532 482 a $ 2,014
Operating margin 14.8 % 19.1 % 13.5 % 17.8 %
Earnings before income taxes $ 812 263 a $ 1,075 $ 1,360 482 a,b $ 1,842
Income tax (expense) benefit $ (162) (75) c $ (237) $ (273) (133) c $ (406)
Effective tax rate 20.0 % 22.1 % 20.1 % 22.1 %
Earnings from continuing operations 
attributable to common shareowners $ 608 $ 188 $ 796 $ 1,020 $ 349 $ 1,369
Summary of Adjustments:
Amortization of acquired intangibles $ 214 a $ 415 a
Restructuring costs 47 a 55 a
Acquisition/divestiture-related costs (1) 9 a 19 a
CCR gain (7) a (7) a
Total adjustments $ 263 $ 482
Tax effect on adjustments above $ (69) $ (127)
Tax specific adjustments (6) (6)
Total tax adjustments $ (75) c $ (133) c
Diluted shares outstanding 866.3 866.3 872.3 872.3
Diluted earnings per share:
Continuing operations $ 0.70 $ 0.92 $ 1.17 $ 1.57
    26/31

    Loading...

    27
Q2 and YTD 2024 EPS reconciliation
2025 Q2 Earnings | July 29, 2025
(1) Amortization of the step-up to fair value of acquired inventory and backlog.
(2) Gain associated with an adjustment to our tax-related liability owed to UTC.
(Unaudited)
Three Months Ended June 30, 2024 Six Months Ended June 30, 2024
(In millions, except per share amounts) Reported Adjustments Adjusted Reported Adjustments Adjusted
Net sales $ 5,934 $ — $ 5,934 $ 11,354 $ — $ 11,354
Operating profit $ 724 332 a $ 1,056 $ 1,109 711 a $ 1,820
Operating margin 12.2 % 17.8 % 9.8 % 16.0 %
Earnings before income taxes $ 567 344 a,b $ 911 $ 811 723 a,b $ 1,534
Income tax (expense) benefit $ (120) (87) c $ (207) $ (167) (173) c $ (340)
Effective tax rate 21.2 % 22.7 % 20.6 % 22.2 %
Earnings from continuing operations 
attributable to common shareowners $ 415 $ 257 $ 672 $ 592 $ 550 $ 1,142
Summary of Adjustments:
Amortization of acquired intangibles $ 170 a $ 342 a
Restructuring costs 29 a 37 a
Acquisition/divestiture-related costs 24 a 72 a
Acquisition step-up amortization (1) 109 a 220 a
Viessmann-related hedges — a 86 a
Gain on liability adjustment (2) — a (46) a
Debt prepayment costs $ 12 b $ 12 b
Total adjustments $ 344 $ 723
Tax effect on adjustments above $ (87) $ (173)
Total tax adjustments $ (87) c $ (173) c
Diluted shares outstanding 915.3 915.3 913.6 913.6
Diluted earnings per share:
Continuing operations $ 0.45 $ 0.73 $ 0.65 $ 1.25
    27/31

    Loading...

    28
Free cash flow reconciliation
2025 Q2 Earnings | July 29, 2025
(Unaudited)
Three Months Ended 
June 30,
Six Months Ended 
June 30,
(In millions) 2025 2024 2025 2024
Net cash flows provided by operating activities $ 649 $ 660 $ 1,132 $ 700
Less: Capital expenditures - continuing operations (81) (108) (144) (210)
Less: Capital expenditures - discontinued operations — (3) — (5)
Free cash flow $ 568 $ 549 $ 988 $ 485
    28/31

    Loading...

    29
Net debt reconciliation
2025 Q2 Earnings | July 29, 2025
(Unaudited)
(In millions) June 30, 2025 December 31, 2024
Long-term debt $ 11,336 $ 11,026
Current portion of long-term debt 107 1,252
Less: Cash and cash equivalents 1,797 3,969
Net debt $ 9,646 $ 8,309
    29/31

    Loading...

    30
2022 reconciliations
2025 Q2 Earnings | July 29, 2025
(In millions, except per share amounts) Reported Adjustments Adjusted
Net sales $ 17,288 $ — $ 17,288 
Operating profit $ 3,984 $ (1,637) a $ 2,347 
Operating margin 23.04% 13.58%
Earnings before income taxes $ 3,823 $ (1,665) a,b $ 2,158 
Income tax (expense) benefit $ (616) $ 139 c $ (477)
Effective tax rate 16.11% 22.10%
Earnings from continuing operations attributable 
to common shareowners $ 3,157 $ (1,526) $ 1,631 
Summary of Adjustments:
Restructuring costs $ 20 a
Amortization of acquired intangibles 46 a
Acquisition step-up amortization (1) 51 a
Acquisition/divestiture-related costs 31 a
Chubb gain (1,105) a
TCC acquisition-related gain (2) (705) a
Russia/Ukraine asset impairment 3 a
Charge resulting form legal matter 22 a
Debt extinguishment (gain), net (3) (28) b
Total adjustments $ (1,665)
Tax effect on adjustments above $ 176 
Tax specific adjustments (37)
Total tax adjustments $ 139 c
Diluted shares outstanding 861.2 861.2 
Diluted earnings per share:
Continuing operations $ 3.67 $ 1.89 
(1) Amortization of the step-up to fair value of acquired inventory and backlog.
(2) The carrying value of our previously held TCC equity investments were recognized at fair value and subsequently adjusted.
(3) The Company repurchased approximately $1.15 billion of aggregate principal senior notes on March 30, 2022 and 
recognized a net gain of $33 million and wrote-off $5 million of unamortized deferred financing costs in Interest 
(Unaudited)
Year Ended December 31, 2022
(Unaudited)
Year Ended 
December 31, 2022
(In millions) Carrier
Net sales $ 17,288 
Operating profit $ 3,984 
Reported operating margin 23.0%
Adjustments to segment operating profit:
Restructuring costs $ 20 
Amortization of acquired intangibles 46 
Acquisition step-up amortization (1) 51 
Acquisition/divestiture-related costs 31 
Chubb gain (1,105)
TCC acquisition-related gain (1) (705)
Russia/Ukraine asset impairment 3 
Charge resulting form legal matter 22 
Total adjustments to operating profit $ (1,637)
Adjusted operating profit $ 2,347 
Adjusted operating margin 13.6%
    30/31

    Loading...

    Q2 2025 Earnings Conference Call Carrier Corporation - Page 31
    31/31

    Q2 2025 Earnings Conference Call Carrier Corporation

    • 1. Q2 2025 Earnings Conference Call July 29, 2025
    • 2. 2025 Q2 Earnings | July 29, 2025 2 This communication contains statements which, to the extent they are not statements of historical or present fact, constitute "forward-looking statements" under the securities laws. From time to time, oral or written forward-looking statements may also be included in other information released to the public. These forward-looking statements are intended to provide management’s current expectations or plans for our future operating and financial performance, based on assumptions currently believed to be valid. Forward-looking statements can be identified by the use of words such as "believe," "expect," "expectations," "plans," "strategy," "prospects," "estimate," "project," "target," "anticipate," "will," "should," "see," "guidance," "outlook," "confident," "scenario" and other words of similar meaning in connection with a discussion of future operating or financial performance. Forward-looking statements may include, among other things, statements relating to future sales, earnings, cash flow, results of operations, uses of cash, share repurchases, tax rates and other measures of financial performance or potential future plans, strategies or transactions of Carrier, Carrier’s guidance for full-year 2025, Carrier's plans with respect to our indebtedness and other statements that are not historical facts. All forward-looking statements involve risks, uncertainties and other factors that may cause actual results to differ materially from those expressed or implied in the forward-looking statements. For those statements, we claim the protection of the safe harbor for forward-looking statements contained in the U.S. Private Securities Litigation Reform Act of 1995. Such risks, uncertainties and other factors include, without limitation, those described below and under the section titled “Risk Factors” in our most recent Annual Report on Form 10-K and in subsequent reports that we file with the SEC: the effect of economic conditions in the industries and markets in which Carrier and our businesses operate in the U.S. and globally and any changes therein, including financial market conditions, inflationary cost pressures, fluctuations in commodity prices, interest rates and foreign currency exchange rates, levels of end market demand in construction, the impact of weather conditions, pandemic health issues, natural disasters and the financial condition of our customers and suppliers; challenges in the development, production, delivery, support, performance and realization of the anticipated benefits of advanced technologies and new products and services; future levels of capital spending and research and development spending; future availability of credit and factors that may affect such availability, including credit market conditions and Carrier's capital structure and credit ratings; the timing and scope of future repurchases of Carrier's common stock, including market conditions and the level of other investing activities and uses of cash; delays and disruption in the delivery of materials and services from suppliers; cost reduction efforts and restructuring costs and savings and other consequences thereof; new business and investment opportunities; the outcome of legal proceedings, investigations and other contingencies; the impact of pension plan assumptions on future cash contributions and earnings; the impact of the negotiation of collective bargaining agreements and labor disputes; the effect of changes in political conditions in the U.S. and other countries in which Carrier and our businesses operate, including the effect of ongoing uncertainty and/or changes in U.S. trade policies, on general market conditions, global trade policies, the imposition of tariffs, and currency exchange rates in the near term and beyond; the effect of changes in tax, environmental, regulatory (including among other things import/export) and other laws and regulations in the U.S. and other countries in which we and our businesses operate; the ability of Carrier to retain and hire key personnel; the scope, nature, impact or timing of acquisition and divestiture activity, such as our portfolio transformation transactions, including among other things integration of acquired businesses into existing businesses and realization of synergies and opportunities for growth and innovation and incurrence of related costs; a determination by the IRS and other tax authorities that the distribution of Carrier from RTX Corporation (f/k/a United Technologies Corporation) or certain related transactions should be treated as taxable transactions; and risks associated with current and future indebtedness, as well as our ability to reduce indebtedness and the timing thereof. The forward-looking statements speak only as of the date of this communication. We undertake no obligation to publicly update or revise any forward-looking statements, whether as a result of new information, future events or otherwise, except as required by applicable law. Additional information as to factors that may cause actual results to differ materially from those expressed or implied in the forward-looking statements is disclosed from time to time in our other filings with the SEC. Cautionary statement
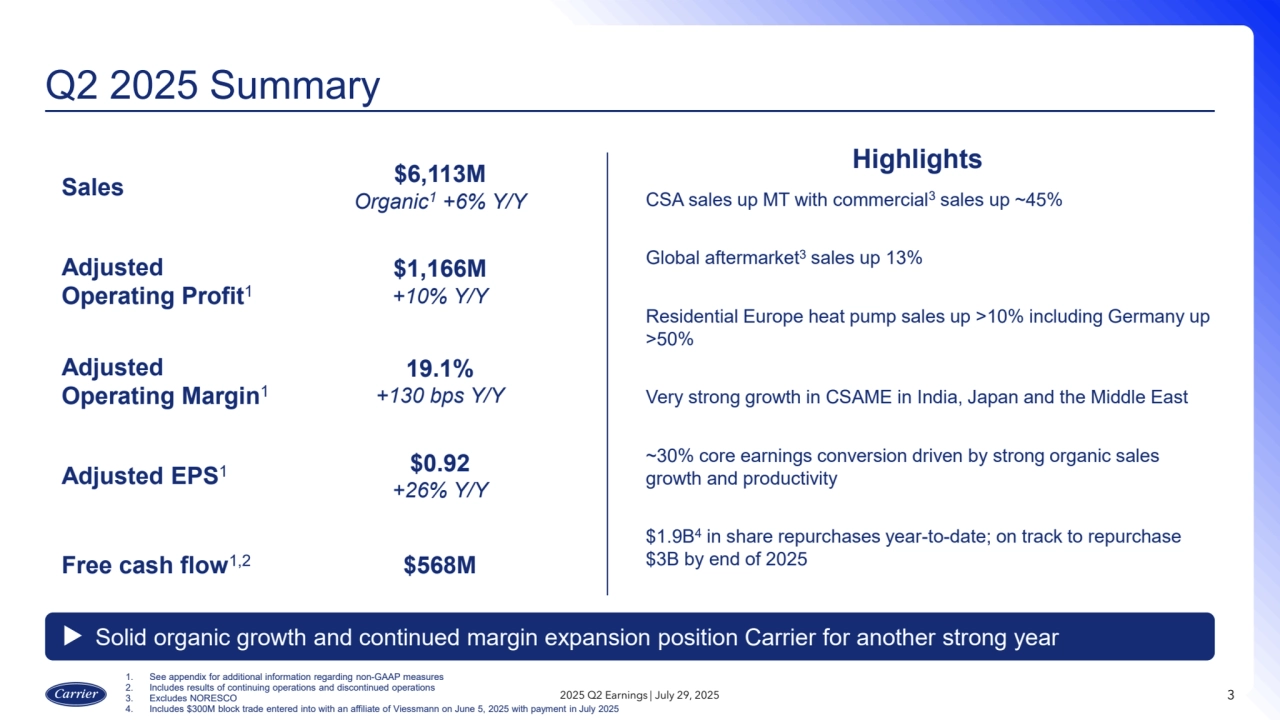
    • 3. CSA sales up MT with commercial3 sales up ~45% Global aftermarket3 sales up 13% Residential Europe heat pump sales up >10% including Germany up >50% Very strong growth in CSAME in India, Japan and the Middle East ~30% core earnings conversion driven by strong organic sales growth and productivity $1.9B4in share repurchases year-to-date; on track to repurchase $3B by end of 2025 Solid organic growth and continued margin expansion position Carrier for another strong year Q2 2025 Summary 3 Sales $6,113M Organic1 +6% Y/Y Adjusted Operating Profit1 $1,166M +10% Y/Y Adjusted Operating Margin1 19.1% +130 bps Y/Y Adjusted EPS1 $0.92 +26% Y/Y Free cash flow1,2 $568M Highlights 1. See appendix for additional information regarding non-GAAP measures 2. Includes results of continuing operations and discontinued operations 3. Excludes NORESCO 4. Includes $300M block trade entered into with an affiliate of Viessmann on June 5, 2025 with payment in July 2025 2025 Q2 Earnings | July 29, 2025
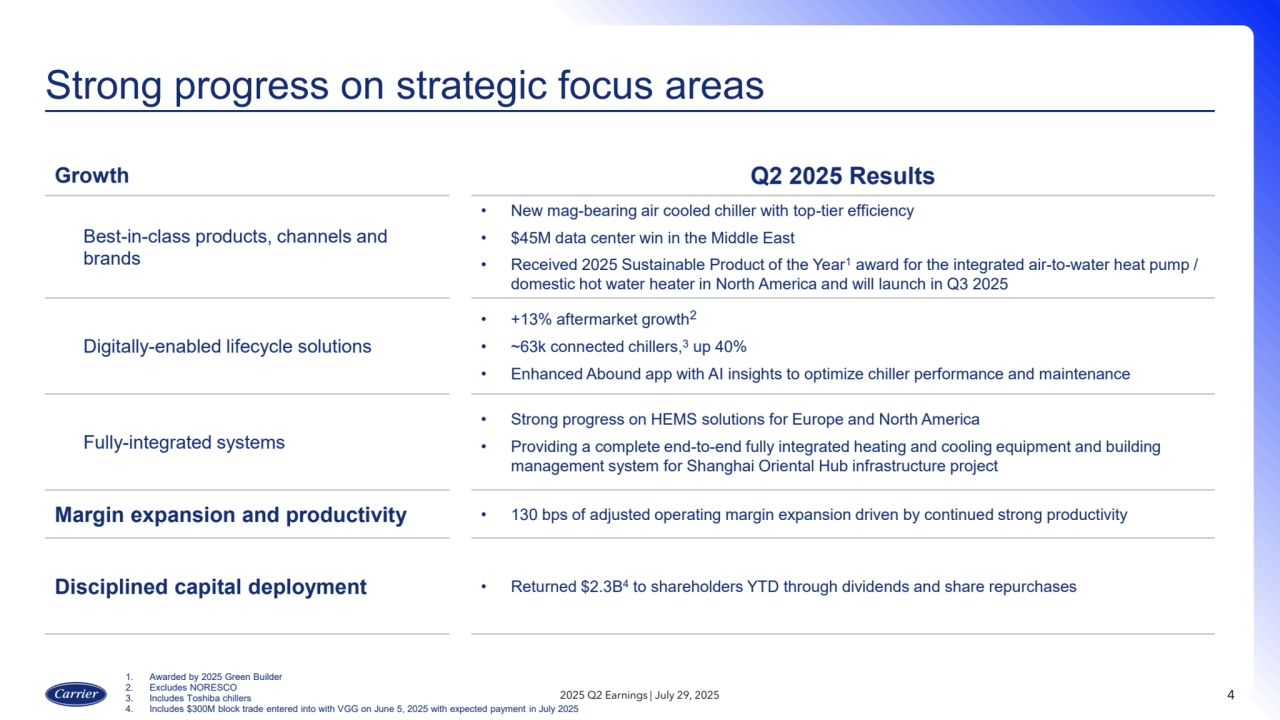
    • 4. Growth Q2 2025 Results Best-in-class products, channels and brands • New mag-bearing air cooled chiller with top-tier efficiency • $45M data center win in the Middle East • Received 2025 Sustainable Product of the Year1 award for the integrated air-to-water heat pump / domestic hot water heater in North America and will launch in Q3 2025 Digitally-enabled lifecycle solutions • +13% aftermarket growth2 • ~63k connected chillers,3 up 40% • Enhanced Abound app with AI insights to optimize chiller performance and maintenance Fully-integrated systems • Strong progress on HEMS solutions for Europe and North America • Providing a complete end-to-end fully integrated heating and cooling equipment and building management system for Shanghai Oriental Hub infrastructure project Margin expansion and productivity • 130 bps of adjusted operating margin expansion driven by continued strong productivity Disciplined capital deployment • Returned $2.3B4 to shareholders YTD through dividends and share repurchases Strong progress on strategic focus areas 2025 Q2 Earnings | July 29, 2025 4 1. Awarded by 2025 Green Builder 2. Excludes NORESCO 3. Includes Toshiba chillers 4. Includes $300M block trade entered into with VGG on June 5, 2025 with expected payment in July 2025
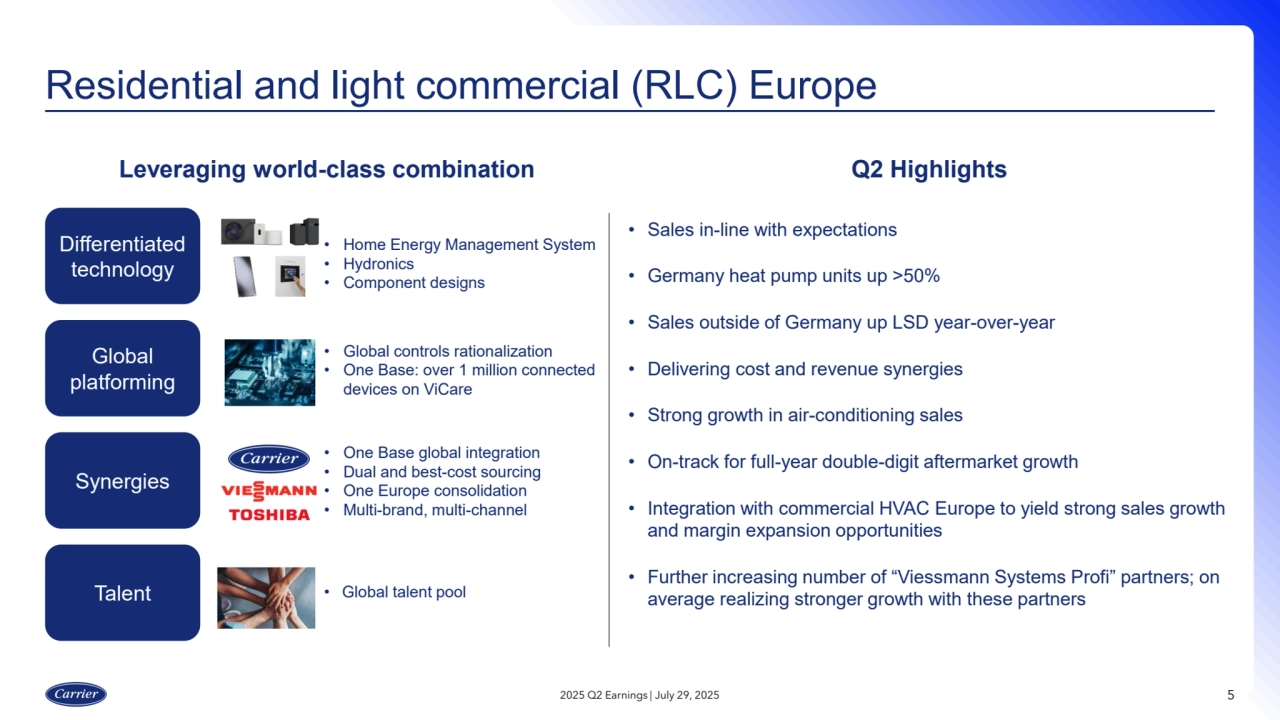
    • 5. Leveraging world-class combination Q2 Highlights • Home Energy Management System • Hydronics • Component designs • Sales in-line with expectations • Germany heat pump units up >50% • Sales outside of Germany up LSD year-over-year • Delivering cost and revenue synergies • Strong growth in air-conditioning sales • On-track for full-year double-digit aftermarket growth • Integration with commercial HVAC Europe to yield strong sales growth and margin expansion opportunities • Further increasing number of “Viessmann Systems Profi” partners; on average realizing stronger growth with these partners • Global controls rationalization • One Base: over 1 million connected devices on ViCare • One Base global integration • Dual and best-cost sourcing • One Europe consolidation • Multi-brand, multi-channel • Global talent pool Residential and light commercial (RLC) Europe 2025 Q2 Earnings | July 29, 2025 5 Differentiated technology Global platforming Synergies Talent
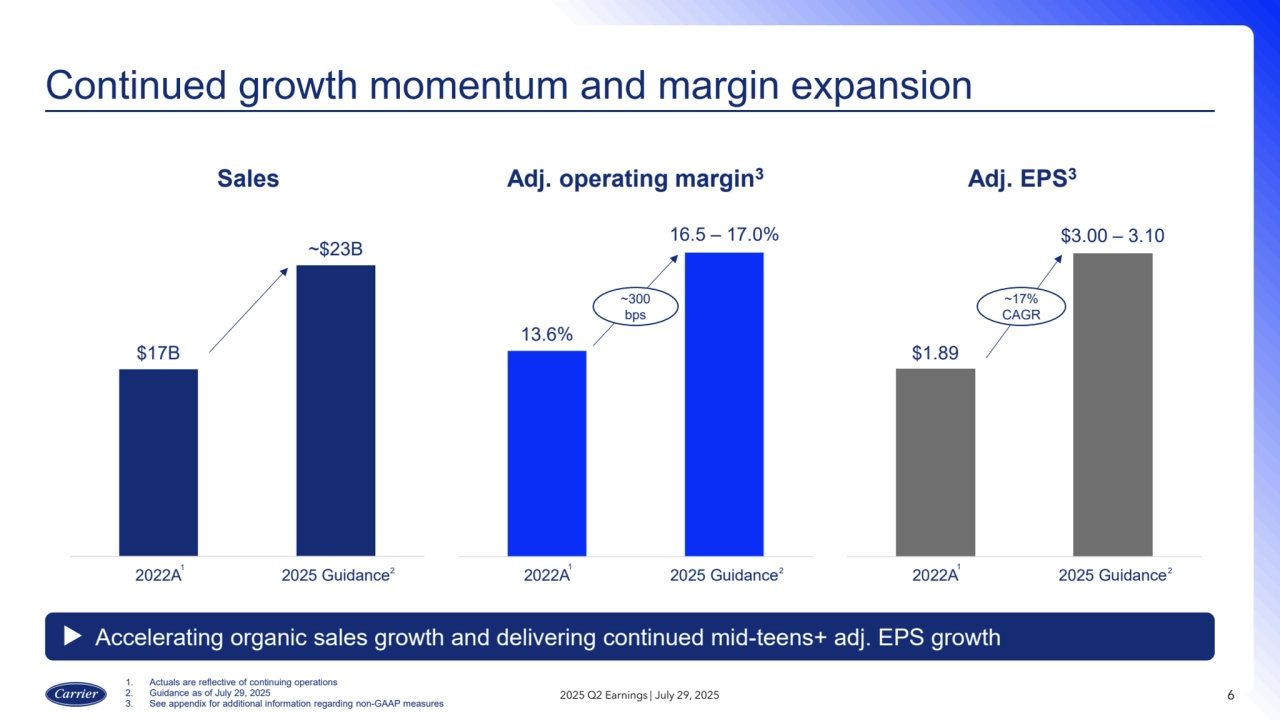
    • 6. $17B ~$23B 2022A 2025 Guidance Continued growth momentum and margin expansion 2025 Q2 Earnings | July 29, 2025 6 Accelerating organic sales growth and delivering continued mid-teens+ adj. EPS growth 13.6% 16.5 – 17.0% 2022A 2025 Guidance2 2 Sales Adj. operating margin3 Adj. EPS3 $1.89 $3.00 – 3.10 2022A 2025 Guidance 2 ~300 bps ~17% CAGR 1. Actuals are reflective of continuing operations 2. Guidance as of July 29, 2025 3. See appendix for additional information regarding non-GAAP measures 1 1 1
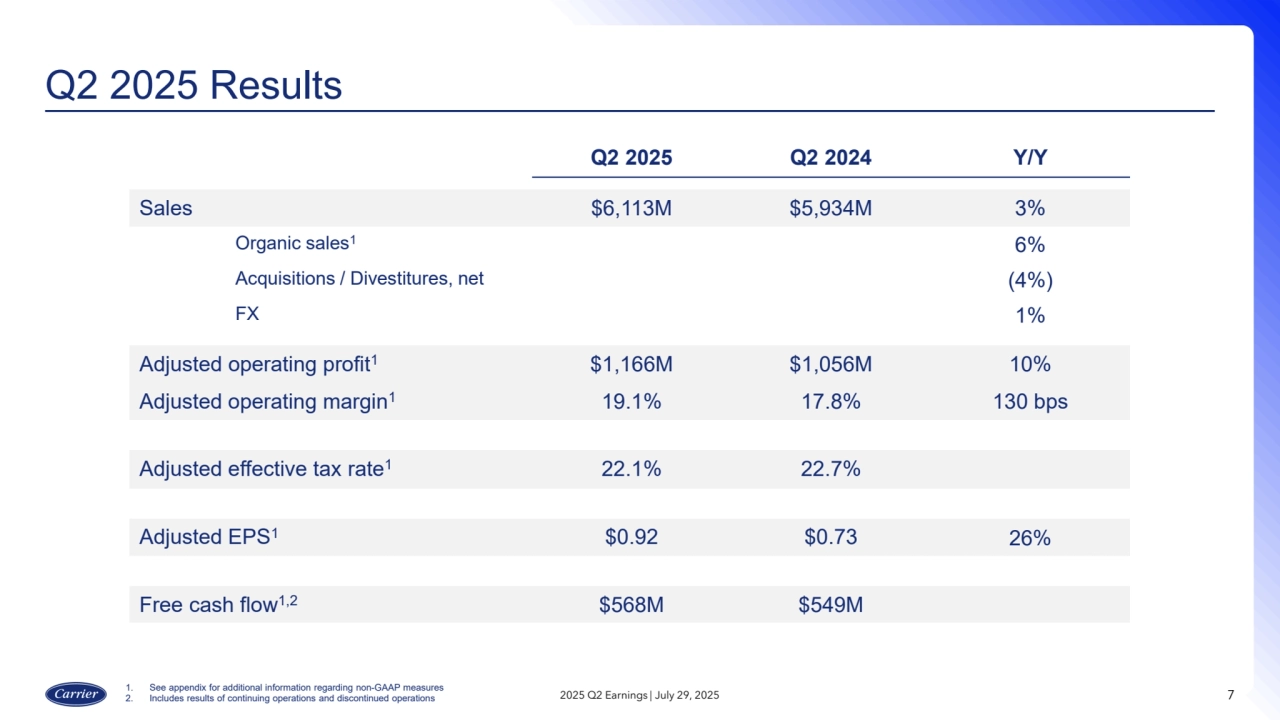
    • 7. Q2 2025 Results 7 Q2 2025 Q2 2024 Y/Y Sales $6,113M $5,934M 3% Organic sales1 6% Acquisitions / Divestitures, net (4%) FX 1% Adjusted operating profit1 $1,166M $1,056M 10% Adjusted operating margin1 19.1% 17.8% 130 bps Adjusted effective tax rate1 22.1% 22.7% Adjusted EPS1 $0.92 $0.73 26% Free cash flow1,2 $568M $549M 2025 Q2 Earnings | July 29, 2025 1. See appendix for additional information regarding non-GAAP measures 2. Includes results of continuing operations and discontinued operations
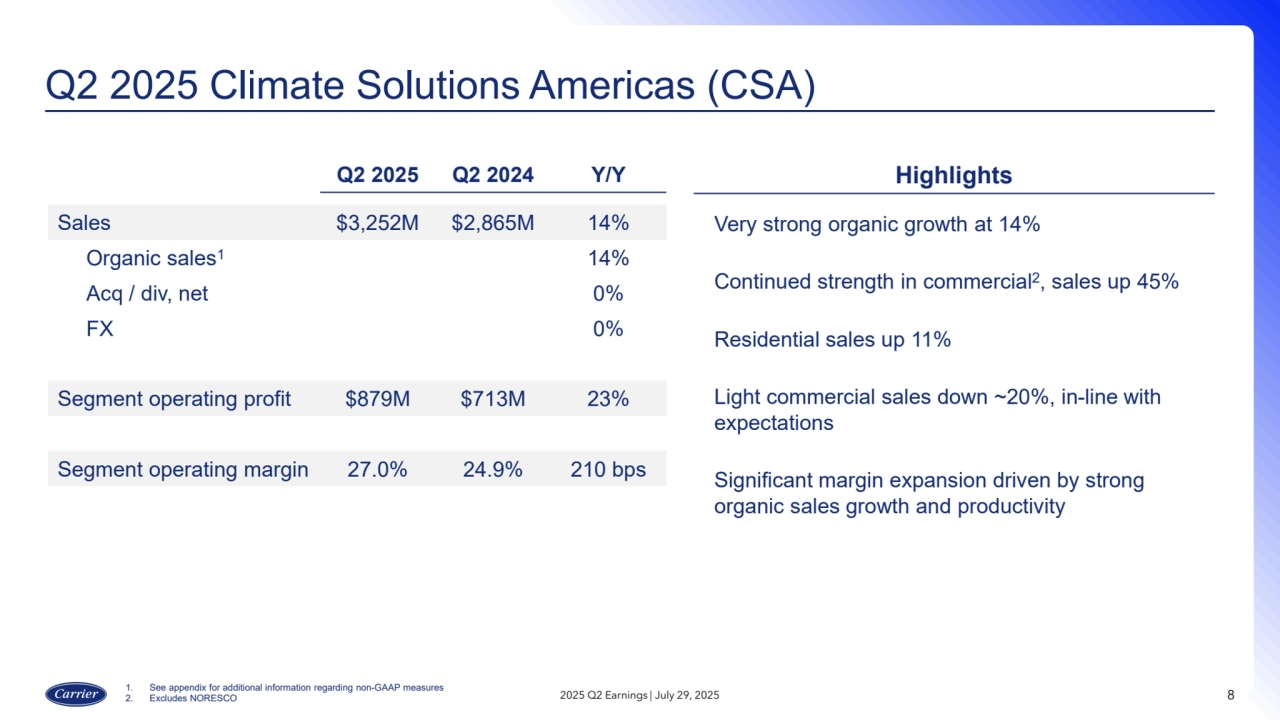
    • 8. Q2 2025 Climate Solutions Americas (CSA) 8 Q2 2025 Q2 2024 Y/Y Sales $3,252M $2,865M 14% Organic sales1 14% Acq / div, net 0% FX 0% Segment operating profit $879M $713M 23% Segment operating margin 27.0% 24.9% 210 bps Highlights Very strong organic growth at 14% Continued strength in commercial2, sales up 45% Residential sales up 11% Light commercial sales down ~20%, in-line with expectations Significant margin expansion driven by strong organic sales growth and productivity 2025 Q2 Earnings | July 29, 2025 1. See appendix for additional information regarding non-GAAP measures 2. Excludes NORESCO
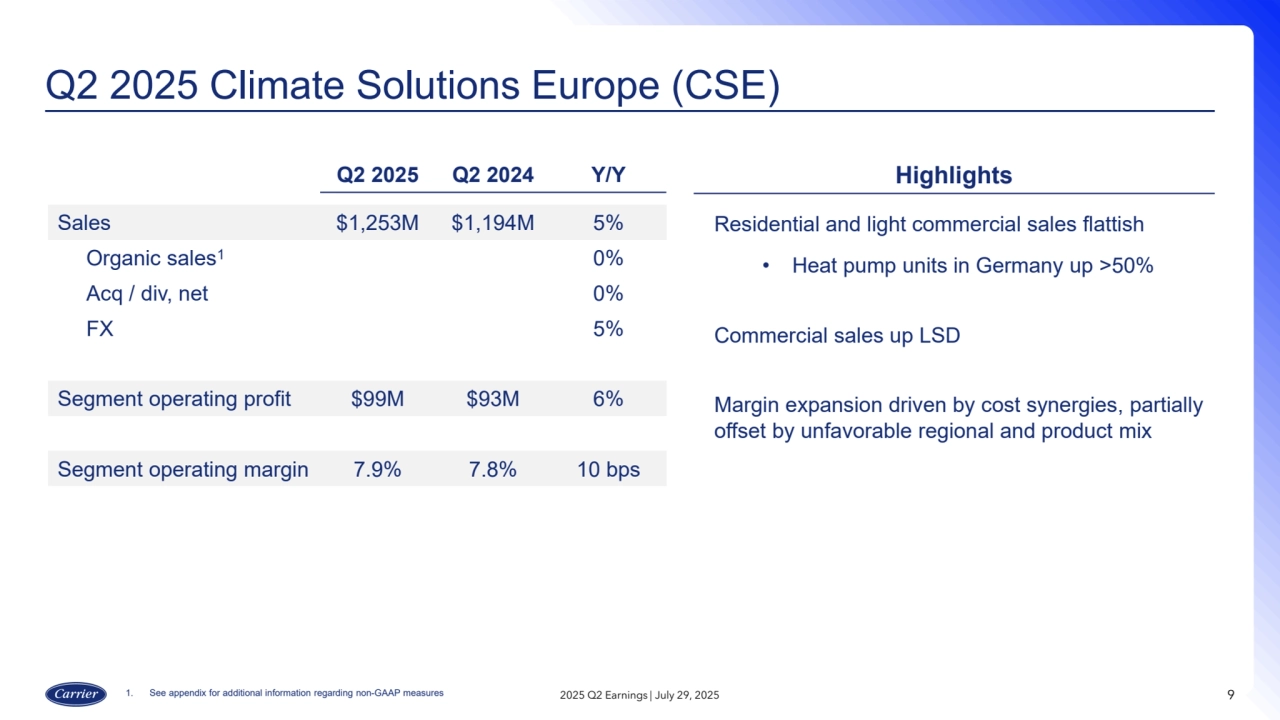
    • 9. Q2 2025 Climate Solutions Europe (CSE) 9 Highlights Residential and light commercial sales flattish • Heat pump units in Germany up >50% Commercial sales up LSD Margin expansion driven by cost synergies, partially offset by unfavorable regional and product mix Q2 2025 Q2 2024 Y/Y Sales $1,253M $1,194M 5% Organic sales1 0% Acq / div, net 0% FX 5% Segment operating profit $99M $93M 6% Segment operating margin 7.9% 7.8% 10 bps 1. See appendix for additional information regarding non-GAAP measures 2025 Q2 Earnings | July 29, 2025
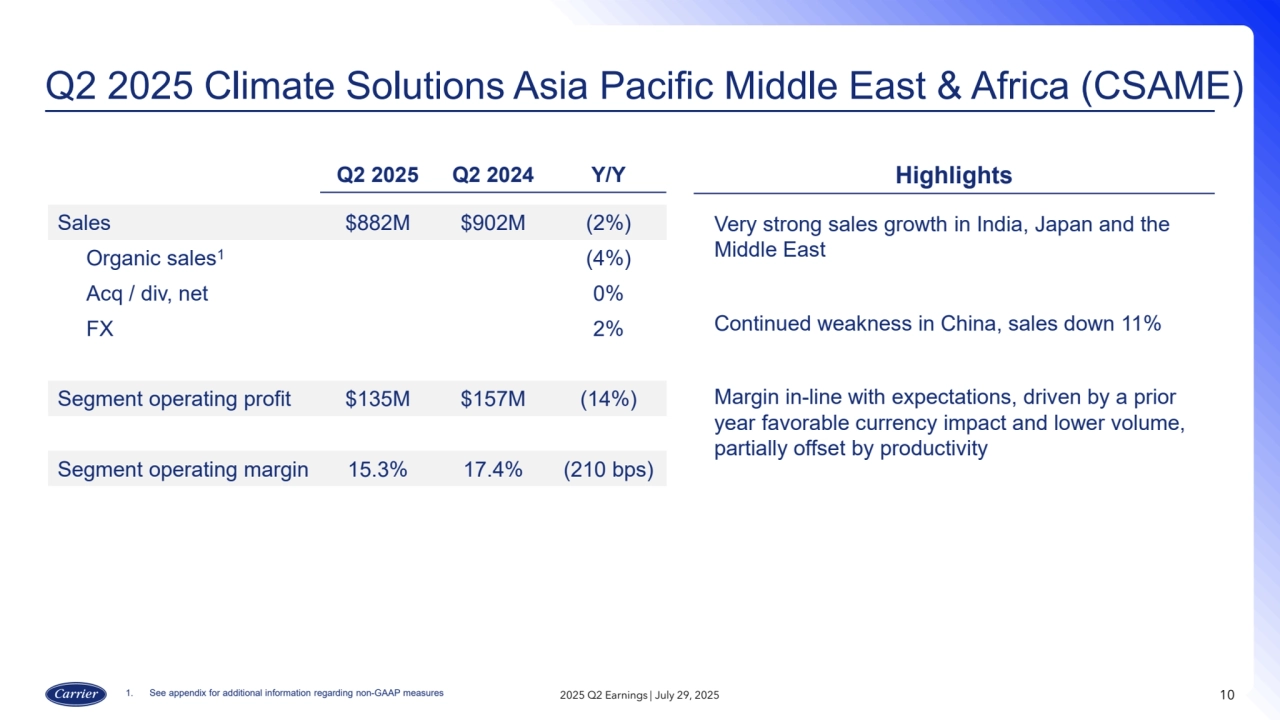
    • 10. Q2 2025 Climate Solutions Asia Pacific Middle East & Africa (CSAME) 10 Highlights Very strong sales growth in India, Japan and the Middle East Continued weakness in China, sales down 11% Margin in-line with expectations, driven by a prior year favorable currency impact and lower volume, partially offset by productivity Q2 2025 Q2 2024 Y/Y Sales $882M $902M (2%) Organic sales1(4%) Acq / div, net 0% FX 2% Segment operating profit $135M $157M (14%) Segment operating margin 15.3% 17.4% (210 bps) 1. See appendix for additional information regarding non-GAAP measures 2025 Q2 Earnings | July 29, 2025
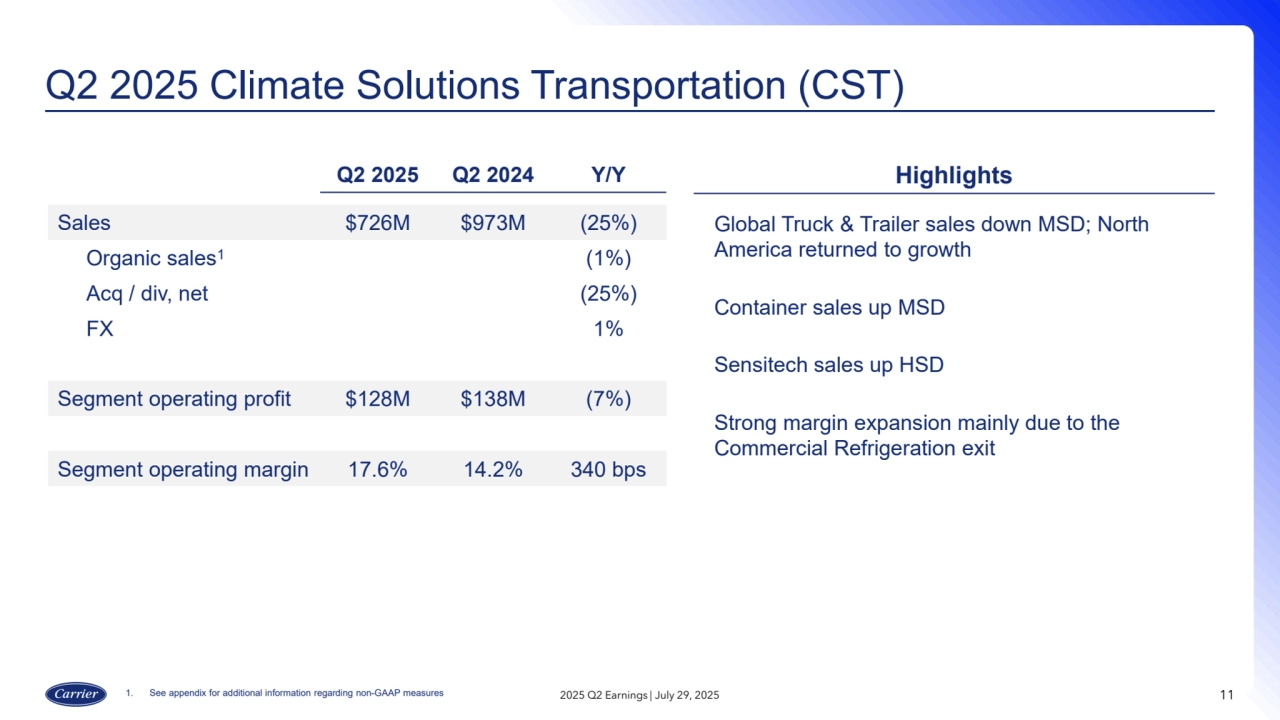
    • 11. Q2 2025 Climate Solutions Transportation (CST) 11 Highlights Global Truck & Trailer sales down MSD; North America returned to growth Container sales up MSD Sensitech sales up HSD Strong margin expansion mainly due to the Commercial Refrigeration exit Q2 2025 Q2 2024 Y/Y Sales $726M $973M (25%) Organic sales1(1%) Acq / div, net (25%) FX 1% Segment operating profit $128M $138M (7%) Segment operating margin 17.6% 14.2% 340 bps 1. See appendix for additional information regarding non-GAAP measures 2025 Q2 Earnings | July 29, 2025
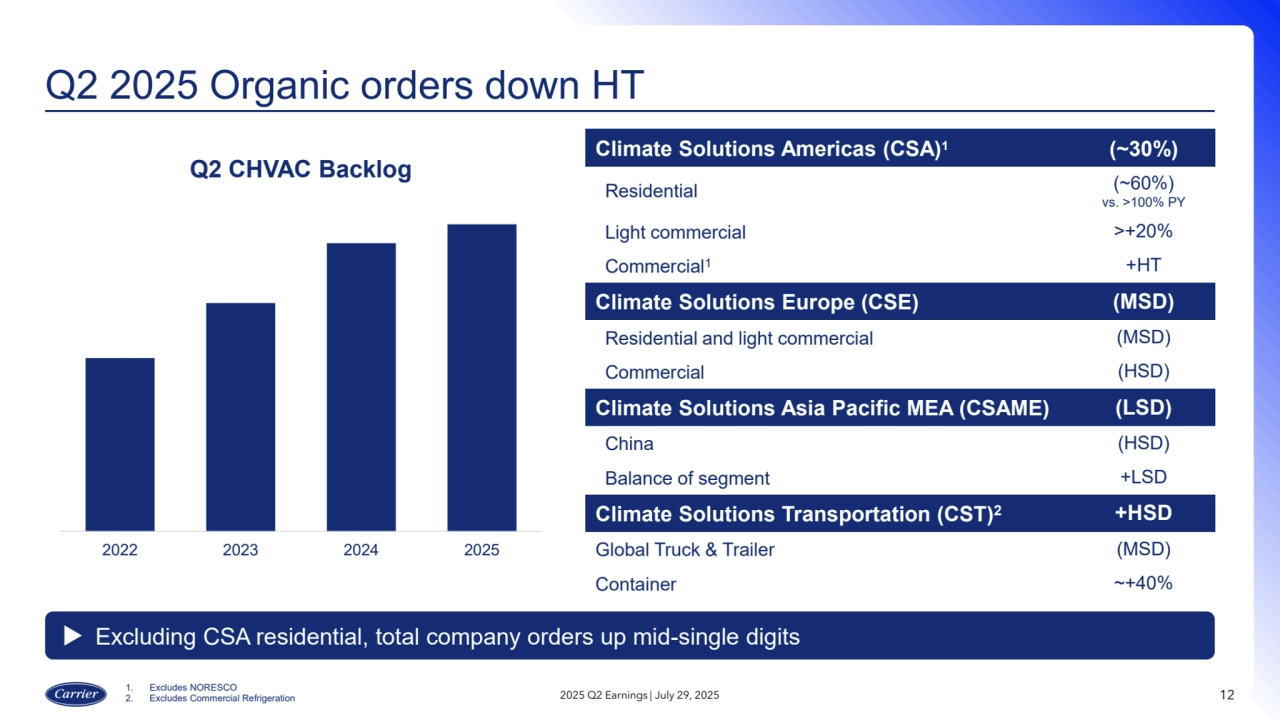
    • 12. Q2 2025 Organic orders down HT 2025 Q2 Earnings | July 29, 2025 12 Excluding CSA residential, total company orders up mid-single digits Climate Solutions Americas (CSA)1(~30%) Residential (~60%) vs. >100% PY Light commercial >+20% Commercial1 +HT Climate Solutions Europe (CSE) (MSD) Residential and light commercial (MSD) Commercial (HSD) Climate Solutions Asia Pacific MEA (CSAME) (LSD) China (HSD) Balance of segment +LSD Climate Solutions Transportation (CST)2 +HSD Global Truck & Trailer (MSD) Container ~+40% 2022 2023 2024 2025 Q2 CHVAC Backlog 1. Excludes NORESCO 2. Excludes Commercial Refrigeration
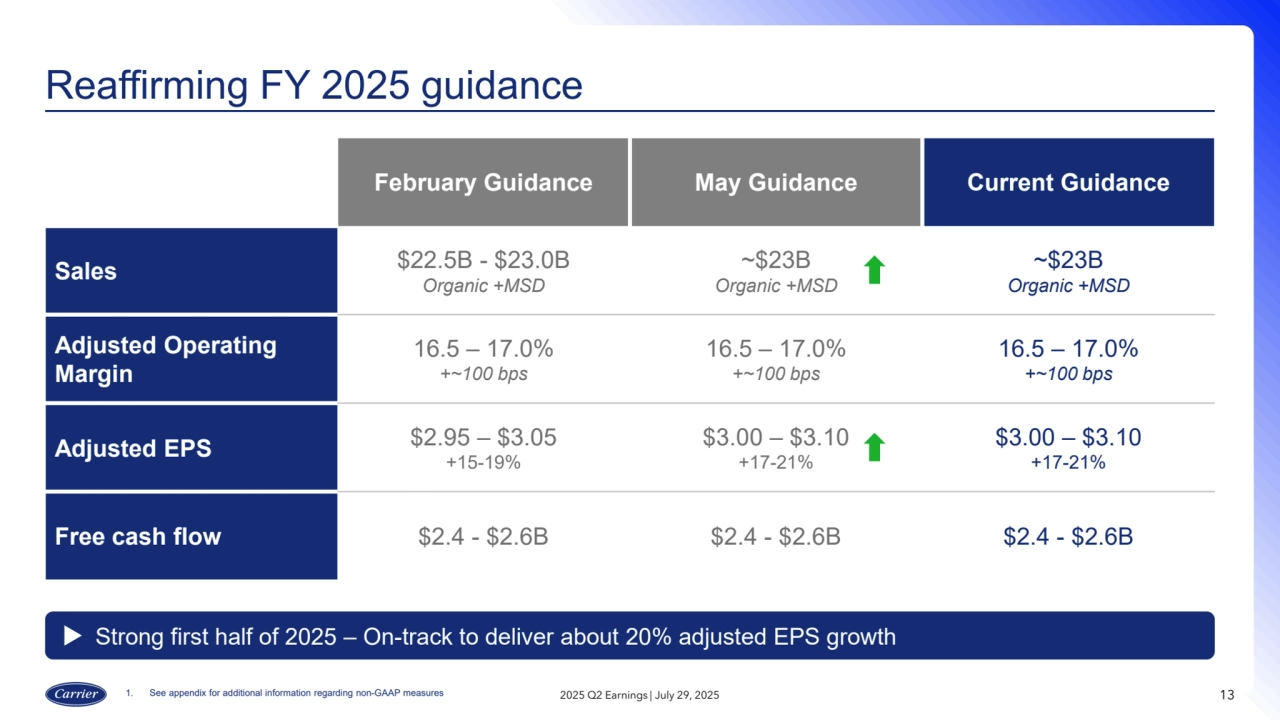
    • 13. Reaffirming FY 2025 guidance 2025 Q2 Earnings | July 29, 2025 13 February Guidance May Guidance Current Guidance Sales $22.5B - $23.0B Organic +MSD ~$23B Organic +MSD ~$23B Organic +MSD Adjusted Operating Margin 16.5 – 17.0% +~100 bps 16.5 – 17.0% +~100 bps 16.5 – 17.0% +~100 bps Adjusted EPS $2.95 – $3.05 +15-19% $3.00 – $3.10 +17-21% $3.00 – $3.10 +17-21% Free cash flow $2.4 - $2.6B $2.4 - $2.6B $2.4 - $2.6B Strong first half of 2025 – On-track to deliver about 20% adjusted EPS growth 1. See appendix for additional information regarding non-GAAP measures
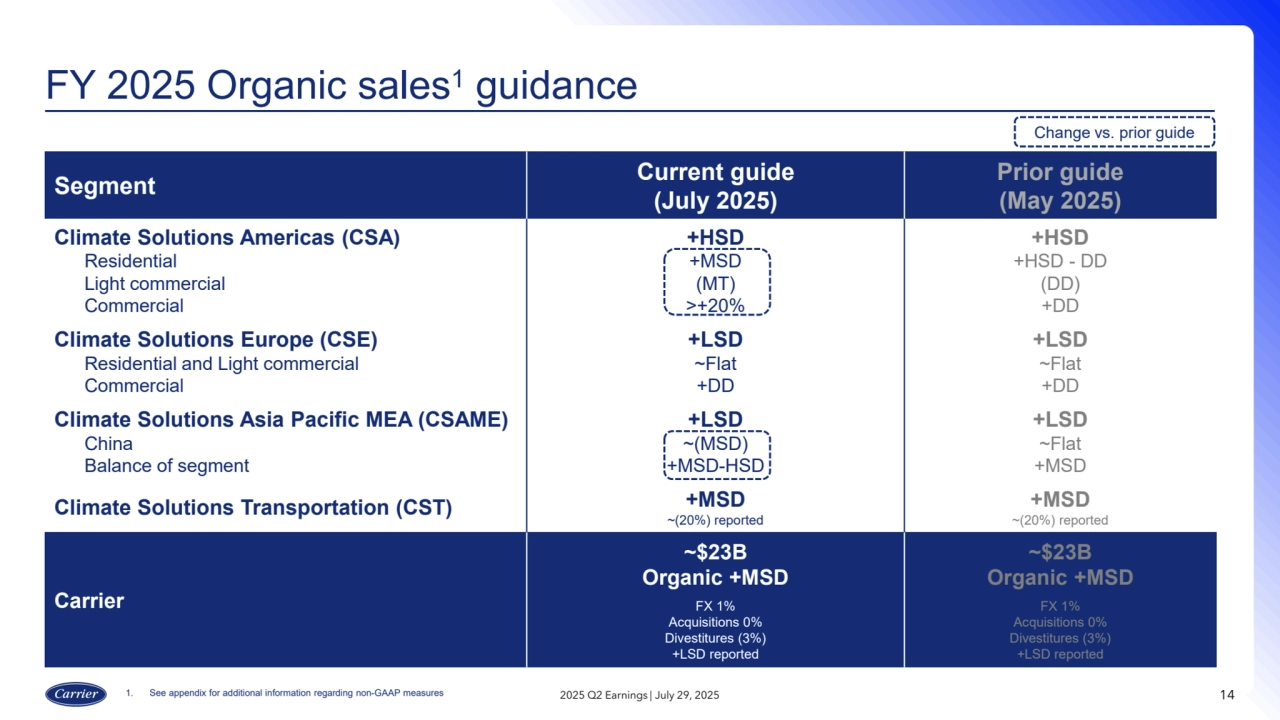
    • 14. FY 2025 Organic sales1 guidance 14 Segment Current guide (July 2025) Prior guide (May 2025) Climate Solutions Americas (CSA) Residential Light commercial Commercial +HSD +MSD (MT) >+20% +HSD +HSD - DD (DD) +DD Climate Solutions Europe (CSE) Residential and Light commercial Commercial +LSD ~Flat +DD +LSD ~Flat +DD Climate Solutions Asia Pacific MEA (CSAME) China Balance of segment +LSD ~(MSD) +MSD-HSD +LSD ~Flat +MSD Climate Solutions Transportation (CST) +MSD ~(20%) reported +MSD ~(20%) reported Carrier ~$23B Organic +MSD FX 1% Acquisitions 0% Divestitures (3%) +LSD reported ~$23B Organic +MSD FX 1% Acquisitions 0% Divestitures (3%) +LSD reported Change vs. prior guide 1. See appendix for additional information regarding non-GAAP measures 2025 Q2 Earnings | July 29, 2025
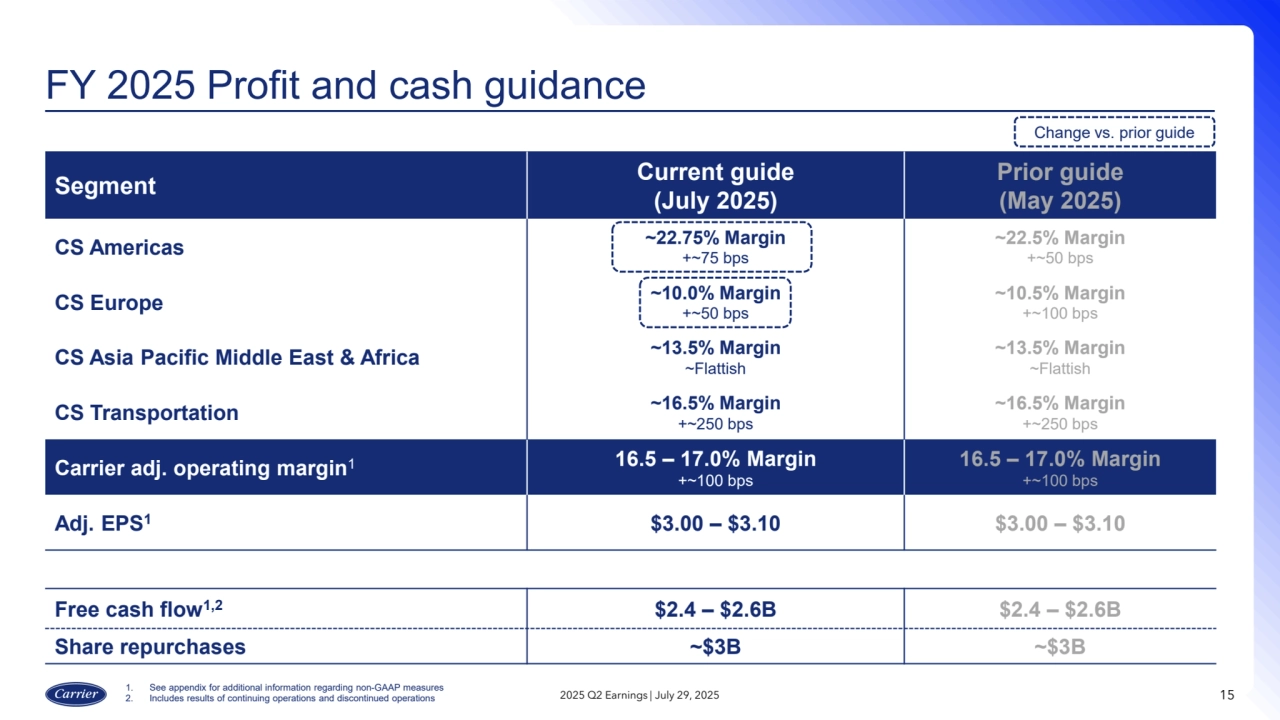
    • 15. FY 2025 Profit and cash guidance 15 Segment Current guide (July 2025) Prior guide (May 2025) CS Americas ~22.75% Margin +~75 bps ~22.5% Margin +~50 bps CS Europe ~10.0% Margin +~50 bps ~10.5% Margin +~100 bps CS Asia Pacific Middle East & Africa ~13.5% Margin ~Flattish ~13.5% Margin ~Flattish CS Transportation ~16.5% Margin +~250 bps ~16.5% Margin +~250 bps Carrier adj. operating margin1 16.5 – 17.0% Margin +~100 bps 16.5 – 17.0% Margin +~100 bps Adj. EPS1 $3.00 – $3.10 $3.00 – $3.10 Free cash flow1,2 $2.4 – $2.6B $2.4 – $2.6B Share repurchases ~$3B ~$3B Change vs. prior guide 2025 Q2 Earnings | July 29, 2025 1. See appendix for additional information regarding non-GAAP measures 2. Includes results of continuing operations and discontinued operations
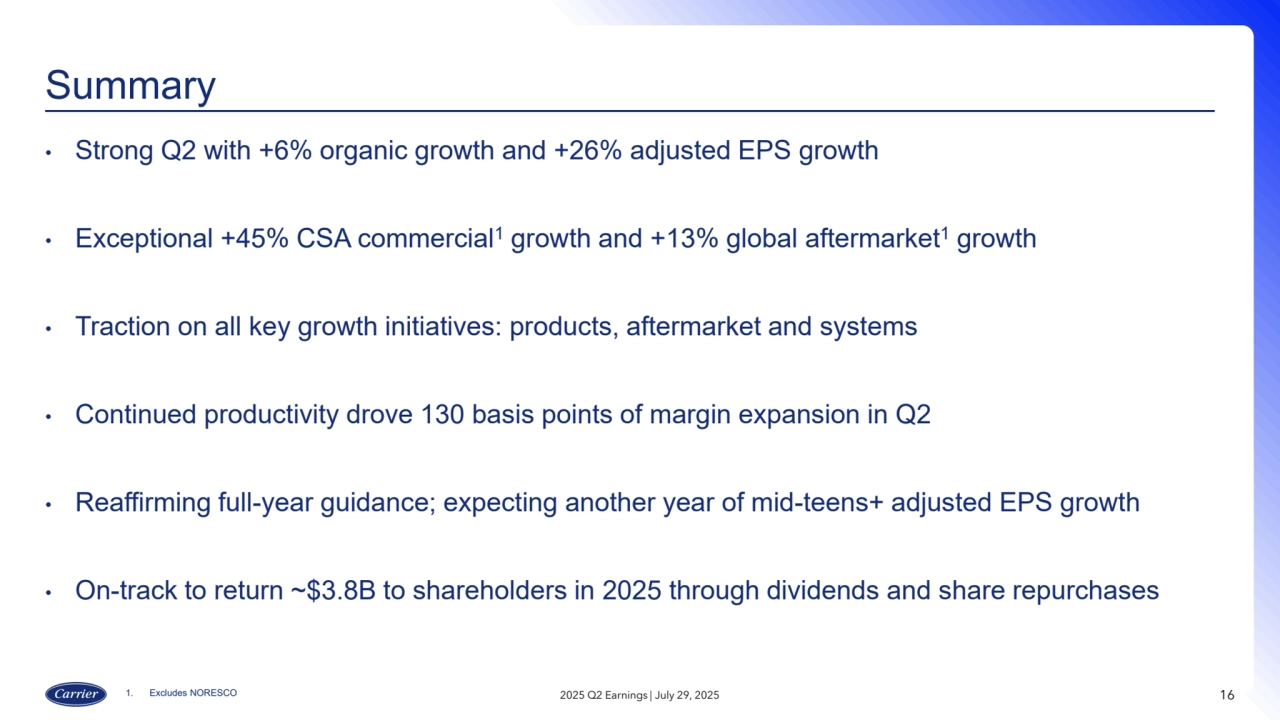
    • 16. Summary 2025 Q2 Earnings | July 29, 2025 16 • Strong Q2 with +6% organic growth and +26% adjusted EPS growth • Exceptional +45% CSA commercial1 growth and +13% global aftermarket1 growth • Traction on all key growth initiatives: products, aftermarket and systems • Continued productivity drove 130 basis points of margin expansion in Q2 • Reaffirming full-year guidance; expecting another year of mid-teens+ adjusted EPS growth • On-track to return ~$3.8B to shareholders in 2025 through dividends and share repurchases 1. Excludes NORESCO
    • 17. APPENDIX 17
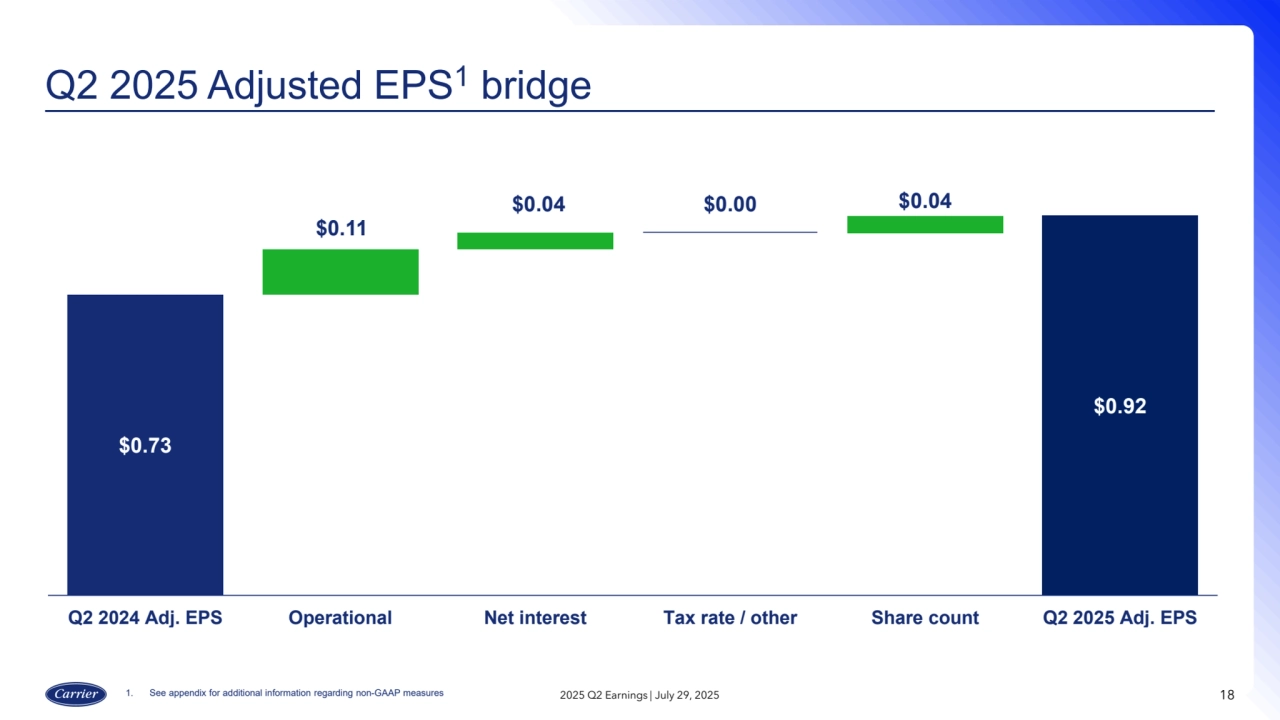
    • 18. Q2 2025 Adjusted EPS1 bridge 1. See appendix for additional information regarding non-GAAP measures 2025 Q2 Earnings | July 29, 2025 18 $0.73 $0.11 $0.04 $0.00 $0.04 $0.92 Q2 2024 Adj. EPS Operational Net interest Tax rate / other Share count Q2 2025 Adj. EPS
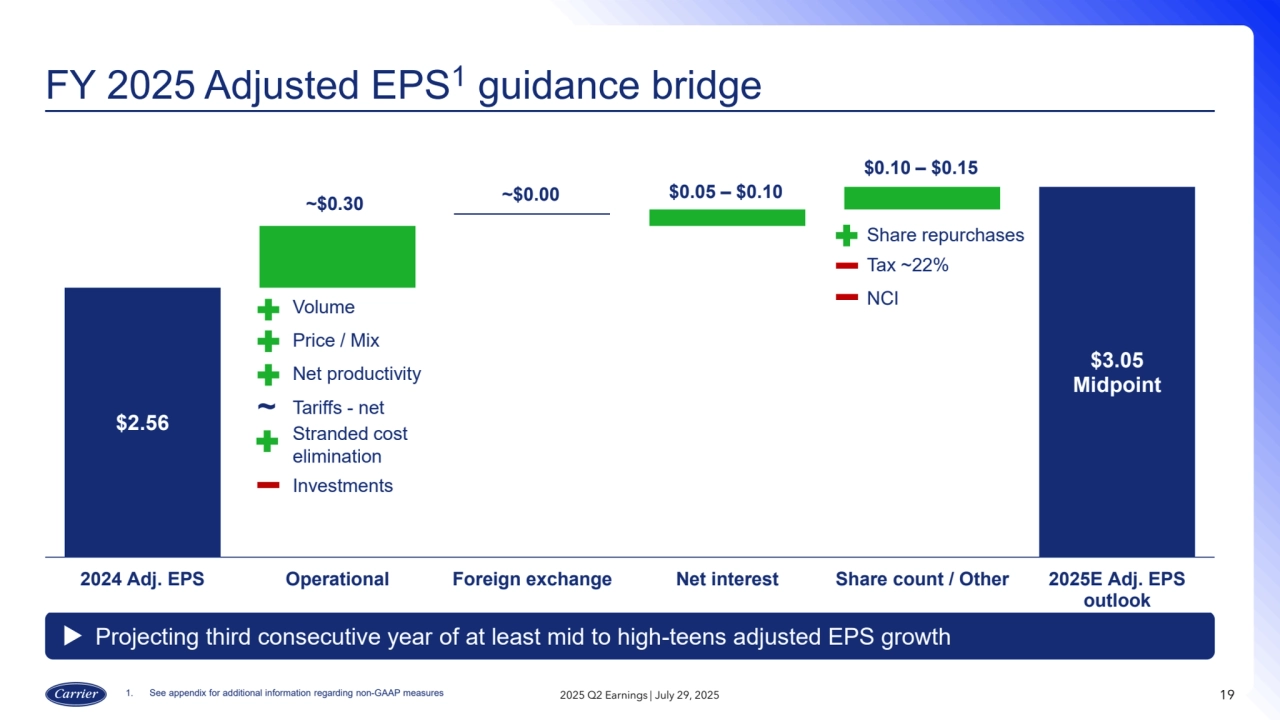
    • 19. FY 2025 Adjusted EPS1 guidance bridge 19 Projecting third consecutive year of at least mid to high-teens adjusted EPS growth 2025 Q2 Earnings | July 29, 2025 $2.56 $3.05 Midpoint 2024 Adj. EPS Operational Foreign exchange Net interest Share count / Other 2025E Adj. EPS outlook $0.05 – $0.10 $0.10 – $0.15 Share repurchases Tax ~22% NCI ~$0.30 ~$0.00 1. See appendix for additional information regarding non-GAAP measures Volume Price / Mix Net productivity Tariffs - net Stranded cost elimination Investments ~
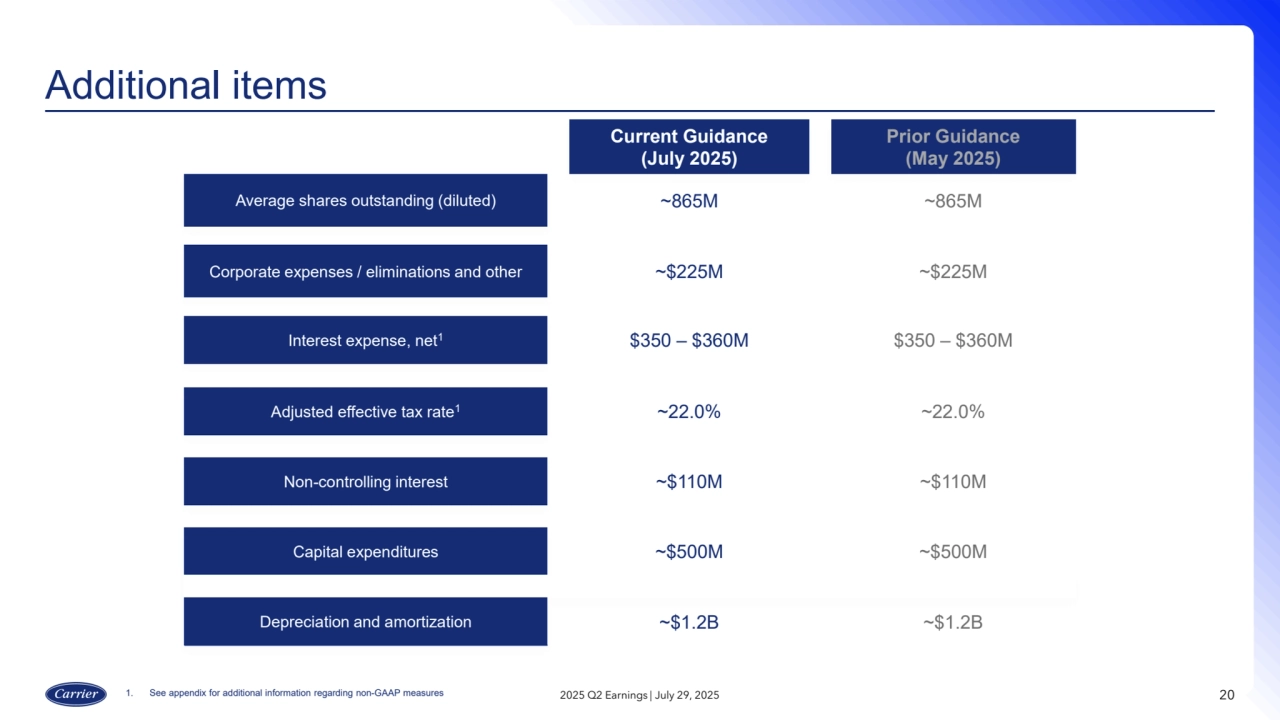
    • 20. 20 Additional items Current Guidance (July 2025) Prior Guidance (May 2025) Average shares outstanding (diluted) ~865M ~865M Corporate expenses / eliminations and other ~$225M ~$225M Interest expense, net1 $350 – $360M $350 – $360M Adjusted effective tax rate1 ~22.0% ~22.0% Non-controlling interest ~$110M ~$110M Capital expenditures ~$500M ~$500M Depreciation and amortization ~$1.2B ~$1.2B 1. See appendix for additional information regarding non-GAAP measures 2025 Q2 Earnings | July 29, 2025
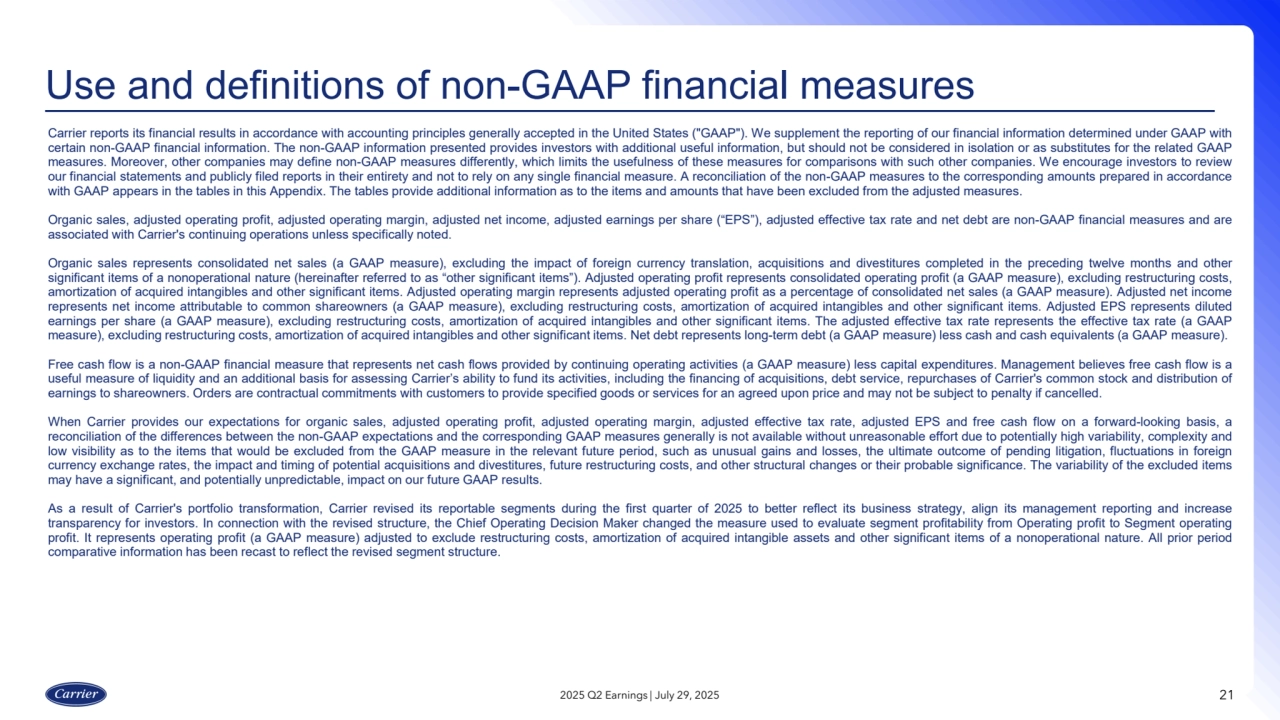
    • 21. 21 Use and definitions of non-GAAP financial measures Carrier reports its financial results in accordance with accounting principles generally accepted in the United States ("GAAP"). We supplement the reporting of our financial information determined under GAAP with certain non-GAAP financial information. The non-GAAP information presented provides investors with additional useful information, but should not be considered in isolation or as substitutes for the related GAAP measures. Moreover, other companies may define non-GAAP measures differently, which limits the usefulness of these measures for comparisons with such other companies. We encourage investors to review our financial statements and publicly filed reports in their entirety and not to rely on any single financial measure. A reconciliation of the non-GAAP measures to the corresponding amounts prepared in accordance with GAAP appears in the tables in this Appendix. The tables provide additional information as to the items and amounts that have been excluded from the adjusted measures. Organic sales, adjusted operating profit, adjusted operating margin, adjusted net income, adjusted earnings per share (“EPS”), adjusted effective tax rate and net debt are non-GAAP financial measures and are associated with Carrier's continuing operations unless specifically noted. Organic sales represents consolidated net sales (a GAAP measure), excluding the impact of foreign currency translation, acquisitions and divestitures completed in the preceding twelve months and other significant items of a nonoperational nature (hereinafter referred to as “other significant items”). Adjusted operating profit represents consolidated operating profit (a GAAP measure), excluding restructuring costs, amortization of acquired intangibles and other significant items. Adjusted operating margin represents adjusted operating profit as a percentage of consolidated net sales (a GAAP measure). Adjusted net income represents net income attributable to common shareowners (a GAAP measure), excluding restructuring costs, amortization of acquired intangibles and other significant items. Adjusted EPS represents diluted earnings per share (a GAAP measure), excluding restructuring costs, amortization of acquired intangibles and other significant items. The adjusted effective tax rate represents the effective tax rate (a GAAP measure), excluding restructuring costs, amortization of acquired intangibles and other significant items. Net debt represents long-term debt (a GAAP measure) less cash and cash equivalents (a GAAP measure). Free cash flow is a non-GAAP financial measure that represents net cash flows provided by continuing operating activities (a GAAP measure) less capital expenditures. Management believes free cash flow is a useful measure of liquidity and an additional basis for assessing Carrier’s ability to fund its activities, including the financing of acquisitions, debt service, repurchases of Carrier's common stock and distribution of earnings to shareowners. Orders are contractual commitments with customers to provide specified goods or services for an agreed upon price and may not be subject to penalty if cancelled. When Carrier provides our expectations for organic sales, adjusted operating profit, adjusted operating margin, adjusted effective tax rate, adjusted EPS and free cash flow on a forward-looking basis, a reconciliation of the differences between the non-GAAP expectations and the corresponding GAAP measures generally is not available without unreasonable effort due to potentially high variability, complexity and low visibility as to the items that would be excluded from the GAAP measure in the relevant future period, such as unusual gains and losses, the ultimate outcome of pending litigation, fluctuations in foreign currency exchange rates, the impact and timing of potential acquisitions and divestitures, future restructuring costs, and other structural changes or their probable significance. The variability of the excluded items may have a significant, and potentially unpredictable, impact on our future GAAP results. As a result of Carrier's portfolio transformation, Carrier revised its reportable segments during the first quarter of 2025 to better reflect its business strategy, align its management reporting and increase transparency for investors. In connection with the revised structure, the Chief Operating Decision Maker changed the measure used to evaluate segment profitability from Operating profit to Segment operating profit. It represents operating profit (a GAAP measure) adjusted to exclude restructuring costs, amortization of acquired intangible assets and other significant items of a nonoperational nature. All prior period comparative information has been recast to reflect the revised segment structure. 2025 Q2 Earnings | July 29, 2025
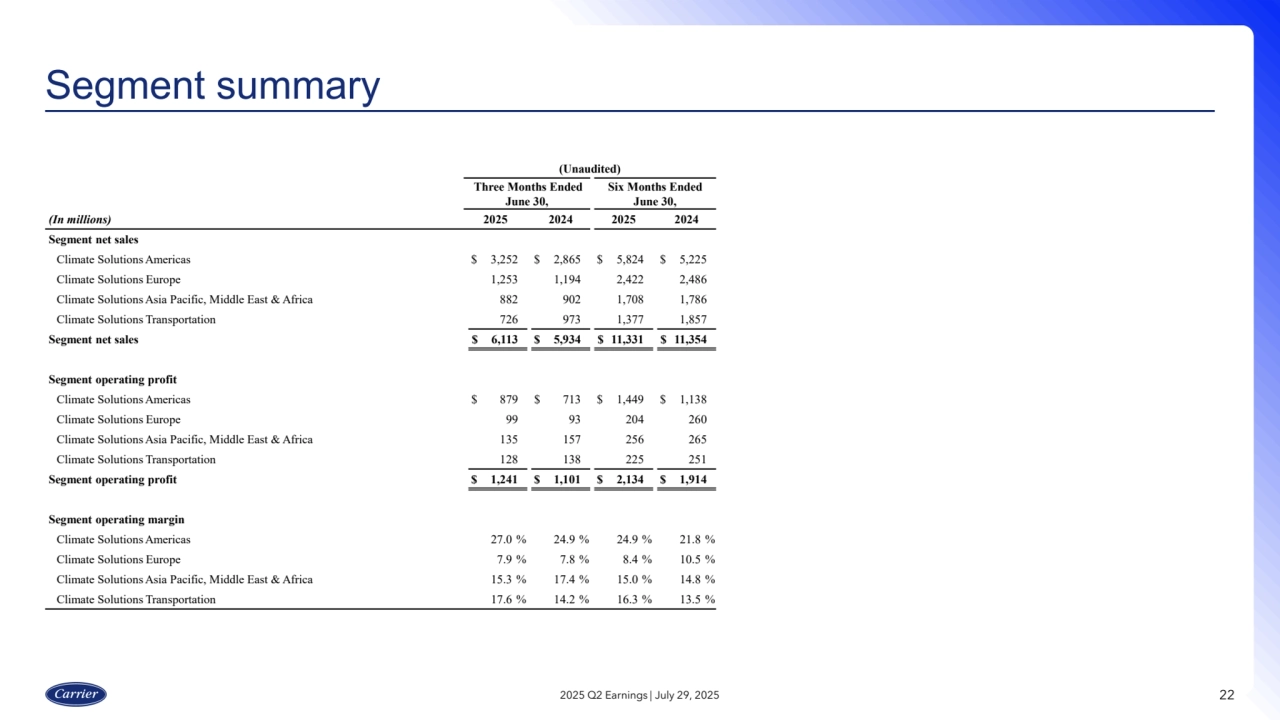
    • 22. 22 Segment summary 2025 Q2 Earnings | July 29, 2025 (Unaudited) Three Months Ended June 30, Six Months Ended June 30, (In millions) 2025 2024 2025 2024 Segment net sales Climate Solutions Americas $ 3,252 $ 2,865 $ 5,824 $ 5,225 Climate Solutions Europe 1,253 1,194 2,422 2,486 Climate Solutions Asia Pacific, Middle East & Africa 882 902 1,708 1,786 Climate Solutions Transportation 726 973 1,377 1,857 Segment net sales $ 6,113 $ 5,934 $ 11,331 $ 11,354 Segment operating profit Climate Solutions Americas $ 879 $ 713 $ 1,449 $ 1,138 Climate Solutions Europe 99 93 204 260 Climate Solutions Asia Pacific, Middle East & Africa 135 157 256 265 Climate Solutions Transportation 128 138 225 251 Segment operating profit $ 1,241 $ 1,101 $ 2,134 $ 1,914 Segment operating margin Climate Solutions Americas 27.0 % 24.9 % 24.9 % 21.8 % Climate Solutions Europe 7.9 % 7.8 % 8.4 % 10.5 % Climate Solutions Asia Pacific, Middle East & Africa 15.3 % 17.4 % 15.0 % 14.8 % Climate Solutions Transportation 17.6 % 14.2 % 16.3 % 13.5 %
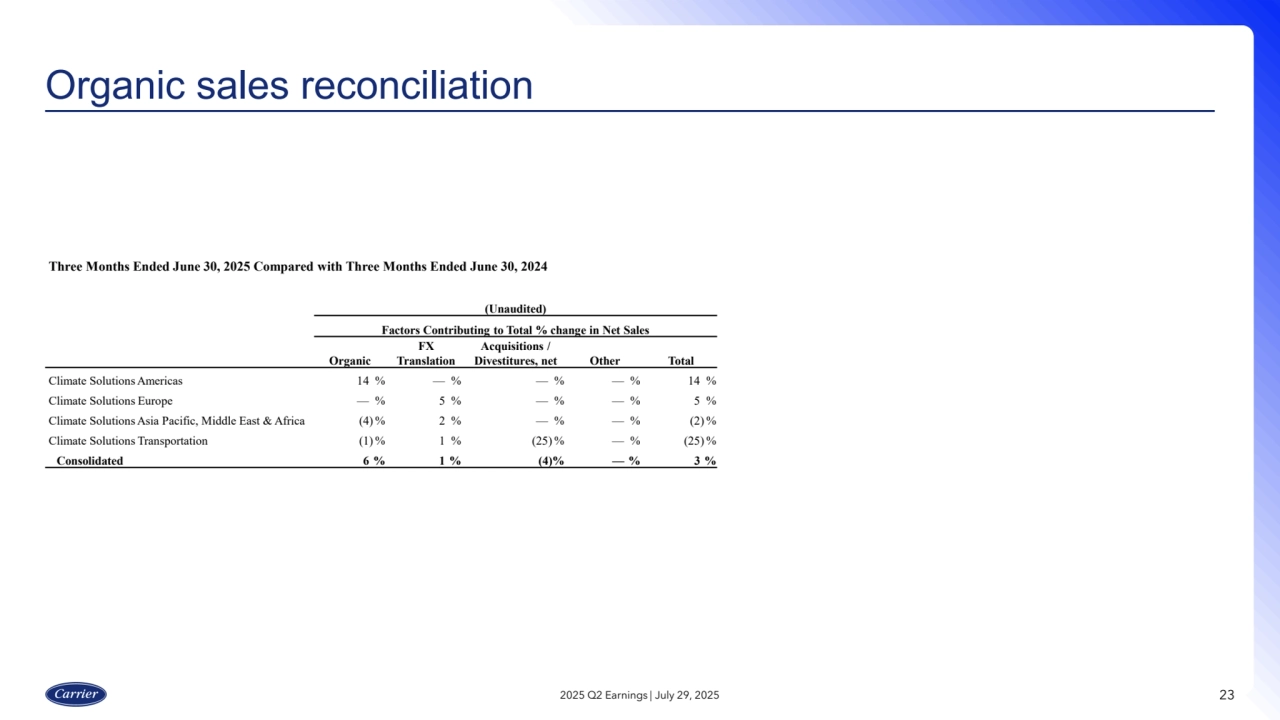
    • 23. 23 Organic sales reconciliation 2025 Q2 Earnings | July 29, 2025 Three Months Ended June 30, 2025 Compared with Three Months Ended June 30, 2024 (Unaudited) Factors Contributing to Total % change in Net Sales Organic FX Translation Acquisitions / Divestitures, net Other Total Climate Solutions Americas 14 % — % — % — % 14 % Climate Solutions Europe — % 5 % — % — % 5 % Climate Solutions Asia Pacific, Middle East & Africa (4) % 2 % — % — % (2) % Climate Solutions Transportation (1) % 1 % (25) % — % (25) % Consolidated 6 % 1 % (4)% — % 3 %
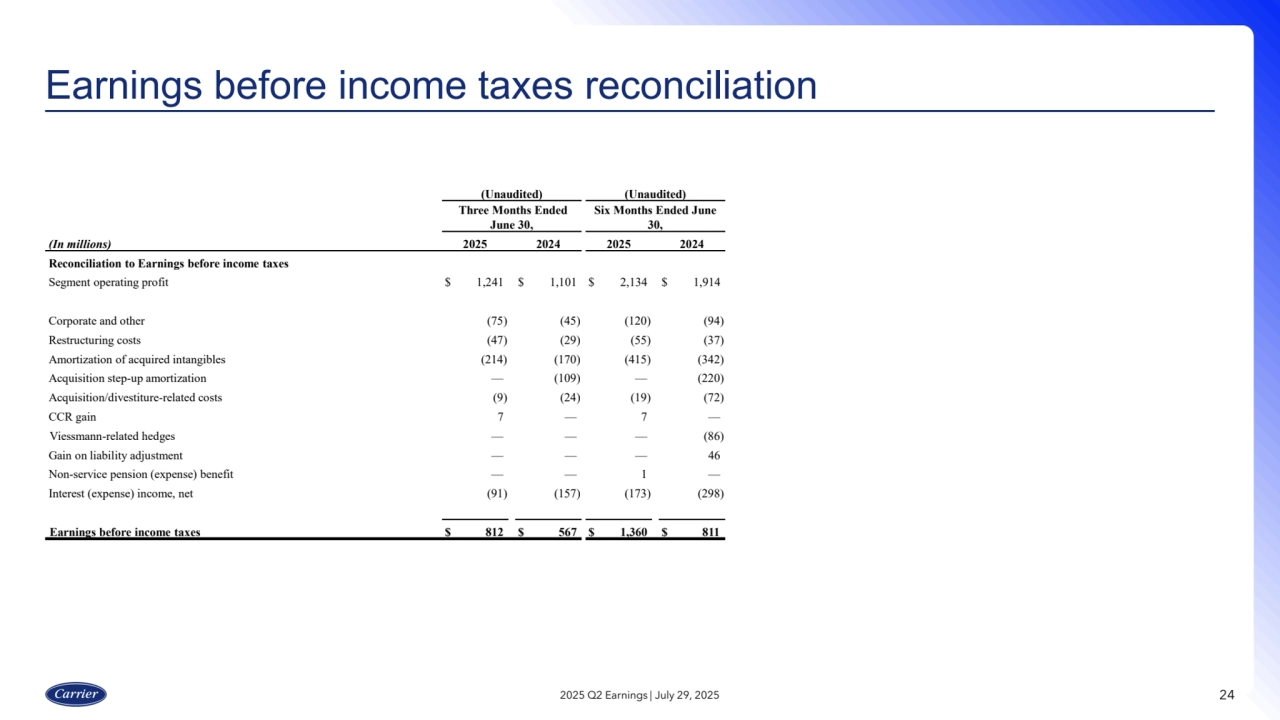
    • 24. 24 Earnings before income taxes reconciliation 2025 Q2 Earnings | July 29, 2025 (Unaudited) (Unaudited) Three Months Ended June 30, Six Months Ended June 30, (In millions) 2025 2024 2025 2024 Reconciliation to Earnings before income taxes Segment operating profit $ 1,241 $ 1,101 $ 2,134 $ 1,914 Corporate and other (75) (45) (120) (94) Restructuring costs (47) (29) (55) (37) Amortization of acquired intangibles (214) (170) (415) (342) Acquisition step-up amortization — (109) — (220) Acquisition/divestiture-related costs (9) (24) (19) (72) CCR gain 7 — 7 — Viessmann-related hedges — — — (86) Gain on liability adjustment — — — 46 Non-service pension (expense) benefit — — 1 — Interest (expense) income, net (91) (157) (173) (298) Earnings before income taxes $ 812 $ 567 $ 1,360 $ 811
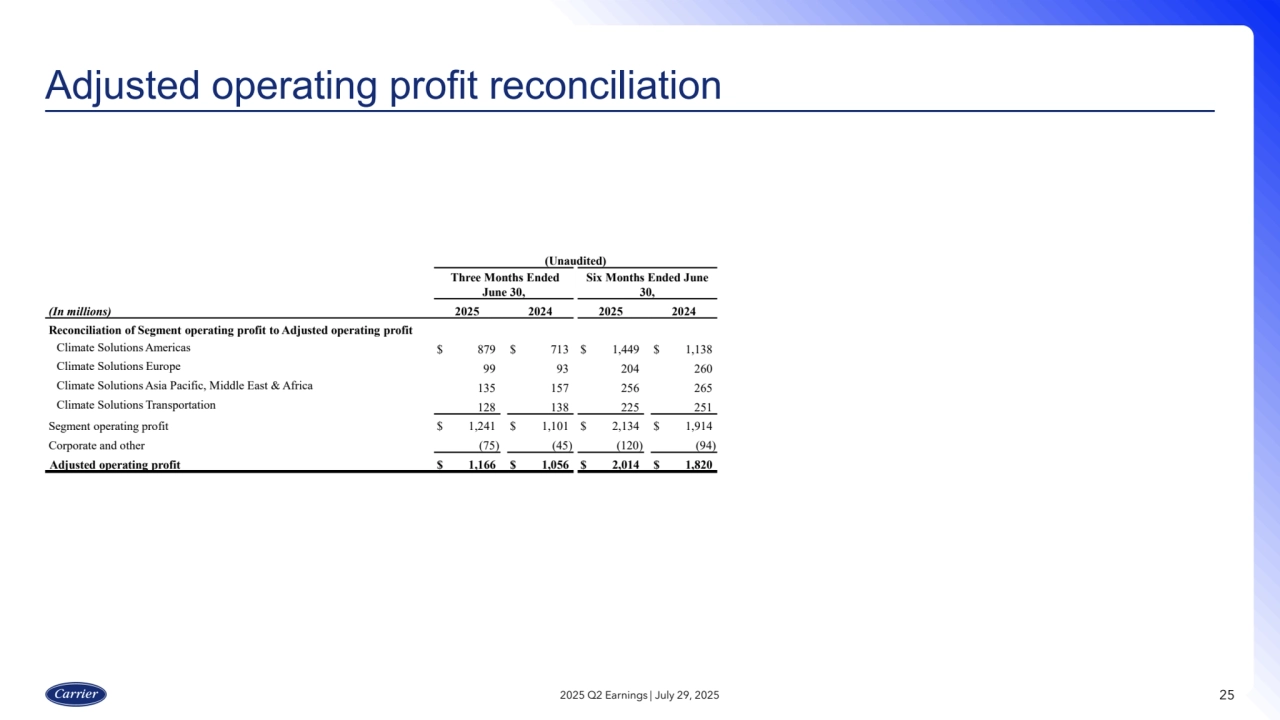
    • 25. 25 Adjusted operating profit reconciliation 2025 Q2 Earnings | July 29, 2025 (Unaudited) Three Months Ended June 30, Six Months Ended June 30, (In millions) 2025 2024 2025 2024 Reconciliation of Segment operating profit to Adjusted operating profit Climate Solutions Americas $ 879 $ 713 $ 1,449 $ 1,138 Climate Solutions Europe 99 93 204 260 Climate Solutions Asia Pacific, Middle East & Africa 135 157 256 265 Climate Solutions Transportation 128 138 225 251 Segment operating profit $ 1,241 $ 1,101 $ 2,134 $ 1,914 Corporate and other (75) (45) (120) (94) Adjusted operating profit $ 1,166 $ 1,056 $ 2,014 $ 1,820
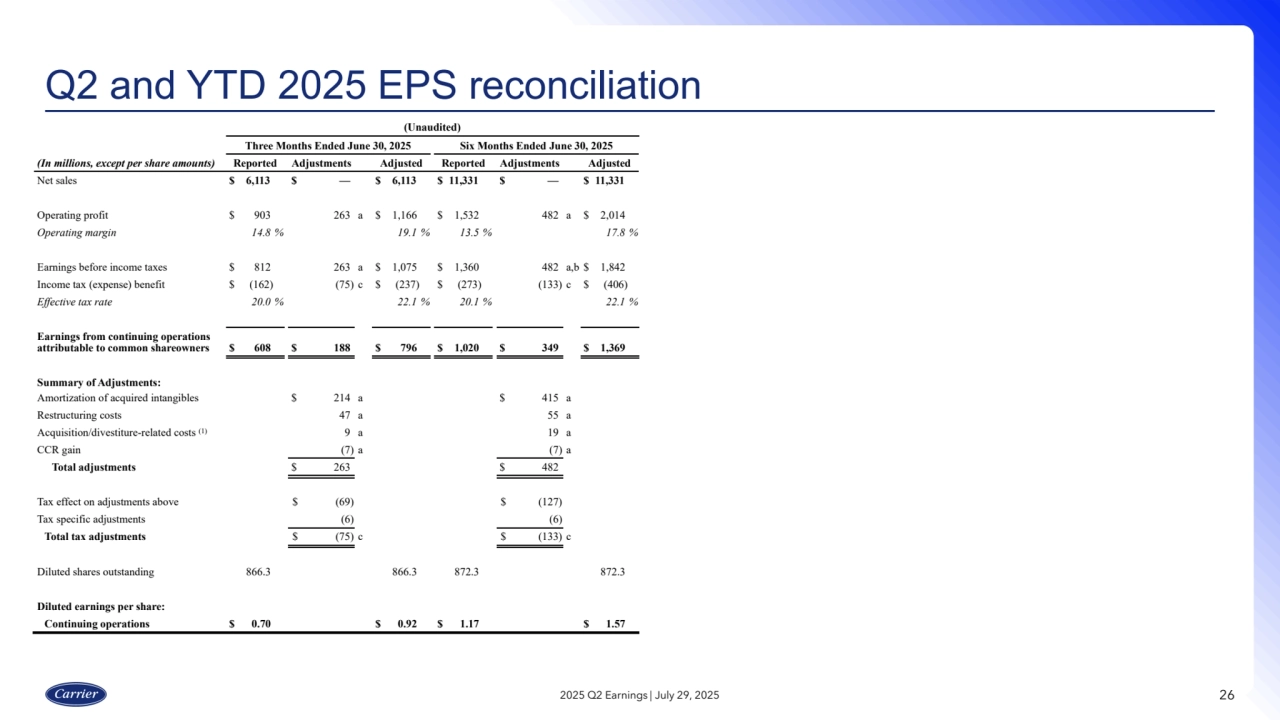
    • 26. 26 Q2 and YTD 2025 EPS reconciliation 2025 Q2 Earnings | July 29, 2025 (Unaudited) Three Months Ended June 30, 2025 Six Months Ended June 30, 2025 (In millions, except per share amounts) Reported Adjustments Adjusted Reported Adjustments Adjusted Net sales $ 6,113 $ — $ 6,113 $ 11,331 $ — $ 11,331 Operating profit $ 903 263 a $ 1,166 $ 1,532 482 a $ 2,014 Operating margin 14.8 % 19.1 % 13.5 % 17.8 % Earnings before income taxes $ 812 263 a $ 1,075 $ 1,360 482 a,b $ 1,842 Income tax (expense) benefit $ (162) (75) c $ (237) $ (273) (133) c $ (406) Effective tax rate 20.0 % 22.1 % 20.1 % 22.1 % Earnings from continuing operations attributable to common shareowners $ 608 $ 188 $ 796 $ 1,020 $ 349 $ 1,369 Summary of Adjustments: Amortization of acquired intangibles $ 214 a $ 415 a Restructuring costs 47 a 55 a Acquisition/divestiture-related costs (1) 9 a 19 a CCR gain (7) a (7) a Total adjustments $ 263 $ 482 Tax effect on adjustments above $ (69) $ (127) Tax specific adjustments (6) (6) Total tax adjustments $ (75) c $ (133) c Diluted shares outstanding 866.3 866.3 872.3 872.3 Diluted earnings per share: Continuing operations $ 0.70 $ 0.92 $ 1.17 $ 1.57
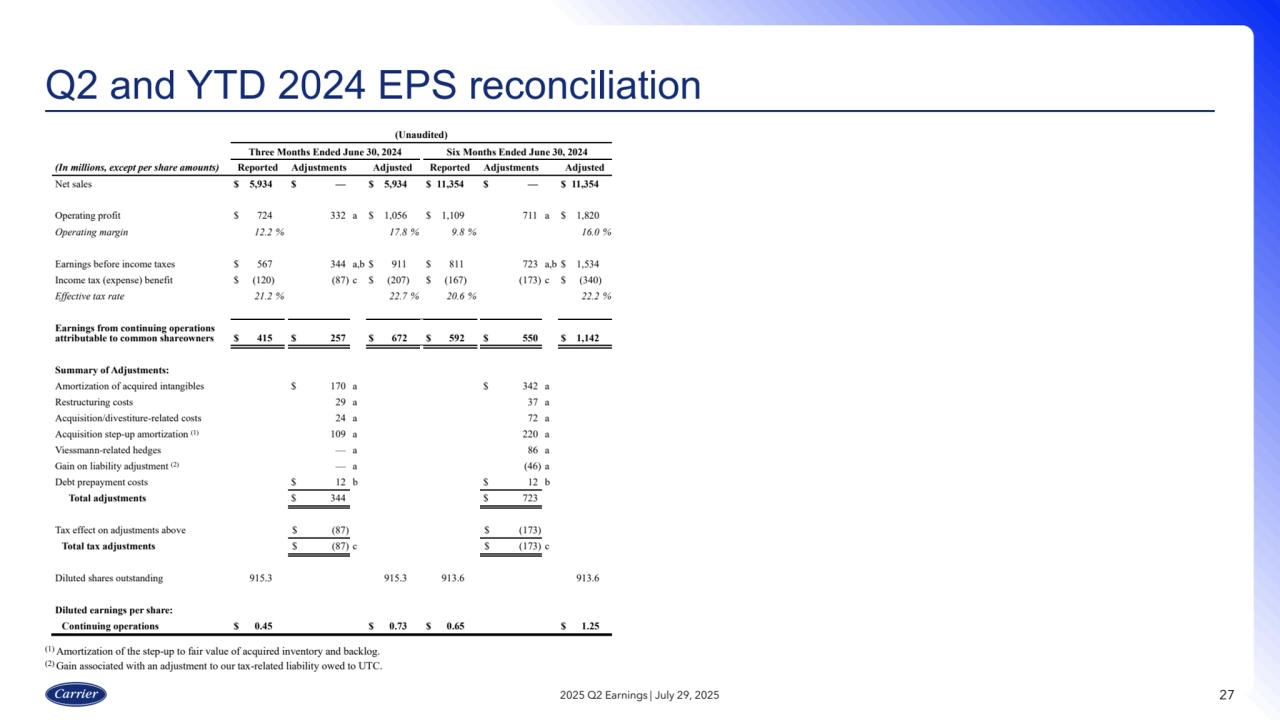
    • 27. 27 Q2 and YTD 2024 EPS reconciliation 2025 Q2 Earnings | July 29, 2025 (1) Amortization of the step-up to fair value of acquired inventory and backlog. (2) Gain associated with an adjustment to our tax-related liability owed to UTC. (Unaudited) Three Months Ended June 30, 2024 Six Months Ended June 30, 2024 (In millions, except per share amounts) Reported Adjustments Adjusted Reported Adjustments Adjusted Net sales $ 5,934 $ — $ 5,934 $ 11,354 $ — $ 11,354 Operating profit $ 724 332 a $ 1,056 $ 1,109 711 a $ 1,820 Operating margin 12.2 % 17.8 % 9.8 % 16.0 % Earnings before income taxes $ 567 344 a,b $ 911 $ 811 723 a,b $ 1,534 Income tax (expense) benefit $ (120) (87) c $ (207) $ (167) (173) c $ (340) Effective tax rate 21.2 % 22.7 % 20.6 % 22.2 % Earnings from continuing operations attributable to common shareowners $ 415 $ 257 $ 672 $ 592 $ 550 $ 1,142 Summary of Adjustments: Amortization of acquired intangibles $ 170 a $ 342 a Restructuring costs 29 a 37 a Acquisition/divestiture-related costs 24 a 72 a Acquisition step-up amortization (1) 109 a 220 a Viessmann-related hedges — a 86 a Gain on liability adjustment (2) — a (46) a Debt prepayment costs $ 12 b $ 12 b Total adjustments $ 344 $ 723 Tax effect on adjustments above $ (87) $ (173) Total tax adjustments $ (87) c $ (173) c Diluted shares outstanding 915.3 915.3 913.6 913.6 Diluted earnings per share: Continuing operations $ 0.45 $ 0.73 $ 0.65 $ 1.25
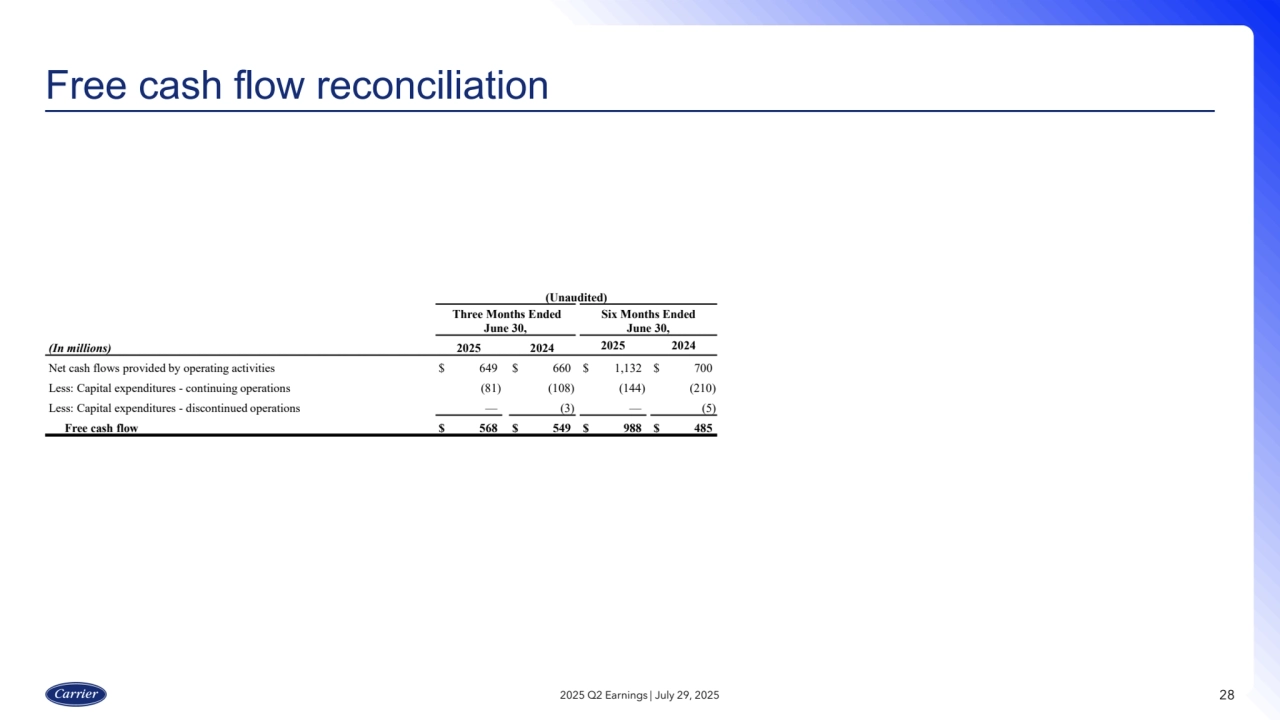
    • 28. 28 Free cash flow reconciliation 2025 Q2 Earnings | July 29, 2025 (Unaudited) Three Months Ended June 30, Six Months Ended June 30, (In millions) 2025 2024 2025 2024 Net cash flows provided by operating activities $ 649 $ 660 $ 1,132 $ 700 Less: Capital expenditures - continuing operations (81) (108) (144) (210) Less: Capital expenditures - discontinued operations — (3) — (5) Free cash flow $ 568 $ 549 $ 988 $ 485
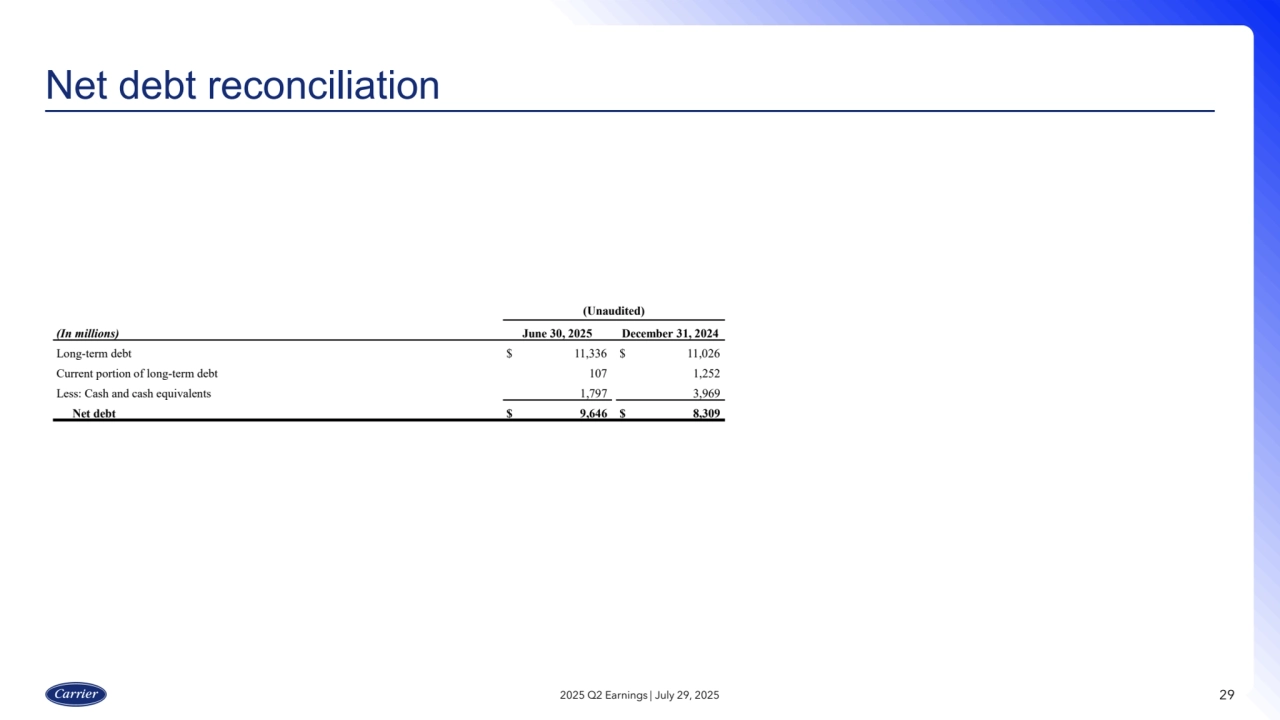
    • 29. 29 Net debt reconciliation 2025 Q2 Earnings | July 29, 2025 (Unaudited) (In millions) June 30, 2025 December 31, 2024 Long-term debt $ 11,336 $ 11,026 Current portion of long-term debt 107 1,252 Less: Cash and cash equivalents 1,797 3,969 Net debt $ 9,646 $ 8,309
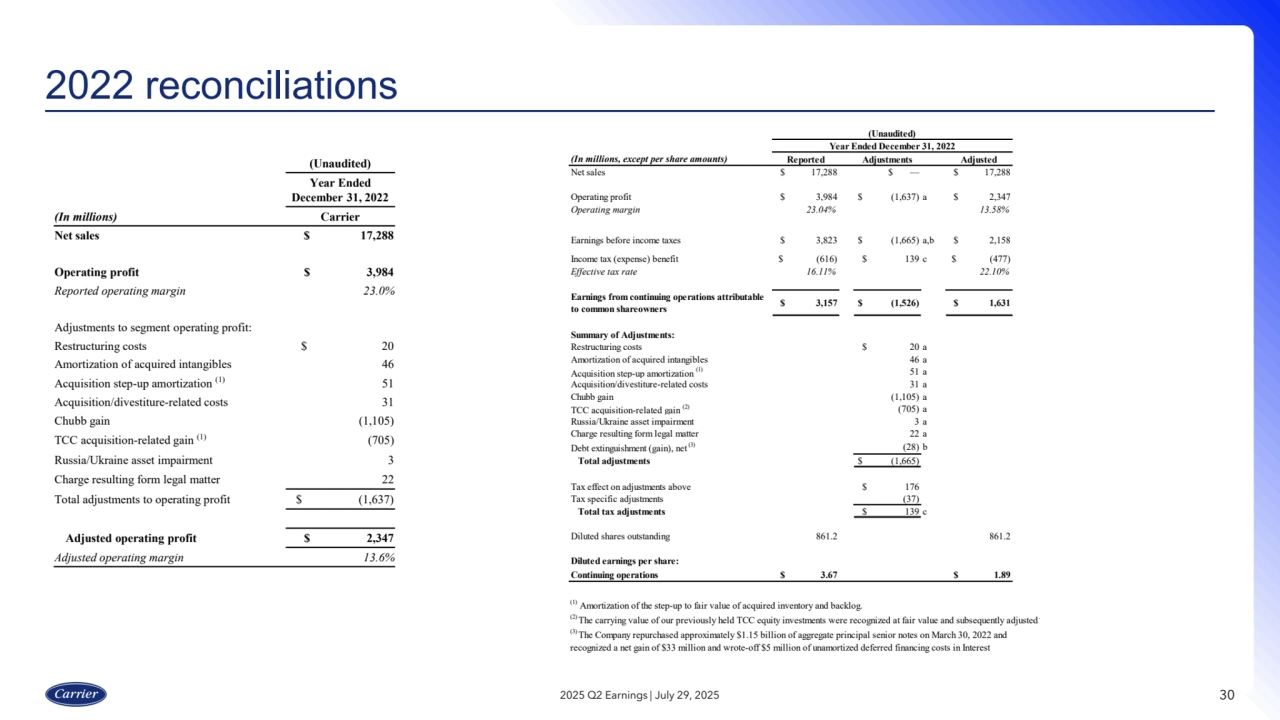
    • 30. 30 2022 reconciliations 2025 Q2 Earnings | July 29, 2025 (In millions, except per share amounts) Reported Adjustments Adjusted Net sales $ 17,288 $ — $ 17,288 Operating profit $ 3,984 $ (1,637) a $ 2,347 Operating margin 23.04% 13.58% Earnings before income taxes $ 3,823 $ (1,665) a,b $ 2,158 Income tax (expense) benefit $ (616) $ 139 c $ (477) Effective tax rate 16.11% 22.10% Earnings from continuing operations attributable to common shareowners $ 3,157 $ (1,526) $ 1,631 Summary of Adjustments: Restructuring costs $ 20 a Amortization of acquired intangibles 46 a Acquisition step-up amortization (1) 51 a Acquisition/divestiture-related costs 31 a Chubb gain (1,105) a TCC acquisition-related gain (2) (705) a Russia/Ukraine asset impairment 3 a Charge resulting form legal matter 22 a Debt extinguishment (gain), net (3) (28) b Total adjustments $ (1,665) Tax effect on adjustments above $ 176 Tax specific adjustments (37) Total tax adjustments $ 139 c Diluted shares outstanding 861.2 861.2 Diluted earnings per share: Continuing operations $ 3.67 $ 1.89 (1) Amortization of the step-up to fair value of acquired inventory and backlog. (2) The carrying value of our previously held TCC equity investments were recognized at fair value and subsequently adjusted. (3) The Company repurchased approximately $1.15 billion of aggregate principal senior notes on March 30, 2022 and recognized a net gain of $33 million and wrote-off $5 million of unamortized deferred financing costs in Interest (Unaudited) Year Ended December 31, 2022 (Unaudited) Year Ended December 31, 2022 (In millions) Carrier Net sales $ 17,288 Operating profit $ 3,984 Reported operating margin 23.0% Adjustments to segment operating profit: Restructuring costs $ 20 Amortization of acquired intangibles 46 Acquisition step-up amortization (1) 51 Acquisition/divestiture-related costs 31 Chubb gain (1,105) TCC acquisition-related gain (1) (705) Russia/Ukraine asset impairment 3 Charge resulting form legal matter 22 Total adjustments to operating profit $ (1,637) Adjusted operating profit $ 2,347 Adjusted operating margin 13.6%


    • Previous
    • Next
    • f Fullscreen
    • esc Exit Fullscreen