Q2 2025 Financial HighlightsTSMC Taiwan
 AI Summary
Key Insights
- 📈 Revenue Growth: TSMC's net revenue increased by 11.3% QoQ and 38.6% YoY, driven by 3nm and 5nm technologies.
- 💰 Profitability Metrics: Gross margin was 58.6%, and operating margin improved to 49.6% in Q2 2025.
- 🌐 Geographic Performance: North America accounted for 75% of total net revenue, while China contributed 9%.
- 💸 Cash Flow Dynamics: Net cash from operating activities was NT$497.07 billion, impacted by income tax payments.
- 🌱 Strategic Initiatives: TSMC launched 'UTokyo Lab,' unveiled A14 process, and committed to carbon reduction.
Q2 2025 Financial HighlightsTSMC Taiwan
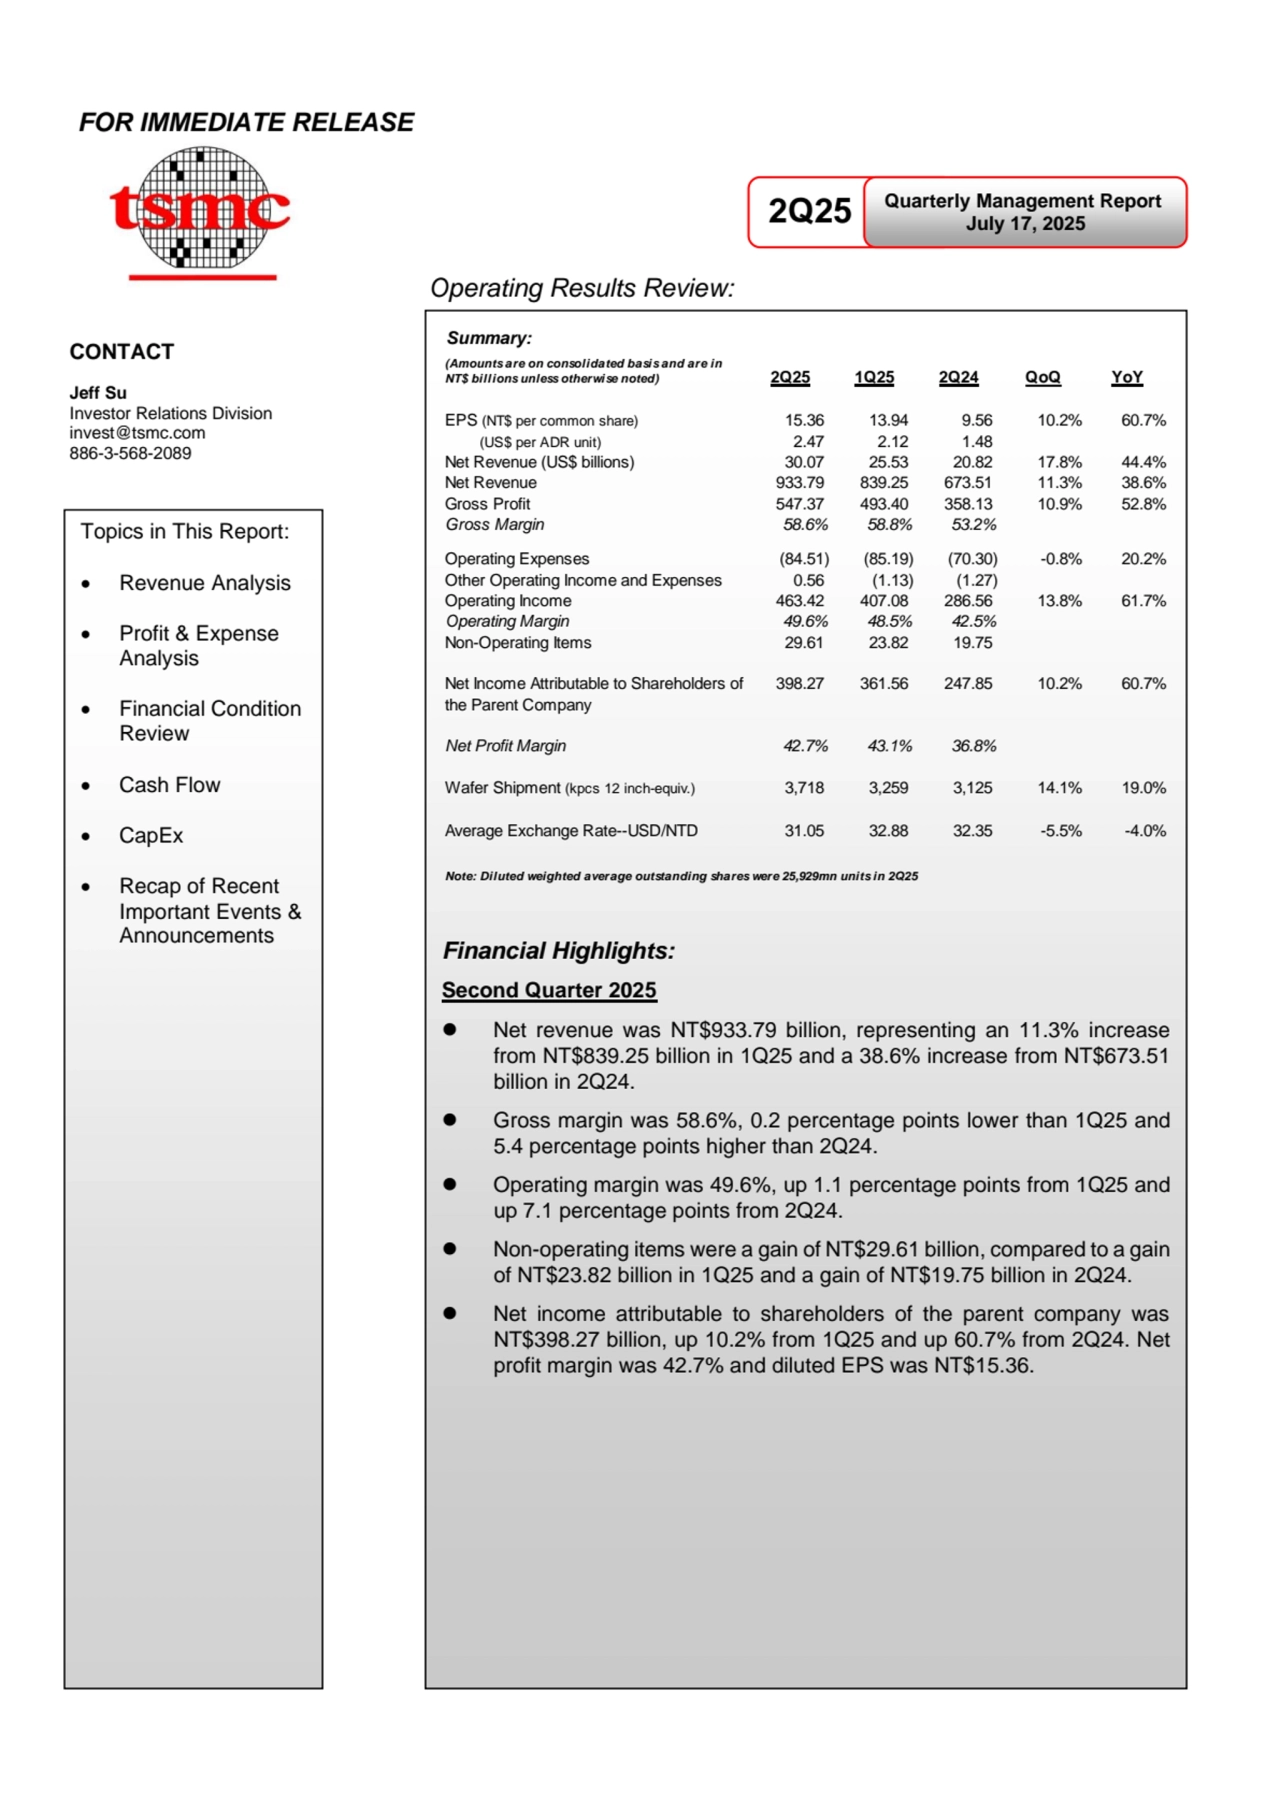
- 1. FOR IMMEDIATE RELEASE 2Q25 Financial Highlights: Second Quarter 2025 ⚫ Net revenue was NT$933.79 billion, representing an 11.3% increase from NT$839.25 billion in 1Q25 and a 38.6% increase from NT$673.51 billion in 2Q24. ⚫ Gross margin was 58.6%, 0.2 percentage points lower than 1Q25 and 5.4 percentage points higher than 2Q24. ⚫ Operating margin was 49.6%, up 1.1 percentage points from 1Q25 and up 7.1 percentage points from 2Q24. ⚫ Non-operating items were a gain of NT$29.61 billion, compared to a gain of NT$23.82 billion in 1Q25 and a gain of NT$19.75 billion in 2Q24. ⚫ Net income attributable to shareholders of the parent company was NT$398.27 billion, up 10.2% from 1Q25 and up 60.7% from 2Q24. Net profit margin was 42.7% and diluted EPS was NT$15.36. Summary: (Amounts are on consolidated basis and are in NT$ billions unless otherwise noted) 2Q25 1Q25 2Q24 QoQ YoY EPS (NT$ per common share) 15.36 13.94 9.56 10.2% 60.7% (US$ per ADR unit) 2.47 2.12 1.48 Net Revenue (US$ billions) 30.07 25.53 20.82 17.8% 44.4% Net Revenue 933.79 839.25 673.51 11.3% 38.6% Gross Profit 547.37 493.40 358.13 10.9% 52.8% Gross Margin 58.6% 58.8% 53.2% Operating Expenses (84.51) (85.19) (70.30) -0.8% 20.2% Other Operating Income and Expenses 0.56 (1.13) (1.27) Operating Income 463.42 407.08 286.56 13.8% 61.7% Operating Margin 49.6% 48.5% 42.5% Non-Operating Items 29.61 23.82 19.75 Net Income Attributable to Shareholders of the Parent Company 398.27 361.56 247.85 10.2% 60.7% Net Profit Margin 42.7% 43.1% 36.8% Wafer Shipment (kpcs 12 inch-equiv.) 3,718 3,259 3,125 14.1% 19.0% Average Exchange Rate--USD/NTD 31.05 32.88 32.35 -5.5% -4.0% Note: Diluted weighted average outstanding shares were 25,929mn units in 2Q25 Quarterly Management Report July 17, 2025 Operating Results Review: CONTACT Jeff Su Investor Relations Division invest@tsmc.com 886-3-568-2089 Topics in This Report: • Revenue Analysis • Profit & Expense Analysis • Financial Condition Review • Cash Flow • CapEx • Recap of Recent Important Events & Announcements
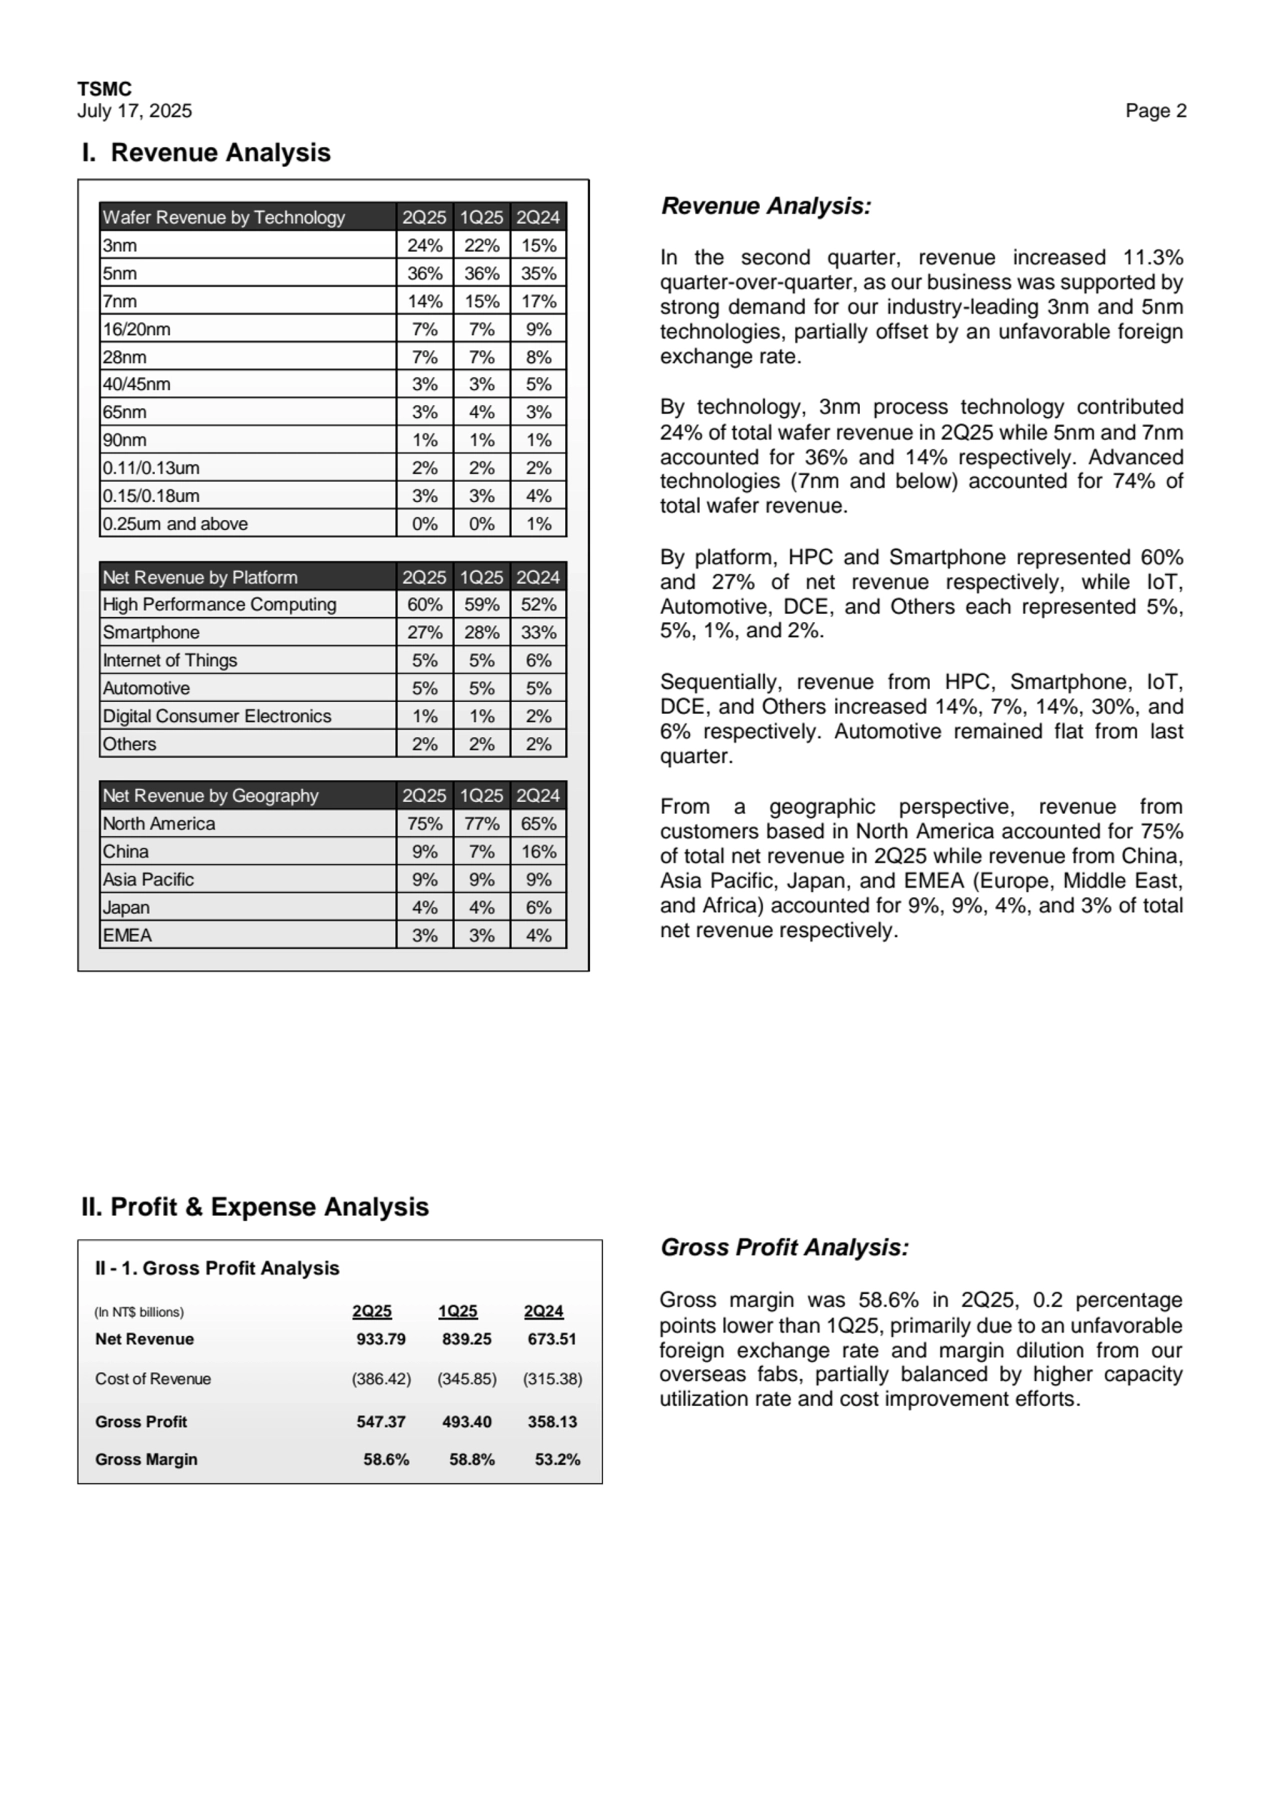
- 2. TSMC July 17, 2025 Page 2 Wafer Revenue by Technology 2Q25 1Q25 2Q24 3nm 24% 22% 15% 5nm 36% 36% 35% 7nm 14% 15% 17% 16/20nm 7% 7% 9% 28nm 7% 7% 8% 40/45nm 3% 3% 5% 65nm 3% 4% 3% 90nm 1% 1% 1% 0.11/0.13um 2% 2% 2% 0.15/0.18um 3% 3% 4% 0.25um and above 0% 0% 1% Net Revenue by Platform 2Q25 1Q25 2Q24 High Performance Computing 60% 59% 52% Smartphone 27% 28% 33% Internet of Things 5% 5% 6% Automotive 5% 5% 5% Digital Consumer Electronics 1% 1% 2% Others 2% 2% 2% Net Revenue by Geography 2Q25 1Q25 2Q24 North America 75% 77% 65% China 9% 7% 16% Asia Pacific 9% 9% 9% Japan 4% 4% 6% EMEA 3% 3% 4% II - 1. Gross Profit Analysis (In NT$ billions) 2Q25 1Q25 2Q24 Net Revenue 933.79 839.25 673.51 Cost of Revenue (386.42) (345.85) (315.38) Gross Profit 547.37 493.40 358.13 Gross Margin 58.6% 58.8% 53.2% I. Revenue Analysis Revenue Analysis: In the second quarter, revenue increased 11.3% quarter-over-quarter, as our business was supported by strong demand for our industry-leading 3nm and 5nm technologies, partially offset by an unfavorable foreign exchange rate. By technology, 3nm process technology contributed 24% of total wafer revenue in 2Q25 while 5nm and 7nm accounted for 36% and 14% respectively. Advanced technologies (7nm and below) accounted for 74% of total wafer revenue. By platform, HPC and Smartphone represented 60% and 27% of net revenue respectively, while IoT, Automotive, DCE, and Others each represented 5%, 5%, 1%, and 2%. Sequentially, revenue from HPC, Smartphone, IoT, DCE, and Others increased 14%, 7%, 14%, 30%, and 6% respectively. Automotive remained flat from last quarter. From a geographic perspective, revenue from customers based in North America accounted for 75% of total net revenue in 2Q25 while revenue from China, Asia Pacific, Japan, and EMEA (Europe, Middle East, and Africa) accounted for 9%, 9%, 4%, and 3% of total net revenue respectively. II. Profit & Expense Analysis Gross Profit Analysis: Gross margin was 58.6% in 2Q25, 0.2 percentage points lower than 1Q25, primarily due to an unfavorable foreign exchange rate and margin dilution from our overseas fabs, partially balanced by higher capacity utilization rate and cost improvement efforts.
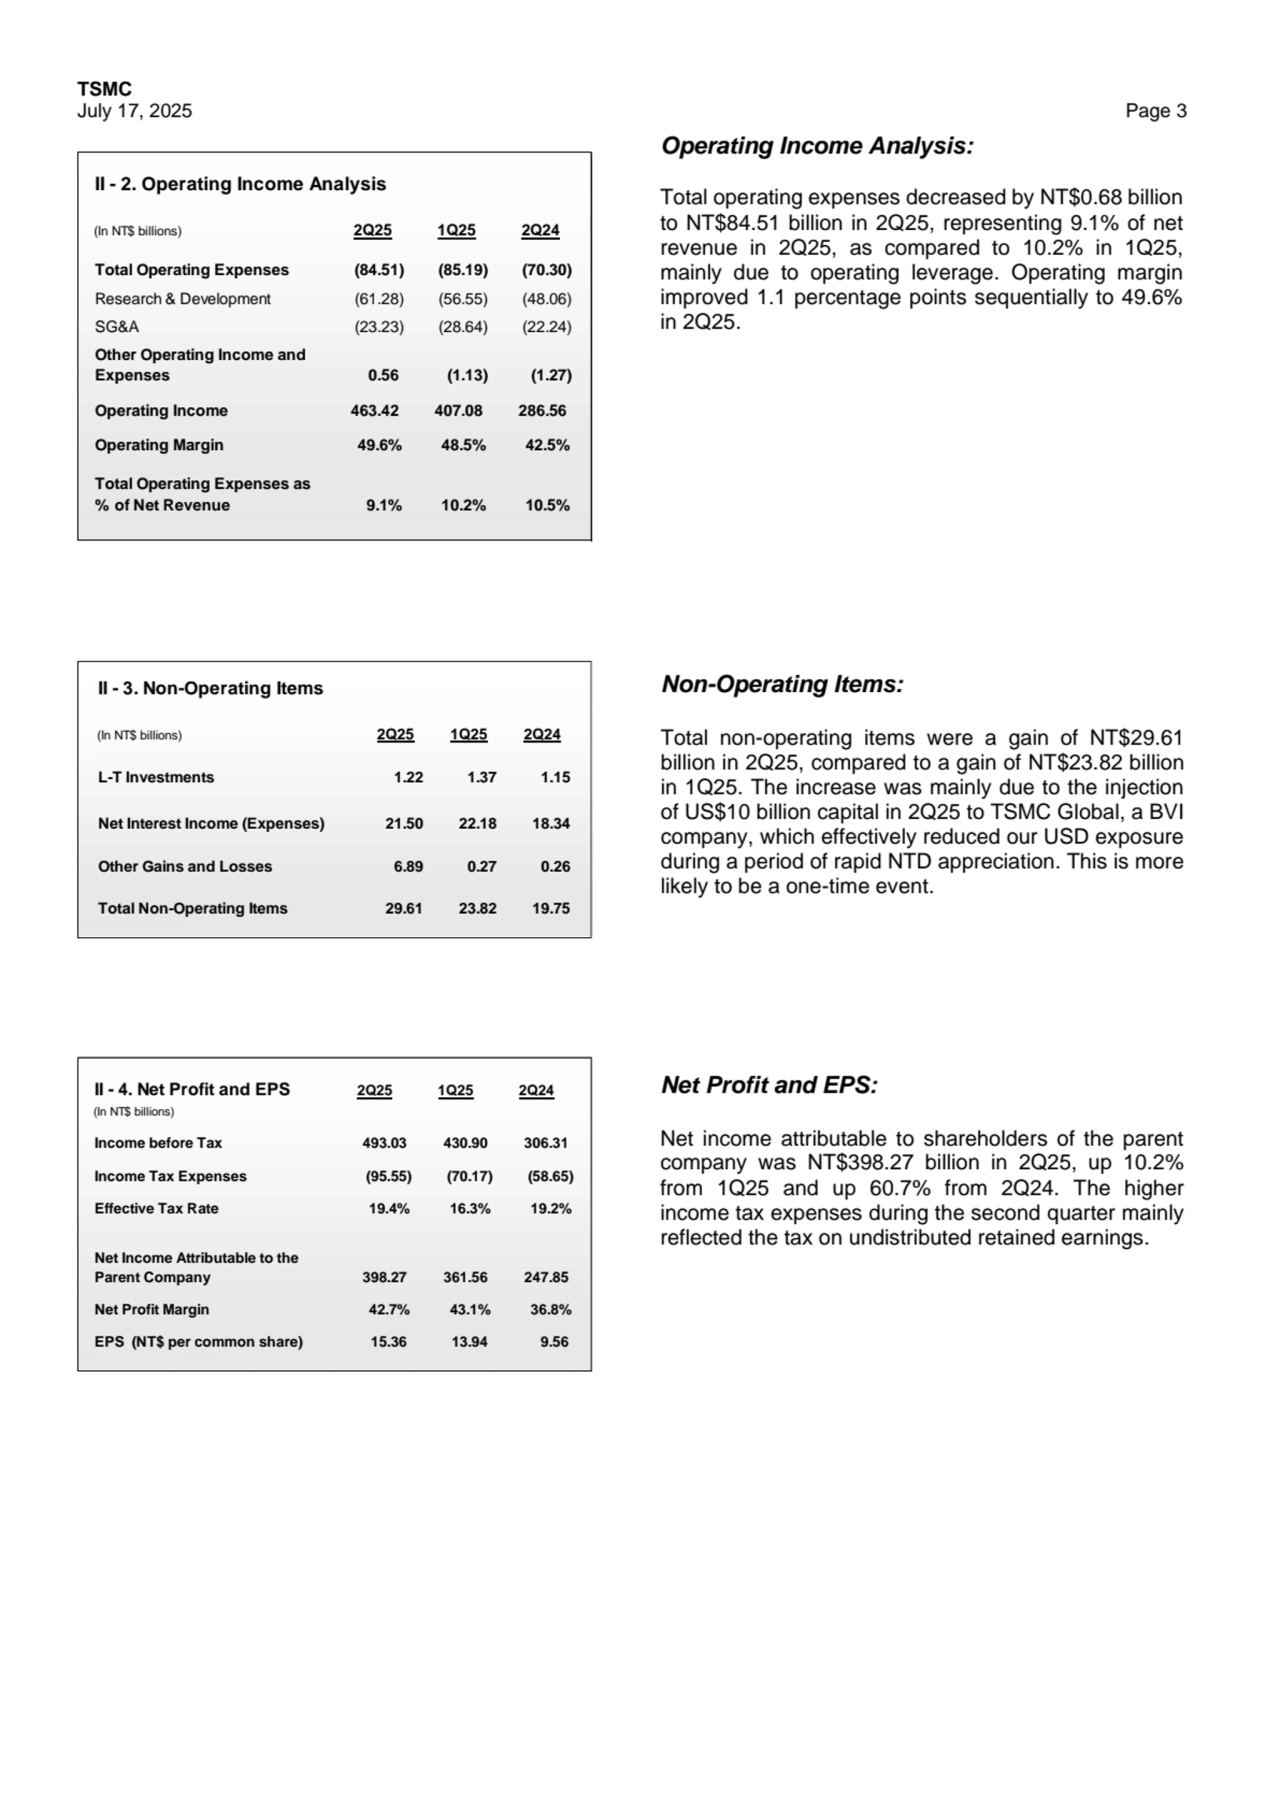
- 3. TSMC July 17, 2025 Page 3 II - 2. Operating Income Analysis (In NT$ billions) 2Q25 1Q25 2Q24 Total Operating Expenses (84.51) (85.19) (70.30) Research & Development (61.28) (56.55) (48.06) SG&A (23.23) (28.64) (22.24) Other Operating Income and Expenses 0.56 (1.13) (1.27) Operating Income 463.42 407.08 286.56 Operating Margin 49.6% 48.5% 42.5% Total Operating Expenses as % of Net Revenue 9.1% 10.2% 10.5% II - 3. Non-Operating Items (In NT$ billions) 2Q25 1Q25 2Q24 L-T Investments 1.22 1.37 1.15 Net Interest Income (Expenses) 21.50 22.18 18.34 Other Gains and Losses 6.89 0.27 0.26 Total Non-Operating Items 29.61 23.82 19.75 II - 4. Net Profit and EPS 2Q25 1Q25 2Q24 (In NT$ billions) Income before Tax 493.03 430.90 306.31 Income Tax Expenses (95.55) (70.17) (58.65) Effective Tax Rate 19.4% 16.3% 19.2% Net Income Attributable to the Parent Company 398.27 361.56 247.85 Net Profit Margin 42.7% 43.1% 36.8% EPS (NT$ per common share) 15.36 13.94 9.56 Non-Operating Items: Total non-operating items were a gain of NT$29.61 billion in 2Q25, compared to a gain of NT$23.82 billion in 1Q25. The increase was mainly due to the injection of US$10 billion capital in 2Q25 to TSMC Global, a BVI company, which effectively reduced our USD exposure during a period of rapid NTD appreciation. This is more likely to be a one-time event. Operating Income Analysis: Total operating expenses decreased by NT$0.68 billion to NT$84.51 billion in 2Q25, representing 9.1% of net revenue in 2Q25, as compared to 10.2% in 1Q25, mainly due to operating leverage. Operating margin improved 1.1 percentage points sequentially to 49.6% in 2Q25. Net Profit and EPS: Net income attributable to shareholders of the parent company was NT$398.27 billion in 2Q25, up 10.2% from 1Q25 and up 60.7% from 2Q24. The higher income tax expenses during the second quarter mainly reflected the tax on undistributed retained earnings.
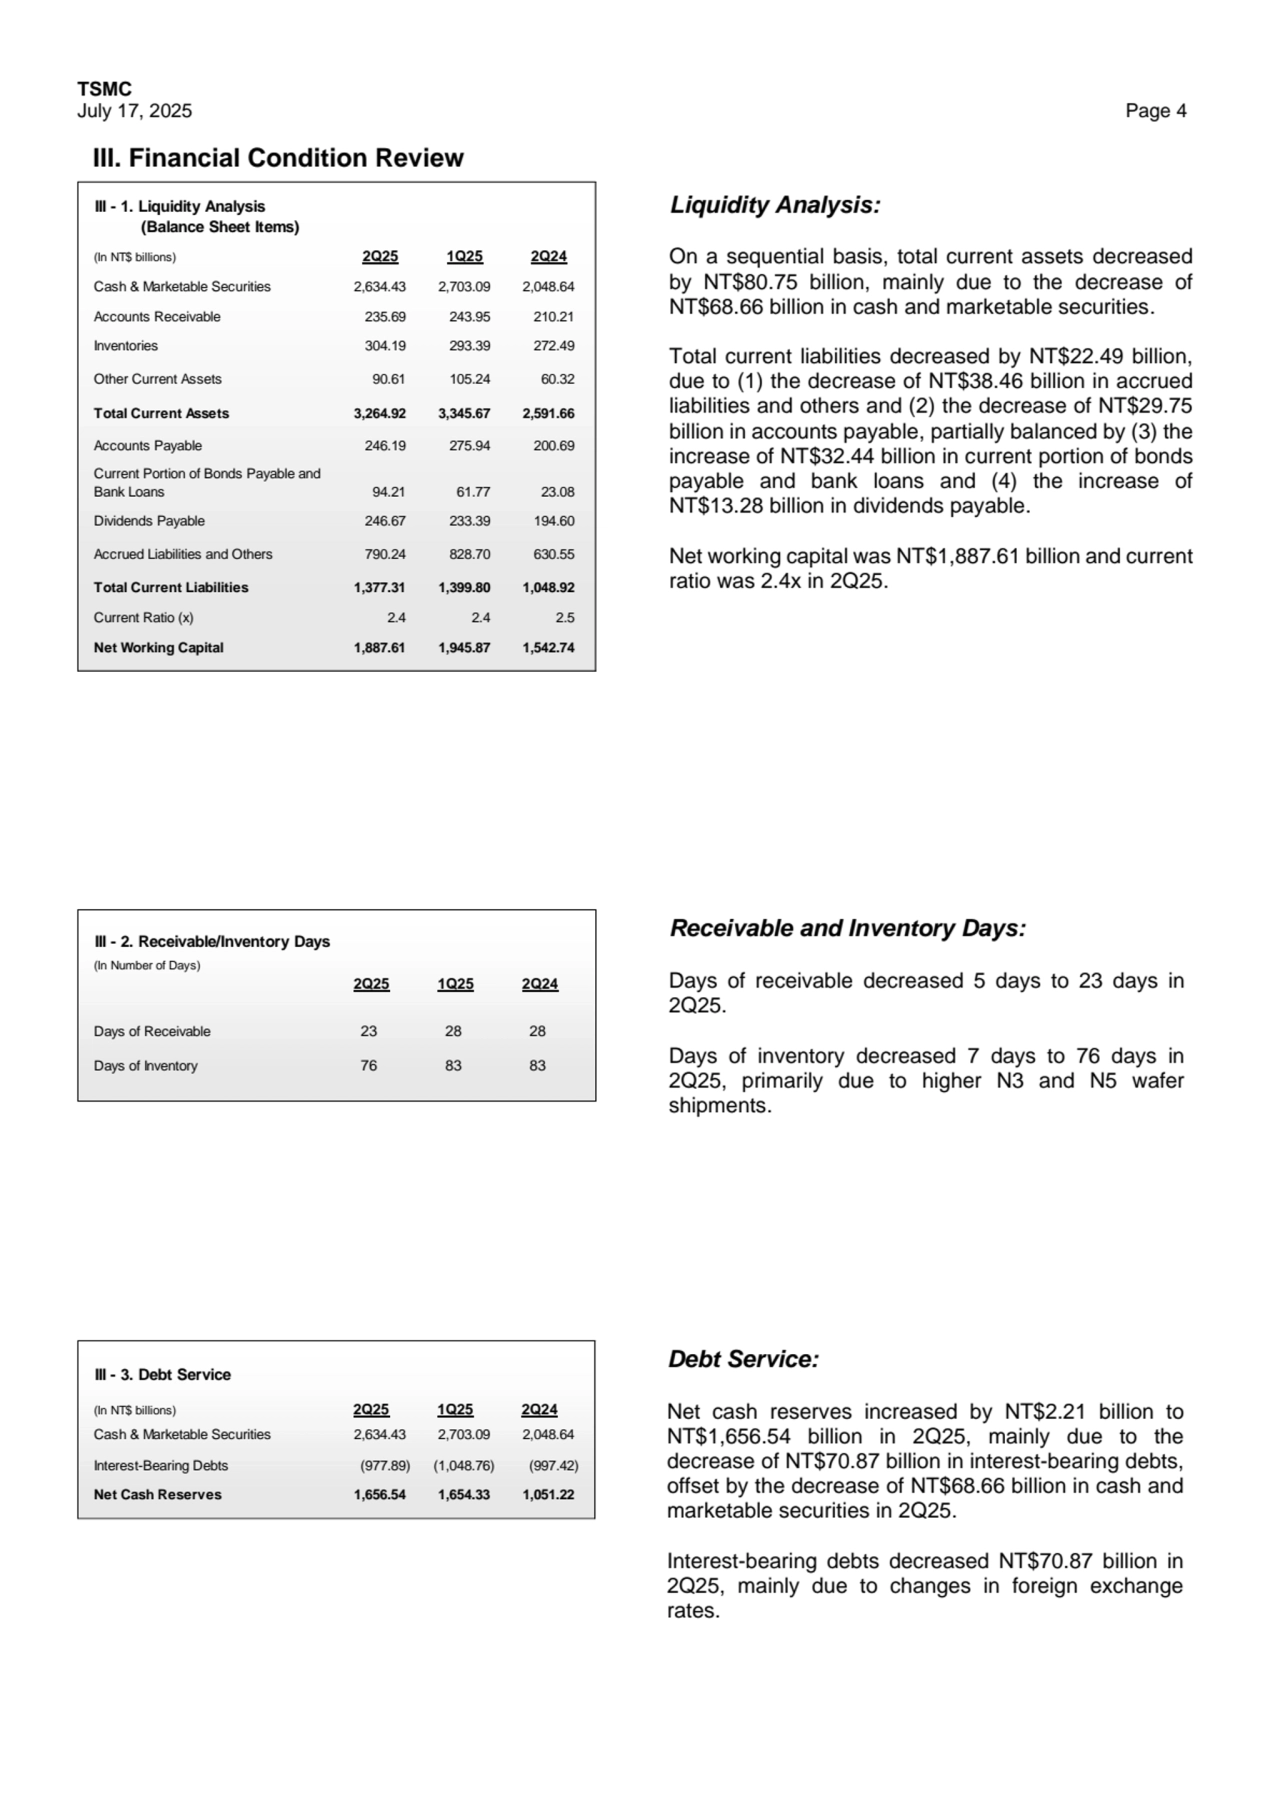
- 4. TSMC July 17, 2025 Page 4 (In NT$ billions) 2Q25 1Q25 2Q24 Cash & Marketable Securities 2,634.43 2,703.09 2,048.64 Accounts Receivable 235.69 243.95 210.21 Inventories 304.19 293.39 272.49 Other Current Assets 90.61 105.24 60.32 Total Current Assets 3,264.92 3,345.67 2,591.66 Accounts Payable 246.19 275.94 200.69 Current Portion of Bonds Payable and Bank Loans 94.21 61.77 23.08 Dividends Payable 246.67 233.39 194.60 Accrued Liabilities and Others 790.24 828.70 630.55 Total Current Liabilities 1,377.31 1,399.80 1,048.92 Current Ratio (x) 2.4 2.4 2.5 Net Working Capital 1,887.61 1,945.87 1,542.74 III - 1. Liquidity Analysis (Balance Sheet Items) III - 2. Receivable/Inventory Days (In Number of Days) 2Q25 1Q25 2Q24 Days of Receivable 23 28 28 Days of Inventory 76 83 83 III - 3. Debt Service (In NT$ billions) 2Q25 1Q25 2Q24 Cash & Marketable Securities 2,634.43 2,703.09 2,048.64 Interest-Bearing Debts (977.89) (1,048.76) (997.42) Net Cash Reserves 1,656.54 1,654.33 1,051.22 Receivable and Inventory Days: Days of receivable decreased 5 days to 23 days in 2Q25. Days of inventory decreased 7 days to 76 days in 2Q25, primarily due to higher N3 and N5 wafer shipments. Liquidity Analysis: On a sequential basis, total current assets decreased by NT$80.75 billion, mainly due to the decrease of NT$68.66 billion in cash and marketable securities. Total current liabilities decreased by NT$22.49 billion, due to (1) the decrease of NT$38.46 billion in accrued liabilities and others and (2) the decrease of NT$29.75 billion in accounts payable, partially balanced by (3) the increase of NT$32.44 billion in current portion of bonds payable and bank loans and (4) the increase of NT$13.28 billion in dividends payable. Net working capital was NT$1,887.61 billion and current ratio was 2.4x in 2Q25. Debt Service: Net cash reserves increased by NT$2.21 billion to NT$1,656.54 billion in 2Q25, mainly due to the decrease of NT$70.87 billion in interest-bearing debts, offset by the decrease of NT$68.66 billion in cash and marketable securities in 2Q25. Interest-bearing debts decreased NT$70.87 billion in 2Q25, mainly due to changes in foreign exchange rates. III. Financial Condition Review
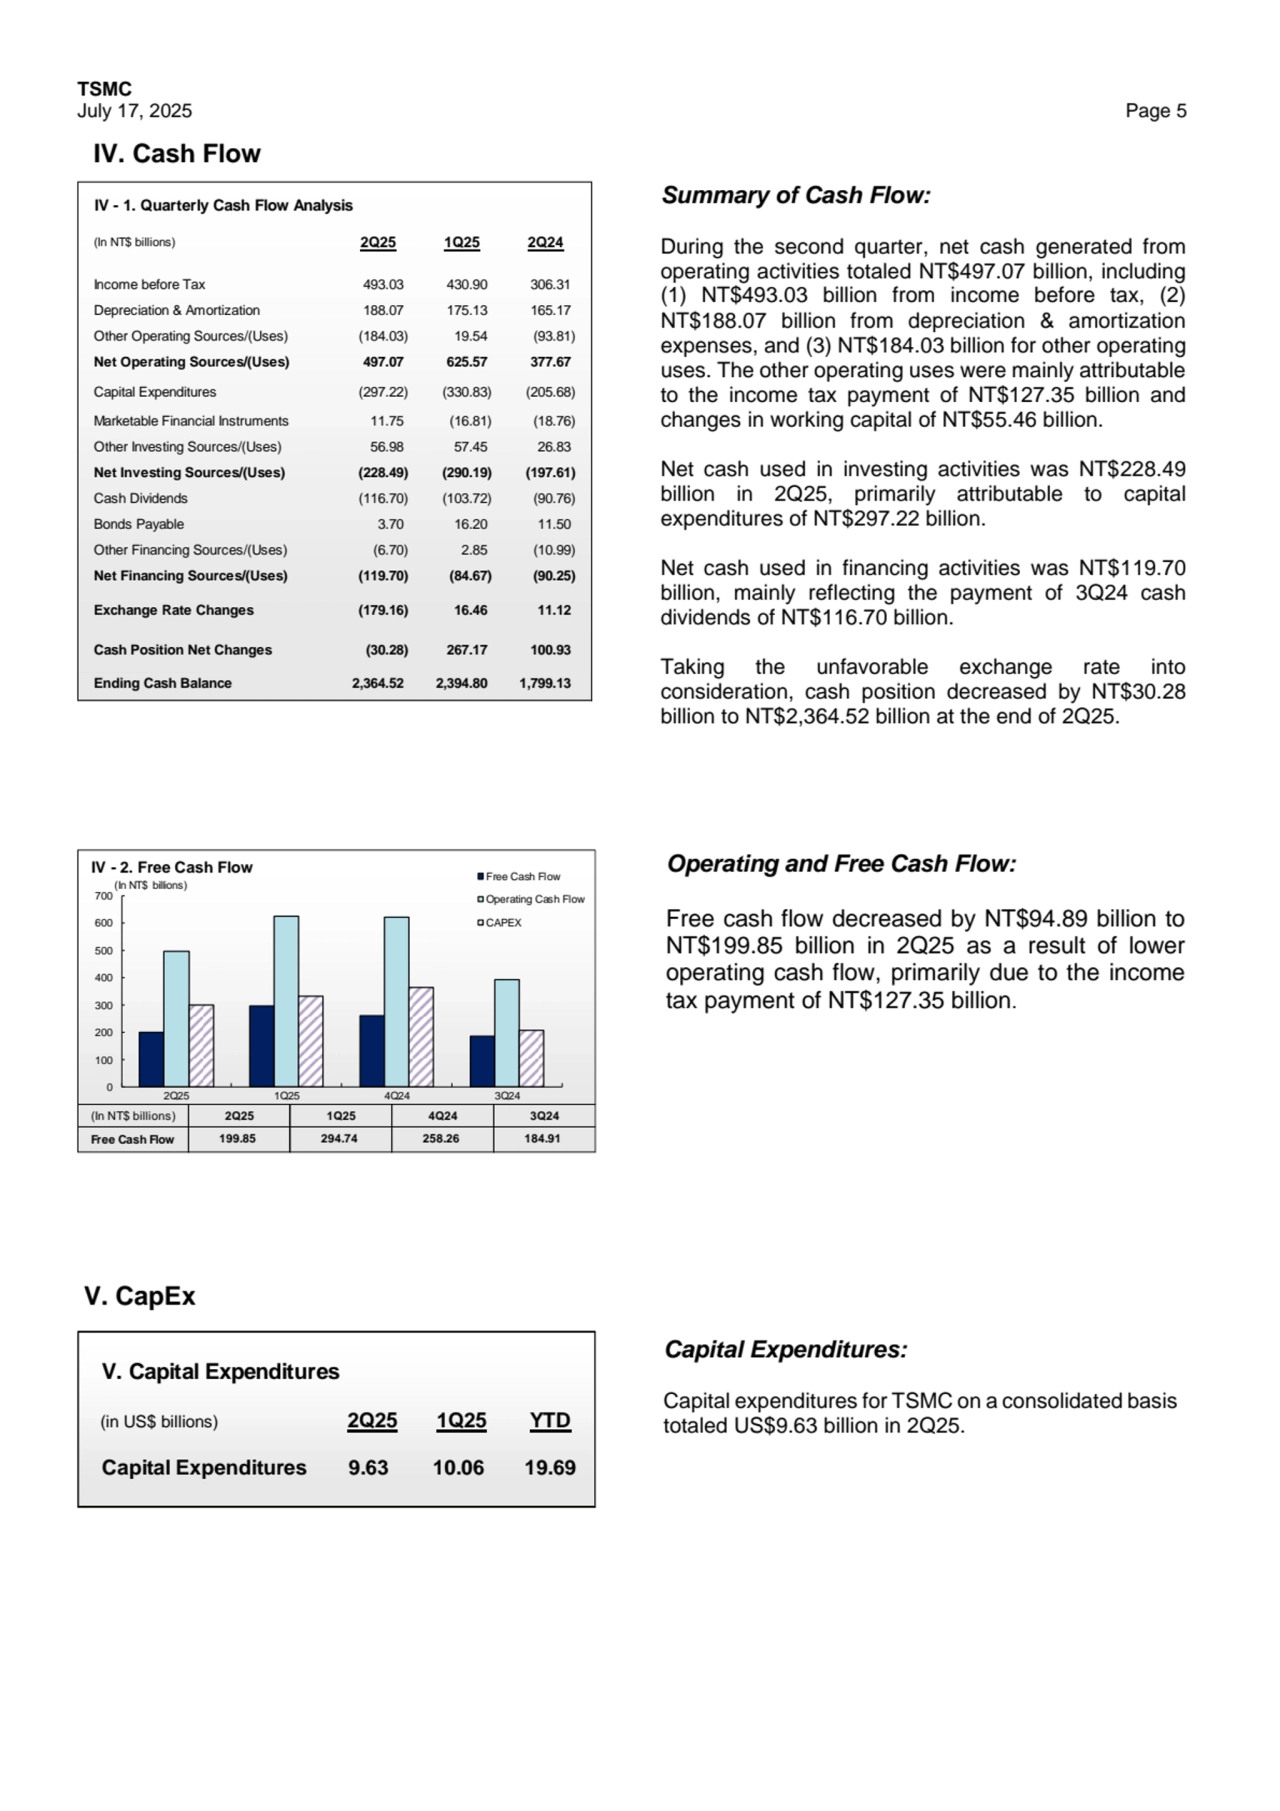
- 5. TSMC July 17, 2025 Page 5 IV. Cash Flow IV - 1. Quarterly Cash Flow Analysis (In NT$ billions) 2Q25 1Q25 2Q24 Income before Tax 493.03 430.90 306.31 Depreciation & Amortization 188.07 175.13 165.17 Other Operating Sources/(Uses) (184.03) 19.54 (93.81) Net Operating Sources/(Uses) 497.07 625.57 377.67 Capital Expenditures (297.22) (330.83) (205.68) Marketable Financial Instruments 11.75 (16.81) (18.76) Other Investing Sources/(Uses) 56.98 57.45 26.83 Net Investing Sources/(Uses) (228.49) (290.19) (197.61) Cash Dividends (116.70) (103.72) (90.76) Bonds Payable 3.70 16.20 11.50 Other Financing Sources/(Uses) (6.70) 2.85 (10.99) Net Financing Sources/(Uses) (119.70) (84.67) (90.25) Exchange Rate Changes (179.16) 16.46 11.12 Cash Position Net Changes (30.28) 267.17 100.93 Ending Cash Balance 2,364.52 2,394.80 1,799.13 (In NT$ billions) Free Cash Flow 294.74 4Q24 258.26 2Q25 199.85 1Q25 3Q24 184.91 0 100 200 300 400 500 600 700 2Q25 1Q25 4Q24 3Q24 IV - 2. Free Cash Flow Free Cash Flow Operating Cash Flow CAPEX (In NT$ billions) V. Capital Expenditures (in US$ billions) 2Q25 1Q25 YTD Capital Expenditures 9.63 10.06 19.69 Summary of Cash Flow: During the second quarter, net cash generated from operating activities totaled NT$497.07 billion, including (1) NT$493.03 billion from income before tax, (2) NT$188.07 billion from depreciation & amortization expenses, and (3) NT$184.03 billion for other operating uses. The other operating uses were mainly attributable to the income tax payment of NT$127.35 billion and changes in working capital of NT$55.46 billion. Net cash used in investing activities was NT$228.49 billion in 2Q25, primarily attributable to capital expenditures of NT$297.22 billion. Net cash used in financing activities was NT$119.70 billion, mainly reflecting the payment of 3Q24 cash dividends of NT$116.70 billion. Taking the unfavorable exchange rate into consideration, cash position decreased by NT$30.28 billion to NT$2,364.52 billion at the end of 2Q25. Capital Expenditures: Capital expenditures for TSMC on a consolidated basis totaled US$9.63 billion in 2Q25. V. CapEx Operating and Free Cash Flow: Free cash flow decreased by NT$94.89 billion to NT$199.85 billion in 2Q25 as a result of lower operating cash flow, primarily due to the income tax payment of NT$127.35 billion.
- 6. TSMC July 17, 2025 Page 6 ⚫ “TSMC-UTokyo Lab” Launched to Promote Advanced Semiconductor Research, Education and Talent Incubation (2025/06/12) ⚫ TSMC Board of Directors Approved NT$5.00 Cash Dividend for the First Quarter of 2025 and Set September 16, 2025 as Ex-Dividend Date, September 22, 2025 as the Record Date and October 9, 2025 as the Distribution Date (2025/05/13) ⚫ TSMC Unveils Next-Generation A14 Process at North America Technology Symposium (2025/04/24) ⚫ TSMC Commits to Ambitious Carbon Reduction Path in Line with Science Based Targets Initiative (2025/04/22) VI. Recap of Recent Important Events & Announcements