Q2 | 2025 Shareholder Letter Fiverr

    Q2 | 2025 Shareholder Letter Fiverr

    F2 weeks ago 11

    Loading...

    Q2 | 2025 Shareholder Letter 
F I V E R R . C O M
1
David Colón, Seller
Founder
ColonFilm.com
Spain
    1/14

    Loading...

    Q2 | 2025 Shareholder Letter 
ON THE COVER
David Colón, Seller
Founder
ColonFilm.com
Spain
2
David Colón is the Founder of ColonFilm.com, a creative 
agency that specializes in high-quality movie posters and 
book covers. His award-winning graphic designs and 
cinematography have allowed him to work with clients 
worldwide to tell captivating stories. Davidʼs work has 
been recognized internationally, winning accolades such 
as Best Film Poster at the International Film Festival in 
Rome and Best Web Design in Zaragoza, Spain. 
David joined Fiverr in 2016, while studying video and 
image editing at a professional film academy. He started 
off offering a wider range of services with accessible 
prices, including logos and social media graphics, but 
over time realized his business was strongest in narrative 
design. Joining Fiverr Pro was his turning point, as he 
re-invested his earnings into improving his tools, 
organizing workflow, building a clear visual portfolio, and 
quickly made this his full-time job. His typical clients are 
indie authors, filmmakers and producers who work on 
larger projects. He handles most of the work solo, but 
also relies on a close circle of trusted collaborators for 
specific value add tasks. Some notable works include a 
book cover for one of Appleʼs founders and artwork for a 
documentary linked to high-profile film Platoon. 
Since joining Fiverr, he has completed over 1,400 orders 
and helped more than 1,000 clients, with typical project 
size ranging from $300 to $2K. David is a Top Rated 
Seller and Fiverr is his main international channel, with 
about 80% of his projects coming through the platform.
“Fiverr allowed me to build a freelancing career, 
connect with people from different countries, and 
grow through creative projects. The global reach 
and built-in trust have been essential to scaling 
without having to chase work. As the platform 
developed new categories and attracted more 
diverse clients, it pushed me to raise the bar of my 
services and skills continuously.”
    2/14

    Loading...

    Q2 | 2025 Shareholder Letter 
● Strong Q2 results: We delivered solid execution across Marketplace and Services segments, 
together with continued operational discipline. Marketplace revenue was led by strong growth 
across AI-related categories and continued momentum of Fiverr Proʼs Managed Services, while 
the Services segment contributed to revenue upside, driven by cross-sell and upsell 
opportunities of value-added services.
● Rapid AI category expansion: AI-related services are booming, with surging demand especially 
around AI agents, workflow automation and vibe coding. Businesses of all sizes turn to 
freelancers on Fiverr to bridge the gap between AI technology and implementation.
● Continued momentum for Managed Services: Fiverr Proʼs Managed Services is showing 
meaningful growth, driven by demand for high-value, larger transactions. Execution on 
full-scope projects with new high spenders and repeat clients remains solid, with more deals 
steadily coming in this quarter. Managed Services continues to be a key driver of upmarket 
expansion.
● Reiterating full year guidance: We are reiterating our revenue and Adjusted EBITDA guidance 
for 2025 as we continue to drive solid execution towards the goals and roadmap set at the 
beginning of the year, while operating with the highest level of discipline and efficiency.
Summary
Q2ʼ25 Results
3
Guidance Actual
REVENUE $105  $109 million
1115% y/y
$108.6 million
14.8% y/y
ADJUSTED EBITDA1 $20.0  $22.0 million $21.4 million
MARKETPLACE 3.4 million
Annual Active Buyers1
$318
Annual Spend per Buyer1
27.6%
Marketplace Take Rate1
SERVICES $34.0 million
Services Revenue
83.8% y/y
Services Revenue Growth
31.2%
of Total Revenue
1 See “Key Performance Metrics and Non-GAAP Financial Measuresˮ for additional information regarding key performance metrics and 
non-GAAP metrics used in this shareholder letter
Q3 2025 FY 2025
REVENUE $105  $110 million
5%10% y/y
$425  $438 million
9%12% y/y
ADJUSTED EBITDA $21.5  $23.5 million $84  $90 million
Financial Outlook
    3/14

    Loading...

    Q2 | 2025 Shareholder Letter 
Halfway through 2025, Iʼm incredibly proud of what our team has accomplished. We are closely 
tracking with the goals we set at the beginning of the year, delivering 15% y/y revenue growth 
and a 20% Adjusted EBITDA margin for the second quarter. We unlocked pockets of growth 
through catalog expansion, upmarket enablement and services upsell, despite the relatively 
slow hiring environment. We continue to operate with discipline and efficiency. We understand the 
importance of a strong cash position and growing cash flow, and believe that discipline is not a 
constraint for growth, rather it empowers us to do what we love, which is building and innovating.
AI is fundamentally reshaping how work gets done, both on our marketplace and within Fiverr. 
Our 11th Annual Business Trends Index reveals surging demand for AI agents and workflow 
automation across industries. Amid a crowded AI tool landscape, Fiverr freelancers are 
increasingly essential in bridging the gap between technology and implementation, delivering 
customized, high-impact solutions for our customers. Whether it's embedding GenAI into branded 
content workflows, building marketing automation funnels, or debugging early-stage prototypes, 
our talent pool is empowering our customers to harness the real potential of AI. Our investment in 
AI-related categories and deep bench of AI skilled freelancers have translated into growth 
momentum in verticals such as Programming & Tech, Video & Animation, and Digital Marketing.
Weʼre also making rapid progress on product innovation and infrastructure. Fiverr Goʼs Personal 
Assistant continues to gain traction, and we're expanding its capabilities beyond admin support to 
help sellers market their services and reach more buyers. We've significantly upgraded our 
Dynamic Matching engine to integrate advanced LLMs and enriched seller data, leading to 
continued improvement in the offer to order conversion. On the tech infrastructure side, we're 
building a new MCP layer internally to accelerate AI tool deployment, and we are already seeing 
impact in areas like marketplace intelligence and support ticket resolution.
As we look to the future, we see AI as a continued tailwind for our business, providing ample 
opportunity for us to expand our catalog, enhance the marketplace experience and deepen our 
product and operational excellence. We continue to believe that real-world impact comes not 
from AI alone, but from the dynamic collaboration between human expertise and intelligent 
tools. Fiverr is distinctly positioned to be the platform of choice for AI talent.
Recently, I had the privilege of celebrating with our Fiverr sellers who crossed the $1 million 
earnings milestone. Listening to their journeys and success makes me feel insanely proud. They 
are the reason we exist: to be a platform that empowers people to chase dreams, become 
independent, and deliver top-notch service to clients. Itʼs whatʼs driving us forward. Thank you 
for your continued trust and support.
4
To Our Shareholders
AI Categories and Managed Services Led Marketplace Growth
For Q2 2025, Marketplace revenue was $74.7 million, driven by 3.4 million annual active buyers, 
$318 annual spend per buyer, and a 27.6% marketplace take rate. We continued to execute amid a 
stable macro environment, and the success of our investments in AI and upmarket shines 
through. While overall GMV growth remains muted, when we look at the underlying
    4/14

    Loading...

    Q2 | 2025 Shareholder Letter 
category dynamics, we saw verticals such as Programming & Tech, Video & Animation, and 
Digital Marketing experience accelerating y/y growth for the last few months. Similarly, we saw 
distinctive growth trends among larger and more complex projects on the marketplace. In Q2ʼ25, 
over 50% of our marketplace is driven by transactions over $200, and more encouragingly, 
these transactions are growing double digit year over year in terms of total GMV. These 
underlying dynamics demonstrate how our marketplace continues to evolve and strengthen 
towards upskills and upmarket clients which can drive long-term, durable growth. In the 
near-term, we expect Marketplace revenue for the second half of the year to remain stable, with 
flat to slightly negative y/y growth. 
We continued to see rapid category expansion and growing demand for AI-related services. Two 
areas are particularly popular: 1 Building AI agents to automate workflow and processes; and 
2) app building using vibe coding platforms. While workflow automation is not a novel concept, 
platforms such as Make.com, GoHighLevel and Airtable have substantially democratized the 
access to automation via a no-code and low-code environment. We are seeing many 
solopreneurs, marketers and small business owners utilize these platforms to automate tasks 
such as email marketing, social media management, content creation, or customer relationship 
management. That said, consumers with limited technical backgrounds often encounter various 
technical issues, such as debugging sign-up flows, or problems with connecting to databases or 
other applications. Similarly for vibe coding, we saw surging demand searching for experts on 
platforms such as Loveable and Bolt, as they seek help for things such as functionality extension, 
publishing and deployment, bug fixing, and backend integration. As a result, weʼve seen demand 
for these services grow 510x in the last 6 months, as Fiverr became the go-to place to find AI 
talent to close the last-mile gaps between technology and implementation. 
Weʼre also seeing rapid growth in Managed Services within Fiverr Pro, particularly with 
demand for high-value and full-scope projects, successfully unlocking larger deal sizes. In Q1, 
we signed several six-figure, multi-month contracts through Fiverr Pro, illustrating both first-time 
high spenders and repeat buyers expanding their footprint through our managed services 
offerings. In Q2, we saw solid execution across these large projects, with expected completion 
dates varying between July and October. In addition, we continued with a healthy cadence of new 
deals, including a preschool leveraging a top development agency seller on Fiverr to revamp their 
codebase, and a cybersecurity company utilizing Managed Services to build a cross-functional 
team for full-funnel marketing support. We believe Managed Services continues to be an 
important channel for us to drive upmarket penetration.
5
In Q2ʼ25, Services revenue was $34.0 million, up 83.8%, continuing its strong growth 
momentum as we continue to expand value-added service offerings to our customers. During 
the quarter, we built a new AI-powered Shopify Store Builder tool by integrating with AutoDS, 
enabling users to create a Shopify store directly from Fiverr. We have also deepened the top of 
funnel exposure between Fiverrʼs marketplace and the e-commerce tools on AutoDS, streamlining 
cross-sell opportunities between the two platforms. In addition, we saw strong Seller Plus 
revenue growth, driven by both new sign-ups as well as upgrades, as the bundled offerings with 
Services Cross-Sell Drives Additional Revenue Upside
    5/14

    Loading...

    Q2 | 2025 Shareholder Letter 6
Since we launched Fiverr Go in February, we continue to see active engagement among 
sellers, with over 9,000 seller activations so far. As the density of sellers with Fiverr Go 
continues to increase, we are working to add filtering capability in the search funnel in order for 
buyers to reach these sellers more easily and in turn driving faster response and conversion. We 
are also exploring ways for Fiverr Goʼs personal assistant to go beyond helping sellers respond to 
inbox messages. This includes helping sellers to optimize their service listings by analyzing 
marketplace and sellersʼ performance trends, as well as helping sellers to market their services 
on and off the platform. We believe Fiverr Go can serve as a gateway for buyers and sellers to 
engage more effectively and ultimately translating to more efficient matching and conversion. 
We are also investing heavily in implementing AI technology across our tech stack, this 
includes product-facing innovation, internal workflow automation and enterprise knowledge 
management. For example, we are incorporating the latest LLM capabilities into the Dynamic 
Matching algorithm in order to optimize the seller recommendations. It expands the existing 
algorithm so that it not only accounts for the category and quality data of the marketplace, but 
also the nuanced information embedded in the inbox messages in order to understand the match 
rate between each buyer and seller pair. As a result, we continue to see conversion rate 
improvement for the Dynamic Matching product, translating to 25% q/q GMV growth from 
Dynamic Matching. 
In addition, there are multiple ongoing initiatives to deploy AI technology to drive operational 
efficiency across the organization. This includes leveraging agentic AI to enhance marketplace 
intelligence operations, developing enterprise search tools to streamline workflows for customer 
support teams, and building infrastructure and tools to automate and scale data analyst capacity. 
Technology is at the heart of everything we do at Fiverr, and as AI rapidly evolves with the 
potential to upend every industry, we strive to stay at the forefront of the curve and be the leading 
force in reimagining the future of marketplaces.
AI Drives Marketplace Transformation and Operational Efficiency
Fiverr Go created a tailwind for the Seller Plus Premium tier. All of those efforts have resulted in 
additional revenue upside in the Services revenue segment. Looking ahead, we believe Services 
revenue will continue to serve as a strong growth driver for both top and bottom lines, with overall 
revenue contribution over 30% for the full year 2025.
Fiverrʼs management will host a conference call to discuss its 
financial results on Wednesday, July 30, 2025, at 830 a.m. 
Eastern Time. A live call webcast can be accessed from 
Fiverrʼs Investor Relations website. An archived version will be 
available on the website after the call. To participate in the 
conference call, please register using the link here.
Investor Relations
investors@fiverr.com
Press
press@fiverr.com
CONFERENCE CALL AND WEBCAST DETAILS
    6/14

    Loading...

    Q2 | 2025 Shareholder Letter 7
Assets
Current assets:
Cash and cash equivalents $ 313,520 $ 133,472
Marketable securities 264,884 288,947
User funds 164,119 153,309
Bank deposits 146,000 144,843
Restricted deposit 1,315 1,315
Other receivables 40,392 34,198
Total current assets 930,230 756,084
Long-term assets:
Marketable securities 23,770 122,009
Property and equipment, net 3,883 4,271
Operating lease right of use asset 3,829 5,122
Intangible assets, net 35,077 41,882
Goodwill 110,218 110,218
Other non-current assets 31,593 30,388
Total long-term assets 208,370 313,890
TOTAL ASSETS $ 1,138,600 $ 1,069,974
Liabilities and Shareholders' Equity
Current liabilities:
Trade payables $ 6,922 $ 5,533
User accounts 152,047 141,691
Deferred revenue 20,839 20,090
Other account payables and accrued expenses 64,930 57,167
Operating lease liabilities 2,827 2,608
Convertible notes, net 459,143 457,860
Total current liabilities 706,708 684,949
Long-term liabilities:
Operating lease liabilities 1,547 2,747
Other non-current liabilities 25,481 19,628
Total long-term liabilities 27,028 22,375
TOTAL LIABILITIES $ 733,736 $ 707,324
Shareholders' equity:
Share capital and additional paid-in capital 760,995 727,176
Accumulated deficit 362,207 366,193
Accumulated other comprehensive income 6,076 1,667
Total shareholders' equity 404,864 362,650
TOTAL LIABILITIES AND SHAREHOLDERS' EQUITY $ 1,138,600 $ 1,069,974
Balance sheet GAAP
(in thousands)
June 30 December 31 
2025 2024
Unaudited) Audited)
    7/14

    Loading...

    Q2 | 2025 Shareholder Letter 8
P&L GAAP
In $ thousands, except loss per share data)
Six Months Ended
June 30
2025 2024
Unaudited) Unaudited)
Three Months Ended
June 30
2025 2024
Revenue $ 108,648 $ 94,663 $ 215,832 $ 188,187
Cost of revenue 20,384 16,024 40,780 31,472
Gross profit 88,264 78,639 175,052 156,715
Operating expenses:
Research and development 23,994 21,855 47,621 45,488
Sales and marketing 44,844 41,324 92,234 83,476
General and administrative 21,415 17,764 42,381 34,215
Total operating expenses 90,253 80,943 182,236 163,179
Operating loss 1,989 2,304 7,184 6,464
Financial income, net 6,554 8,502 13,879 15,163
Income before taxes on income 4,565 6,198 6,695 8,699
Taxes on income 1,377 2,931 2,709 4,644
Net income attributable to ordinary shareholders $ 3,188 $ 3,267 $ 3,986 $ 4,055
Basic net income per share attributable to ordinary 
shareholders $ 0.09 $ 0.09 $ 0.11 $ 0.11
Basic weighted average ordinary shares 36,585,998 38,089,060 36,523,934 38,422,605
Diluted net income per share attributable to ordinary 
shareholders $ 0.09 $ 0.08 $ 0.11 $ 0.10
Diluted weighted average ordinary shares 37,499,304 38,755,863 37,617,438 39,180,421
    8/14

    Loading...

    Q2 | 2025 Shareholder Letter 9
Cash flow GAAP
(in thousands)
Six Months Ended
June 30
2025 2024
Unaudited) Unaudited)
Three Months Ended
June 30
2025 2024
Cash flows from operating activities:
Net income $ 3,188 $ 3,267 $ 3,986 $ 4,055
Adjustments to reconcile net income to net cash provided by 
operating activities:
Depreciation and amortization 4,089 1,606 8,373 2,756
Amortization of premium and accretion of discount of 
marketable securities, net 1,530 1,154 1,597 2,248
Amortization of discount and issuance costs of convertible 
notes 642 638 1,283 1,275
Shared-based compensation 14,055 18,438 29,809 37,458
Exchange rate fluctuations and other items, net 345 55 344 166
Revaluation of Earn-out 4,067 - 7,329 - 
Changes in assets and liabilities:
User funds 2,930 6,928 10,810 4,692
Operating lease ROU assets and liabilities 385 177 312 275
Other receivables 3,942 2,197 3,511 5,173
Trade payables 58 248 1,362 580
Deferred revenue 1,163 777 749 1,118
User accounts 2,579 
6,632 10,356 3,291
Other accounts payable and accrued expenses 5,264 131 6,287 4,134
Non-current liabilities 85 859 71 882
Net cash provided by operating activities 25,204 20,971 53,513 42,167
Investing Activities:
Investment in marketable securities - - 55,652 30,734
Proceeds from maturities of marketable securities 97,102 68,512 180,271 108,597
Investment in short-term bank deposits 500 9,000 2,000 36,238
Proceeds from short-term bank deposits - 2,974 843 6,351
Acquisition of business, net of cash acquired - 9,163 - 9,163
Purchase of property and equipment 185 309 472 687
Capitalization of internal-use software - - 661 20
Net cash provided by investing activities 96,417 53,014 122,329 38,106
Financing Activities
Repurchases of ordinary shares - 77,101 - 77,101
Proceeds from exercise of share options 2,101 1,388 2,579 1,830
Proceeds from withholding tax related to employees' 
exercises of share options and RSUs 2,349 441 1,288 220
Net cash provided by (used in) financing activities 4,450 75,272 3,867 75,051
Effect of exchange rate fluctuations on cash and cash 
equivalents 345 58 339 167
Increase (decrease) in cash, cash equivalents 126,416 1,345 180,048 5,055
Cash, cash equivalents at the beginning of period 
187,104 190,074 133,472 183,674
Cash and cash equivalents at the end of period $ 313,520 $ 188,729 $ 313,520 $ 188,729
    9/14

    Loading...

    Q2 | 2025 Shareholder Letter 10
Marketplace Revenue $ 74,689 $ 76,191 $ 152,363 $ 154,502
Annual Active Buyers 3,425 3,846 3,425 3,846
Annual Spend per Buyer $ 318 $ 290 $ 318 $ 290
Marketplace Take Rate 27.6% 27.6% 27.6% 27.6%
Services Revenue $ 33,959 $ 18,472 $ 63,469 $ 33,685
Total Revenue $ 108,648 $ 94,663 $ 215,832 $188,187
REVENUE BREAKDOWN
(in thousands1)
Six Months Ended
June 30
2025 2024
Unaudited) Unaudited)
Three Months Ended
June 30
2025 2024
GAAP gross profit $ 78,639 $ 80,735 $ 83,465 $ 86,788 $ 88,264 $ 299,529 $ 320,915
Add:
Share-based compensation 499 514 445 423 403 2,497 2,136
Depreciation and amortization 791 2,415 3,198 3,164 3,155 3,253 7,017
Earn-out revaluation, acquisition related costs and other - 11 17 44 - - 28
Non-GAAP gross profit $ 79,929 $ 83,675 $ 87,125 $ 90,419 $ 91,822 $ 305,279 $ 330,096
Non-GAAP gross margin 84.4% 84.0% 84.0% 84.4% 84.5% 84.5% 84.3%
RECONCILIATION OF GAAP TO NONGAAP GROSS PROFIT
(in thousands, except gross margin data)
RECONCILIATION OF GAAP NET INCOME TO NONGAAP NET INCOME AND NET 
INCOME PER SHARE
(in thousands, except gross margin data)
GAAP net income attributable to ordinary shareholders $ 3,267 $ 1,353 $ 12,838 $ 798 $ 3,188 $ 3,681 $ 18,246
Add:
Depreciation and amortization 1,606 3,392 4,328 4,284 4,089 5,987 10,476
Share-based compensation 18,438 18,464 18,020 15,754 14,055 68,698 73,942
Earn-out revaluation, acquisition related costs and other 109 1,273 4,240 4,599 5,294 359 5,631
Convertible notes amortization of discount and issuance 
costs 638 640 640 641 642 2,541 2,555
Taxes on income related to non-GAAP adjustments 71 290 16,249 380 351 - 16,610
Exchange rate (gain)/loss, net 156 221 1,108 642 531 131 859
Non-GAAP net income $ 23,831 $ 24,611 $ 24,925 $ 25,054 $ 27,448 $ 80,417 $ 95,099
Weighted average number of ordinary shares - basic 38,089,060 35,435,532 35,658,287 36,019,143 36,585,998 38,066,203 36,984,757
Non-GAAP basic net income per share attributable to 
ordinary shareholders $ 0.63 $ 0.69 $ 0.70 $ 0.70 $ 0.75 $ 2.11 $ 2.57
Weighted average number of ordinary shares - diluted 40,909,724 38,359,853 38,947,644 39,446,707 39,653,165 41,304,907 39,994,015
Non-GAAP diluted net income per share attributable to 
ordinary shareholders $ 0.58 $ 0.64 $ 0.64 $ 0.64 $ 0.69 $ 1.95 $ 2.38
RECONCILIATION OF GAAP NET INCOME TO ADJUSTED EBITDA
In thousands, except gross margin data)
GAAP net income $ 3,267 $ 1,353 $ 12,838 $ 798 $ 3,188 $ 3,681 $ 18,246
Add:
Financial expenses (income), net 8,502 6,881 5,662 
7,325 6,554 20,163 27,706
Taxes on income (tax benefit) 2,931 2,052 13,054 1,332 1,377 1,373 6,358
Depreciation and amortization 1,606 3,392 4,328 4,284 4,089 5,987 10,476
Share-based compensation 18,438 18,464 18,020 15,754 14,055 68,698 73,942
Earn-out revaluation, acquisition related costs and other 109 1,273 4,240 4,599 5,294 359 5,631
Adjusted EBITDA $ 17,849 $ 19,653 $ 20,710 $ 19,442 $ 21,449 $ 59,217 $ 74,231
Adjusted EBITDA margin 18.9% 19.7% 20.0% 18.1% 19.7% 16.4% 19.0%
Audited)
FY 2024
Audited)
Q2ʼ 24 Q3ʼ 24 Q4ʼ 24 Q1ʼ 25 Q2ʼ 25 FY 2023
Unaudited)
Audited)
FY 2024
Audited)
Q2ʼ 24 Q3ʼ 24 Q4ʼ 24 Q1ʼ 25 Q2ʼ 25 FY 2023
Unaudited)
Audited)
FY 2024
Audited)
Q2ʼ 24 Q3ʼ 24 Q4ʼ 24 Q1ʼ 25 Q2ʼ 25 FY 2023
Unaudited)
    10/14

    Loading...

    Q2 | 2025 Shareholder Letter 11
RECONCILIATION OF GAAP TO NONGAAP OPERATING EXPENSES
In thousands)
GAAP research and development $ 21,855 $ 22,424 $ 22,329 $ 23,627 $ 23,994 $ 90,720 $ 90,241
Less:
Share-based compensation 5,897 5,273 5,563 4,730 4,129 24,310 23,569
Depreciation and amortization 193 190 247 265 313 799 831
Earn-out revaluation, acquisition related costs and other - 700 672 65 62 - 28
Non-GAAP research and development $ 15,765 $ 16,261 $ 17,191 $ 18,567 $ 19,490 $ 65,611 $ 65,813
GAAP sales and marketing $ 41,324 $ 42,970 $ 45,232 $ 47,390 $ 44,844 $ 161,208 $ 171,678
Less:
Share-based compensation 3,389 3,605 3,162 2,246 1,369 13,304 13,592
Depreciation and amortization 553 721 770 716 550 1,601 2,308
Earn-out revaluation, acquisition related costs and other - 67 1,811 1,197 1,147 - 1,878
Non-GAAP sales and marketing $ 37,382 $ 38,577 $ 39,489 $ 43,231 $ 41,778 $ 146,303 $ 153,900
GAAP general and administrative $ 17,764 $ 18,817 $ 21,782 $ 20,966 $ 21,415 $ 62,710 $ 74,814
Less:
Share-based compensation 8,653 9,072 8,850 8,355 8,154 28,587 34,645
Depreciation and amortization 69 66 113 139 71 334 320
Earn-out revaluation, acquisition related costs and other 109 495 3,084 3,293 4,085 359 3,697
Non-GAAP general and administrative $ 8,933 $ 9,184 $ 9,735 $ 9,179 $ 9,105 $ 34,148 $ 36,152
RECONCILIATION OF NET CASH PROVIDED BY OPERATING ACTIVITIES TO FREE CASH FLOW 
In thousands)
Audited)
FY 2024
Audited)
Q2ʼ 24 Q3ʼ 24 Q4ʼ 24 Q1ʼ 25 Q2ʼ 25 FY 2023
Unaudited)
Net cash provided by operating activities $ 20,971 $ 10,867 $ 30,034 $ 28,309 $ 25,204 $ 83,186 $ 83,068
Purchase of property and equipment 309 290 326 287 185 1,053 1,303
Capitalization of internal-use software - - 83 661 - 60 103
Free cash flow $ 20,662 $ 10,577 $ 29,625 $ 27,361 $ 25,019 $ 82,073 $ 81,662
Audited)
FY 2024
Audited)
Q2ʼ 24 Q3ʼ 24 Q4ʼ 24 Q1ʼ 25 Q2ʼ 25 FY 2023
Unaudited)
    11/14

    Loading...

    Q2 | 2025 Shareholder Letter 12
This shareholder letter includes certain key performance metrics and financial measures not based on GAAP, 
including Adjusted EBITDA, Adjusted EBITDA margin, non-GAAP gross profit, non-GAAP gross margin, 
non-GAAP operating expenses, non-GAAP net income (loss), non-GAAP net income (loss) per share and free 
cash flow, as well as operating metrics, including GMV, annual active buyers, annual spend per buyer and 
marketplace take rate. Some amounts in this shareholder letter may not total due to rounding. All percentages 
have been calculated using unrounded amounts. We updated the definitions of annual active buyers, GMV, 
annual spend per buyer and marketplace take rate to align with additional revenue disclosure, which now 
distinguishes between marketplace revenue and services revenue. These metrics will now exclusively reflect 
the marketplace, as amounts related to services previously included in these metrics are deemed immaterial. 
We define each of our non-GAAP measures of financial performance, as the respective GAAP balances 
shown in the above tables, adjusted for, as applicable, depreciation and amortization, share-based 
compensation expenses, contingent consideration revaluation, acquisition related costs and other, income 
taxes, amortization of discount and issuance costs of convertible note, financial (income) expenses, net. 
Non-GAAP gross profit margin represents non-GAAP gross profit expressed as a percentage of revenue. We 
define non-GAAP net income (loss) per share as non-GAAP net income (loss) divided by GAAP 
weighted-average number of ordinary shares basic and diluted. We use free cash flow as a liquidity measure 
and define it as a net cash provided by operating activities less capital expenditures.
We define GMV or marketplace Gross Merchandise Value as the total value of transactions ordered through 
our marketplace, excluding value added tax, goods and services tax, service chargebacks and refunds. 
Annual active buyers on any given date is defined as buyers who have ordered a Gig on our marketplace 
within the last 12-month period, irrespective of cancellations. Annual spend per buyer on any given date is 
calculated by dividing our GMV within the last 12-month period by the number of annual active buyers as of 
such date. Marketplace take rate for a given period means marketplace revenue for such period divided by 
GMV for such period. When we refer in this shareholder letter to the marketplace we refer to transactions 
conducted between buyers and freelancers on Fiverr.com. When we refer to the platform we refer to the 
marketplace and our additional services.
Management and our board of directors use certain metrics as supplemental measures of our performance 
that is not required by, or presented in accordance with GAAP because they assist us in comparing our 
operating performance on a consistent basis, as they remove the impact of items not directly resulting from 
our core operations. We also use these metrics for planning purposes, including the preparation of our 
internal annual operating budget and financial projections, to evaluate the performance and effectiveness of 
our strategic initiatives and capital expenditures and to evaluate our capacity to expand our business. In 
addition, we believe that free cash flow, which we use as a liquidity measure, is useful in evaluating our 
business because free cash flow reflects the cash surplus available or used to fund the expansion of our 
business after the payment of capital expenditures relating to the necessary components of ongoing 
operations. Capital expenditures consist primarily of property and equipment purchases and capitalized 
software costs.
Free cash flow should not be used as an alternative to, or superior to, cash from operating activities. In 
addition, Adjusted EBITDA, Adjusted EBITDA margin, non-GAAP gross profit, non-GAAP gross margin, 
non-GAAP operating expenses, non-GAAP net income (loss) and non-GAAP net income (loss) per share as 
well as operating metrics, including GMV, annual active buyers, annual spend per buyer, marketplace take 
rate and tROI should not be considered in isolation, as an alternative to, or superior to net income (loss), 
revenue, cash flows or other performance measure derived in accordance with GAAP. These metrics are 
frequently used by analysts, investors and other interested parties to evaluate companies in our industry. 
Key Performance Metrics and Non-GAAP Financial Measures
    12/14

    Loading...

    Q2 | 2025 Shareholder Letter 13
Management believes that the presentation of non-GAAP metrics is an appropriate measure of operating 
performance because they eliminate the impact of expenses that do not relate directly to the performance of 
our underlying business.
These non-GAAP metrics should not be construed as an inference that our future results will be unaffected by 
unusual or other items. Additionally, Adjusted EBITDA and other non-GAAP metrics used herein are not 
intended to be a measure of free cash flow for managementʼs discretionary use, as they do not reflect our tax 
payments and certain other cash costs that may recur in the future, including, among other things, cash 
requirements for costs to replace assets being depreciated and amortized. Management compensates for 
these limitations by relying on our GAAP results in addition to using Adjusted EBITDA and other non-GAAP 
metrics as supplemental measures of our performance. Our measure of Adjusted EBITDA, free cash flow and 
other non-GAAP metrics used herein is not necessarily comparable to similarly titled captions of other 
companies due to different methods of calculation. 
See the tables above regarding reconciliations of these non-GAAP financial measures to the most directly 
comparable GAAP measures. 
We are not able to provide a reconciliation of Adjusted EBITDA and Adjusted EBITDA margin guidance for the 
third quarter of 2025 and the fiscal year ending December 31, 2025, and long term to net income (loss), the 
nearest comparable GAAP measure, because certain items that are excluded from Adjusted EBITDA and 
Adjusted EBITDA margin cannot be reasonably predicted or are not in our control. We are also not able to 
provide a reconciliation of free cash flow guidance for the three year period from 20242027 to cash from 
operating activities, the nearest comparable GAAP measure, because certain items that are reflected in free 
cash flow cannot be reasonably predicted or are not in our control. In particular, in the case of Adjusted 
EBITDA and Adjusted EBITDA margin, we are unable to forecast the timing or magnitude of share based 
compensation, amortization of intangible assets, impairment of intangible assets, income or loss on 
revaluation of contingent consideration, other acquisition-related costs, convertible notes amortization of 
discount and issuance costs and exchange rate income or loss, and in the case of free cash flow, we are 
unable to forecast property and equipment purchases and capitalized software costs, in each case, as 
applicable without unreasonable efforts, and these items could significantly impact, either individually or in the 
aggregate, GAAP measures in the future.
Forward Looking Statements
This shareholder letter contains forward-looking statements within the meaning of the Private Securities 
Litigation Reform Act of 1995. All statements contained in this shareholder letter that do not relate to matters 
of historical fact should be considered forward-looking statements, including, without limitation, statements 
regarding our expected financial performance and operational performance, our business plans and strategy, 
the growth of our business, AI services and developments, our product portfolio, our customer relationships 
and experiences, the expected completion of some of our projects as well as statements that include the 
words “expect,ˮ “intend,ˮ “plan,ˮ “believe,ˮ “project,ˮ “forecast,ˮ “estimate,ˮ “may,ˮ “should,ˮ “anticipateˮ and 
similar statements of a future or forward-looking nature. These forward-looking statements are based on 
managementʼs current expectations. These statements are neither promises nor guarantees, but involve 
known and unknown risks, uncertainties and other important factors that may cause actual results, 
performance or achievements to be materially different from any future results, performance or achievements 
expressed or implied by the forward-looking statements, including, but not limited to: our ability to 
successfully implement our business plan within adverse economic conditions that may impact consumers, 
business spending and the demand for our services or have a material adverse impact on our business, 
financial condition and results of operations; our ability to attract and retain a large community of buyers
    13/14

    Loading...

    Q2 | 2025 Shareholder Letter 
and freelancers; our ability to generate sufficient revenue to maintain profitability and our net cash flow 
generated by operating activities; our ability to maintain and enhance our brand; our dependence on the 
continued growth and expansion of the market for freelancers and the services they offer; our dependence on 
traffic to our website; our ability to maintain user engagement on our website and to maintain and improve the 
quality of our platform; our operations within a competitive market; political, economic and military instability 
in Israel, including related to the war in Israel; our ability and the ability of third parties to protect our usersʼ 
personal or other data from a security breach and to comply with laws and regulations relating to data privacy, 
data protection and cybersecurity; our ability to manage our current and potential future growth; our 
dependence on decisions and developments in the mobile device industry, over which we do not have control; 
our ability to detect errors, defects or disruptions in our platform; our ability to comply with the terms of 
underlying licenses of open source software components on our platform; our ability to expand into markets 
outside the United States and our ability to manage the business and economic risks of international 
expansion and operations; our ability to achieve desired operating margins; our ability to comply with a wide 
variety of U.S. and international laws and regulations, including with regulatory frameworks around the 
development and use of AI; our ability to attract, recruit, retain and develop qualified employees; our reliance 
on Amazon Web Services; our ability to mitigate payment and fraud risks; our dependence on relationships 
with payment partners, banks and disbursement partners; and the other important factors discussed under 
the caption “Risk Factorsˮ in our annual report on Form 20F filed with the U.S. Securities and Exchange 
Commission (“SECˮ) on February 19, 2025 as such factors may be updated from time to time in our other 
filings with the SEC, which are accessible on the SECʼs website at www.sec.gov. In addition, we operate in a 
very competitive and rapidly changing environment. New risks emerge from time to time. It is not possible for 
our management to predict all risks, nor can we assess the impact of all factors on our business or the extent 
to which any factor, or combination of factors, may cause actual results to differ materially from those 
contained in any forward-looking statements that we may make. In light of these risks, uncertainties and 
assumptions, the forward-looking events and circumstances discussed in this shareholder letter are inherently 
uncertain and may not occur, and actual results could differ materially and adversely from those anticipated or 
implied in the forward-looking statements. Accordingly, you should not rely upon forward-looking statements 
as predictions of future events. In addition, the forward-looking statements made in this shareholder letter 
relate only to events or information as of the date on which the statements are made in this shareholder letter. 
Except as required by law, we undertake no obligation to update or revise publicly any forward-looking 
statements, whether as a result of new information, future events or otherwise, after the date on which the 
statements are made or to reflect the occurrence of unanticipated events.
14
    14/14

    Q2 | 2025 Shareholder Letter Fiverr

    • 1. Q2 | 2025 Shareholder Letter F I V E R R . C O M 1 David Colón, Seller Founder ColonFilm.com Spain
    • 2. Q2 | 2025 Shareholder Letter ON THE COVER David Colón, Seller Founder ColonFilm.com Spain 2 David Colón is the Founder of ColonFilm.com, a creative agency that specializes in high-quality movie posters and book covers. His award-winning graphic designs and cinematography have allowed him to work with clients worldwide to tell captivating stories. Davidʼs work has been recognized internationally, winning accolades such as Best Film Poster at the International Film Festival in Rome and Best Web Design in Zaragoza, Spain. David joined Fiverr in 2016, while studying video and image editing at a professional film academy. He started off offering a wider range of services with accessible prices, including logos and social media graphics, but over time realized his business was strongest in narrative design. Joining Fiverr Pro was his turning point, as he re-invested his earnings into improving his tools, organizing workflow, building a clear visual portfolio, and quickly made this his full-time job. His typical clients are indie authors, filmmakers and producers who work on larger projects. He handles most of the work solo, but also relies on a close circle of trusted collaborators for specific value add tasks. Some notable works include a book cover for one of Appleʼs founders and artwork for a documentary linked to high-profile film Platoon. Since joining Fiverr, he has completed over 1,400 orders and helped more than 1,000 clients, with typical project size ranging from $300 to $2K. David is a Top Rated Seller and Fiverr is his main international channel, with about 80% of his projects coming through the platform. “Fiverr allowed me to build a freelancing career, connect with people from different countries, and grow through creative projects. The global reach and built-in trust have been essential to scaling without having to chase work. As the platform developed new categories and attracted more diverse clients, it pushed me to raise the bar of my services and skills continuously.”
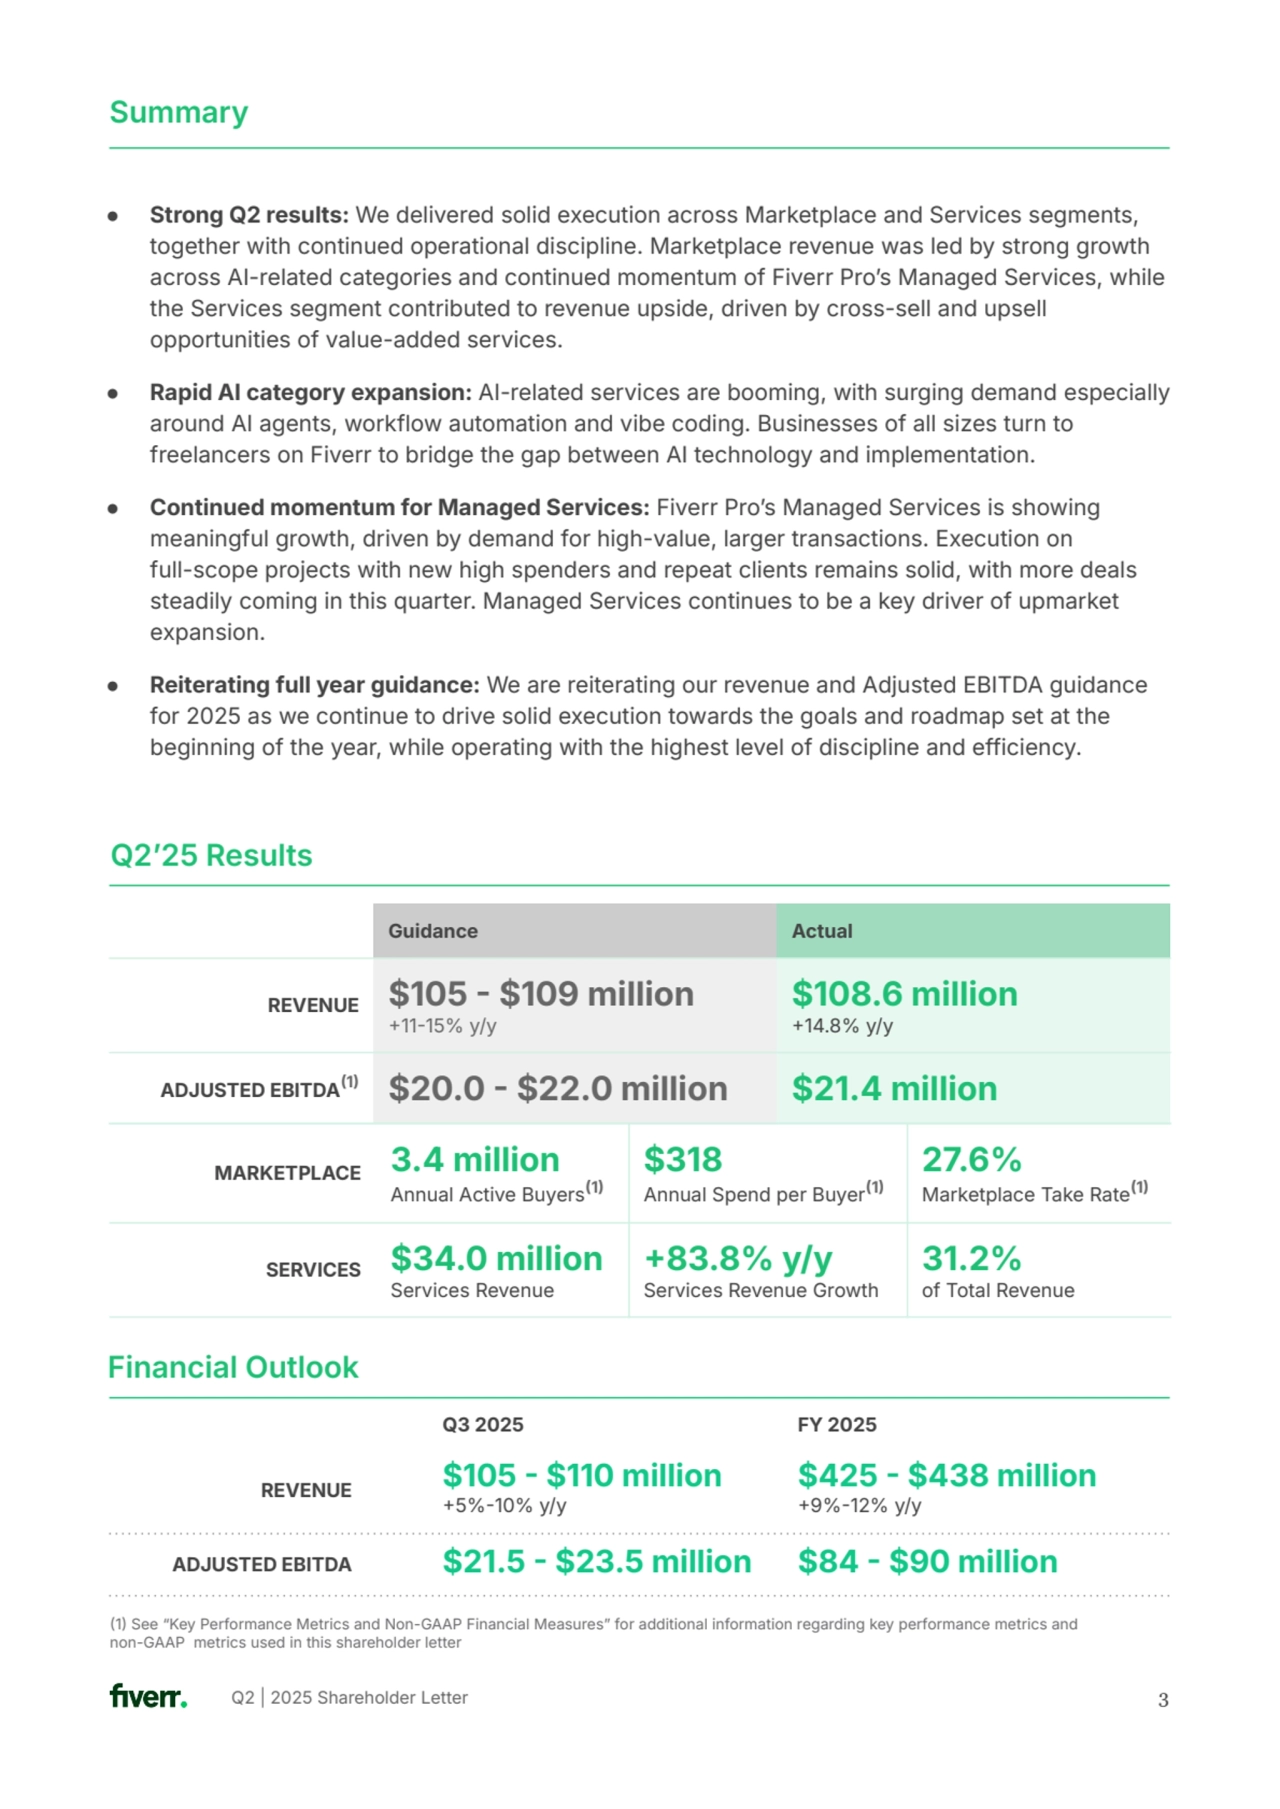
    • 3. Q2 | 2025 Shareholder Letter ● Strong Q2 results: We delivered solid execution across Marketplace and Services segments, together with continued operational discipline. Marketplace revenue was led by strong growth across AI-related categories and continued momentum of Fiverr Proʼs Managed Services, while the Services segment contributed to revenue upside, driven by cross-sell and upsell opportunities of value-added services. ● Rapid AI category expansion: AI-related services are booming, with surging demand especially around AI agents, workflow automation and vibe coding. Businesses of all sizes turn to freelancers on Fiverr to bridge the gap between AI technology and implementation. ● Continued momentum for Managed Services: Fiverr Proʼs Managed Services is showing meaningful growth, driven by demand for high-value, larger transactions. Execution on full-scope projects with new high spenders and repeat clients remains solid, with more deals steadily coming in this quarter. Managed Services continues to be a key driver of upmarket expansion. ● Reiterating full year guidance: We are reiterating our revenue and Adjusted EBITDA guidance for 2025 as we continue to drive solid execution towards the goals and roadmap set at the beginning of the year, while operating with the highest level of discipline and efficiency. Summary Q2ʼ25 Results 3 Guidance Actual REVENUE $105  $109 million 1115% y/y $108.6 million 14.8% y/y ADJUSTED EBITDA1 $20.0  $22.0 million $21.4 million MARKETPLACE 3.4 million Annual Active Buyers1 $318 Annual Spend per Buyer1 27.6% Marketplace Take Rate1 SERVICES $34.0 million Services Revenue 83.8% y/y Services Revenue Growth 31.2% of Total Revenue 1 See “Key Performance Metrics and Non-GAAP Financial Measuresˮ for additional information regarding key performance metrics and non-GAAP metrics used in this shareholder letter Q3 2025 FY 2025 REVENUE $105  $110 million 5%10% y/y $425  $438 million 9%12% y/y ADJUSTED EBITDA $21.5  $23.5 million $84  $90 million Financial Outlook
    • 4. Q2 | 2025 Shareholder Letter Halfway through 2025, Iʼm incredibly proud of what our team has accomplished. We are closely tracking with the goals we set at the beginning of the year, delivering 15% y/y revenue growth and a 20% Adjusted EBITDA margin for the second quarter. We unlocked pockets of growth through catalog expansion, upmarket enablement and services upsell, despite the relatively slow hiring environment. We continue to operate with discipline and efficiency. We understand the importance of a strong cash position and growing cash flow, and believe that discipline is not a constraint for growth, rather it empowers us to do what we love, which is building and innovating. AI is fundamentally reshaping how work gets done, both on our marketplace and within Fiverr. Our 11th Annual Business Trends Index reveals surging demand for AI agents and workflow automation across industries. Amid a crowded AI tool landscape, Fiverr freelancers are increasingly essential in bridging the gap between technology and implementation, delivering customized, high-impact solutions for our customers. Whether it's embedding GenAI into branded content workflows, building marketing automation funnels, or debugging early-stage prototypes, our talent pool is empowering our customers to harness the real potential of AI. Our investment in AI-related categories and deep bench of AI skilled freelancers have translated into growth momentum in verticals such as Programming & Tech, Video & Animation, and Digital Marketing. Weʼre also making rapid progress on product innovation and infrastructure. Fiverr Goʼs Personal Assistant continues to gain traction, and we're expanding its capabilities beyond admin support to help sellers market their services and reach more buyers. We've significantly upgraded our Dynamic Matching engine to integrate advanced LLMs and enriched seller data, leading to continued improvement in the offer to order conversion. On the tech infrastructure side, we're building a new MCP layer internally to accelerate AI tool deployment, and we are already seeing impact in areas like marketplace intelligence and support ticket resolution. As we look to the future, we see AI as a continued tailwind for our business, providing ample opportunity for us to expand our catalog, enhance the marketplace experience and deepen our product and operational excellence. We continue to believe that real-world impact comes not from AI alone, but from the dynamic collaboration between human expertise and intelligent tools. Fiverr is distinctly positioned to be the platform of choice for AI talent. Recently, I had the privilege of celebrating with our Fiverr sellers who crossed the $1 million earnings milestone. Listening to their journeys and success makes me feel insanely proud. They are the reason we exist: to be a platform that empowers people to chase dreams, become independent, and deliver top-notch service to clients. Itʼs whatʼs driving us forward. Thank you for your continued trust and support. 4 To Our Shareholders AI Categories and Managed Services Led Marketplace Growth For Q2 2025, Marketplace revenue was $74.7 million, driven by 3.4 million annual active buyers, $318 annual spend per buyer, and a 27.6% marketplace take rate. We continued to execute amid a stable macro environment, and the success of our investments in AI and upmarket shines through. While overall GMV growth remains muted, when we look at the underlying
    • 5. Q2 | 2025 Shareholder Letter category dynamics, we saw verticals such as Programming & Tech, Video & Animation, and Digital Marketing experience accelerating y/y growth for the last few months. Similarly, we saw distinctive growth trends among larger and more complex projects on the marketplace. In Q2ʼ25, over 50% of our marketplace is driven by transactions over $200, and more encouragingly, these transactions are growing double digit year over year in terms of total GMV. These underlying dynamics demonstrate how our marketplace continues to evolve and strengthen towards upskills and upmarket clients which can drive long-term, durable growth. In the near-term, we expect Marketplace revenue for the second half of the year to remain stable, with flat to slightly negative y/y growth. We continued to see rapid category expansion and growing demand for AI-related services. Two areas are particularly popular: 1 Building AI agents to automate workflow and processes; and 2) app building using vibe coding platforms. While workflow automation is not a novel concept, platforms such as Make.com, GoHighLevel and Airtable have substantially democratized the access to automation via a no-code and low-code environment. We are seeing many solopreneurs, marketers and small business owners utilize these platforms to automate tasks such as email marketing, social media management, content creation, or customer relationship management. That said, consumers with limited technical backgrounds often encounter various technical issues, such as debugging sign-up flows, or problems with connecting to databases or other applications. Similarly for vibe coding, we saw surging demand searching for experts on platforms such as Loveable and Bolt, as they seek help for things such as functionality extension, publishing and deployment, bug fixing, and backend integration. As a result, weʼve seen demand for these services grow 510x in the last 6 months, as Fiverr became the go-to place to find AI talent to close the last-mile gaps between technology and implementation. Weʼre also seeing rapid growth in Managed Services within Fiverr Pro, particularly with demand for high-value and full-scope projects, successfully unlocking larger deal sizes. In Q1, we signed several six-figure, multi-month contracts through Fiverr Pro, illustrating both first-time high spenders and repeat buyers expanding their footprint through our managed services offerings. In Q2, we saw solid execution across these large projects, with expected completion dates varying between July and October. In addition, we continued with a healthy cadence of new deals, including a preschool leveraging a top development agency seller on Fiverr to revamp their codebase, and a cybersecurity company utilizing Managed Services to build a cross-functional team for full-funnel marketing support. We believe Managed Services continues to be an important channel for us to drive upmarket penetration. 5 In Q2ʼ25, Services revenue was $34.0 million, up 83.8%, continuing its strong growth momentum as we continue to expand value-added service offerings to our customers. During the quarter, we built a new AI-powered Shopify Store Builder tool by integrating with AutoDS, enabling users to create a Shopify store directly from Fiverr. We have also deepened the top of funnel exposure between Fiverrʼs marketplace and the e-commerce tools on AutoDS, streamlining cross-sell opportunities between the two platforms. In addition, we saw strong Seller Plus revenue growth, driven by both new sign-ups as well as upgrades, as the bundled offerings with Services Cross-Sell Drives Additional Revenue Upside
    • 6. Q2 | 2025 Shareholder Letter 6 Since we launched Fiverr Go in February, we continue to see active engagement among sellers, with over 9,000 seller activations so far. As the density of sellers with Fiverr Go continues to increase, we are working to add filtering capability in the search funnel in order for buyers to reach these sellers more easily and in turn driving faster response and conversion. We are also exploring ways for Fiverr Goʼs personal assistant to go beyond helping sellers respond to inbox messages. This includes helping sellers to optimize their service listings by analyzing marketplace and sellersʼ performance trends, as well as helping sellers to market their services on and off the platform. We believe Fiverr Go can serve as a gateway for buyers and sellers to engage more effectively and ultimately translating to more efficient matching and conversion. We are also investing heavily in implementing AI technology across our tech stack, this includes product-facing innovation, internal workflow automation and enterprise knowledge management. For example, we are incorporating the latest LLM capabilities into the Dynamic Matching algorithm in order to optimize the seller recommendations. It expands the existing algorithm so that it not only accounts for the category and quality data of the marketplace, but also the nuanced information embedded in the inbox messages in order to understand the match rate between each buyer and seller pair. As a result, we continue to see conversion rate improvement for the Dynamic Matching product, translating to 25% q/q GMV growth from Dynamic Matching. In addition, there are multiple ongoing initiatives to deploy AI technology to drive operational efficiency across the organization. This includes leveraging agentic AI to enhance marketplace intelligence operations, developing enterprise search tools to streamline workflows for customer support teams, and building infrastructure and tools to automate and scale data analyst capacity. Technology is at the heart of everything we do at Fiverr, and as AI rapidly evolves with the potential to upend every industry, we strive to stay at the forefront of the curve and be the leading force in reimagining the future of marketplaces. AI Drives Marketplace Transformation and Operational Efficiency Fiverr Go created a tailwind for the Seller Plus Premium tier. All of those efforts have resulted in additional revenue upside in the Services revenue segment. Looking ahead, we believe Services revenue will continue to serve as a strong growth driver for both top and bottom lines, with overall revenue contribution over 30% for the full year 2025. Fiverrʼs management will host a conference call to discuss its financial results on Wednesday, July 30, 2025, at 830 a.m. Eastern Time. A live call webcast can be accessed from Fiverrʼs Investor Relations website. An archived version will be available on the website after the call. To participate in the conference call, please register using the link here. Investor Relations investors@fiverr.com Press press@fiverr.com CONFERENCE CALL AND WEBCAST DETAILS
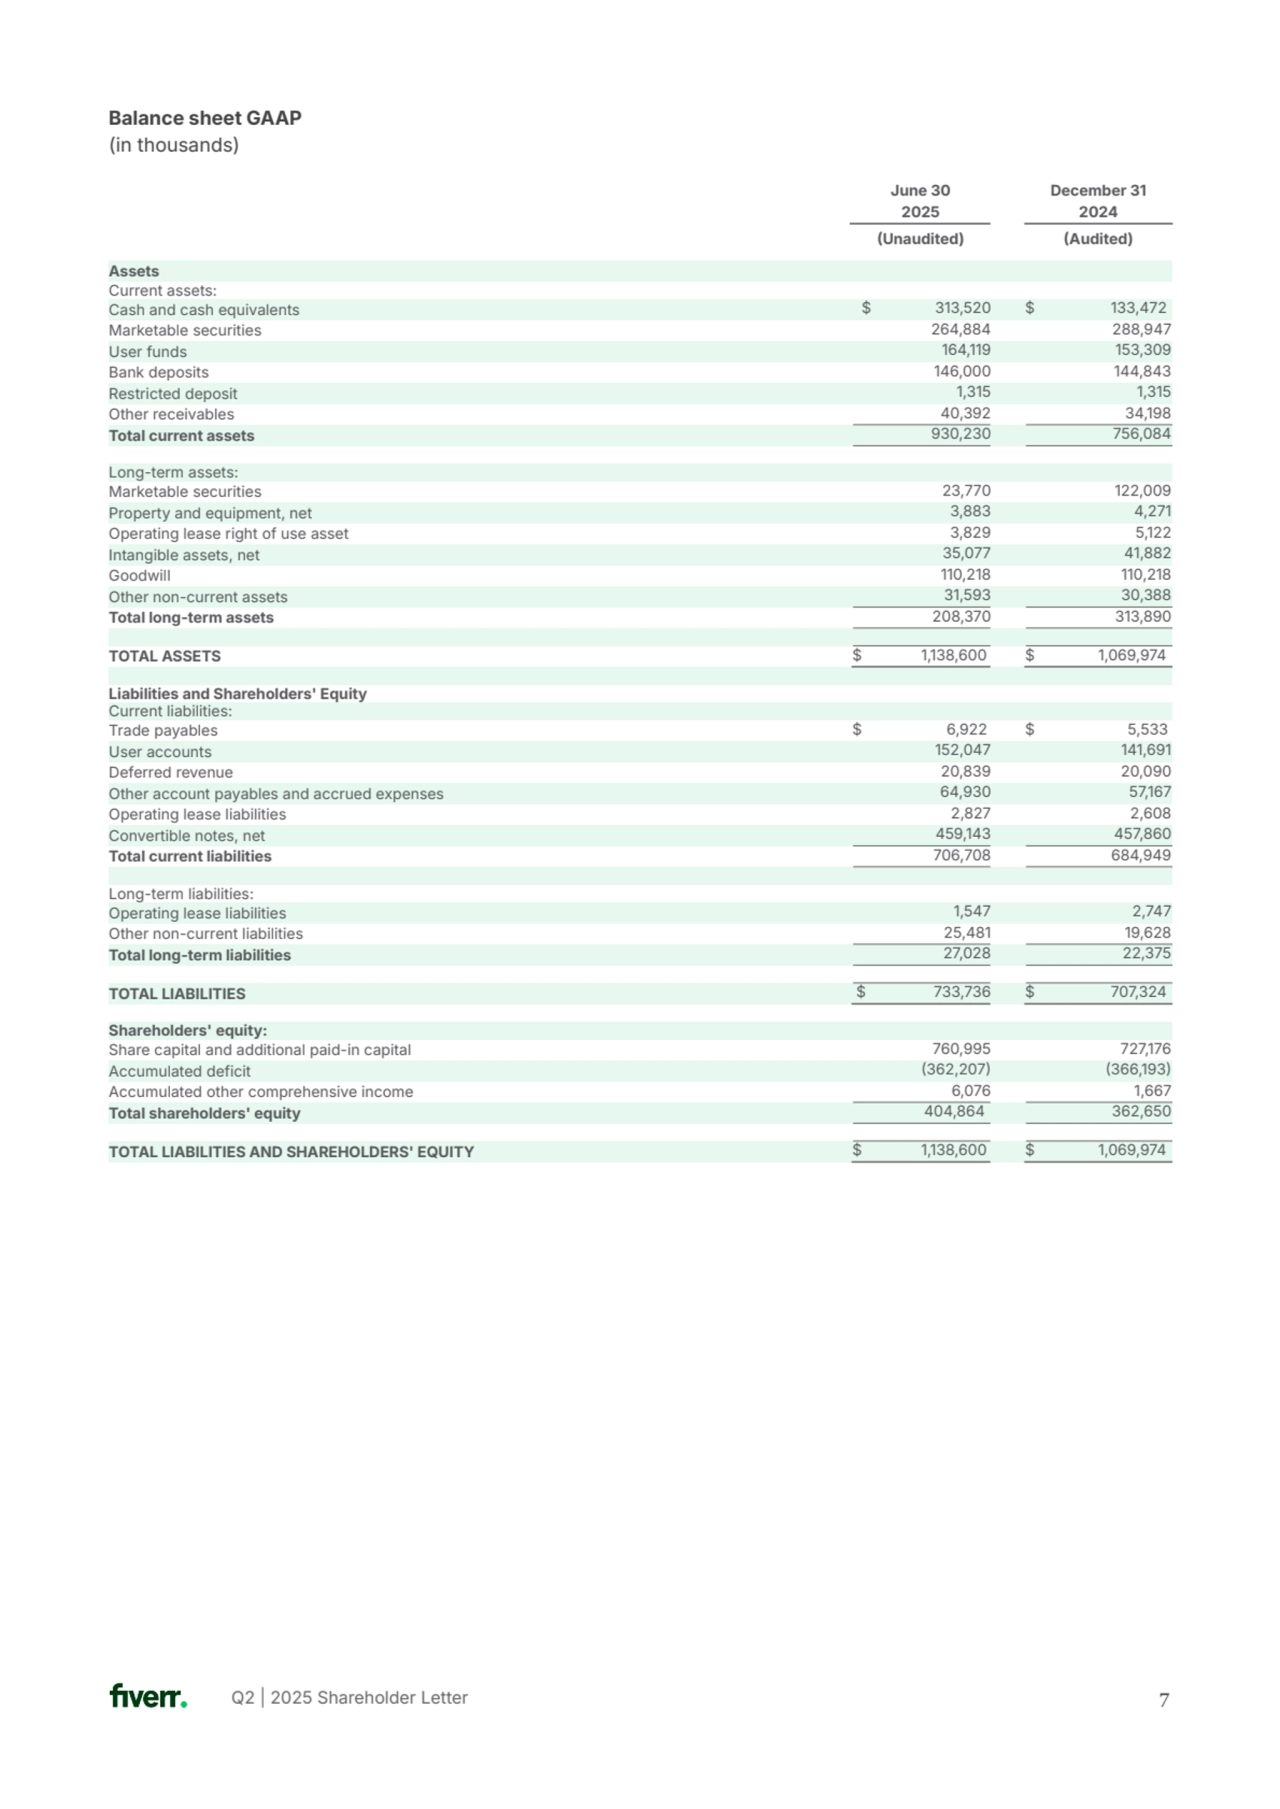
    • 7. Q2 | 2025 Shareholder Letter 7 Assets Current assets: Cash and cash equivalents $ 313,520 $ 133,472 Marketable securities 264,884 288,947 User funds 164,119 153,309 Bank deposits 146,000 144,843 Restricted deposit 1,315 1,315 Other receivables 40,392 34,198 Total current assets 930,230 756,084 Long-term assets: Marketable securities 23,770 122,009 Property and equipment, net 3,883 4,271 Operating lease right of use asset 3,829 5,122 Intangible assets, net 35,077 41,882 Goodwill 110,218 110,218 Other non-current assets 31,593 30,388 Total long-term assets 208,370 313,890 TOTAL ASSETS $ 1,138,600 $ 1,069,974 Liabilities and Shareholders' Equity Current liabilities: Trade payables $ 6,922 $ 5,533 User accounts 152,047 141,691 Deferred revenue 20,839 20,090 Other account payables and accrued expenses 64,930 57,167 Operating lease liabilities 2,827 2,608 Convertible notes, net 459,143 457,860 Total current liabilities 706,708 684,949 Long-term liabilities: Operating lease liabilities 1,547 2,747 Other non-current liabilities 25,481 19,628 Total long-term liabilities 27,028 22,375 TOTAL LIABILITIES $ 733,736 $ 707,324 Shareholders' equity: Share capital and additional paid-in capital 760,995 727,176 Accumulated deficit 362,207 366,193 Accumulated other comprehensive income 6,076 1,667 Total shareholders' equity 404,864 362,650 TOTAL LIABILITIES AND SHAREHOLDERS' EQUITY $ 1,138,600 $ 1,069,974 Balance sheet GAAP (in thousands) June 30 December 31 2025 2024 Unaudited) Audited)
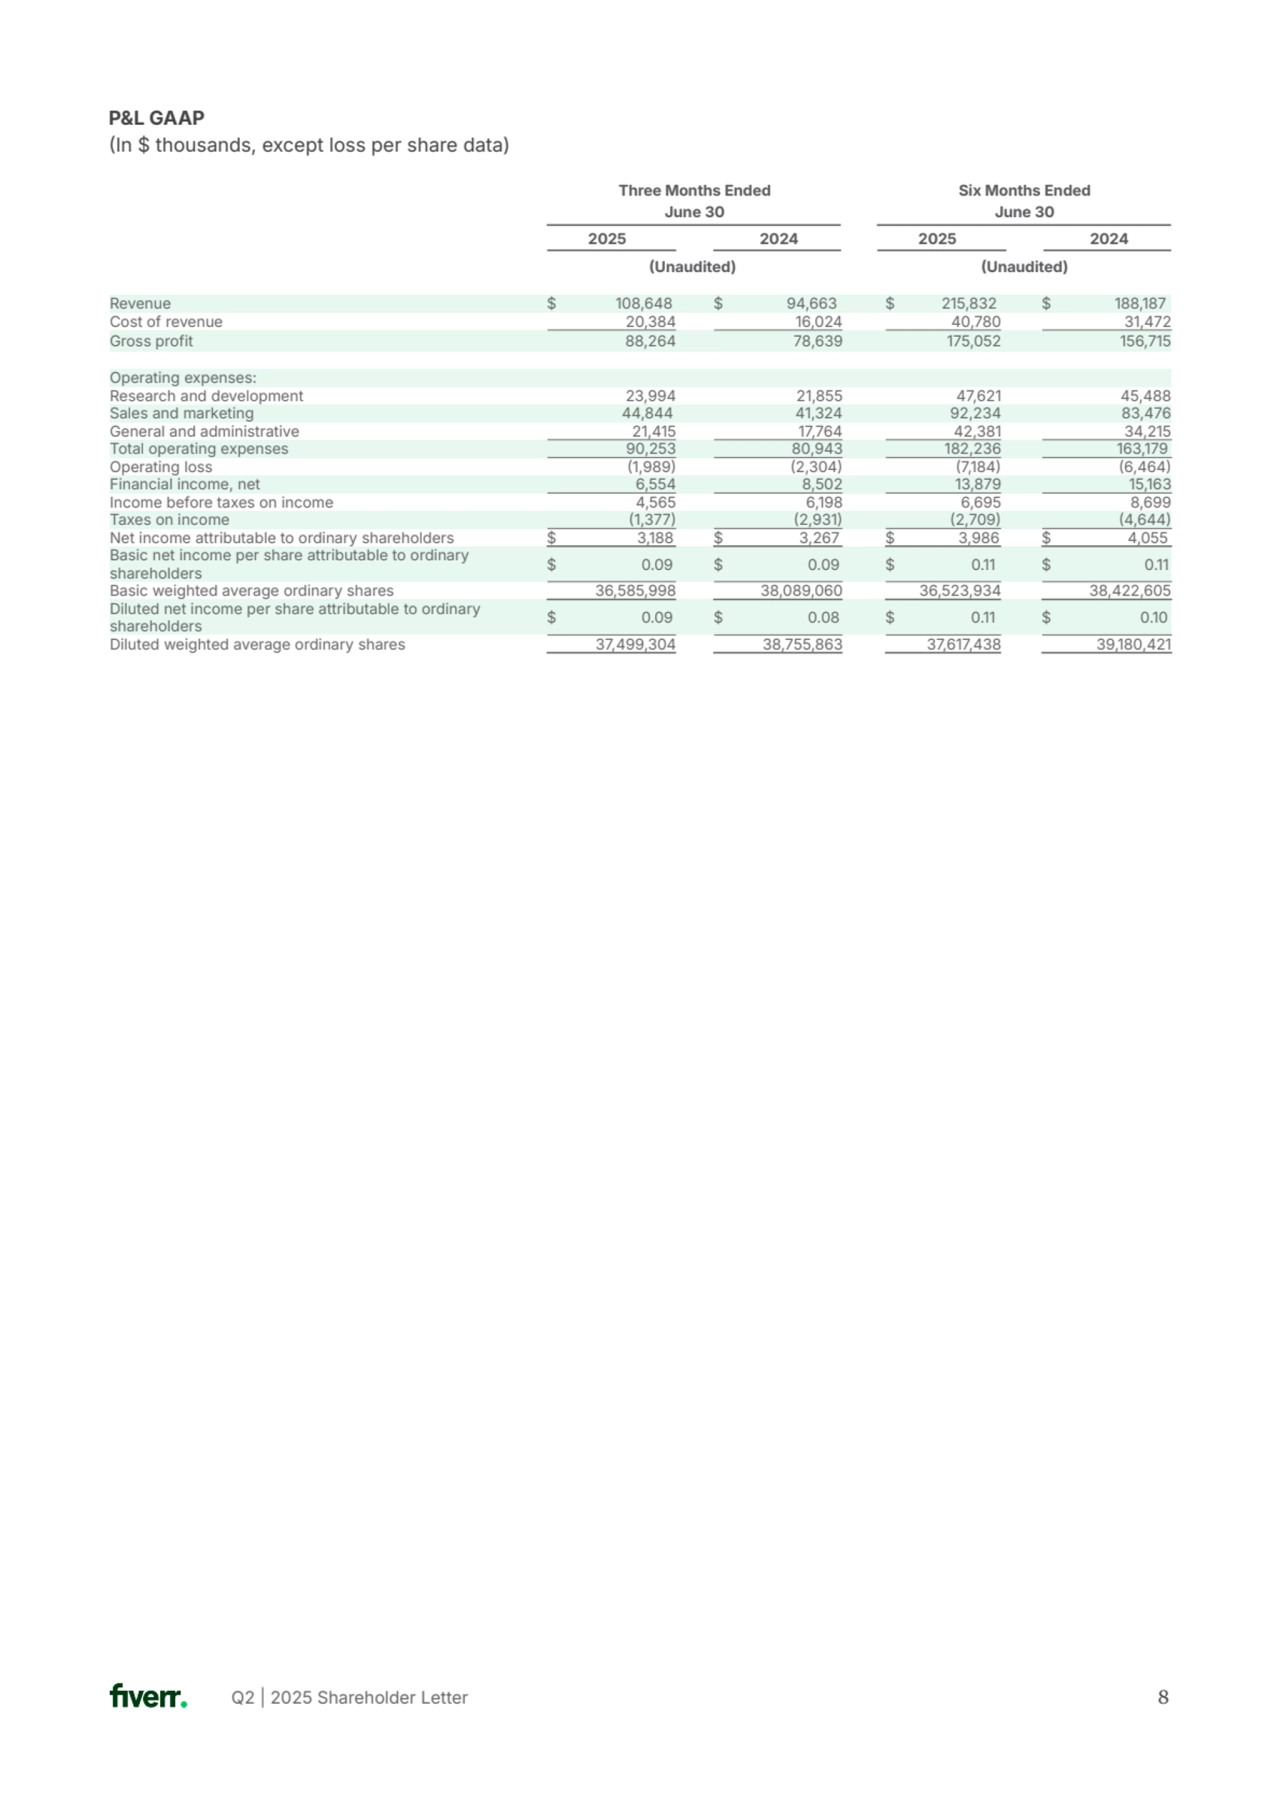
    • 8. Q2 | 2025 Shareholder Letter 8 P&L GAAP In $ thousands, except loss per share data) Six Months Ended June 30 2025 2024 Unaudited) Unaudited) Three Months Ended June 30 2025 2024 Revenue $ 108,648 $ 94,663 $ 215,832 $ 188,187 Cost of revenue 20,384 16,024 40,780 31,472 Gross profit 88,264 78,639 175,052 156,715 Operating expenses: Research and development 23,994 21,855 47,621 45,488 Sales and marketing 44,844 41,324 92,234 83,476 General and administrative 21,415 17,764 42,381 34,215 Total operating expenses 90,253 80,943 182,236 163,179 Operating loss 1,989 2,304 7,184 6,464 Financial income, net 6,554 8,502 13,879 15,163 Income before taxes on income 4,565 6,198 6,695 8,699 Taxes on income 1,377 2,931 2,709 4,644 Net income attributable to ordinary shareholders $ 3,188 $ 3,267 $ 3,986 $ 4,055 Basic net income per share attributable to ordinary shareholders $ 0.09 $ 0.09 $ 0.11 $ 0.11 Basic weighted average ordinary shares 36,585,998 38,089,060 36,523,934 38,422,605 Diluted net income per share attributable to ordinary shareholders $ 0.09 $ 0.08 $ 0.11 $ 0.10 Diluted weighted average ordinary shares 37,499,304 38,755,863 37,617,438 39,180,421
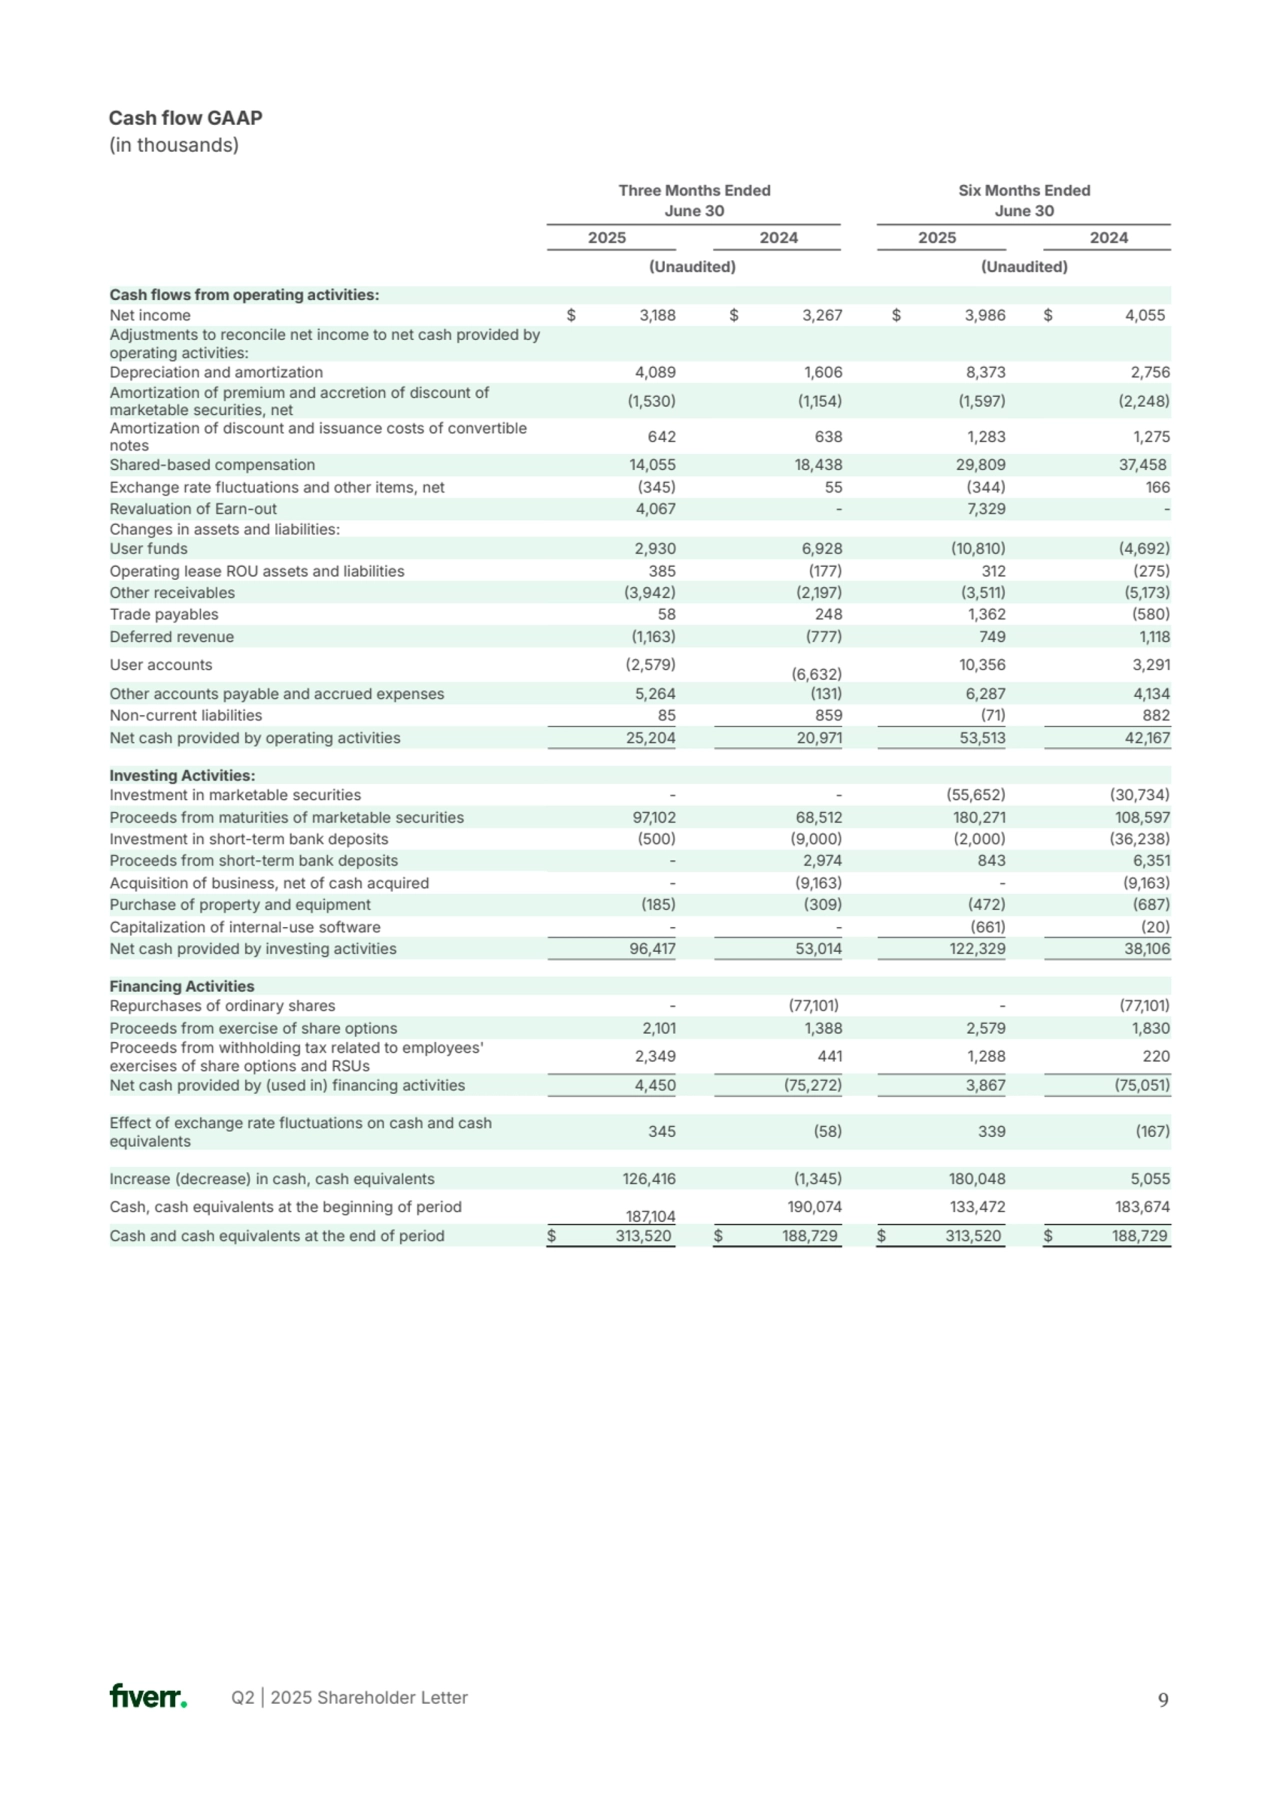
    • 9. Q2 | 2025 Shareholder Letter 9 Cash flow GAAP (in thousands) Six Months Ended June 30 2025 2024 Unaudited) Unaudited) Three Months Ended June 30 2025 2024 Cash flows from operating activities: Net income $ 3,188 $ 3,267 $ 3,986 $ 4,055 Adjustments to reconcile net income to net cash provided by operating activities: Depreciation and amortization 4,089 1,606 8,373 2,756 Amortization of premium and accretion of discount of marketable securities, net 1,530 1,154 1,597 2,248 Amortization of discount and issuance costs of convertible notes 642 638 1,283 1,275 Shared-based compensation 14,055 18,438 29,809 37,458 Exchange rate fluctuations and other items, net 345 55 344 166 Revaluation of Earn-out 4,067 - 7,329 - Changes in assets and liabilities: User funds 2,930 6,928 10,810 4,692 Operating lease ROU assets and liabilities 385 177 312 275 Other receivables 3,942 2,197 3,511 5,173 Trade payables 58 248 1,362 580 Deferred revenue 1,163 777 749 1,118 User accounts 2,579 6,632 10,356 3,291 Other accounts payable and accrued expenses 5,264 131 6,287 4,134 Non-current liabilities 85 859 71 882 Net cash provided by operating activities 25,204 20,971 53,513 42,167 Investing Activities: Investment in marketable securities - - 55,652 30,734 Proceeds from maturities of marketable securities 97,102 68,512 180,271 108,597 Investment in short-term bank deposits 500 9,000 2,000 36,238 Proceeds from short-term bank deposits - 2,974 843 6,351 Acquisition of business, net of cash acquired - 9,163 - 9,163 Purchase of property and equipment 185 309 472 687 Capitalization of internal-use software - - 661 20 Net cash provided by investing activities 96,417 53,014 122,329 38,106 Financing Activities Repurchases of ordinary shares - 77,101 - 77,101 Proceeds from exercise of share options 2,101 1,388 2,579 1,830 Proceeds from withholding tax related to employees' exercises of share options and RSUs 2,349 441 1,288 220 Net cash provided by (used in) financing activities 4,450 75,272 3,867 75,051 Effect of exchange rate fluctuations on cash and cash equivalents 345 58 339 167 Increase (decrease) in cash, cash equivalents 126,416 1,345 180,048 5,055 Cash, cash equivalents at the beginning of period 187,104 190,074 133,472 183,674 Cash and cash equivalents at the end of period $ 313,520 $ 188,729 $ 313,520 $ 188,729
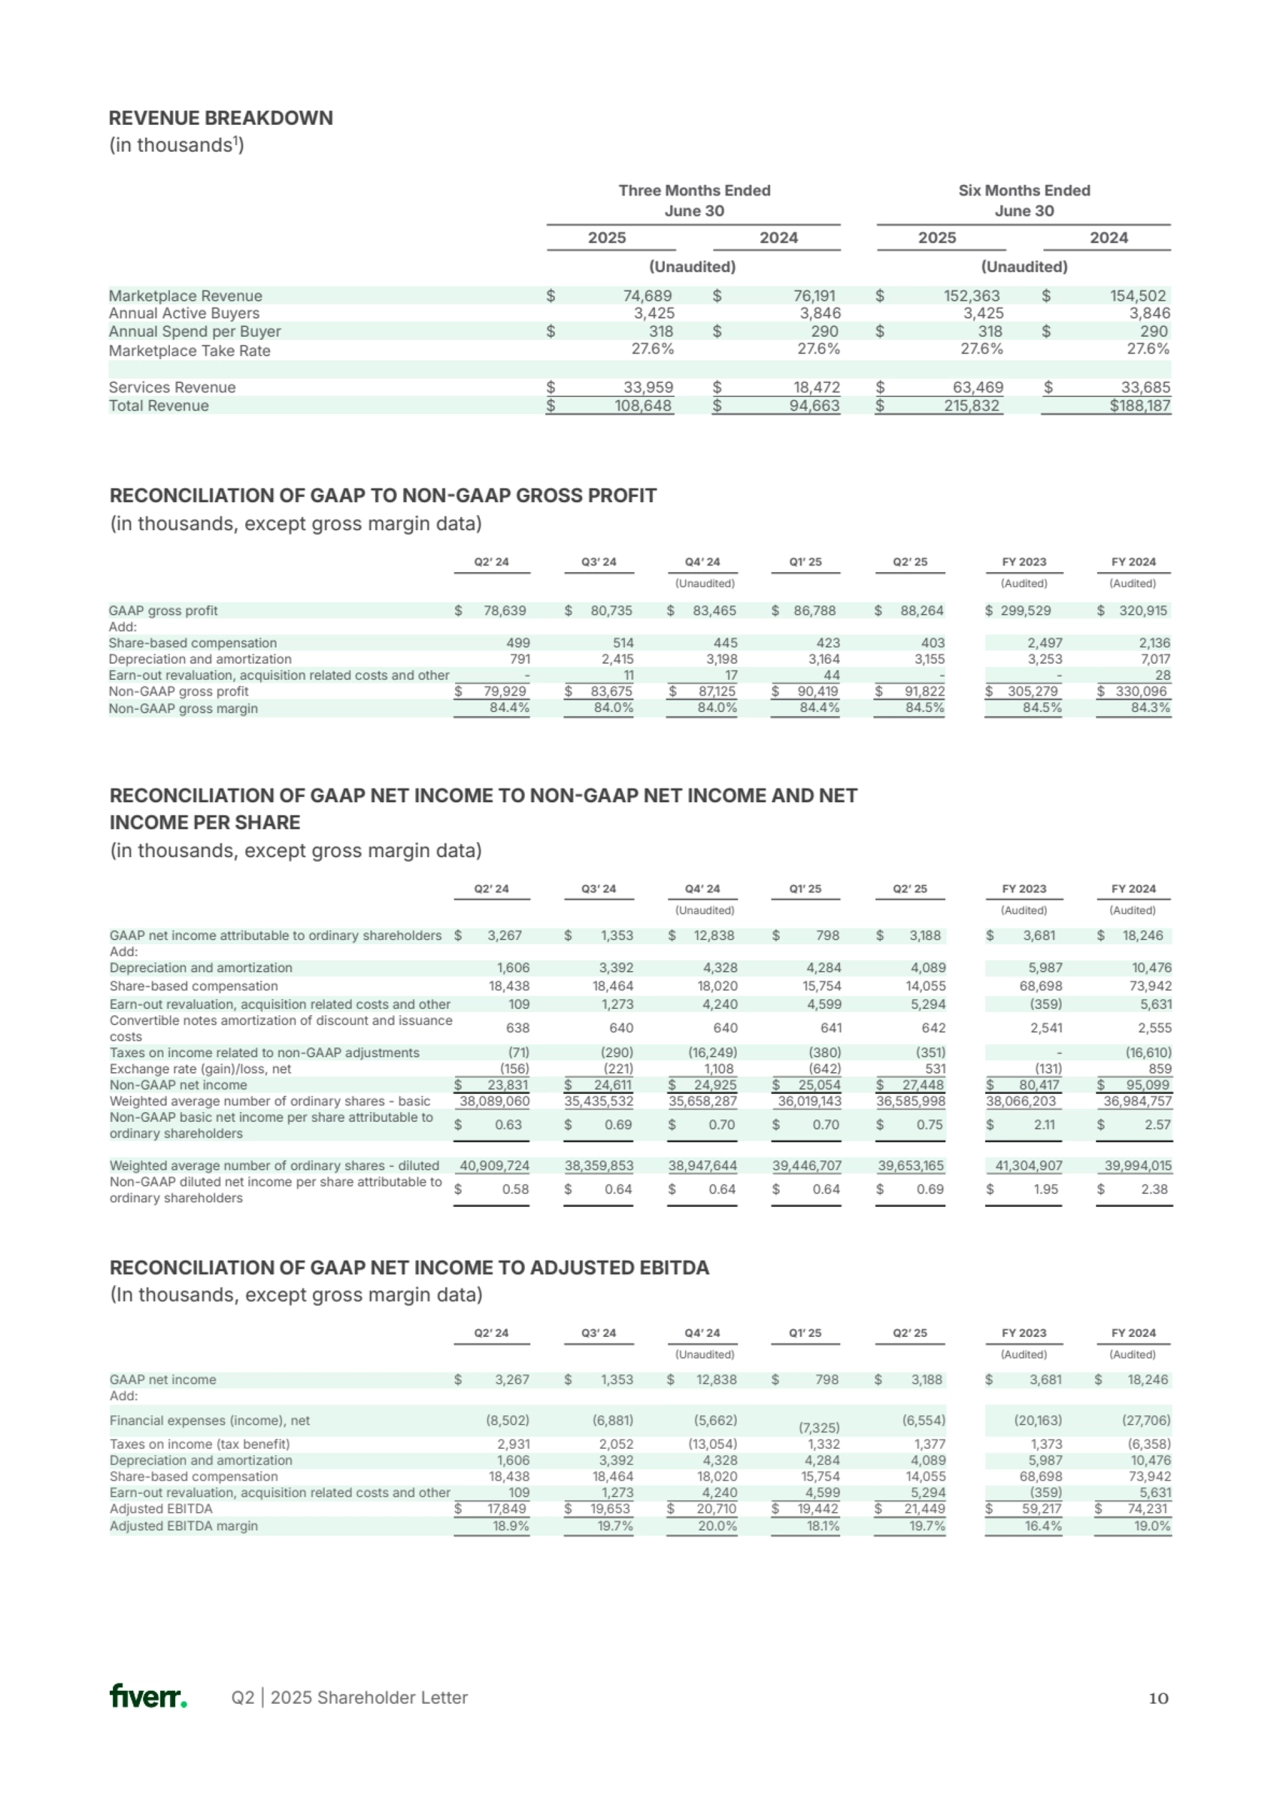
    • 10. Q2 | 2025 Shareholder Letter 10 Marketplace Revenue $ 74,689 $ 76,191 $ 152,363 $ 154,502 Annual Active Buyers 3,425 3,846 3,425 3,846 Annual Spend per Buyer $ 318 $ 290 $ 318 $ 290 Marketplace Take Rate 27.6% 27.6% 27.6% 27.6% Services Revenue $ 33,959 $ 18,472 $ 63,469 $ 33,685 Total Revenue $ 108,648 $ 94,663 $ 215,832 $188,187 REVENUE BREAKDOWN (in thousands1) Six Months Ended June 30 2025 2024 Unaudited) Unaudited) Three Months Ended June 30 2025 2024 GAAP gross profit $ 78,639 $ 80,735 $ 83,465 $ 86,788 $ 88,264 $ 299,529 $ 320,915 Add: Share-based compensation 499 514 445 423 403 2,497 2,136 Depreciation and amortization 791 2,415 3,198 3,164 3,155 3,253 7,017 Earn-out revaluation, acquisition related costs and other - 11 17 44 - - 28 Non-GAAP gross profit $ 79,929 $ 83,675 $ 87,125 $ 90,419 $ 91,822 $ 305,279 $ 330,096 Non-GAAP gross margin 84.4% 84.0% 84.0% 84.4% 84.5% 84.5% 84.3% RECONCILIATION OF GAAP TO NONGAAP GROSS PROFIT (in thousands, except gross margin data) RECONCILIATION OF GAAP NET INCOME TO NONGAAP NET INCOME AND NET INCOME PER SHARE (in thousands, except gross margin data) GAAP net income attributable to ordinary shareholders $ 3,267 $ 1,353 $ 12,838 $ 798 $ 3,188 $ 3,681 $ 18,246 Add: Depreciation and amortization 1,606 3,392 4,328 4,284 4,089 5,987 10,476 Share-based compensation 18,438 18,464 18,020 15,754 14,055 68,698 73,942 Earn-out revaluation, acquisition related costs and other 109 1,273 4,240 4,599 5,294 359 5,631 Convertible notes amortization of discount and issuance costs 638 640 640 641 642 2,541 2,555 Taxes on income related to non-GAAP adjustments 71 290 16,249 380 351 - 16,610 Exchange rate (gain)/loss, net 156 221 1,108 642 531 131 859 Non-GAAP net income $ 23,831 $ 24,611 $ 24,925 $ 25,054 $ 27,448 $ 80,417 $ 95,099 Weighted average number of ordinary shares - basic 38,089,060 35,435,532 35,658,287 36,019,143 36,585,998 38,066,203 36,984,757 Non-GAAP basic net income per share attributable to ordinary shareholders $ 0.63 $ 0.69 $ 0.70 $ 0.70 $ 0.75 $ 2.11 $ 2.57 Weighted average number of ordinary shares - diluted 40,909,724 38,359,853 38,947,644 39,446,707 39,653,165 41,304,907 39,994,015 Non-GAAP diluted net income per share attributable to ordinary shareholders $ 0.58 $ 0.64 $ 0.64 $ 0.64 $ 0.69 $ 1.95 $ 2.38 RECONCILIATION OF GAAP NET INCOME TO ADJUSTED EBITDA In thousands, except gross margin data) GAAP net income $ 3,267 $ 1,353 $ 12,838 $ 798 $ 3,188 $ 3,681 $ 18,246 Add: Financial expenses (income), net 8,502 6,881 5,662 7,325 6,554 20,163 27,706 Taxes on income (tax benefit) 2,931 2,052 13,054 1,332 1,377 1,373 6,358 Depreciation and amortization 1,606 3,392 4,328 4,284 4,089 5,987 10,476 Share-based compensation 18,438 18,464 18,020 15,754 14,055 68,698 73,942 Earn-out revaluation, acquisition related costs and other 109 1,273 4,240 4,599 5,294 359 5,631 Adjusted EBITDA $ 17,849 $ 19,653 $ 20,710 $ 19,442 $ 21,449 $ 59,217 $ 74,231 Adjusted EBITDA margin 18.9% 19.7% 20.0% 18.1% 19.7% 16.4% 19.0% Audited) FY 2024 Audited) Q2ʼ 24 Q3ʼ 24 Q4ʼ 24 Q1ʼ 25 Q2ʼ 25 FY 2023 Unaudited) Audited) FY 2024 Audited) Q2ʼ 24 Q3ʼ 24 Q4ʼ 24 Q1ʼ 25 Q2ʼ 25 FY 2023 Unaudited) Audited) FY 2024 Audited) Q2ʼ 24 Q3ʼ 24 Q4ʼ 24 Q1ʼ 25 Q2ʼ 25 FY 2023 Unaudited)
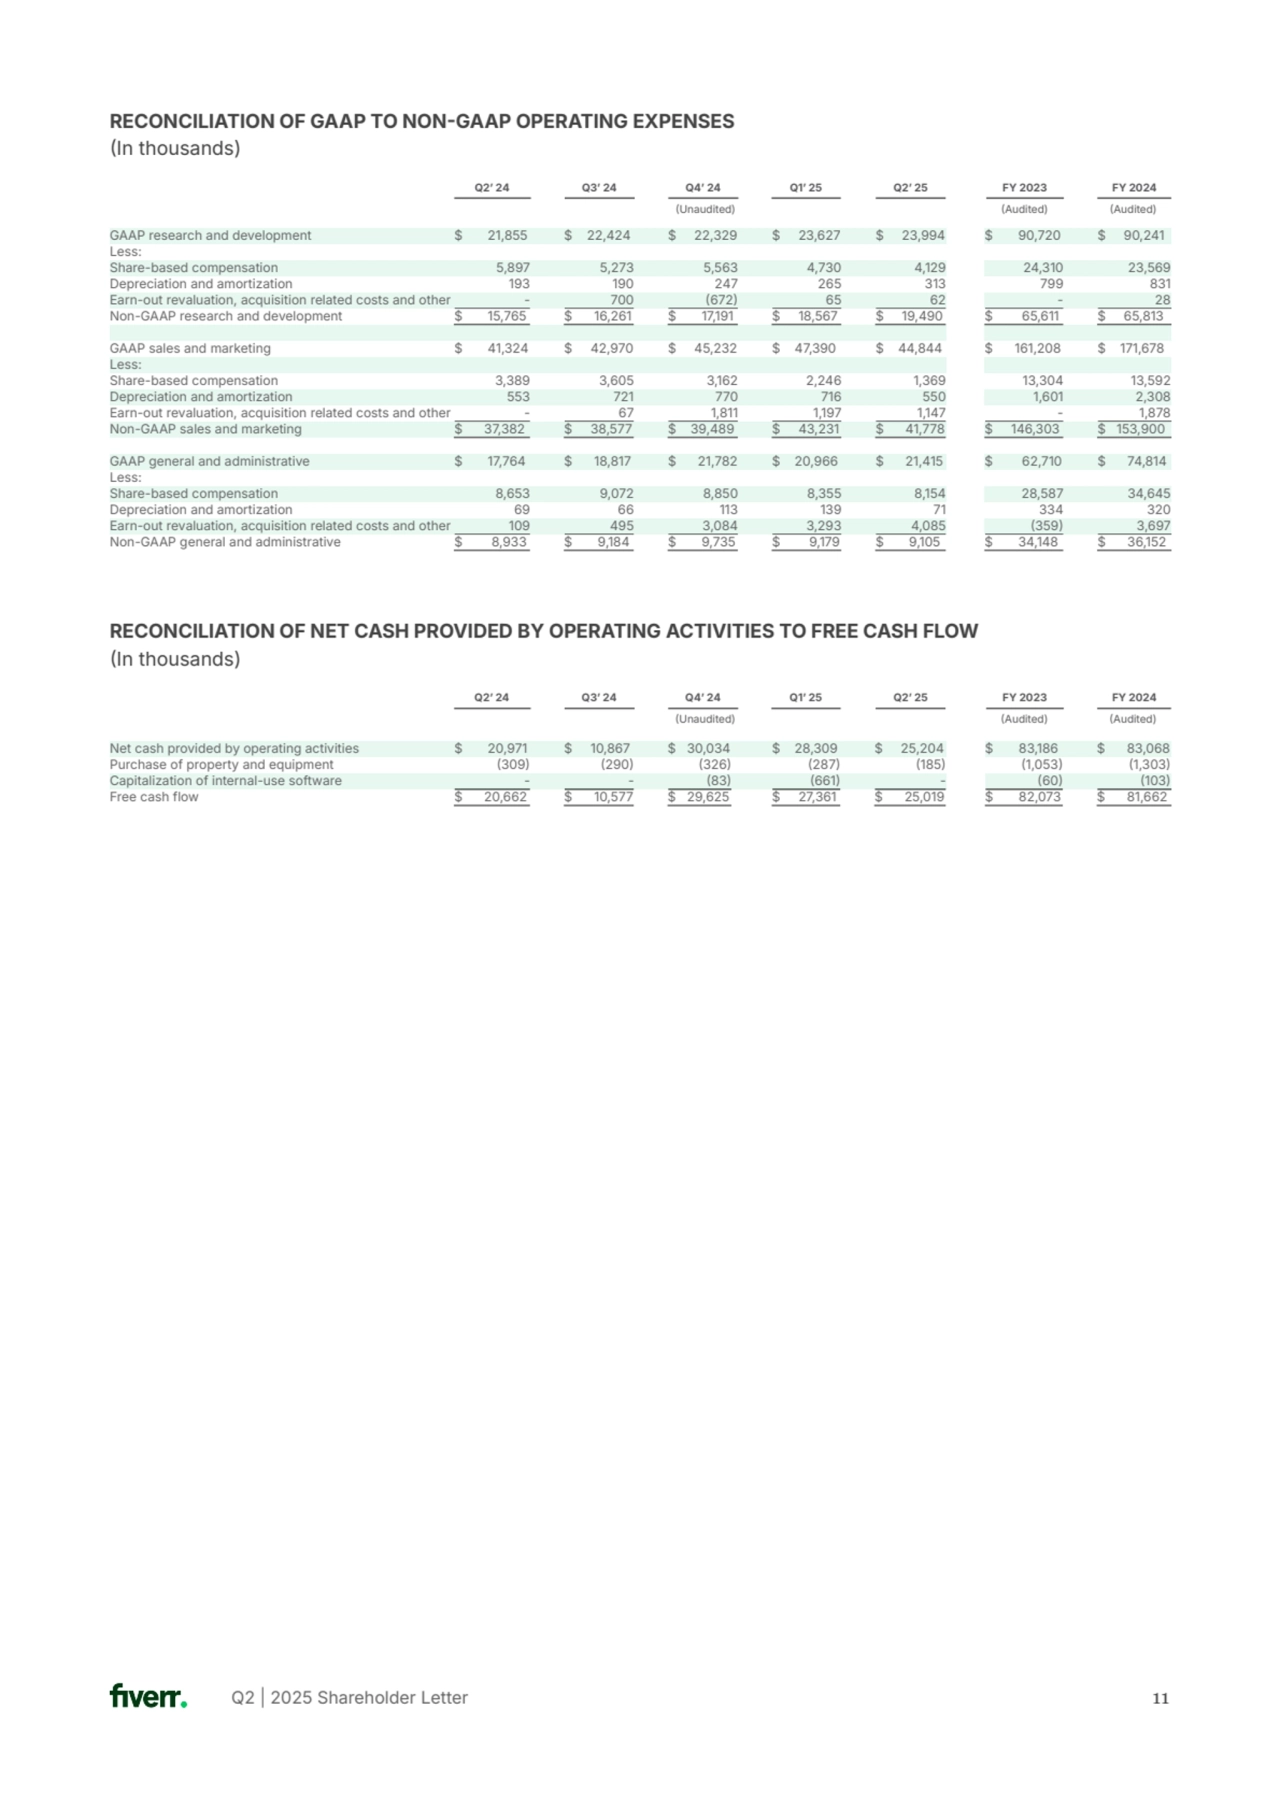
    • 11. Q2 | 2025 Shareholder Letter 11 RECONCILIATION OF GAAP TO NONGAAP OPERATING EXPENSES In thousands) GAAP research and development $ 21,855 $ 22,424 $ 22,329 $ 23,627 $ 23,994 $ 90,720 $ 90,241 Less: Share-based compensation 5,897 5,273 5,563 4,730 4,129 24,310 23,569 Depreciation and amortization 193 190 247 265 313 799 831 Earn-out revaluation, acquisition related costs and other - 700 672 65 62 - 28 Non-GAAP research and development $ 15,765 $ 16,261 $ 17,191 $ 18,567 $ 19,490 $ 65,611 $ 65,813 GAAP sales and marketing $ 41,324 $ 42,970 $ 45,232 $ 47,390 $ 44,844 $ 161,208 $ 171,678 Less: Share-based compensation 3,389 3,605 3,162 2,246 1,369 13,304 13,592 Depreciation and amortization 553 721 770 716 550 1,601 2,308 Earn-out revaluation, acquisition related costs and other - 67 1,811 1,197 1,147 - 1,878 Non-GAAP sales and marketing $ 37,382 $ 38,577 $ 39,489 $ 43,231 $ 41,778 $ 146,303 $ 153,900 GAAP general and administrative $ 17,764 $ 18,817 $ 21,782 $ 20,966 $ 21,415 $ 62,710 $ 74,814 Less: Share-based compensation 8,653 9,072 8,850 8,355 8,154 28,587 34,645 Depreciation and amortization 69 66 113 139 71 334 320 Earn-out revaluation, acquisition related costs and other 109 495 3,084 3,293 4,085 359 3,697 Non-GAAP general and administrative $ 8,933 $ 9,184 $ 9,735 $ 9,179 $ 9,105 $ 34,148 $ 36,152 RECONCILIATION OF NET CASH PROVIDED BY OPERATING ACTIVITIES TO FREE CASH FLOW In thousands) Audited) FY 2024 Audited) Q2ʼ 24 Q3ʼ 24 Q4ʼ 24 Q1ʼ 25 Q2ʼ 25 FY 2023 Unaudited) Net cash provided by operating activities $ 20,971 $ 10,867 $ 30,034 $ 28,309 $ 25,204 $ 83,186 $ 83,068 Purchase of property and equipment 309 290 326 287 185 1,053 1,303 Capitalization of internal-use software - - 83 661 - 60 103 Free cash flow $ 20,662 $ 10,577 $ 29,625 $ 27,361 $ 25,019 $ 82,073 $ 81,662 Audited) FY 2024 Audited) Q2ʼ 24 Q3ʼ 24 Q4ʼ 24 Q1ʼ 25 Q2ʼ 25 FY 2023 Unaudited)
    • 12. Q2 | 2025 Shareholder Letter 12 This shareholder letter includes certain key performance metrics and financial measures not based on GAAP, including Adjusted EBITDA, Adjusted EBITDA margin, non-GAAP gross profit, non-GAAP gross margin, non-GAAP operating expenses, non-GAAP net income (loss), non-GAAP net income (loss) per share and free cash flow, as well as operating metrics, including GMV, annual active buyers, annual spend per buyer and marketplace take rate. Some amounts in this shareholder letter may not total due to rounding. All percentages have been calculated using unrounded amounts. We updated the definitions of annual active buyers, GMV, annual spend per buyer and marketplace take rate to align with additional revenue disclosure, which now distinguishes between marketplace revenue and services revenue. These metrics will now exclusively reflect the marketplace, as amounts related to services previously included in these metrics are deemed immaterial. We define each of our non-GAAP measures of financial performance, as the respective GAAP balances shown in the above tables, adjusted for, as applicable, depreciation and amortization, share-based compensation expenses, contingent consideration revaluation, acquisition related costs and other, income taxes, amortization of discount and issuance costs of convertible note, financial (income) expenses, net. Non-GAAP gross profit margin represents non-GAAP gross profit expressed as a percentage of revenue. We define non-GAAP net income (loss) per share as non-GAAP net income (loss) divided by GAAP weighted-average number of ordinary shares basic and diluted. We use free cash flow as a liquidity measure and define it as a net cash provided by operating activities less capital expenditures. We define GMV or marketplace Gross Merchandise Value as the total value of transactions ordered through our marketplace, excluding value added tax, goods and services tax, service chargebacks and refunds. Annual active buyers on any given date is defined as buyers who have ordered a Gig on our marketplace within the last 12-month period, irrespective of cancellations. Annual spend per buyer on any given date is calculated by dividing our GMV within the last 12-month period by the number of annual active buyers as of such date. Marketplace take rate for a given period means marketplace revenue for such period divided by GMV for such period. When we refer in this shareholder letter to the marketplace we refer to transactions conducted between buyers and freelancers on Fiverr.com. When we refer to the platform we refer to the marketplace and our additional services. Management and our board of directors use certain metrics as supplemental measures of our performance that is not required by, or presented in accordance with GAAP because they assist us in comparing our operating performance on a consistent basis, as they remove the impact of items not directly resulting from our core operations. We also use these metrics for planning purposes, including the preparation of our internal annual operating budget and financial projections, to evaluate the performance and effectiveness of our strategic initiatives and capital expenditures and to evaluate our capacity to expand our business. In addition, we believe that free cash flow, which we use as a liquidity measure, is useful in evaluating our business because free cash flow reflects the cash surplus available or used to fund the expansion of our business after the payment of capital expenditures relating to the necessary components of ongoing operations. Capital expenditures consist primarily of property and equipment purchases and capitalized software costs. Free cash flow should not be used as an alternative to, or superior to, cash from operating activities. In addition, Adjusted EBITDA, Adjusted EBITDA margin, non-GAAP gross profit, non-GAAP gross margin, non-GAAP operating expenses, non-GAAP net income (loss) and non-GAAP net income (loss) per share as well as operating metrics, including GMV, annual active buyers, annual spend per buyer, marketplace take rate and tROI should not be considered in isolation, as an alternative to, or superior to net income (loss), revenue, cash flows or other performance measure derived in accordance with GAAP. These metrics are frequently used by analysts, investors and other interested parties to evaluate companies in our industry. Key Performance Metrics and Non-GAAP Financial Measures
    • 13. Q2 | 2025 Shareholder Letter 13 Management believes that the presentation of non-GAAP metrics is an appropriate measure of operating performance because they eliminate the impact of expenses that do not relate directly to the performance of our underlying business. These non-GAAP metrics should not be construed as an inference that our future results will be unaffected by unusual or other items. Additionally, Adjusted EBITDA and other non-GAAP metrics used herein are not intended to be a measure of free cash flow for managementʼs discretionary use, as they do not reflect our tax payments and certain other cash costs that may recur in the future, including, among other things, cash requirements for costs to replace assets being depreciated and amortized. Management compensates for these limitations by relying on our GAAP results in addition to using Adjusted EBITDA and other non-GAAP metrics as supplemental measures of our performance. Our measure of Adjusted EBITDA, free cash flow and other non-GAAP metrics used herein is not necessarily comparable to similarly titled captions of other companies due to different methods of calculation. See the tables above regarding reconciliations of these non-GAAP financial measures to the most directly comparable GAAP measures. We are not able to provide a reconciliation of Adjusted EBITDA and Adjusted EBITDA margin guidance for the third quarter of 2025 and the fiscal year ending December 31, 2025, and long term to net income (loss), the nearest comparable GAAP measure, because certain items that are excluded from Adjusted EBITDA and Adjusted EBITDA margin cannot be reasonably predicted or are not in our control. We are also not able to provide a reconciliation of free cash flow guidance for the three year period from 20242027 to cash from operating activities, the nearest comparable GAAP measure, because certain items that are reflected in free cash flow cannot be reasonably predicted or are not in our control. In particular, in the case of Adjusted EBITDA and Adjusted EBITDA margin, we are unable to forecast the timing or magnitude of share based compensation, amortization of intangible assets, impairment of intangible assets, income or loss on revaluation of contingent consideration, other acquisition-related costs, convertible notes amortization of discount and issuance costs and exchange rate income or loss, and in the case of free cash flow, we are unable to forecast property and equipment purchases and capitalized software costs, in each case, as applicable without unreasonable efforts, and these items could significantly impact, either individually or in the aggregate, GAAP measures in the future. Forward Looking Statements This shareholder letter contains forward-looking statements within the meaning of the Private Securities Litigation Reform Act of 1995. All statements contained in this shareholder letter that do not relate to matters of historical fact should be considered forward-looking statements, including, without limitation, statements regarding our expected financial performance and operational performance, our business plans and strategy, the growth of our business, AI services and developments, our product portfolio, our customer relationships and experiences, the expected completion of some of our projects as well as statements that include the words “expect,ˮ “intend,ˮ “plan,ˮ “believe,ˮ “project,ˮ “forecast,ˮ “estimate,ˮ “may,ˮ “should,ˮ “anticipateˮ and similar statements of a future or forward-looking nature. These forward-looking statements are based on managementʼs current expectations. These statements are neither promises nor guarantees, but involve known and unknown risks, uncertainties and other important factors that may cause actual results, performance or achievements to be materially different from any future results, performance or achievements expressed or implied by the forward-looking statements, including, but not limited to: our ability to successfully implement our business plan within adverse economic conditions that may impact consumers, business spending and the demand for our services or have a material adverse impact on our business, financial condition and results of operations; our ability to attract and retain a large community of buyers
    • 14. Q2 | 2025 Shareholder Letter and freelancers; our ability to generate sufficient revenue to maintain profitability and our net cash flow generated by operating activities; our ability to maintain and enhance our brand; our dependence on the continued growth and expansion of the market for freelancers and the services they offer; our dependence on traffic to our website; our ability to maintain user engagement on our website and to maintain and improve the quality of our platform; our operations within a competitive market; political, economic and military instability in Israel, including related to the war in Israel; our ability and the ability of third parties to protect our usersʼ personal or other data from a security breach and to comply with laws and regulations relating to data privacy, data protection and cybersecurity; our ability to manage our current and potential future growth; our dependence on decisions and developments in the mobile device industry, over which we do not have control; our ability to detect errors, defects or disruptions in our platform; our ability to comply with the terms of underlying licenses of open source software components on our platform; our ability to expand into markets outside the United States and our ability to manage the business and economic risks of international expansion and operations; our ability to achieve desired operating margins; our ability to comply with a wide variety of U.S. and international laws and regulations, including with regulatory frameworks around the development and use of AI; our ability to attract, recruit, retain and develop qualified employees; our reliance on Amazon Web Services; our ability to mitigate payment and fraud risks; our dependence on relationships with payment partners, banks and disbursement partners; and the other important factors discussed under the caption “Risk Factorsˮ in our annual report on Form 20F filed with the U.S. Securities and Exchange Commission (“SECˮ) on February 19, 2025 as such factors may be updated from time to time in our other filings with the SEC, which are accessible on the SECʼs website at www.sec.gov. In addition, we operate in a very competitive and rapidly changing environment. New risks emerge from time to time. It is not possible for our management to predict all risks, nor can we assess the impact of all factors on our business or the extent to which any factor, or combination of factors, may cause actual results to differ materially from those contained in any forward-looking statements that we may make. In light of these risks, uncertainties and assumptions, the forward-looking events and circumstances discussed in this shareholder letter are inherently uncertain and may not occur, and actual results could differ materially and adversely from those anticipated or implied in the forward-looking statements. Accordingly, you should not rely upon forward-looking statements as predictions of future events. In addition, the forward-looking statements made in this shareholder letter relate only to events or information as of the date on which the statements are made in this shareholder letter. Except as required by law, we undertake no obligation to update or revise publicly any forward-looking statements, whether as a result of new information, future events or otherwise, after the date on which the statements are made or to reflect the occurrence of unanticipated events. 14


    • Previous
    • Next
    • f Fullscreen
    • esc Exit Fullscreen