Rockwell Automation: Q3 Fiscal 2025 Earnings
 AI Summary
Key Insights
- 📊 Q3 FY25 Results: Book-to-bill consistent, sales up 5% YOY, and Total Annual Recurring Revenue (ARR) up 7% YOY.
- 🏭 Segment Performance: Discrete segment up ~10%, while Hybrid and Process segments showed varying growth.
- 🌎 Organic Sales Growth: North America leads with 7%, expected to be strongest region in FY25.
- 📈 Full Year Outlook: Updating sales growth to (2)% to 1% YOY; Adjusted EPS range to $9.80 - $10.20.
- 💰 Key Financials: Q3 FY25 sales at $2,144 million, segment operating margin at 21.2%, and Adjusted EPS at $2.82.


Rockwell Automation: Q3 Fiscal 2025 Earnings
- 1. PUBLIC Q3 Fiscal 2025 Earnings Presentation August 6, 2025 1
- 2. PUBLIC | Copyright ©2025 Rockwell Automation, Inc. | 2 This presentation includes statements related to the expected future results of the company and are therefore forward-looking statements. Actual results may differ materially from those projections due to a wide range of risks and uncertainties, including those that are listed in our SEC filings. This presentation also contains non-GAAP financial information and reconciliations to GAAP are included in the appendix. All information should be read in conjunction with our historical financial statements.
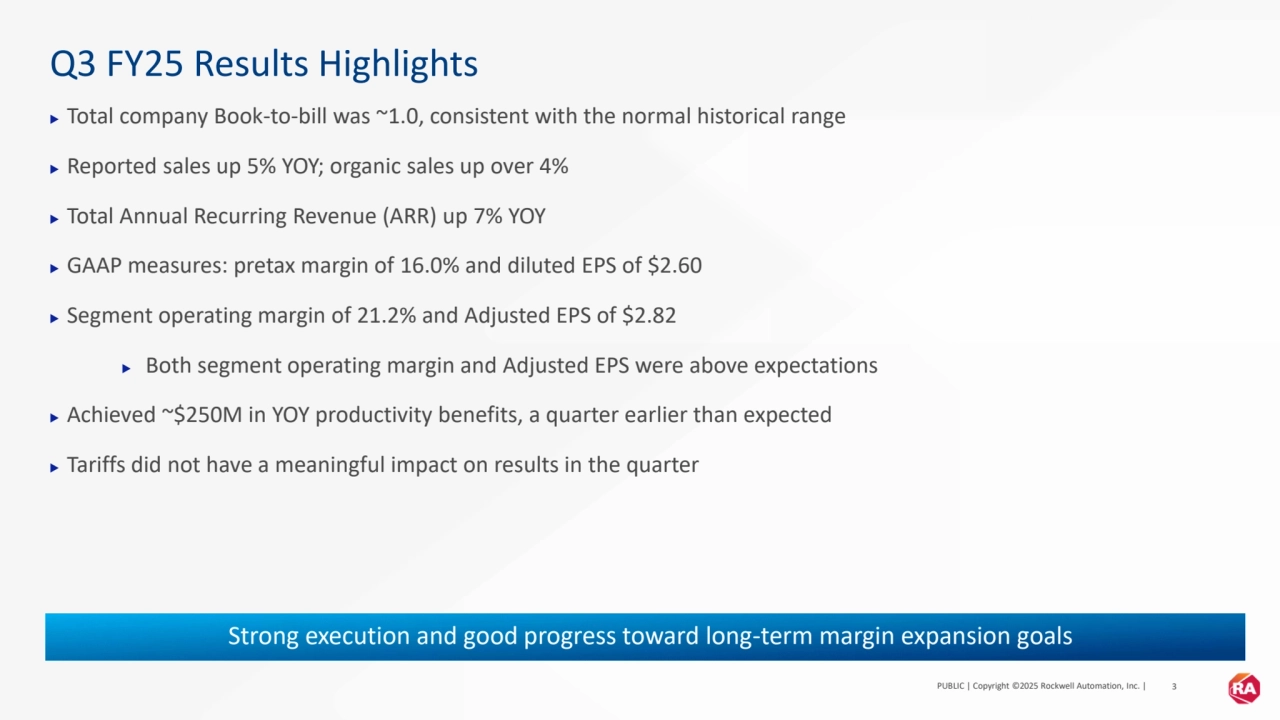
- 3. PUBLIC | Copyright ©2025 Rockwell Automation, Inc. | 3 Q3 FY25 Results Highlights ▶ Total company Book-to-bill was ~1.0, consistent with the normal historical range ▶ Reported sales up 5% YOY; organic sales up over 4% ▶ Total Annual Recurring Revenue (ARR) up 7% YOY ▶ GAAP measures: pretax margin of 16.0% and diluted EPS of $2.60 ▶ Segment operating margin of 21.2% and Adjusted EPS of $2.82 ▶ Both segment operating margin and Adjusted EPS were above expectations ▶ Achieved ~$250M in YOY productivity benefits, a quarter earlier than expected ▶ Tariffs did not have a meaningful impact on results in the quarter Strong execution and good progress toward long-term margin expansion goals
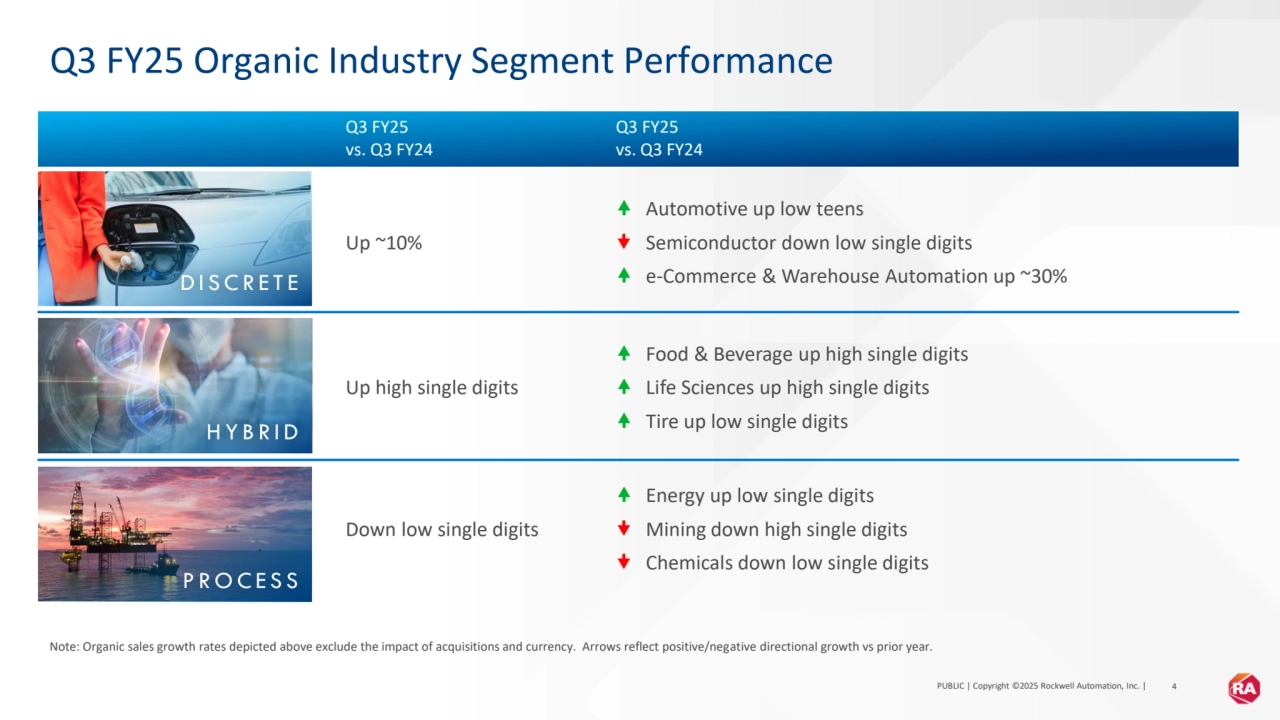
- 4. PUBLIC | Copyright ©2025 Rockwell Automation, Inc. | 4 Q3 FY25 Organic Industry Segment Performance Note: Organic sales growth rates depicted above exclude the impact of acquisitions and currency. Arrows reflect positive/negative directional growth vs prior year. D I S C R E T E H Y B R I D P R O C E S S Q3 FY25 vs. Q3 FY24 Q3 FY25 vs. Q3 FY24 Up ~10% Automotive up low teens Semiconductor down low single digits e-Commerce & Warehouse Automation up ~30% Up high single digits Food & Beverage up high single digits Life Sciences up high single digits Tire up low single digits Down low single digits Energy up low single digits Mining down high single digits Chemicals down low single digits
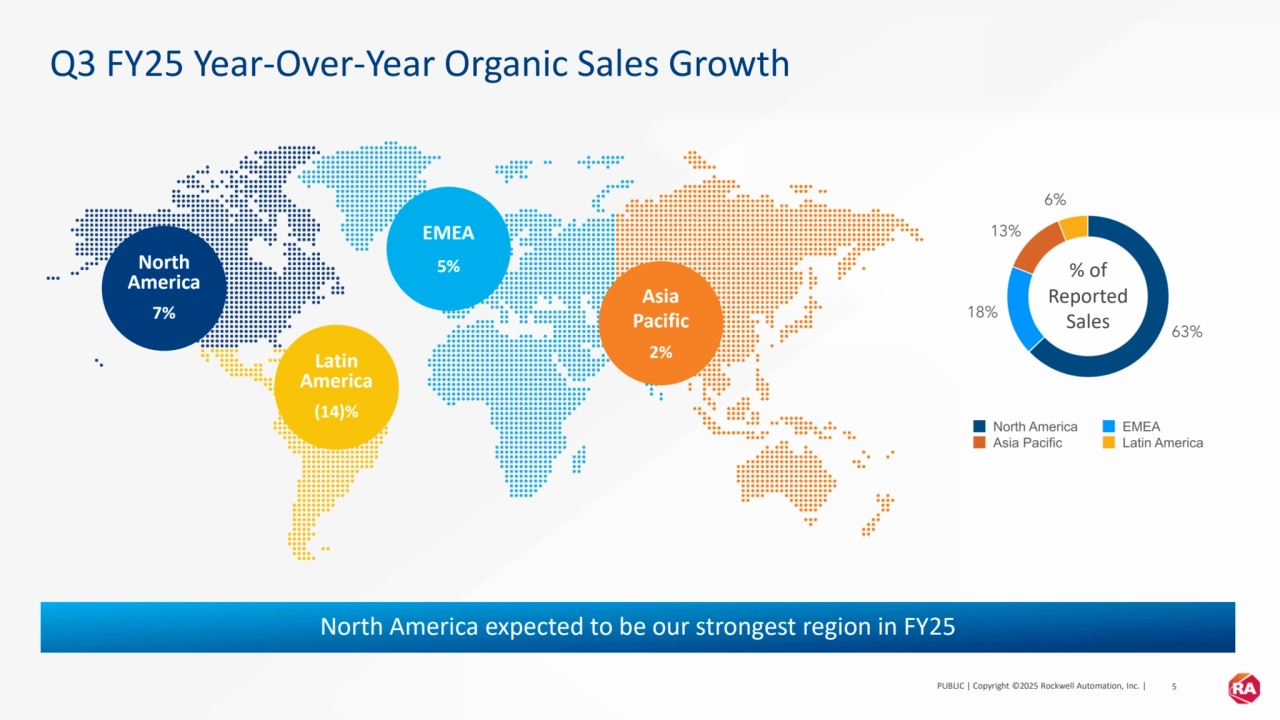
- 5. PUBLIC | Copyright ©2025 Rockwell Automation, Inc. | 5 Q3 FY25 Year-Over-Year Organic Sales Growth Latin America (14)% EMEA 5% Asia Pacific 2% North America 7% % of Reported Sales North America expected to be our strongest region in FY25
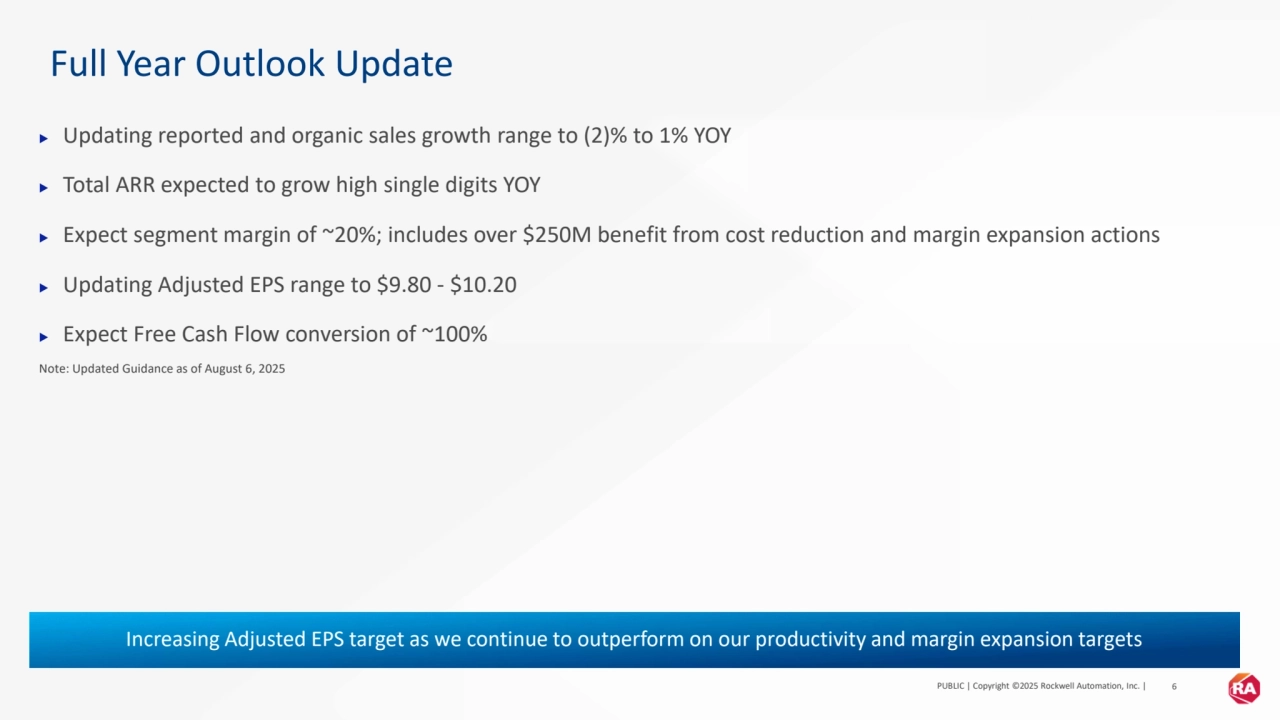
- 6. PUBLIC | Copyright ©2025 Rockwell Automation, Inc. | 6 Full Year Outlook Update ▶ Updating reported and organic sales growth range to (2)% to 1% YOY ▶ Total ARR expected to grow high single digits YOY ▶ Expect segment margin of ~20%; includes over $250M benefit from cost reduction and margin expansion actions ▶ Updating Adjusted EPS range to $9.80 - $10.20 ▶ Expect Free Cash Flow conversion of ~100% Note: Updated Guidance as of August 6, 2025 Increasing Adjusted EPS target as we continue to outperform on our productivity and margin expansion targets
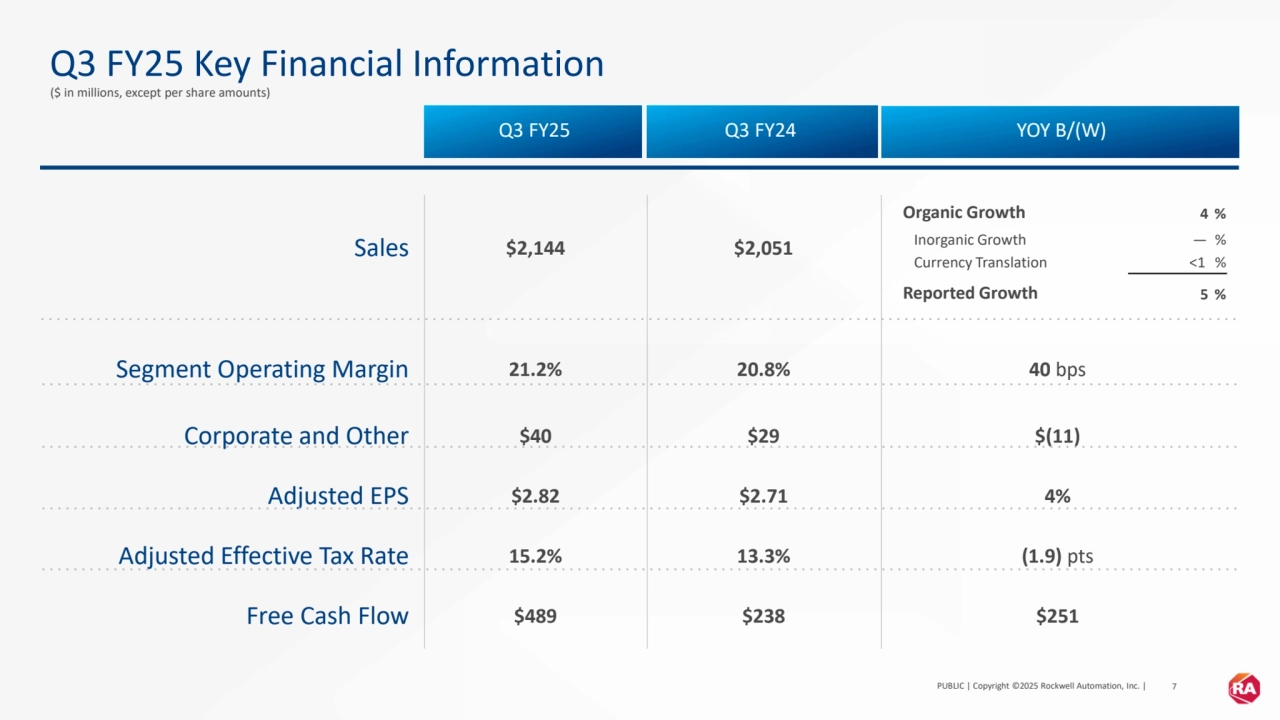
- 7. PUBLIC | Copyright ©2025 Rockwell Automation, Inc. | 7 Q3 FY25 Key Financial Information ($ in millions, except per share amounts) Sales $2,144 $2,051 Segment Operating Margin 21.2% 20.8% 40 bps Corporate and Other $40 $29 $(11) Adjusted EPS $2.82 $2.71 4% Adjusted Effective Tax Rate 15.2% 13.3% (1.9) pts Free Cash Flow $489 $238 $251 Organic Growth 4 % Inorganic Growth — % Currency Translation <1 % Reported Growth 5 % Q3 FY25 Q3 FY24 YOY B/(W)
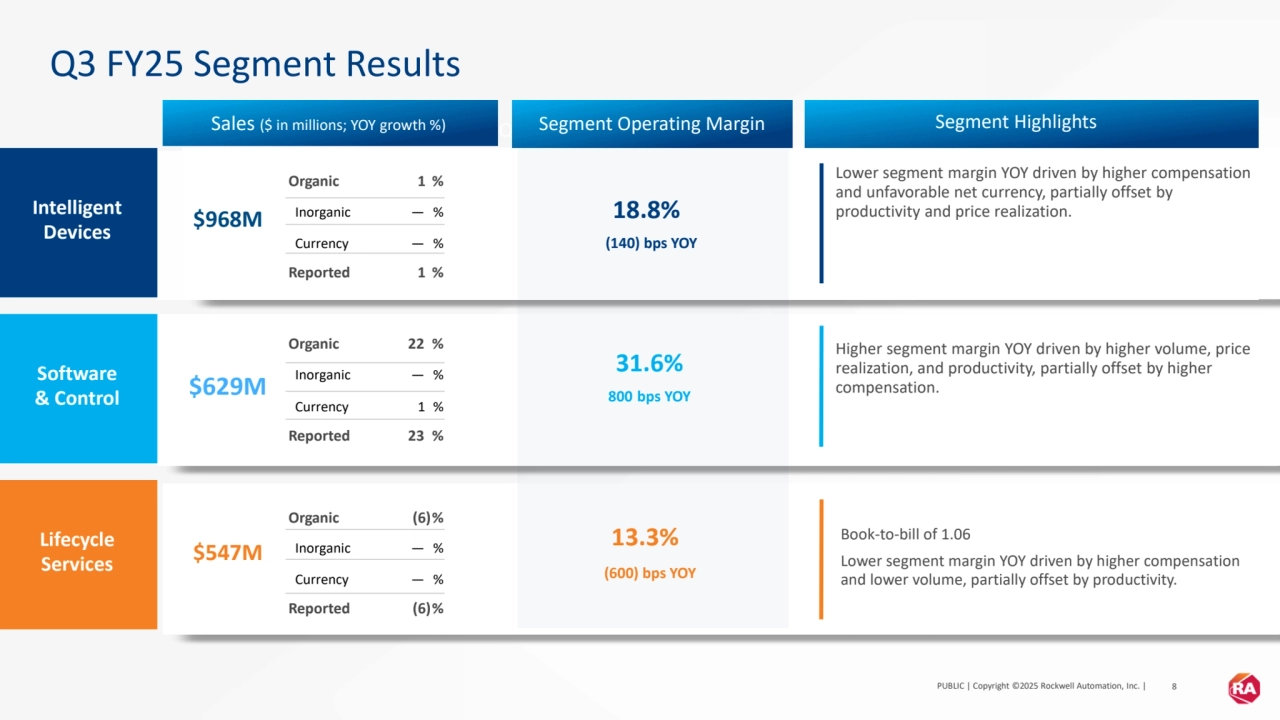
- 8. PUBLIC | Copyright ©2025 Rockwell Automation, Inc. | 8 Organic (6)% Inorganic — % Currency — % Reported (6)% $968M Organic 1 % Inorganic — % Currency — % Reported 1 % Lifecycle Services Software & Control Intelligent Devices Q3 FY25 Segment Results $629M $547M 31.6% 800 bps YOY 18.8% (140) bps YOY 13.3% (600) bps YOY Book-to-bill of 1.06 Lower segment margin YOY driven by higher compensation and lower volume, partially offset by productivity. Higher segment margin YOY driven by higher volume, price realization, and productivity, partially offset by higher compensation. Lower segment margin YOY driven by higher compensation and unfavorable net currency, partially offset by productivity and price realization. Organic 22 % Inorganic — % Currency 1 % Reported 23 % Q1 FY23 Sales ($ in millions; YOY growth %) Segment Operating Margin Segment Highlights
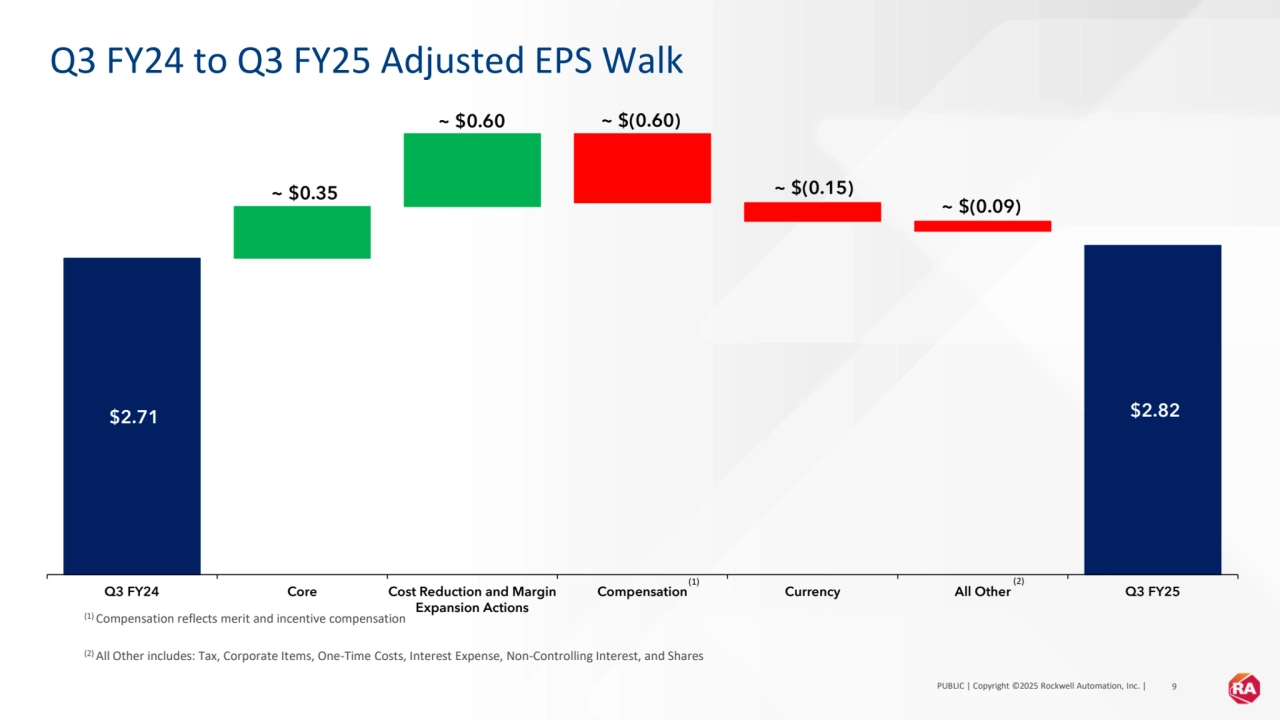
- 9. PUBLIC | Copyright ©2025 Rockwell Automation, Inc. | 9 Q3 FY24 to Q3 FY25 Adjusted EPS Walk (1) Compensation reflects merit and incentive compensation (2) All Other includes: Tax, Corporate Items, One-Time Costs, Interest Expense, Non-Controlling Interest, and Shares $2.71 $2.82 ~ $0.35 ~ $0.60 ~ $(0.60) ~ $(0.15) ~ $(0.09) Q3 FY24 Core Cost Reduction and Margin Expansion Actions Compensation Currency All Other Q3 FY25 (1) (2)
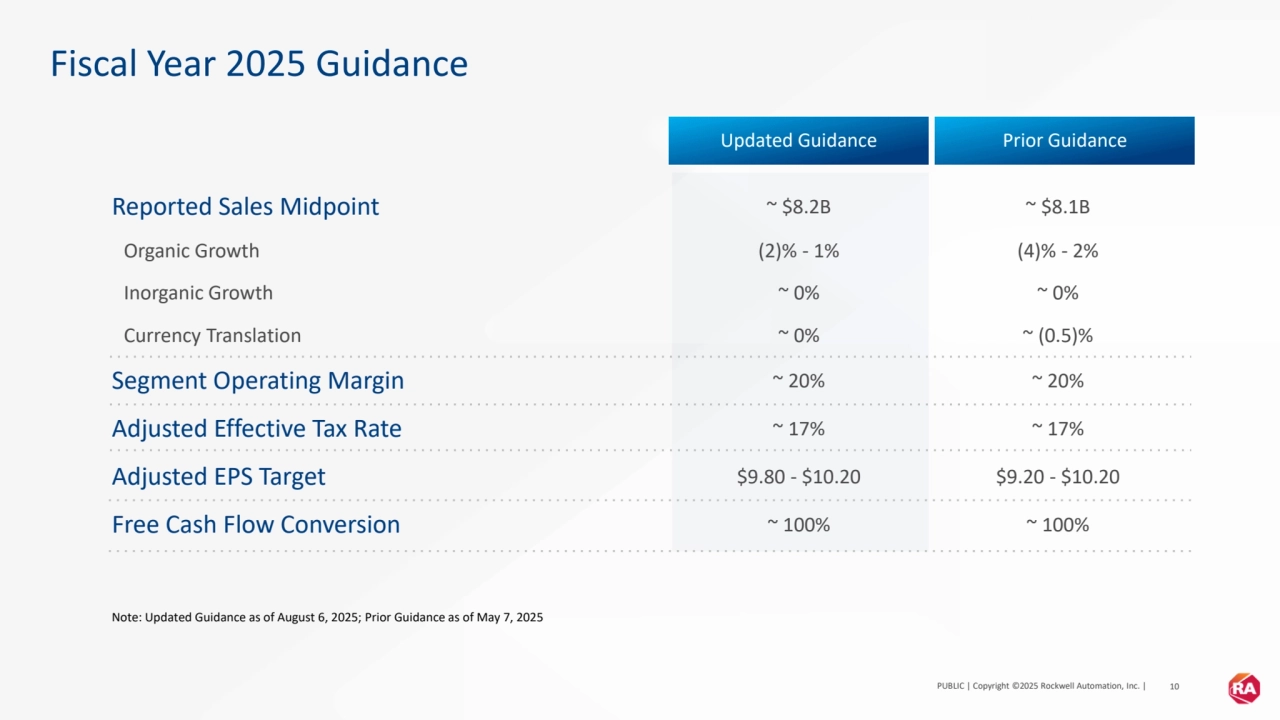
- 10. PUBLIC | Copyright ©2025 Rockwell Automation, Inc. | 10 Fiscal Year 2025 Guidance Reported Sales Midpoint ~ $8.2B ~ $8.1B Organic Growth (2)% - 1% (4)% - 2% Inorganic Growth ~ 0% ~ 0% Currency Translation ~ 0% ~ (0.5)% Segment Operating Margin ~ 20% ~ 20% Adjusted Effective Tax Rate ~ 17% ~ 17% Adjusted EPS Target $9.80 - $10.20 $9.20 - $10.20 Free Cash Flow Conversion ~ 100% ~ 100% Note: Updated Guidance as of August 6, 2025; Prior Guidance as of May 7, 2025 Updated Guidance Prior Guidance
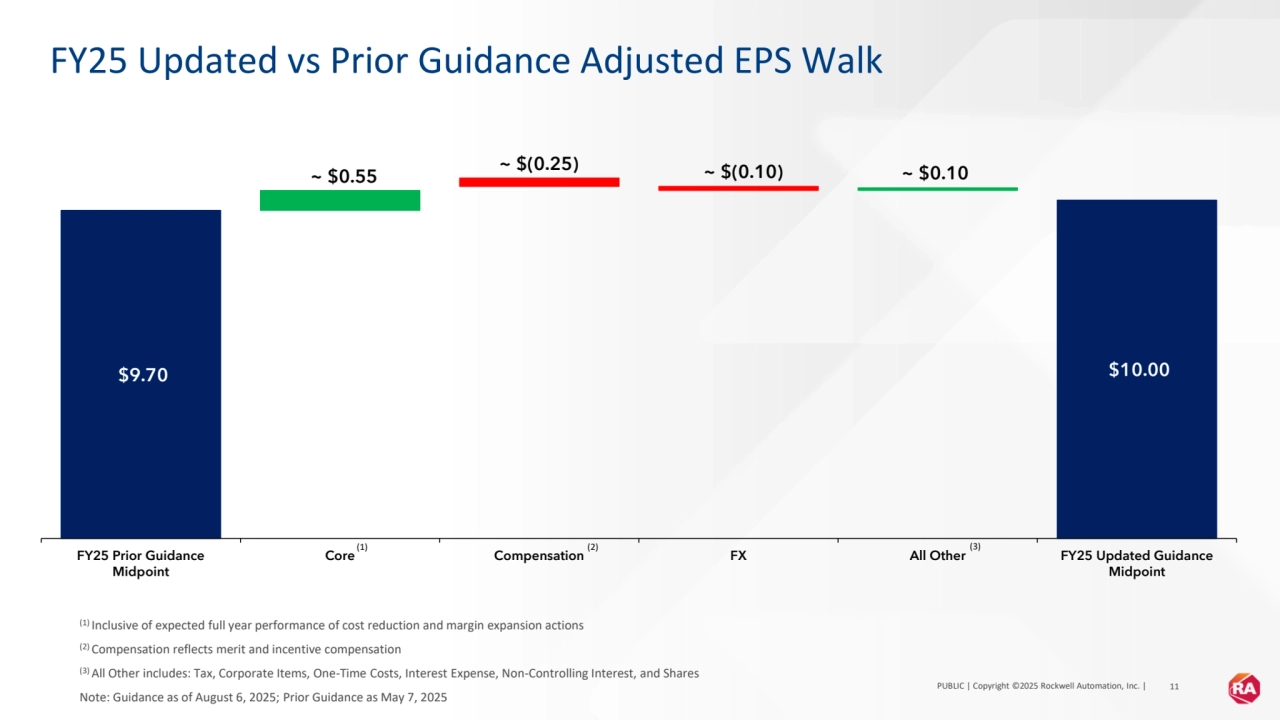
- 11. PUBLIC | Copyright ©2025 Rockwell Automation, Inc. | 11 FY25 Updated vs Prior Guidance Adjusted EPS Walk (1) Inclusive of expected full year performance of cost reduction and margin expansion actions (2) Compensation reflects merit and incentive compensation (3) All Other includes: Tax, Corporate Items, One-Time Costs, Interest Expense, Non-Controlling Interest, and Shares Note: Guidance as of August 6, 2025; Prior Guidance as May 7, 2025 $9.70 $10.00 ~ $0.55 ~ $(0.25) ~ $(0.10) ~ $0.10 FY25 Prior Guidance Midpoint Core Compensation FX All Other FY25 Updated Guidance Midpoint (1) (2) (3)
- 12. PUBLIC | Copyright ©2025 Rockwell Automation, Inc. | 12 Appendix
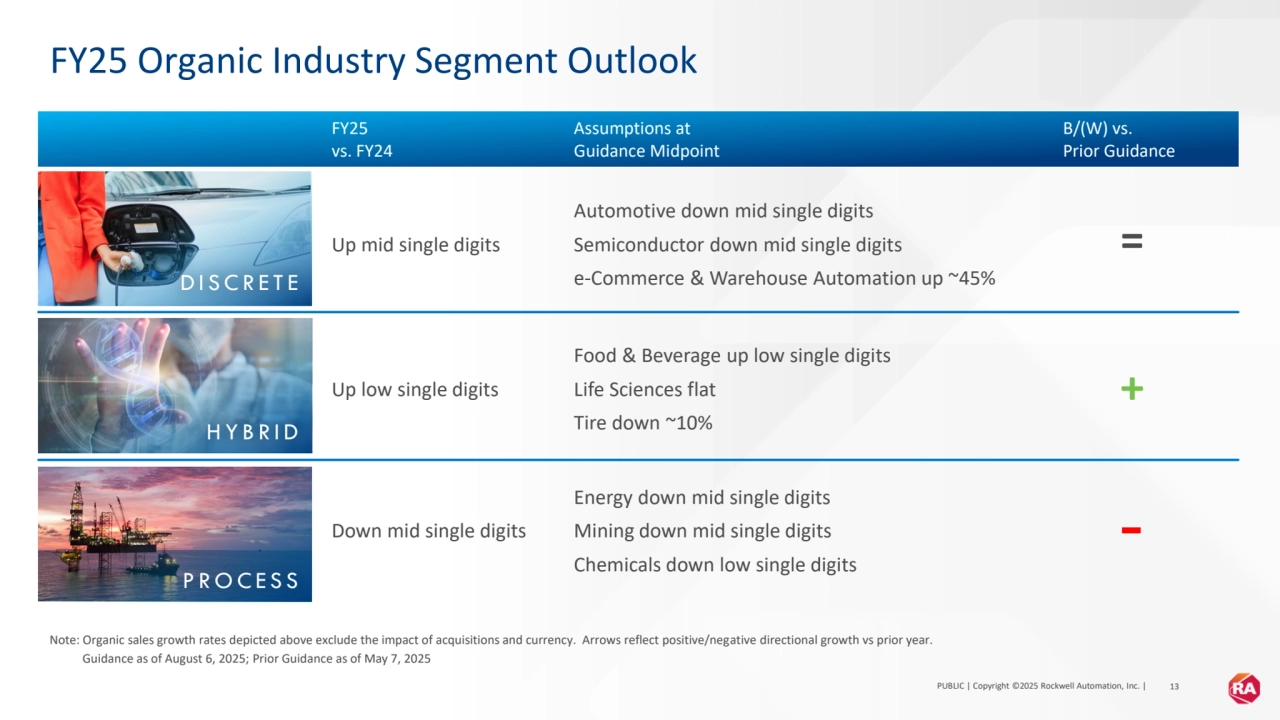
- 13. PUBLIC | Copyright ©2025 Rockwell Automation, Inc. | 13 FY25 vs. FY24 Assumptions at Guidance Midpoint B/(W) vs. Prior Guidance Up mid single digits Automotive down mid single digits Semiconductor down mid single digits e-Commerce & Warehouse Automation up ~45% Up low single digits Food & Beverage up low single digits Life Sciences flat Tire down ~10% Down mid single digits Energy down mid single digits Mining down mid single digits Chemicals down low single digits FY25 Organic Industry Segment Outlook Note: Organic sales growth rates depicted above exclude the impact of acquisitions and currency. Arrows reflect positive/negative directional growth vs prior year. Guidance as of August 6, 2025; Prior Guidance as of May 7, 2025 D I S C R E T E H Y B R I D P R O C E S S = +
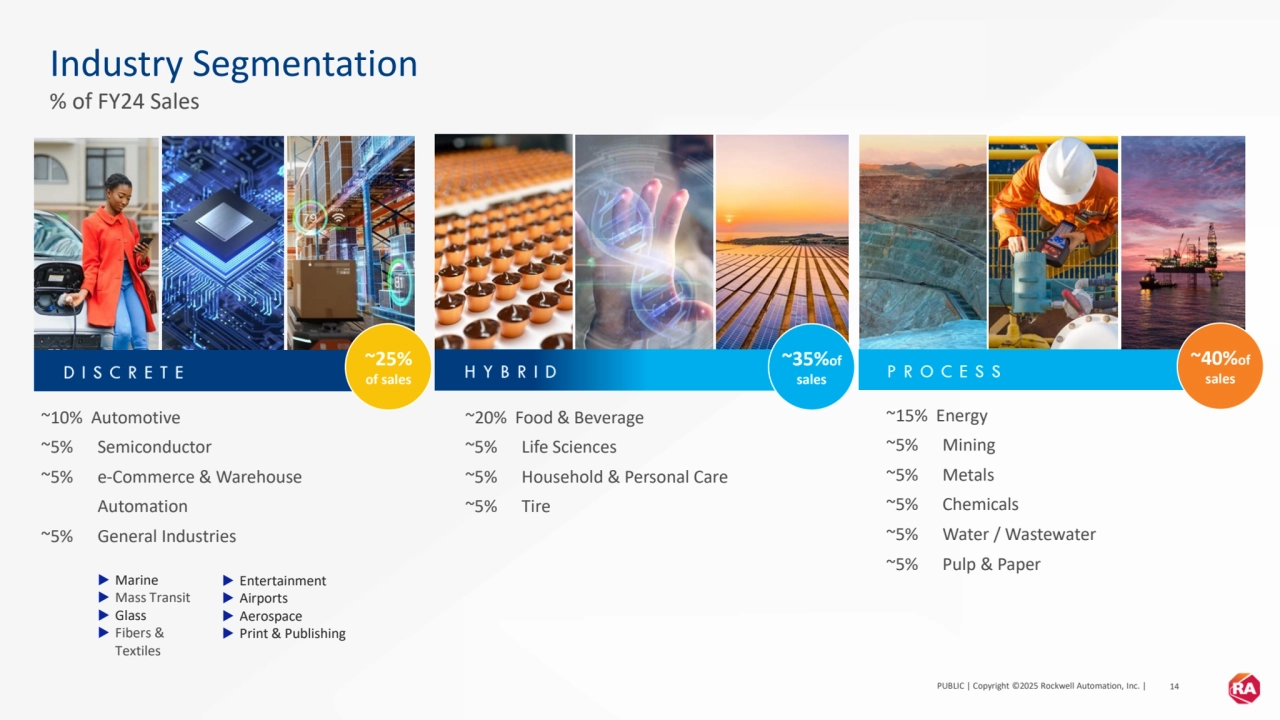
- 14. PUBLIC | Copyright ©2025 Rockwell Automation, Inc. | 14 Industry Segmentation % of FY24 Sales ~10% Automotive ~5% Semiconductor ~5% e-Commerce & Warehouse Automation ~5% General Industries ~20% Food & Beverage ~5% Life Sciences ~5% Household & Personal Care ~5% Tire ~15% Energy ~5% Mining ~5% Metals ~5% Chemicals ~5% Water / Wastewater ~5% Pulp & Paper ▶ Marine ▶ Mass Transit ▶ Glass ▶ Fibers & Textiles ▶ Entertainment ▶ Airports ▶ Aerospace ▶ Print & Publishing ~25% of sales ~35%of sales ~40%of sales
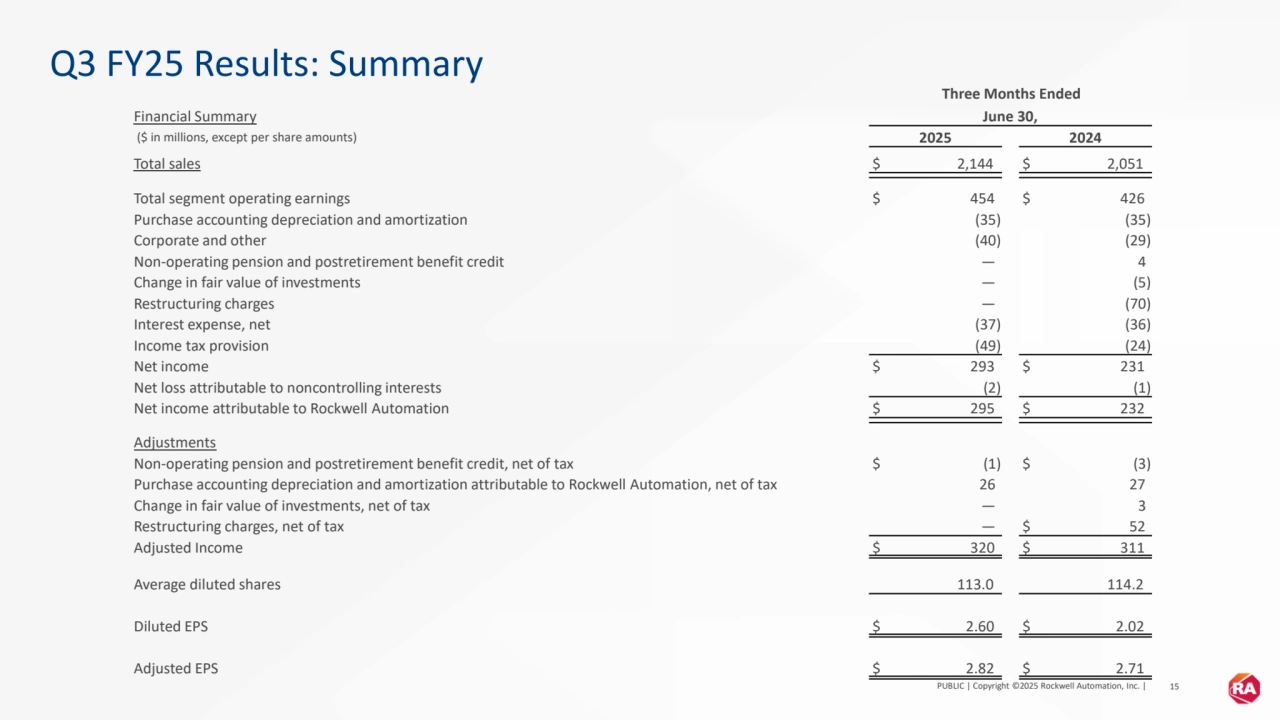
- 15. PUBLIC | Copyright ©2025 Rockwell Automation, Inc. | 15 Q3 FY25 Results: Summary Three Months Ended Financial Summary June 30, ($ in millions, except per share amounts) 2025 2024 Total sales $ 2,144 $ 2,051 Total segment operating earnings $ 454 $ 426 Purchase accounting depreciation and amortization (35) (35) Corporate and other (40) (29) Non-operating pension and postretirement benefit credit — 4 Change in fair value of investments — (5) Restructuring charges — (70) Interest expense, net (37) (36) Income tax provision (49) (24) Net income $ 293 $ 231 Net loss attributable to noncontrolling interests (2) (1) Net income attributable to Rockwell Automation $ 295 $ 232 Adjustments Non-operating pension and postretirement benefit credit, net of tax $ (1) $ (3) Purchase accounting depreciation and amortization attributable to Rockwell Automation, net of tax 26 27 Change in fair value of investments, net of tax — 3 Restructuring charges, net of tax — $ 52 Adjusted Income $ 320 $ 311 Average diluted shares 113.0 114.2 Diluted EPS $ 2.60 $ 2.02 Adjusted EPS $ 2.82 $ 2.71
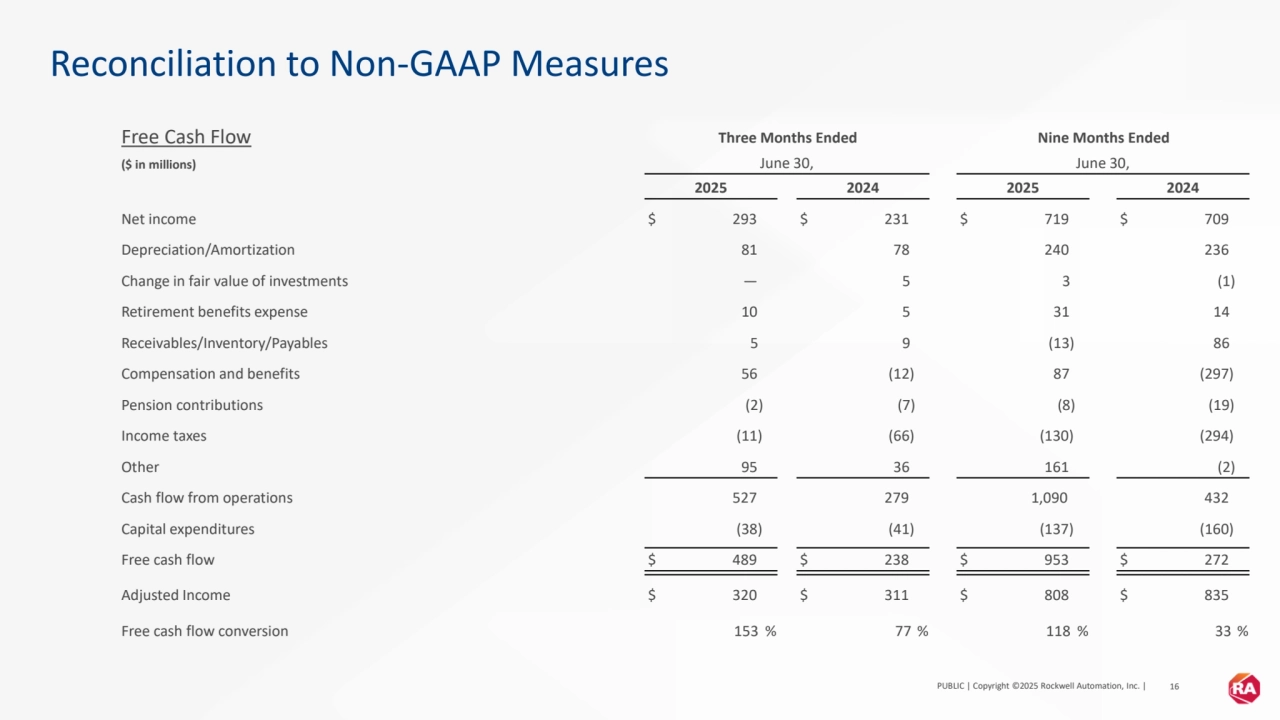
- 16. PUBLIC | Copyright ©2025 Rockwell Automation, Inc. | 16 Reconciliation to Non-GAAP Measures Free Cash Flow Three Months Ended Nine Months Ended ($ in millions) June 30, June 30, 2025 2024 2025 2024 Net income $ 293 $ 231 $ 719 $ 709 Depreciation/Amortization 81 78 240 236 Change in fair value of investments — 5 3 (1) Retirement benefits expense 10 5 31 14 Receivables/Inventory/Payables 5 9 (13) 86 Compensation and benefits 56 (12) 87 (297) Pension contributions (2) (7) (8) (19) Income taxes (11) (66) (130) (294) Other 95 36 161 (2) Cash flow from operations 527 279 1,090 432 Capital expenditures (38) (41) (137) (160) Free cash flow $ 489 $ 238 $ 953 $ 272 Adjusted Income $ 320 $ 311 $ 808 $ 835 Free cash flow conversion 153 % 77 % 118 % 33 %
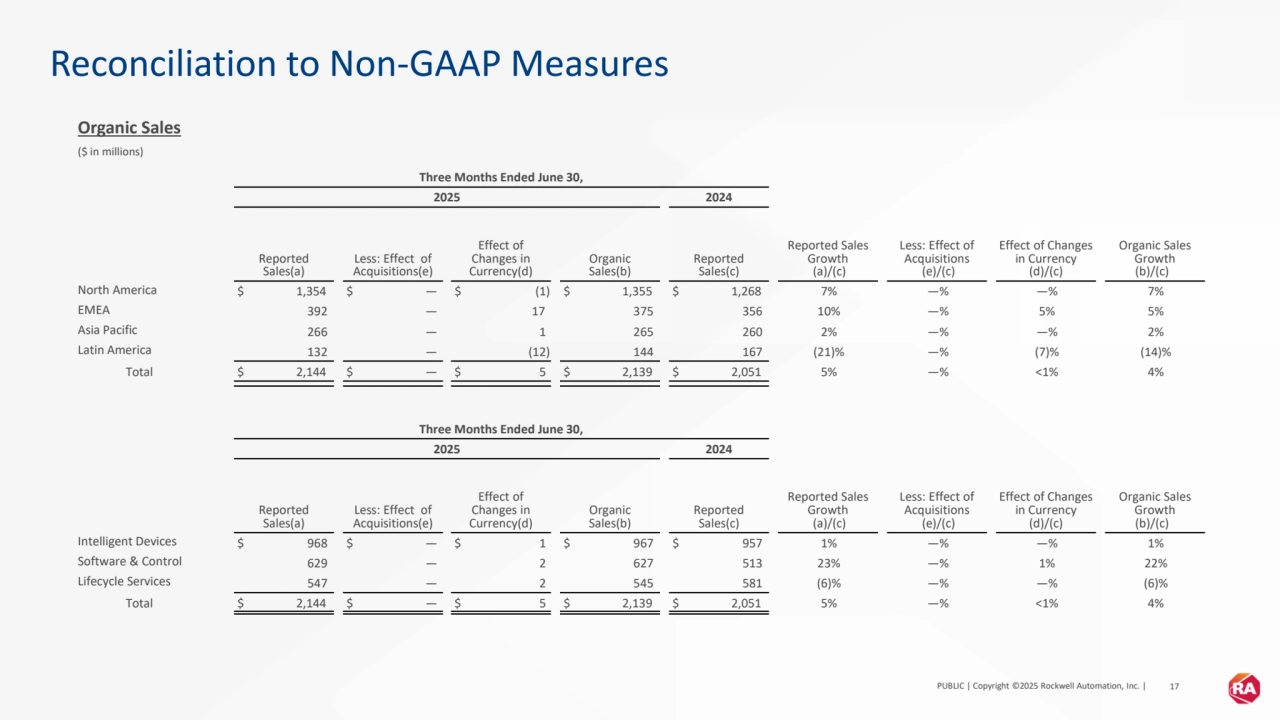
- 17. PUBLIC | Copyright ©2025 Rockwell Automation, Inc. | 17 Reconciliation to Non-GAAP Measures Organic Sales ($ in millions) Three Months Ended June 30, 2025 2024 Reported Sales(a) Less: Effect of Acquisitions(e) Effect of Changes in Currency(d) Organic Sales(b) Reported Sales(c) Reported Sales Growth (a)/(c) Less: Effect of Acquisitions (e)/(c) Effect of Changes in Currency (d)/(c) Organic Sales Growth (b)/(c) North America $ 1,354 $ — $ (1) $ 1,355 $ 1,268 7% —% —% 7% EMEA 392 — 17 375 356 10% —% 5% 5% Asia Pacific 266 — 1 265 260 2% —% —% 2% Latin America 132 — (12) 144 167 (21)% —% (7)% (14)% Total $ 2,144 $ — $ 5 $ 2,139 $ 2,051 5% —% <1% 4% Three Months Ended June 30, 2025 2024 Reported Sales(a) Less: Effect of Acquisitions(e) Effect of Changes in Currency(d) Organic Sales(b) Reported Sales(c) Reported Sales Growth (a)/(c) Less: Effect of Acquisitions (e)/(c) Effect of Changes in Currency (d)/(c) Organic Sales Growth (b)/(c) Intelligent Devices $ 968 $ — $ 1 $ 967 $ 957 1% —% —% 1% Software & Control 629 — 2 627 513 23% —% 1% 22% Lifecycle Services 547 — 2 545 581 (6)% —% —% (6)% Total $ 2,144 $ — $ 5 $ 2,139 $ 2,051 5% —% <1% 4%
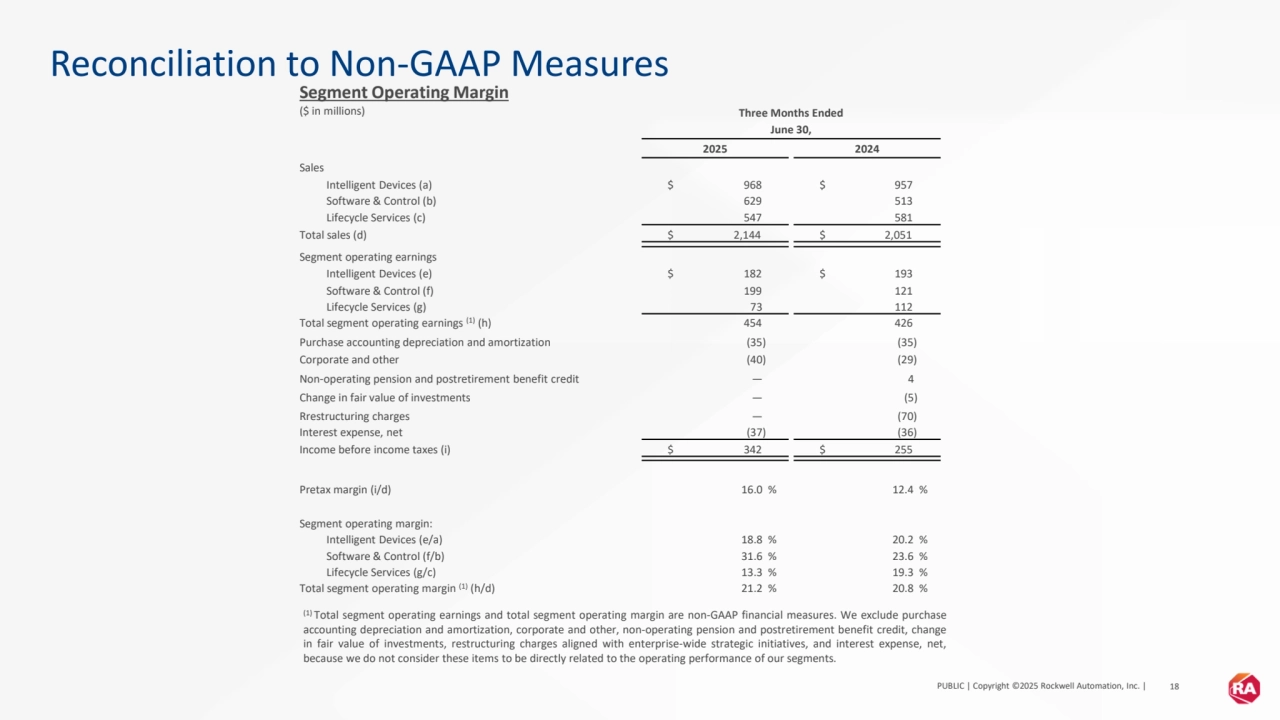
- 18. PUBLIC | Copyright ©2025 Rockwell Automation, Inc. | 18 Reconciliation to Non-GAAP Measures Segment Operating Margin ($ in millions) Three Months Ended June 30, 2025 2024 Sales Intelligent Devices (a) $ 968 $ 957 Software & Control (b) 629 513 Lifecycle Services (c) 547 581 Total sales (d) $ 2,144 $ 2,051 Segment operating earnings Intelligent Devices (e) $ 182 $ 193 Software & Control (f) 199 121 Lifecycle Services (g) 73 112 Total segment operating earnings (1) (h) 454 426 Purchase accounting depreciation and amortization (35) (35) Corporate and other (40) (29) Non-operating pension and postretirement benefit credit — 4 Change in fair value of investments — (5) Rrestructuring charges — (70) Interest expense, net (37) (36) Income before income taxes (i) $ 342 $ 255 Pretax margin (i/d) 16.0 % 12.4 % Segment operating margin: Intelligent Devices (e/a) 18.8 % 20.2 % Software & Control (f/b) 31.6 % 23.6 % Lifecycle Services (g/c) 13.3 % 19.3 % Total segment operating margin (1) (h/d) 21.2 % 20.8 % (1) Total segment operating earnings and total segment operating margin are non-GAAP financial measures. We exclude purchase accounting depreciation and amortization, corporate and other, non-operating pension and postretirement benefit credit, change in fair value of investments, restructuring charges aligned with enterprise-wide strategic initiatives, and interest expense, net, because we do not consider these items to be directly related to the operating performance of our segments.
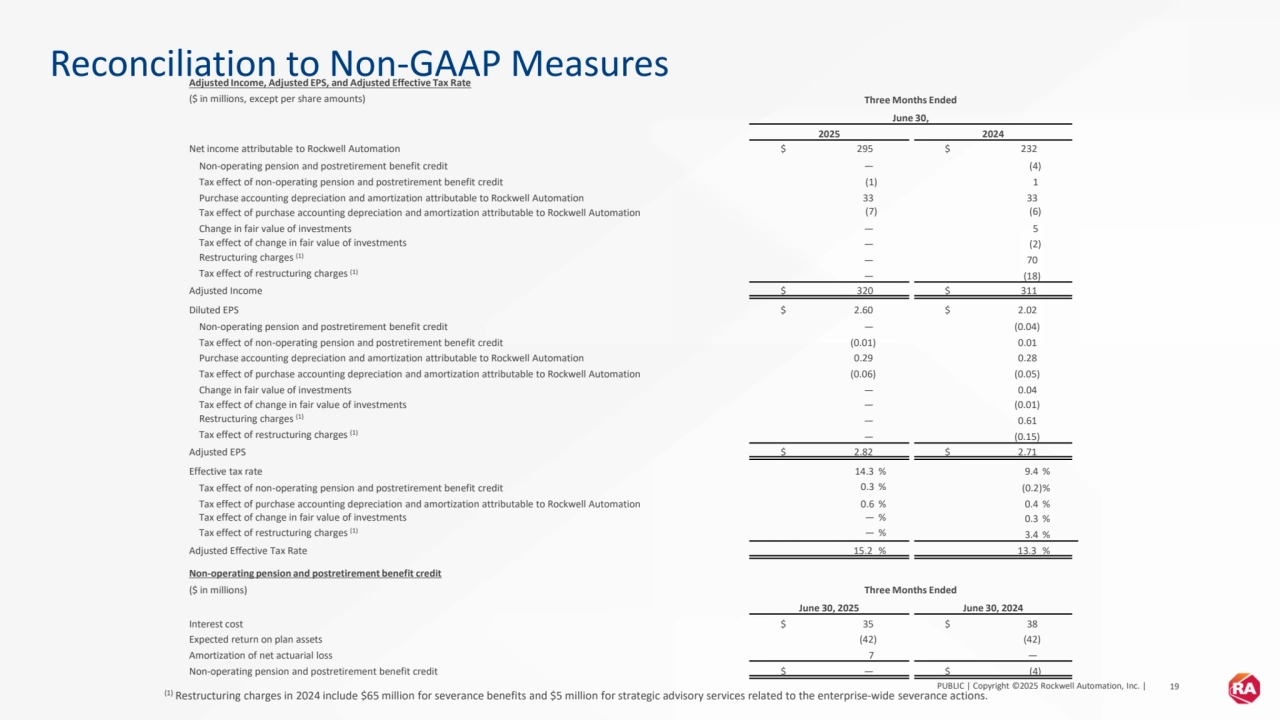
- 19. PUBLIC | Copyright ©2025 Rockwell Automation, Inc. | 19 Reconciliation to Non-GAAP Measures Adjusted Income, Adjusted EPS, and Adjusted Effective Tax Rate ($ in millions, except per share amounts) Three Months Ended June 30, 2025 2024 Net income attributable to Rockwell Automation $ 295 $ 232 Non-operating pension and postretirement benefit credit — (4) Tax effect of non-operating pension and postretirement benefit credit (1) 1 Purchase accounting depreciation and amortization attributable to Rockwell Automation 33 33 Tax effect of purchase accounting depreciation and amortization attributable to Rockwell Automation (7) (6) Change in fair value of investments — 5 Tax effect of change in fair value of investments — (2) Restructuring charges (1) — 70 Tax effect of restructuring charges (1) — (18) Adjusted Income $ 320 $ 311 Diluted EPS $ 2.60 $ 2.02 Non-operating pension and postretirement benefit credit — (0.04) Tax effect of non-operating pension and postretirement benefit credit (0.01) 0.01 Purchase accounting depreciation and amortization attributable to Rockwell Automation 0.29 0.28 Tax effect of purchase accounting depreciation and amortization attributable to Rockwell Automation (0.06) (0.05) Change in fair value of investments — 0.04 Tax effect of change in fair value of investments — (0.01) Restructuring charges (1) — 0.61 Tax effect of restructuring charges (1) — (0.15) Adjusted EPS $ 2.82 $ 2.71 Effective tax rate 14.3 % 9.4 % Tax effect of non-operating pension and postretirement benefit credit 0.3 % (0.2)% Tax effect of purchase accounting depreciation and amortization attributable to Rockwell Automation 0.6 % 0.4 % Tax effect of change in fair value of investments — % 0.3 % Tax effect of restructuring charges (1) — % 3.4 % Adjusted Effective Tax Rate 15.2 % 13.3 % Non-operating pension and postretirement benefit credit ($ in millions) Three Months Ended June 30, 2025 June 30, 2024 Interest cost $ 35 $ 38 Expected return on plan assets (42) (42) Amortization of net actuarial loss 7 — Non-operating pension and postretirement benefit credit $ — $ (4) (1) Restructuring charges in 2024 include $65 million for severance benefits and $5 million for strategic advisory services related to the enterprise-wide severance actions.
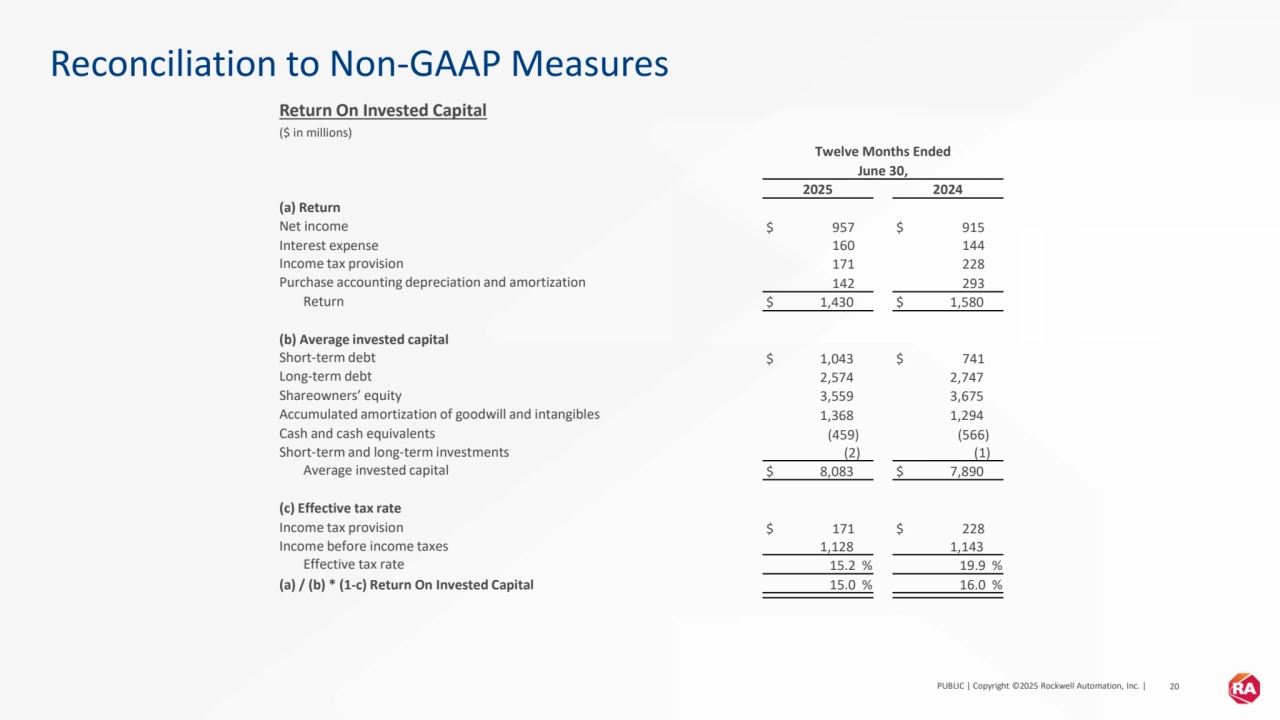
- 20. PUBLIC | Copyright ©2025 Rockwell Automation, Inc. | 20 Reconciliation to Non-GAAP Measures Return On Invested Capital ($ in millions) Twelve Months Ended June 30, 2025 2024 (a) Return Net income $ 957 $ 915 Interest expense 160 144 Income tax provision 171 228 Purchase accounting depreciation and amortization 142 293 Return $ 1,430 $ 1,580 (b) Average invested capital Short-term debt $ 1,043 $ 741 Long-term debt 2,574 2,747 Shareowners’ equity 3,559 3,675 Accumulated amortization of goodwill and intangibles 1,368 1,294 Cash and cash equivalents (459) (566) Short-term and long-term investments (2) (1) Average invested capital $ 8,083 $ 7,890 (c) Effective tax rate Income tax provision $ 171 $ 228 Income before income taxes 1,128 1,143 Effective tax rate 15.2 % 19.9 % (a) / (b) * (1-c) Return On Invested Capital 15.0 % 16.0 %
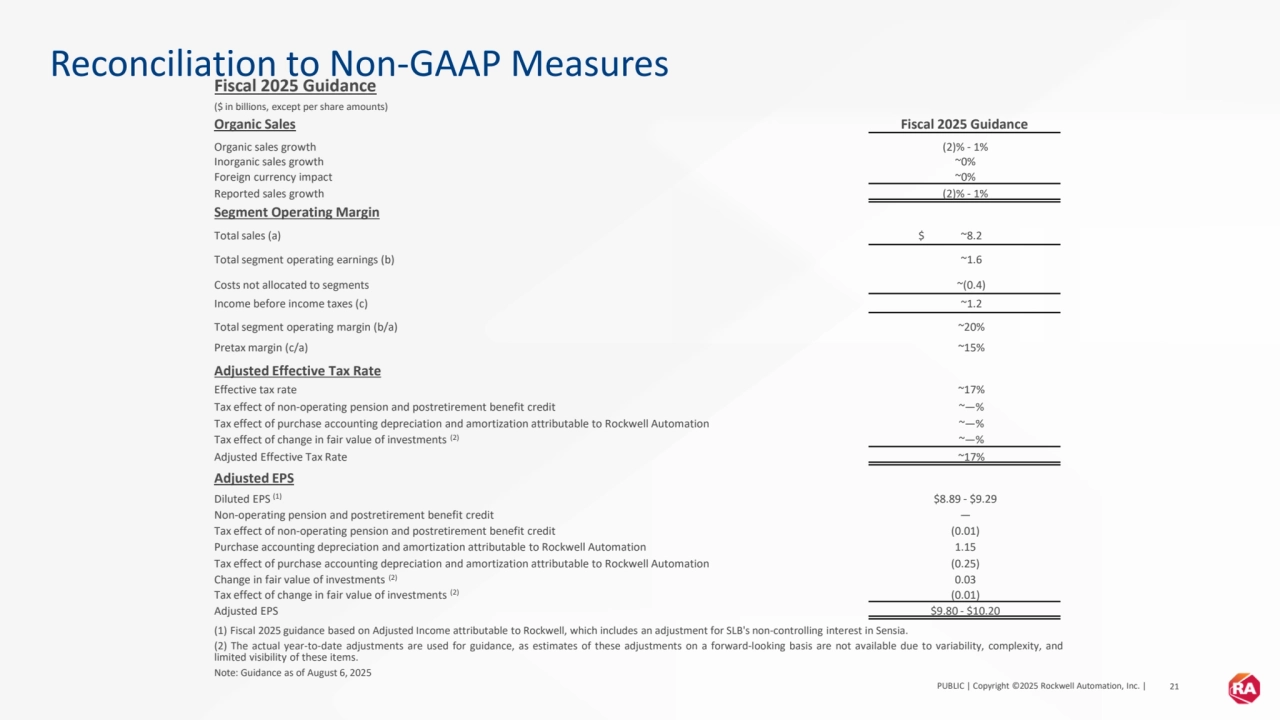
- 21. PUBLIC | Copyright ©2025 Rockwell Automation, Inc. | 21 Reconciliation to Non-GAAP Measures Fiscal 2025 Guidance ($ in billions, except per share amounts) Organic Sales Fiscal 2025 Guidance Organic sales growth (2)% - 1% Inorganic sales growth ~0% Foreign currency impact ~0% Reported sales growth (2)% - 1% Segment Operating Margin Total sales (a) $ ~8.2 Total segment operating earnings (b) ~1.6 Costs not allocated to segments ~(0.4) Income before income taxes (c) ~1.2 Total segment operating margin (b/a) ~20% Pretax margin (c/a) ~15% Adjusted Effective Tax Rate Effective tax rate ~17% Tax effect of non-operating pension and postretirement benefit credit ~—% Tax effect of purchase accounting depreciation and amortization attributable to Rockwell Automation ~—% Tax effect of change in fair value of investments (2) ~—% Adjusted Effective Tax Rate ~17% Adjusted EPS Diluted EPS (1) $8.89 - $9.29 Non-operating pension and postretirement benefit credit — Tax effect of non-operating pension and postretirement benefit credit (0.01) Purchase accounting depreciation and amortization attributable to Rockwell Automation 1.15 Tax effect of purchase accounting depreciation and amortization attributable to Rockwell Automation (0.25) Change in fair value of investments (2) 0.03 Tax effect of change in fair value of investments (2) (0.01) Adjusted EPS $9.80 - $10.20 (1) Fiscal 2025 guidance based on Adjusted Income attributable to Rockwell, which includes an adjustment for SLB's non-controlling interest in Sensia. (2) The actual year-to-date adjustments are used for guidance, as estimates of these adjustments on a forward-looking basis are not available due to variability, complexity, and limited visibility of these items. Note: Guidance as of August 6, 2025
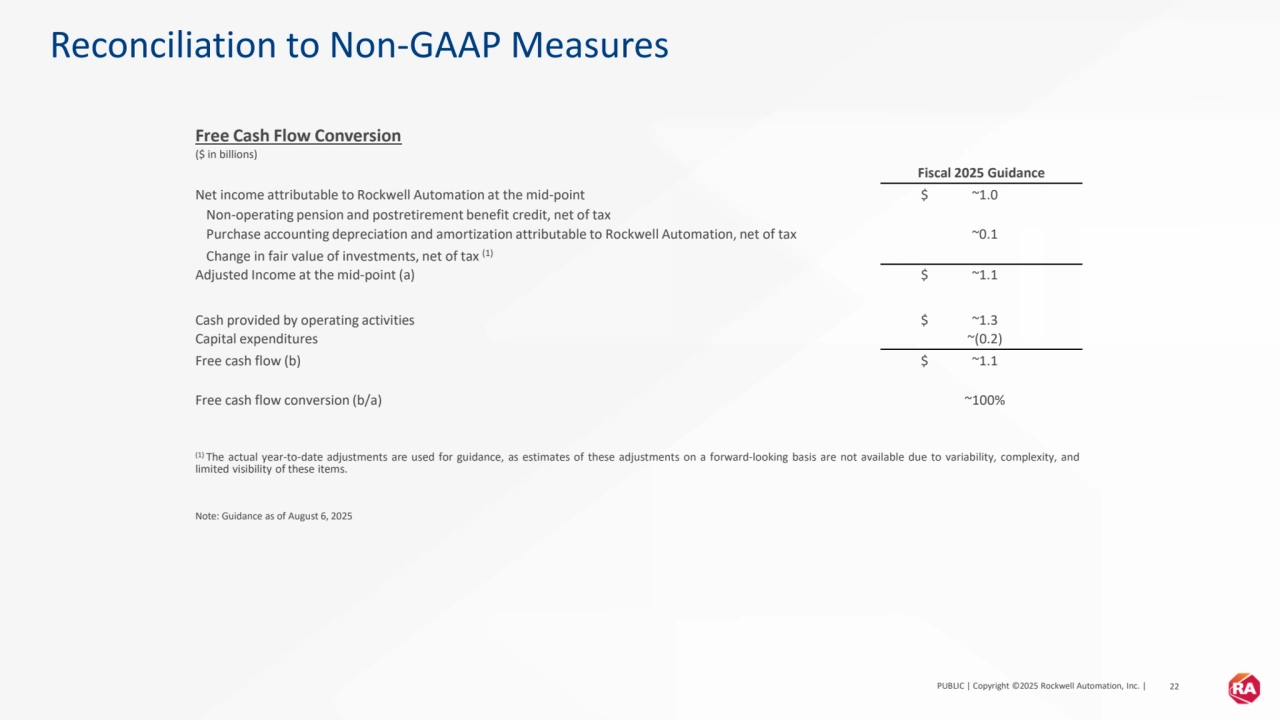
- 22. PUBLIC | Copyright ©2025 Rockwell Automation, Inc. | 22 Reconciliation to Non-GAAP Measures Free Cash Flow Conversion ($ in billions) Fiscal 2025 Guidance Net income attributable to Rockwell Automation at the mid-point $ ~1.0 Non-operating pension and postretirement benefit credit, net of tax Purchase accounting depreciation and amortization attributable to Rockwell Automation, net of tax ~0.1 Change in fair value of investments, net of tax (1) Adjusted Income at the mid-point (a) $ ~1.1 Cash provided by operating activities $ ~1.3 Capital expenditures ~(0.2) Free cash flow (b) $ ~1.1 Free cash flow conversion (b/a) ~100% (1) The actual year-to-date adjustments are used for guidance, as estimates of these adjustments on a forward-looking basis are not available due to variability, complexity, and limited visibility of these items. Note: Guidance as of August 6, 2025
- 23. PUBLIC | Copyright ©2025 Rockwell Automation, Inc. | 23 Performance Metric Definition Total ARR Annual recurring revenue (ARR) is a key metric that enables measurement of progress in growing our recurring revenue business. It represents the annual contract value of all active recurring revenue contracts at any point in time. Recurring revenue is defined as a revenue stream that is contractual, typically for a period of 12 months or more, and has a high probability of renewal. The probability of renewal is based on historical renewal experience of the individual revenue streams, or management's best estimates if historical renewal experience is not available. Total ARR growth is calculated as the dollar change in ARR, adjusted to exclude the effects of currency, divided by ARR as of the prior period. The effects of currency translation are excluded by calculating Total ARR on a constant currency basis. Total ARR includes acquisitions even if there was no comparable ARR in the prior period. We believe that Total ARR provides useful information to investors because it reflects our recurring revenue performance period over period including the effect of acquisitions. Our measure of ARR may be different from measures used by other companies. Because ARR is based on annual contract value, it does not represent revenue recognized during a particular reporting period or revenue to be recognized in future reporting periods and is not intended to be a substitute for revenue, contract liabilities, or backlog. Book-to-bill Book-to-bill is a key performance metric that provides an indication of the level of demand. It is calculated as orders divided by sales for a specified period. A Book-to-bill greater than 1.0 indicates that orders exceeded sales and a growing backlog while a Book-to-bill less than 1.0 indicates that sales exceeded orders and a declining backlog. We believe that Book-to-bill provides useful information to investors about demand, and in our Lifecycle Services segment, about the strength of our backlog. Our measure of Book-to-bill may be different from measures used by other companies.
- 24. Thank you www.rockwellautomation.com www.rockwellautomation.com