SAMSUNG ELECTRONICS Earnings Presentation: 2 Q 2025 Financial Results
 AI Summary
Key Insights
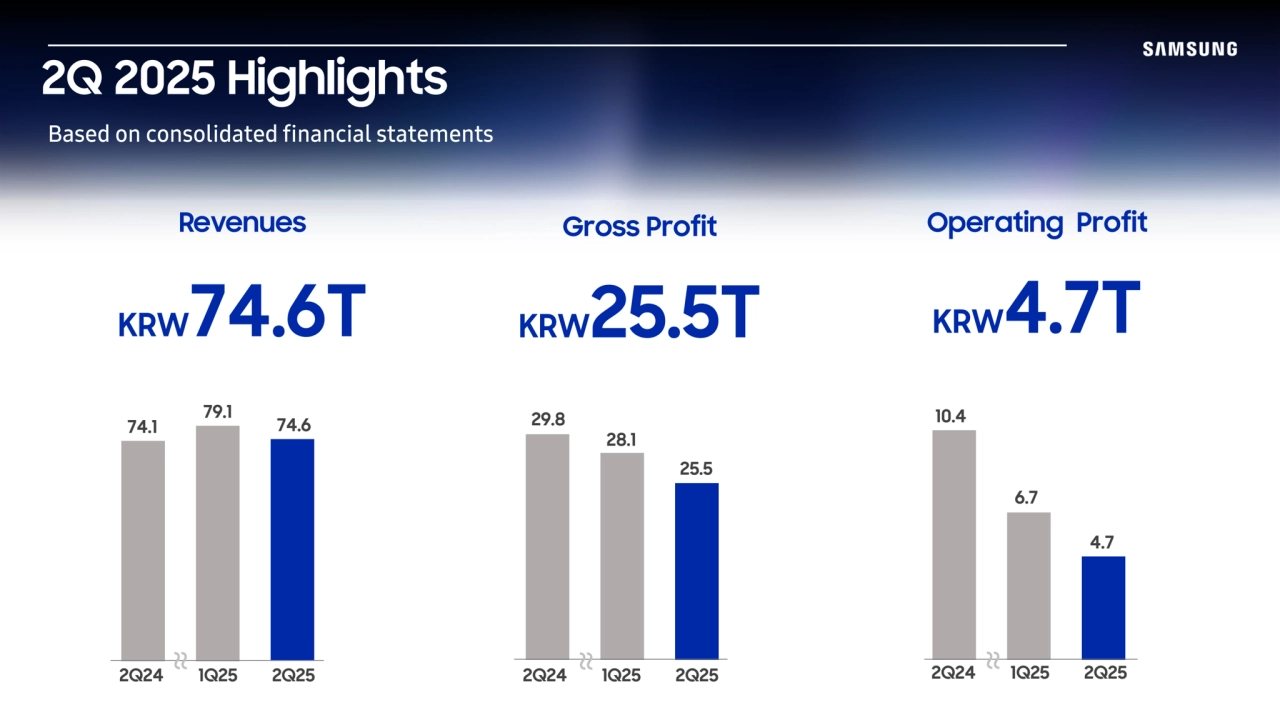
- 📈 Financial Overview: Reports revenues of KRW 74.6T, a gross profit of KRW 25.5T, and an operating profit of KRW 4.7T for 2Q 2025.
- 📱 Business Segments Performance: Highlights sales and operating profit for DX, DS, Memory, and SDC segments.
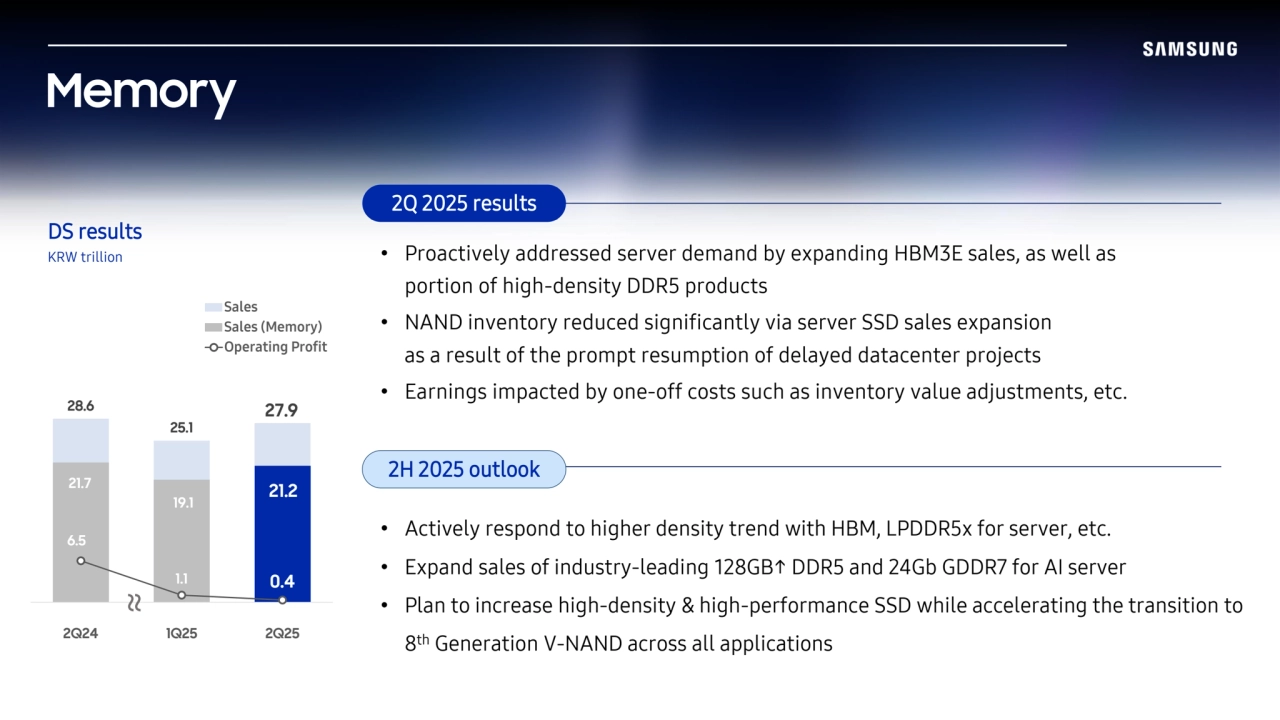
- 💾 Memory Division Strategies: Focuses on expanding HBM3E sales and reducing NAND inventory via server SSD sales.
- 🏭 S.LSI and Foundry Developments: Revenue from flagship SoC shipments, but impacted by inventory adjustments and low utilization.
- 📊 2H 2025 Outlook: Aims to enhance Exynos competitiveness and expand sales of premium monitors and AI-driven products.

SAMSUNG ELECTRONICS Earnings Presentation: 2 Q 2025 Financial Results
- 1. SAMSUNG ELECTRONICS Earnings Presentation: 2Q 2025 Financial Results
- 2. The financial information in this document are consolidated earnings results based on K-IFRS. This document is provided for the convenience of investors only before the external review on our 2Q 2025 financial results is completed. The Audit outcomes may cause some parts of this document to change. This document contains "forward-looking statements" - that is statements related to future not past events. In this context "forward-looking statements" often address our expected future business and financial performance and often contain words such as "expects” "anticipates” "intends” "plans” "believes” "seeks” or "will ". “Forward-looking statements" by their nature address matters that are to different degrees uncertain. For us particular uncertainties which could adversely or positively affect our future results include: · The behavior of financial markets including fluctuations in exchange rates interest rates and commodity prices · Strategic actions including dispositions and acquisitions · Unanticipated dramatic developments in our major businesses including DX (Digital eXperience) DS (Device Solutions) · Numerous other matters at the national and international levels which could affect our future results These uncertainties may cause our actual results to be materially different from those expressed in this document. Disclaimer
- 3. PRESENTERS 2Q 2025 FINANCIAL RESULTS APPENDICES Index PERFORMANCE BY BUSINESS SEGMENT
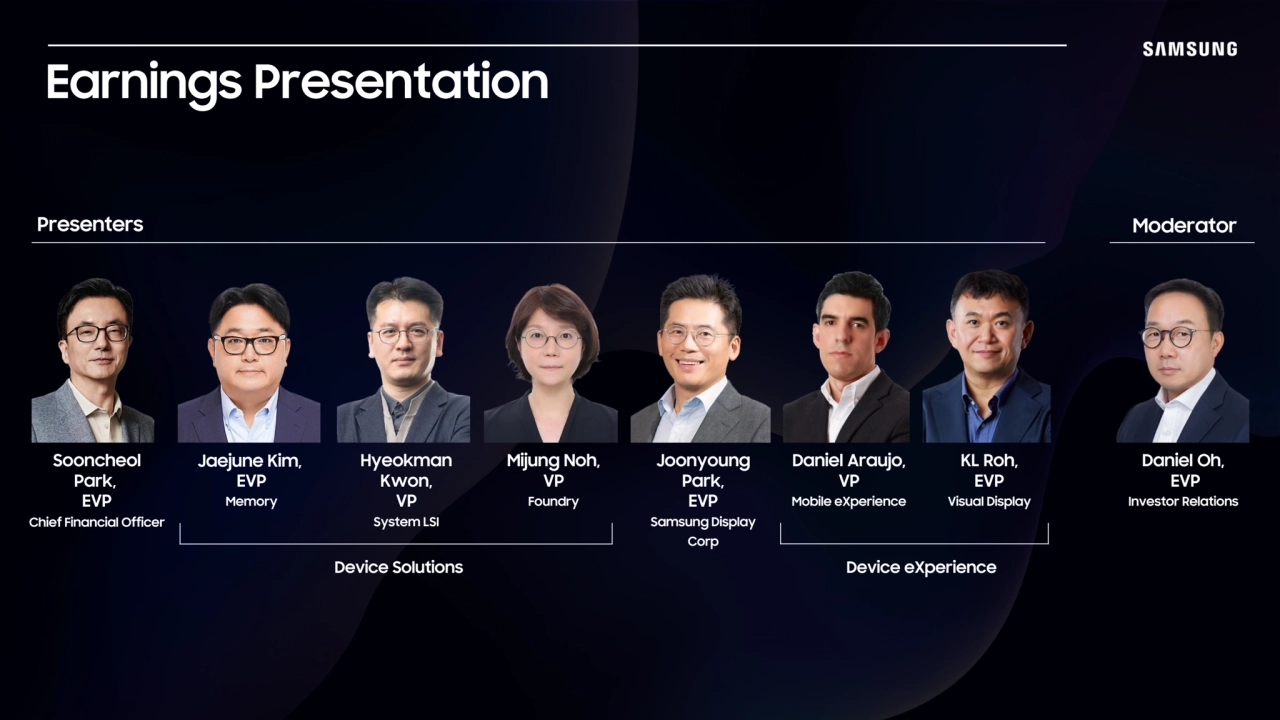
- 4. Earnings Presentation Device Solutions Device eXperience Jaejune Kim, EVP Memory Hyeokman Kwon, VP System LSI Mijung Noh, VP Foundry Joonyoung Park, EVP Samsung Display Corp Daniel Araujo, VP Mobile eXperience KL Roh, EVP Visual Display Daniel Oh, EVP Investor Relations Sooncheol Park, EVP Presenters Moderator Chief Financial Officer
- 5. 2Q 2025 Highlights Based on consolidated financial statements Revenues KRW74.6T Gross Profit KRW25.5T Operating Profit KRW4.7T 2Q24 1Q25 2Q25 74.1 74.6 79.1 29.8 28.1 25.5 10.4 6.7 4.7 2Q24 1Q25 2Q25 2Q24 1Q25 2Q25 ~~ ~~ ~~
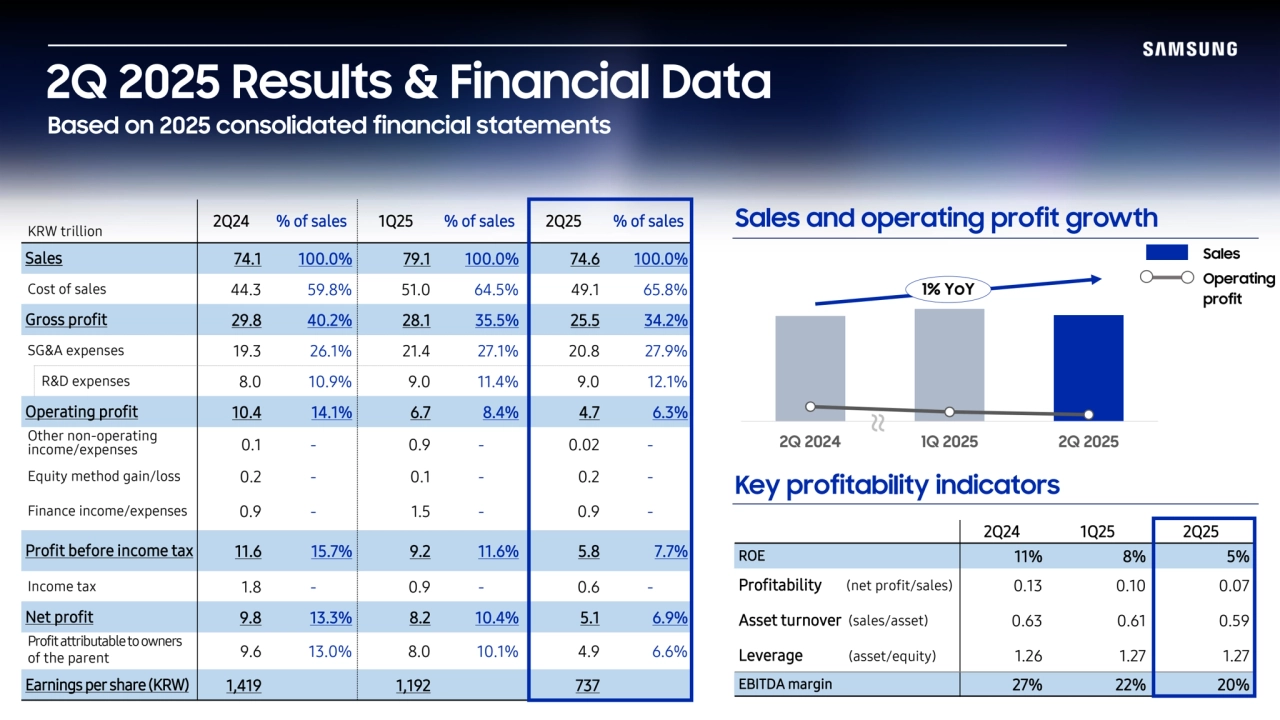
- 6. Key profitability indicators 2Q 2025 Results & Financial Data Based on 2025 consolidated financial statements Sales and operating profit growth 2Q 2024 1Q 2025 2Q 2025 Sales Operating profit 1% YoY KRW trillion 2Q24 % of sales 1Q25 % of sales 2Q25 % of sales Sales 74.1 100.0% 79.1 100.0% 74.6 100.0% Cost of sales 44.3 59.8% 51.0 64.5% 49.1 65.8% Gross profit 29.8 40.2% 28.1 35.5% 25.5 34.2% SG&A expenses 19.3 26.1% 21.4 27.1% 20.8 27.9% R&D expenses 8.0 10.9% 9.0 11.4% 9.0 12.1% Operating profit 10.4 14.1% 6.7 8.4% 4.7 6.3% Other non-operating income/expenses 0.1 - 0.9 - 0.02 - Equity method gain/loss 0.2 - 0.1 - 0.2 - Finance income/expenses 0.9 - 1.5 - 0.9 - Profit before income tax 11.6 15.7% 9.2 11.6% 5.8 7.7% Income tax 1.8 - 0.9 - 0.6 - Net profit 9.8 13.3% 8.2 10.4% 5.1 6.9% Profitattributable to owners of the parent 9.6 13.0% 8.0 10.1% 4.9 6.6% Earnings per share(KRW) 1,419 1,192 737 2Q24 1Q25 2Q25 ROE 11% 8% 5% Profitability (net profit/sales) 0.13 0.10 0.07 Asset turnover (sales/asset) 0.63 0.61 0.59 Leverage (asset/equity) 1.26 1.27 1.27 EBITDA margin 27% 22% 20% ~~
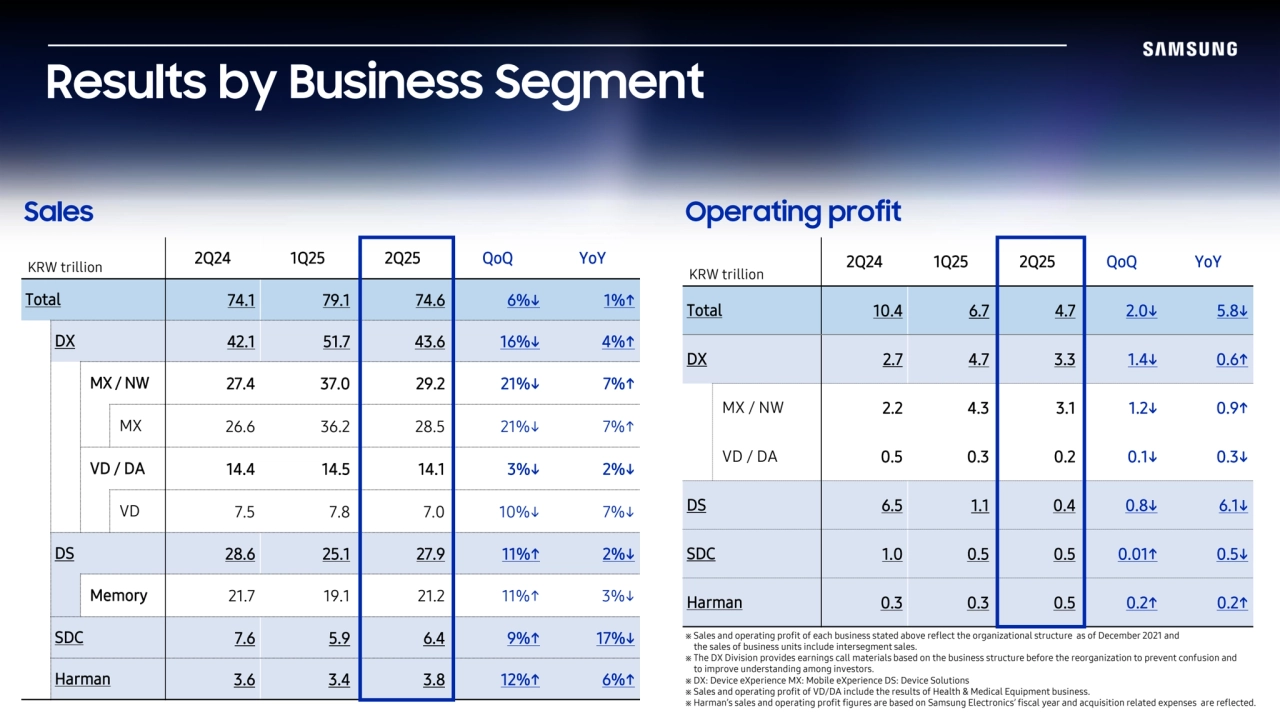
- 7. KRW trillion 2Q24 1Q25 2Q25 QoQ YoY Total 10.4 6.7 4.7 2.0↓ 5.8↓ DX 2.7 4.7 3.3 1.4↓ 0.6↑ MX / NW 2.2 4.3 3.1 1.2↓ 0.9↑ VD / DA 0.5 0.3 0.2 0.1↓ 0.3↓ DS 6.5 1.1 0.4 0.8↓ 6.1↓ SDC 1.0 0.5 0.5 0.01↑ 0.5↓ Harman 0.3 0.3 0.5 0.2↑ 0.2↑ KRW trillion 2Q24 1Q25 2Q25 QoQ YoY Total 74.1 79.1 74.6 6%↓ 1%↑ DX 42.1 51.7 43.6 16%↓ 4%↑ MX / NW 27.4 37.0 29.2 21%↓ 7%↑ MX 26.6 36.2 28.5 21%↓ 7%↑ VD / DA 14.4 14.5 14.1 3%↓ 2%↓ VD 7.5 7.8 7.0 10%↓ 7%↓ DS 28.6 25.1 27.9 11%↑ 2%↓ Memory 21.7 19.1 21.2 11%↑ 3%↓ SDC 7.6 5.9 6.4 9%↑ 17%↓ Harman 3.6 3.4 3.8 12%↑ 6%↑ Results by Business Segment Sales Operating profit ※ Sales and operating profit of each business stated above reflect the organizational structure as of December 2021 and the sales of business units include intersegment sales. ※ The DX Division provides earnings call materials based on the business structure before the reorganization to prevent confusion and to improve understanding among investors. ※ DX: Device eXperience MX: Mobile eXperience DS: Device Solutions ※ Sales and operating profit of VD/DA include the results of Health & Medical Equipment business. ※ Harman’s sales and operating profit figures are based on Samsung Electronics’ fiscal year and acquisition related expenses are reflected.
- 8. Memory DS results KRW trillion 28.6 25.1 27.9 21.7 19.1 21.2 6.5 1.1 0.4 2Q24 1Q25 2Q25 Sales Sales (Memory) Operating Profit ~~ 2H 2025 outlook 2Q 2025 results • Proactively addressed server demand by expanding HBM3E sales, as well as portion of high-density DDR5 products • NAND inventory reduced significantly via server SSD sales expansion as a result of the prompt resumption of delayed datacenter projects • Earnings impacted by one-off costs such as inventory value adjustments, etc. • Actively respond to higher density trend with HBM, LPDDR5x for server, etc. • Expand sales of industry-leading 128GB↑ DDR5 and 24Gb GDDR7 for AI server • Plan to increase high-density & high-performance SSD while accelerating the transition to 8 th Generation V-NAND across all applications
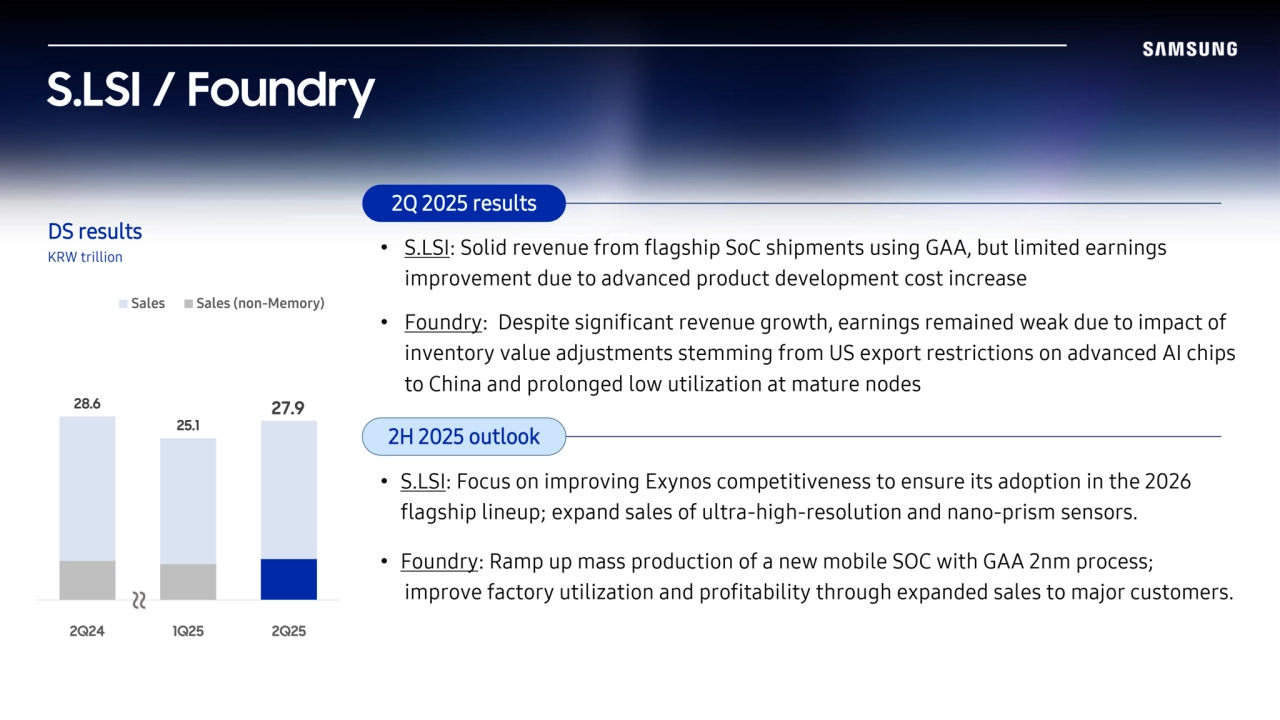
- 9. S.LSI / Foundry DS results KRW trillion 2Q 2025 results 2H 2025 outlook Non-Memory sales Non-Memory sales 28.6 25.1 27.9 2Q24 1Q25 2Q25 Sales Sales (non-Memory) • S.LSI: Solid revenue from flagship SoC shipments using GAA, but limited earnings improvement due to advanced product development cost increase • Foundry: Despite significant revenue growth, earnings remained weak due to impact of inventory value adjustments stemming from US export restrictions on advanced AI chips to China and prolonged low utilization at mature nodes • S.LSI: Focus on improving Exynos competitiveness to ensure its adoption in the 2026 flagship lineup; expand sales of ultra-high-resolution and nano-prism sensors. • Foundry: Ramp up mass production of a new mobile SOC with GAA 2nm process; improve factory utilization and profitability through expanded sales to major customers.
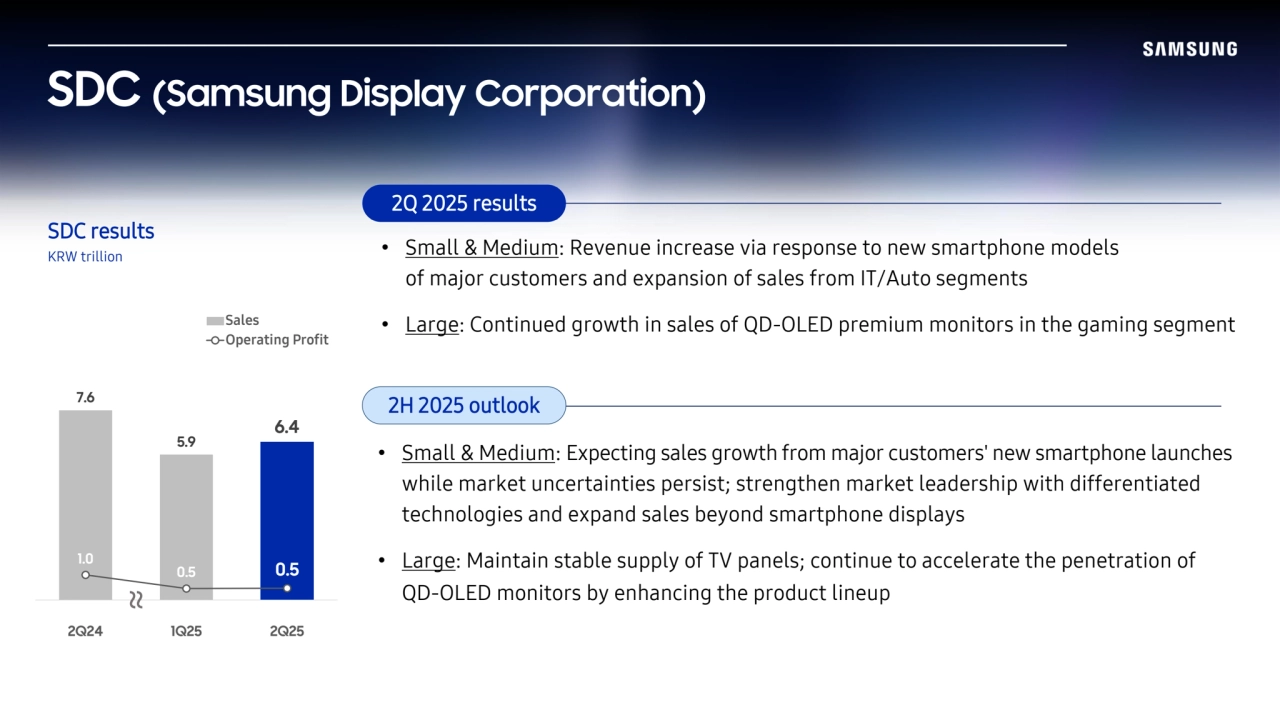
- 10. SDC results KRW trillion SDC (Samsung Display Corporation) 7.6 5.9 6.4 1.0 0.5 0.5 2Q24 1Q25 2Q25 Sales Operating Profit ~~ 2Q 2025 results 2H 2025 outlook • Small & Medium: Revenue increase via response to new smartphone models of major customers and expansion of sales from IT/Auto segments • Large: Continued growth in sales of QD-OLED premium monitors in the gaming segment • Small & Medium: Expecting sales growth from major customers' new smartphone launches while market uncertainties persist; strengthen market leadership with differentiated technologies and expand sales beyond smartphone displays • Large: Maintain stable supply of TV panels; continue to accelerate the penetration of QD-OLED monitors by enhancing the product lineup
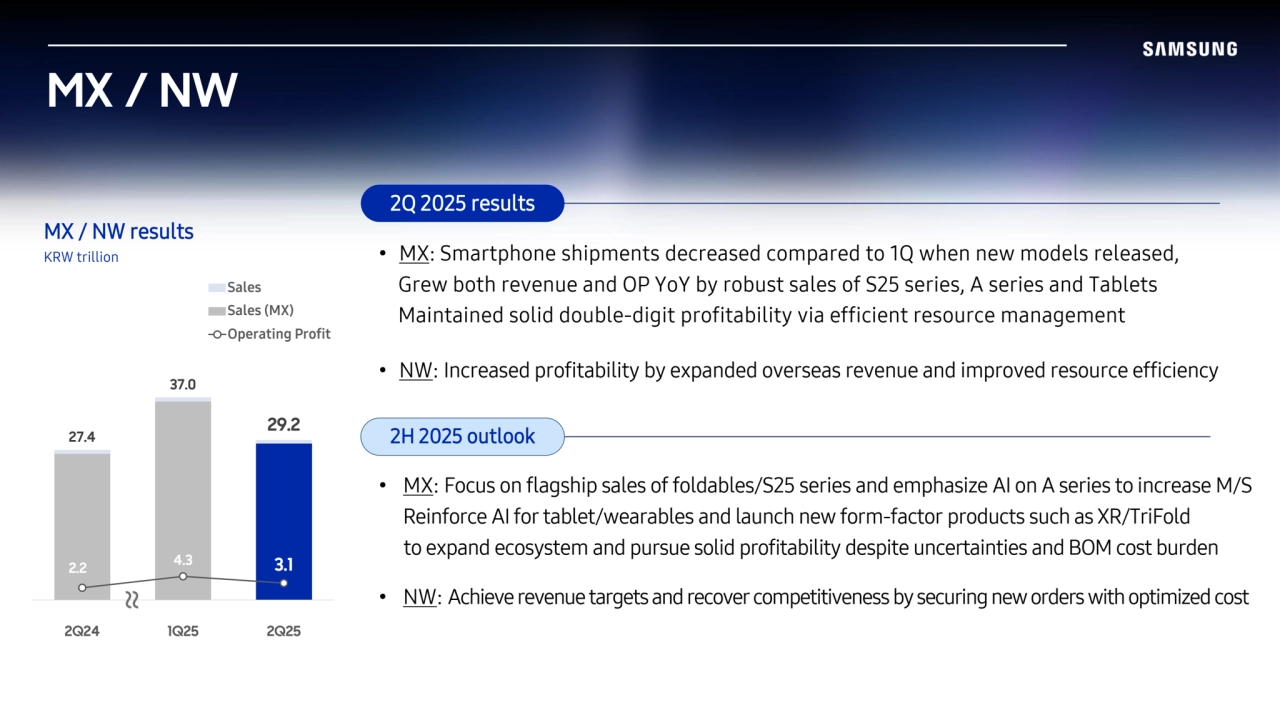
- 11. MX / NW results KRW trillion MX sales MX / NW 27.4 37.0 29.2 2.2 4.3 3.1 2Q24 1Q25 2Q25 Sales Sales (MX) Operating Profit ~~ 2Q 2025 results 2H 2025 outlook • MX: Focus on flagship sales of foldables/S25 series and emphasize AI on A series to increase M/S Reinforce AI for tablet/wearables and launch new form-factor products such as XR/TriFold to expand ecosystem and pursue solid profitability despite uncertainties and BOM cost burden • NW: Achieve revenue targets and recover competitiveness by securing new orders with optimized cost • MX: Smartphone shipments decreased compared to 1Q when new models released, Grew both revenue and OP YoY by robust sales of S25 series, A series and Tablets Maintained solid double-digit profitability via efficient resource management • NW: Increased profitability by expanded overseas revenue and improved resource efficiency
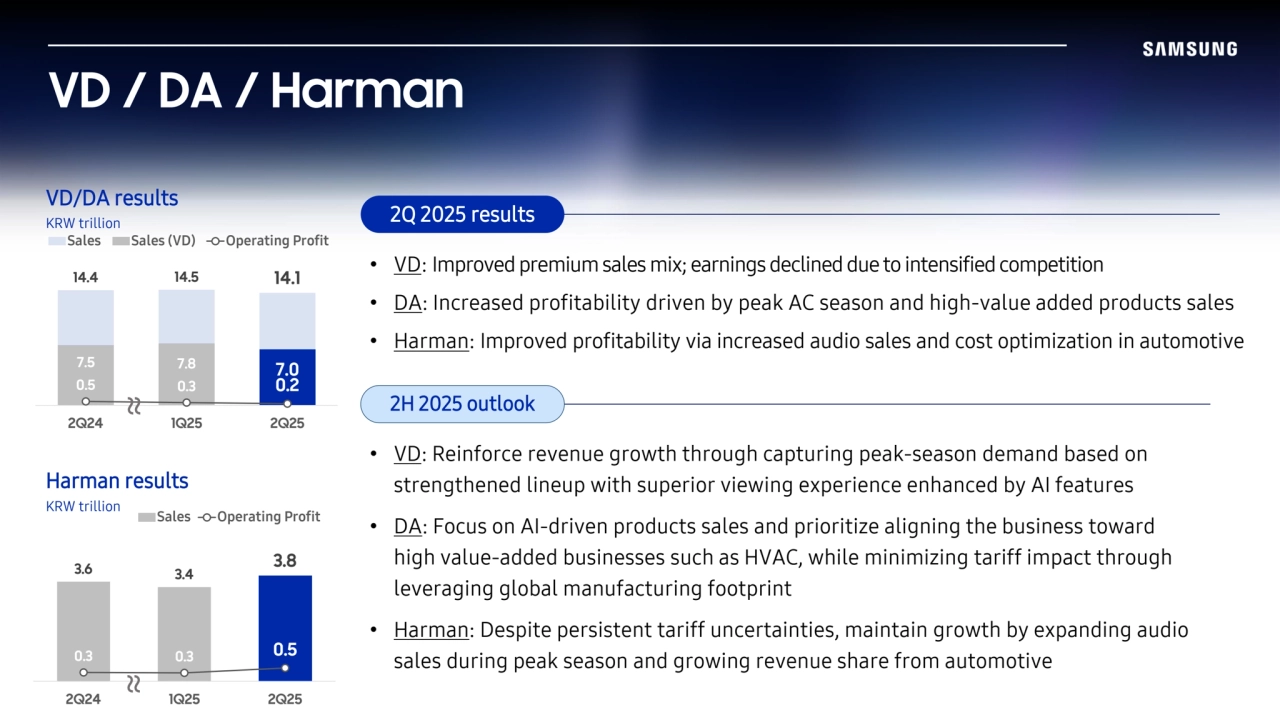
- 12. VD/DA results KRW trillion 2H 2025 outlook Harman results KRW trillion VD / DA / Harman 2Q 2025 results 14.4 14.5 14.1 7.5 7.8 7.0 0.5 0.3 0.2 2Q24 1Q25 2Q25 Sales Sales (VD) Operating Profit 3.6 3.4 3.8 0.3 0.3 0.5 2Q24 1Q25 2Q25 Sales Operating Profit ~~ ~~ • VD: Improved premium sales mix; earnings declined due to intensified competition • DA: Increased profitability driven by peak AC season and high-value added products sales • Harman: Improved profitability via increased audio sales and cost optimization in automotive • VD: Reinforce revenue growth through capturing peak-season demand based on strengthened lineup with superior viewing experience enhanced by AI features • DA: Focus on AI-driven products sales and prioritize aligning the business toward high value-added businesses such as HVAC, while minimizing tariff impact through leveraging global manufacturing footprint • Harman: Despite persistent tariff uncertainties, maintain growth by expanding audio sales during peak season and growing revenue share from automotive
- 13. Appendix 1: Financial Position (Summary) KRW billion 30.Jun.24 31.Mar.25 30.Jun.25 Assets 485,757.7 516,376.7 504,875.2 Cash ※ 100,795.5 105,133.6 100,728.2 A/R 43,660.9 44,866.6 43,550.5 Inventories 55,566.6 53,220.3 51,037.4 Investments 28,614.3 33,489.1 33,240.3 PP&E 194,449.8 207,385.8 205,025.6 Intangible assets 23,623.3 26,695.1 25,997.7 Other assets 39,047.3 45,586.2 45,295.5 Total assets 485,757.7 516,376.7 504,875.2 Liabilities 102,231.0 109,762.4 105,313.2 Debts 16,481.4 11,143.9 14,029.7 Trade accounts and N/P 13,113.3 14,496.2 12,675.8 Other accounts and N/P & accrued expenses 41,612.1 48,936.7 42,922.0 Current income tax liabilities 5,103.2 6,281.5 7,643.1 Unearned revenue & other advances 2,362.5 2,932.7 2,620.2 Other liabilities 23,558.5 25,971.4 25,422.4 Shareholder equity 383,526.7 406,614.3 399,562.0 Capital stock 897.5 897.5 897.5 Total liability & Shareholder equity 485,757.7 516,376.7 504,875.2 30.Jun.24 31.Mar.25 30.Jun.25 Current ratio ※ 258% 247% 251% Liability/equity 27% 27% 26% Debt/equity 4% 3% 4% Net debt/equity (22%) (23%) (22%) ※ Cash = Cash and Cash equivalents Short-term financial instruments Short-term financial assets at amortized cost etc. ※ Current ratio = current assets/current liabilities
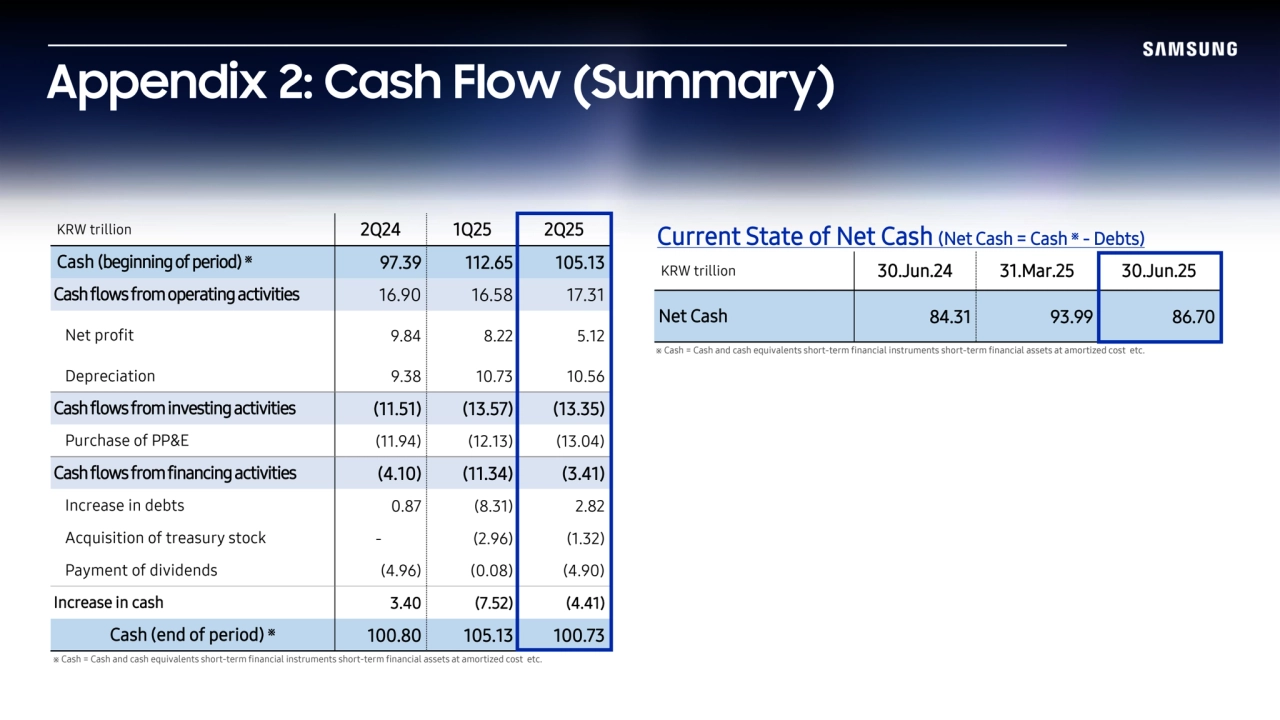
- 14. Appendix 2: Cash Flow (Summary) KRW trillion 30.Jun.24 31.Mar.25 30.Jun.25 Net Cash 84.31 93.99 86.70 KRW trillion 2Q24 1Q25 2Q25 Cash (beginning of period) ※ 97.39 112.65 105.13 Cash flows from operating activities 16.90 16.58 17.31 Net profit 9.84 8.22 5.12 Depreciation 9.38 10.73 10.56 Cash flows from investing activities (11.51) (13.57) (13.35) Purchase of PP&E (11.94) (12.13) (13.04) Cash flows from financing activities (4.10) (11.34) (3.41) Increase in debts 0.87 (8.31) 2.82 Acquisition of treasury stock - (2.96) (1.32) Payment of dividends (4.96) (0.08) (4.90) Increase in cash 3.40 (7.52) (4.41) Cash (end of period) ※ 100.80 105.13 100.73 ※ Cash = Cash and cash equivalents short-term financial instruments short-term financial assets at amortized cost etc. ※ Cash = Cash and cash equivalents short-term financial instruments short-term financial assets at amortized cost etc. Current State of Net Cash (Net Cash = Cash ※ - Debts)
- 15. Thank you