Sylvamo: Second Quarter 2025 Earnings
 AI Summary
Key Insights
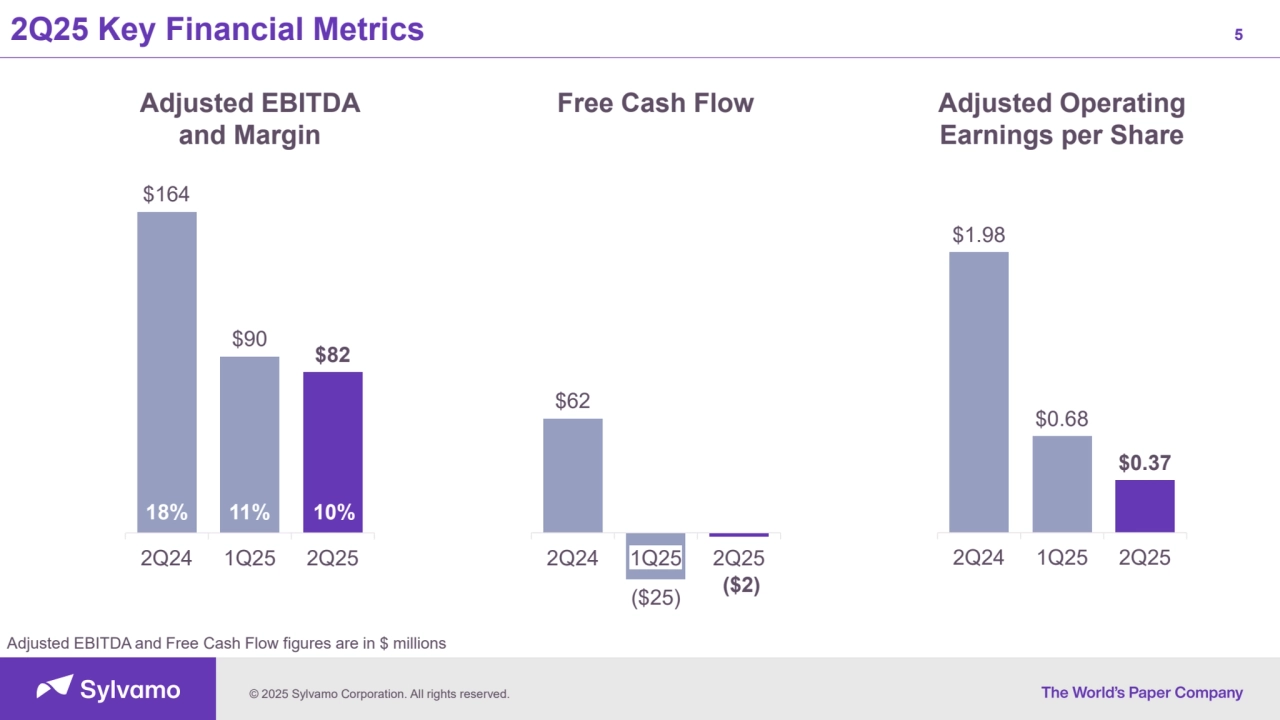
- 📈 Financial Performance: Sylvamo's 2Q25 financial results, including Adjusted EBITDA and free cash flow metrics.
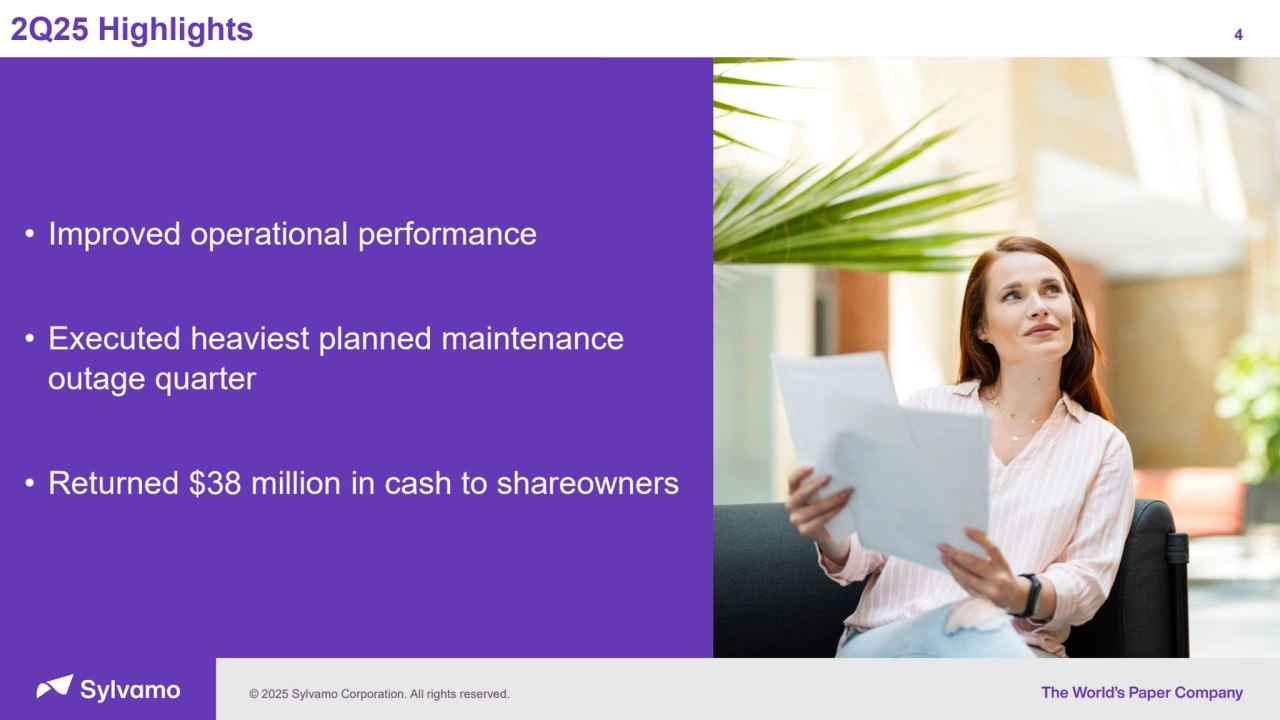
- 🏭 Operational Highlights: Improved performance, executed planned maintenance, and returned cash to shareholders.
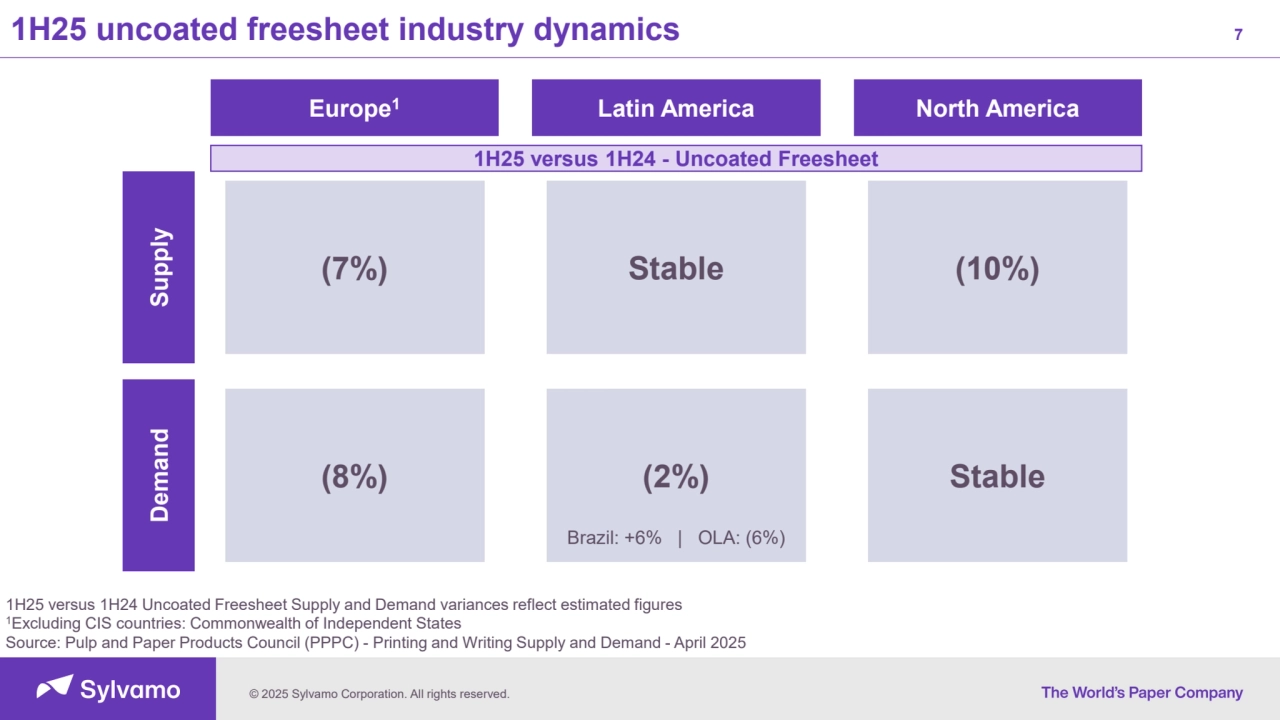
- 🌎 Industry Dynamics: Trends in the uncoated freesheet industry across different regions (Europe, Latin America, North America).
- 💰 Capital Allocation: Strategies for capital allocation, focusing on customers, reinvestment, and shareholder returns.
- 🌱 Sustainability & Growth: Long-term strategies focused on uncoated freesheet, investing in competitive advantages, and driving returns.

Sylvamo: Second Quarter 2025 Earnings
- 1. © 2025 Sylvamo Corporation. All rights reserved. 1 Second Quarter 2025 Earnings August 8, 2025
- 2. © 2025 Sylvamo Corporation. All rights reserved. Cautionary statement concerning forward-looking statements 2 This presentation contains information that includes or is based upon forward-looking statements. Forward-looking statements forecast or state expectations concerning future events. These statements often can be identified by the fact that they do not relate strictly to historical or current facts. They typically use words such as “anticipate,” “assume,” “could,” “estimate,” “expect,” “project,” “intend,” “plan,” “believe,” “should,” “will” and other words and terms of similar meaning, or they relate to future periods. Some examples of forward-looking statements include, without limitation, those relating to: economic, regulatory and industry conditions, outlook and trends; our strategies, plans, expectations and projections concerning our financial performance, business, opportunities and shareowner value; our Adjusted EBITDA outlook; and our use of capital including investments and return of cash to shareowners. Forward-looking statements are not guarantees of future performance. Any or all forward-looking statements may turn out to be incorrect, and actual results could differ materially from those expressed or implied in forward-looking statements. Forward-looking statements are based on current expectations and the current economic environment. They can be affected by inaccurate assumptions or by known or unknown risks, uncertainties and other factors that are difficult to predict. Although it is not possible to identify all of these risks, uncertainties and other factors, the impact of the following factors, among others, on us or on our suppliers or customers, could cause our actual results to differ from those in the forward-looking statements: deterioration of global and regional economic, civil and political conditions and trade relations including the imposition of tariffs or other trade protections; physical, financial and reputational risks associated with climate conditions and climate change, including adverse environmental events such as floods and fires; reduced demand for our products due to the cyclical nature of the paper industry, the industry-wide secular decline in paper demand, or competition from other businesses; increased costs or reduced availability of the raw materials, energy, transportation (truck, rail and ocean) and labor needed to manufacture and deliver our products; a material disruption at any of our manufacturing facilities; information technology risks including potential cybersecurity breaches affecting us or third parties with which we do business; extensive environmental, tax and other laws and regulations in Brazil, Europe, the United States and other jurisdictions to which we are subject, including our compliance costs and risk of liability and loss for violations; our reliance on a small number of customers; and the factors disclosed in Item 1A. Risk Factors in our annual report on Form 10-K for the year ended December 31, 2024, as such disclosures may be amended, supplemented or superseded from time to time by other reports that we file with the U.S. Securities and Exchange Commission, including subsequent quarterly reports on Form 10-Q, annual reports on Form 10-K and current reports on Form 8-K. We assume no obligation to update any forward-looking statements made in this presentation to reflect subsequent events, circumstances or actual outcomes.
- 3. © 2025 Sylvamo Corporation. All rights reserved. Statement relating to non-U.S. financial GAAP measures 3 While Sylvamo reports its financial results in accordance with accounting principles generally accepted in the United States ("U.S. GAAP"), during the course of this presentation, certain non-U.S. GAAP financial measures are presented. Management believes that these non-U.S. GAAP financial measures, when used in conjunction with information presented in accordance with U.S. GAAP, can facilitate a better understanding of the impact of various factors and trends on Sylvamo’s financial condition and results of operations. Management also uses these non-U.S. GAAP financial measures in making financial, operating and planning decisions and in evaluating Sylvamo’s performance. The non-U.S. GAAP financial measures in this presentation have limitations as analytical tools and should not be considered in isolation or as a substitute for, or superior to, an analysis of our results presented in accordance with U.S. GAAP. In addition, because not all companies use identical calculations, our presentation of non-U.S. GAAP financial measures in this presentation may not be comparable to similarly titled measures disclosed by other companies, including companies in our industry. These slides, including the reconciliation, are also available on Sylvamo Corporation’s website at sylvamo.com. The following is a list of all non-U.S. GAAP financial measures included in this presentation. See the Appendix for a reconciliation of all presented non-U.S. GAAP measures (and their components) to U.S. GAAP financial measures. • Adjusted EBITDA and Adjusted EBITDA Margin • Adjusted Operating Earnings per Share • Free Cash Flow
- 4. © 2025 Sylvamo Corporation. All rights reserved. 4 • Improved operational performance • Executed heaviest planned maintenance outage quarter • Returned $38 million in cash to shareowners 2Q25 Highlights Sumter, SC
- 5. © 2025 Sylvamo Corporation. All rights reserved. 5 Adjusted EBITDA and Margin 2Q25 Key Financial Metrics Adjusted Operating Earnings per Share Free Cash Flow $164 $90 $82 2Q24 1Q25 2Q25 18% 11% 10% $1.98 $0.68 $0.37 2Q24 1Q25 2Q25 $62 ($25) ($2) 2Q24 1Q25 2Q25 Adjusted EBITDA and Free Cash Flow figures are in $ millions
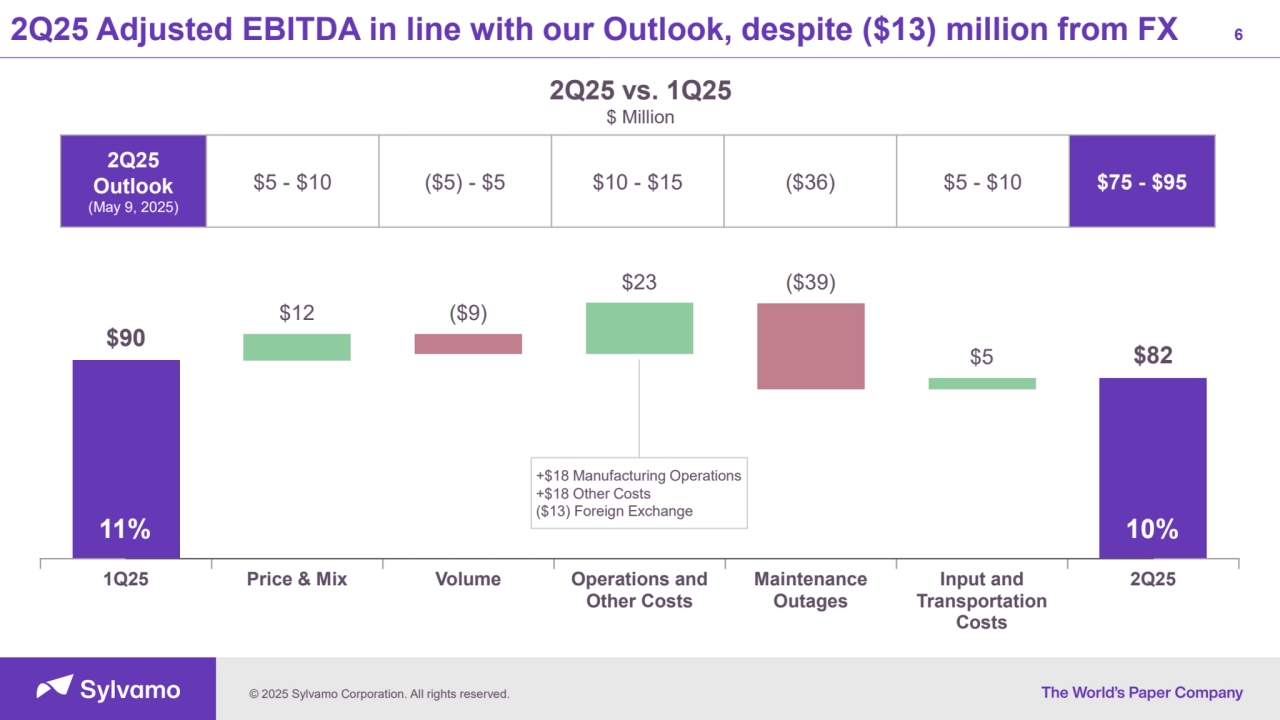
- 6. © 2025 Sylvamo Corporation. All rights reserved. 6 $90 $12 ($9) $23 ($39) $5 $82 1Q25 Price & Mix Volume Operations and Other Costs Maintenance Outages Input and Transportation Costs 2Q25 2Q25 Adjusted EBITDA in line with our Outlook, despite ($13) million from FX 11% 10% 2Q25 vs. 1Q25 $ Million 2Q25 Outlook (May 9, 2025) $5 - $10 ($5) - $5 $10 - $15 ($36) $5 - $10 $75 - $95 +$18 Manufacturing Operations +$18 Other Costs ($13) Foreign Exchange
- 7. © 2025 Sylvamo Corporation. All rights reserved. 1H25 uncoated freesheet industry dynamics 7 Europe1 Latin America North America 1H25 versus 1H24 Uncoated Freesheet Supply and Demand variances reflect estimated figures 1Excluding CIS countries: Commonwealth of Independent States Source: Pulp and Paper Products Council (PPPC) - Printing and Writing Supply and Demand - April 2025 Supply Demand (7%) (8%) Stable (2%) (10%) Stable 1H25 versus 1H24 - Uncoated Freesheet Brazil: +6% | OLA: (6%)
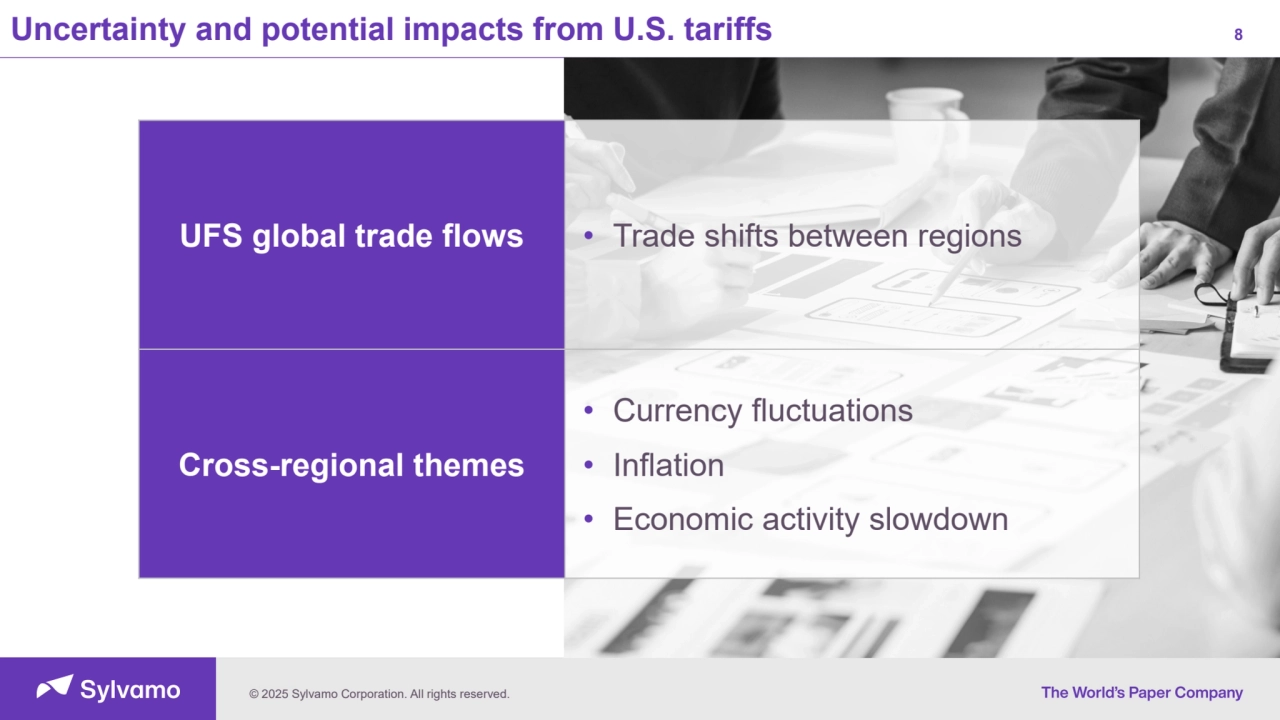
- 8. © 2025 Sylvamo Corporation. All rights reserved. Uncertainty and potential impacts from U.S. tariffs 8 UFS global trade flows • Trade shifts between regions Cross-regional themes • Currency fluctuations • Inflation • Economic activity slowdown
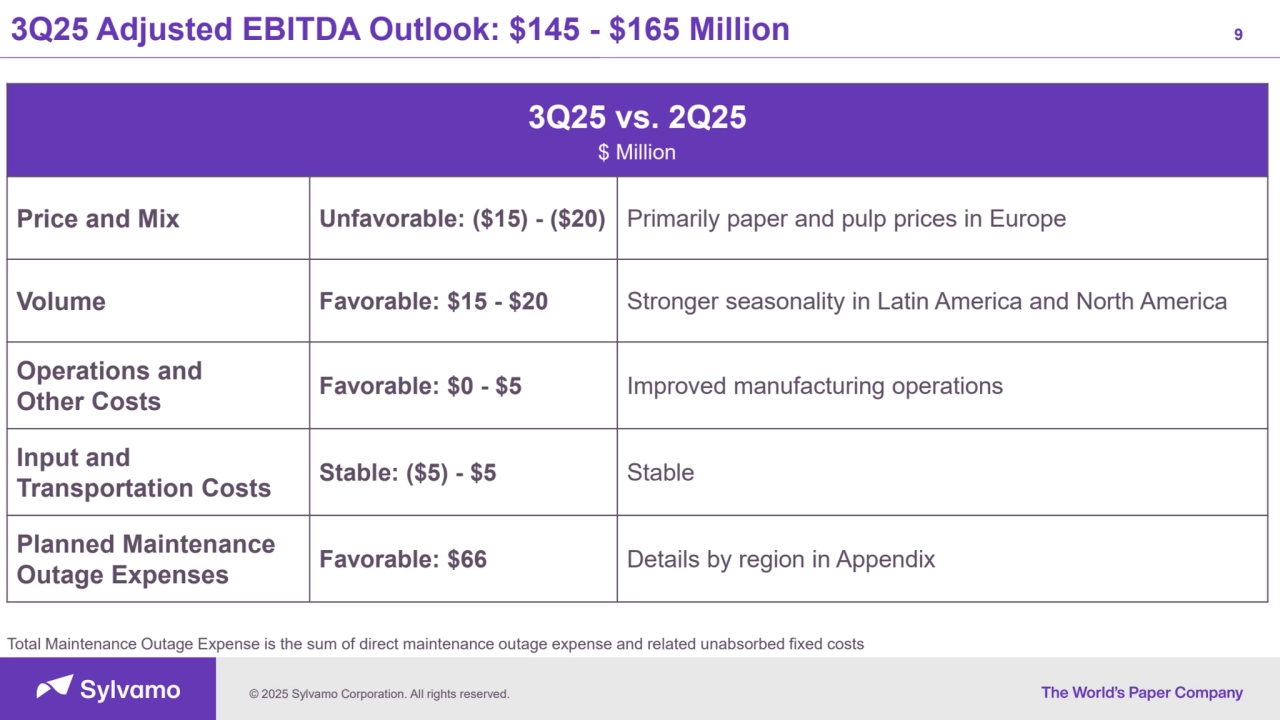
- 9. © 2025 Sylvamo Corporation. All rights reserved. 3Q25 Adjusted EBITDA Outlook: $145 - $165 Million 9 3Q25 vs. 2Q25 $ Million Price and Mix Unfavorable: ($15) - ($20) Primarily paper and pulp prices in Europe Volume Favorable: $15 - $20 Stronger seasonality in Latin America and North America Operations and Other Costs Favorable: $0 - $5 Improved manufacturing operations Input and Transportation Costs Stable: ($5) - $5 Stable Planned Maintenance Outage Expenses Favorable: $66 Details by region in Appendix Total Maintenance Outage Expense is the sum of direct maintenance outage expense and related unabsorbed fixed costs
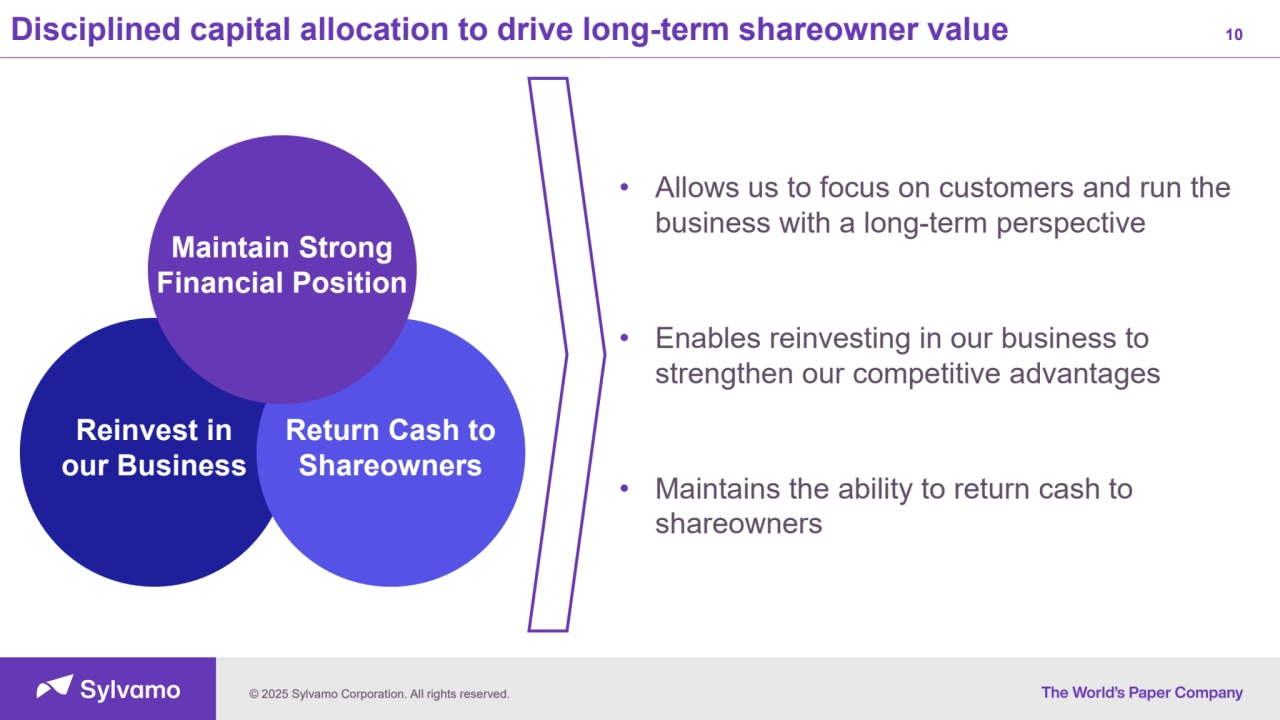
- 10. © 2025 Sylvamo Corporation. All rights reserved. Disciplined capital allocation to drive long-term shareowner value 10 Reinvest in our Business Maintain Strong Financial Position Return Cash to Shareowners • Allows us to focus on customers and run the business with a long-term perspective • Enables reinvesting in our business to strengthen our competitive advantages • Maintains the ability to return cash to shareowners
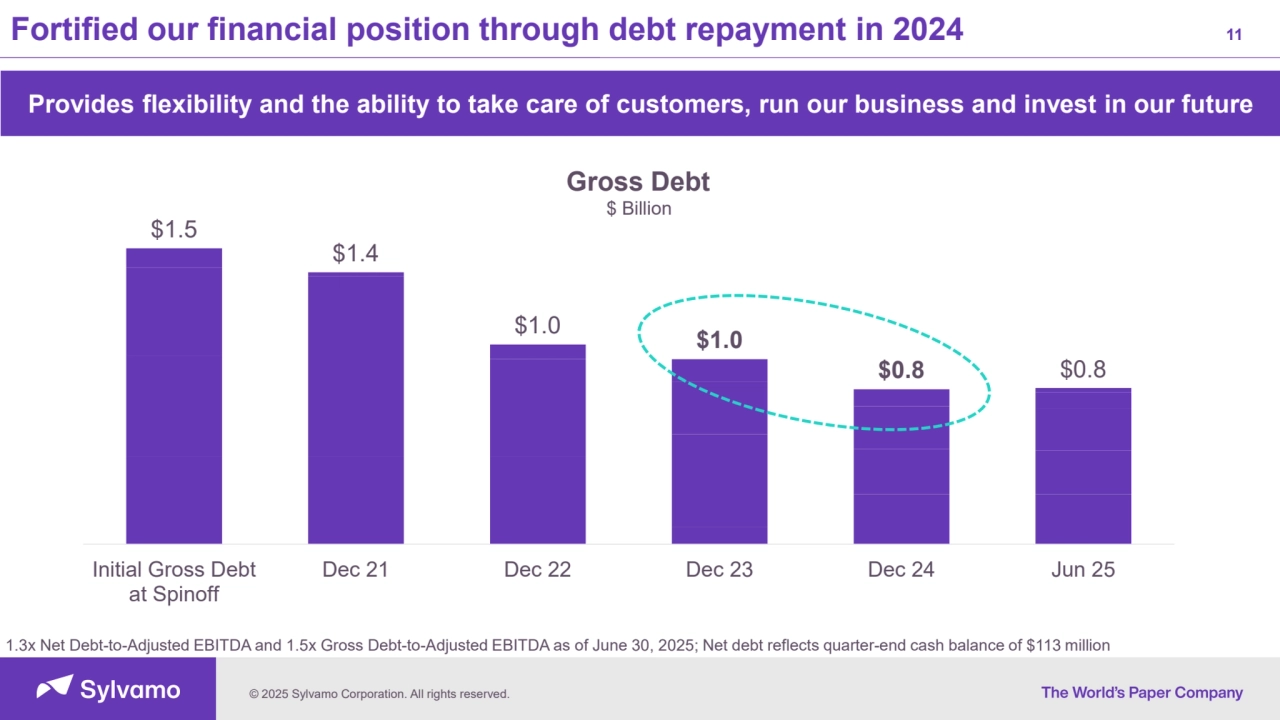
- 11. © 2025 Sylvamo Corporation. All rights reserved. Fortified our financial position through debt repayment in 2024 11 $1.5 $1.4 $1.0 $1.0 $0.8 $0.8 Initial Gross Debt at Spinoff Dec 21 Dec 22 Dec 23 Dec 24 Jun 25 Gross Debt $ Billion 1.3x Net Debt-to-Adjusted EBITDA and 1.5x Gross Debt-to-Adjusted EBITDA as of June 30, 2025; Net debt reflects quarter-end cash balance of $113 million Provides flexibility and the ability to take care of customers, run our business and invest in our future
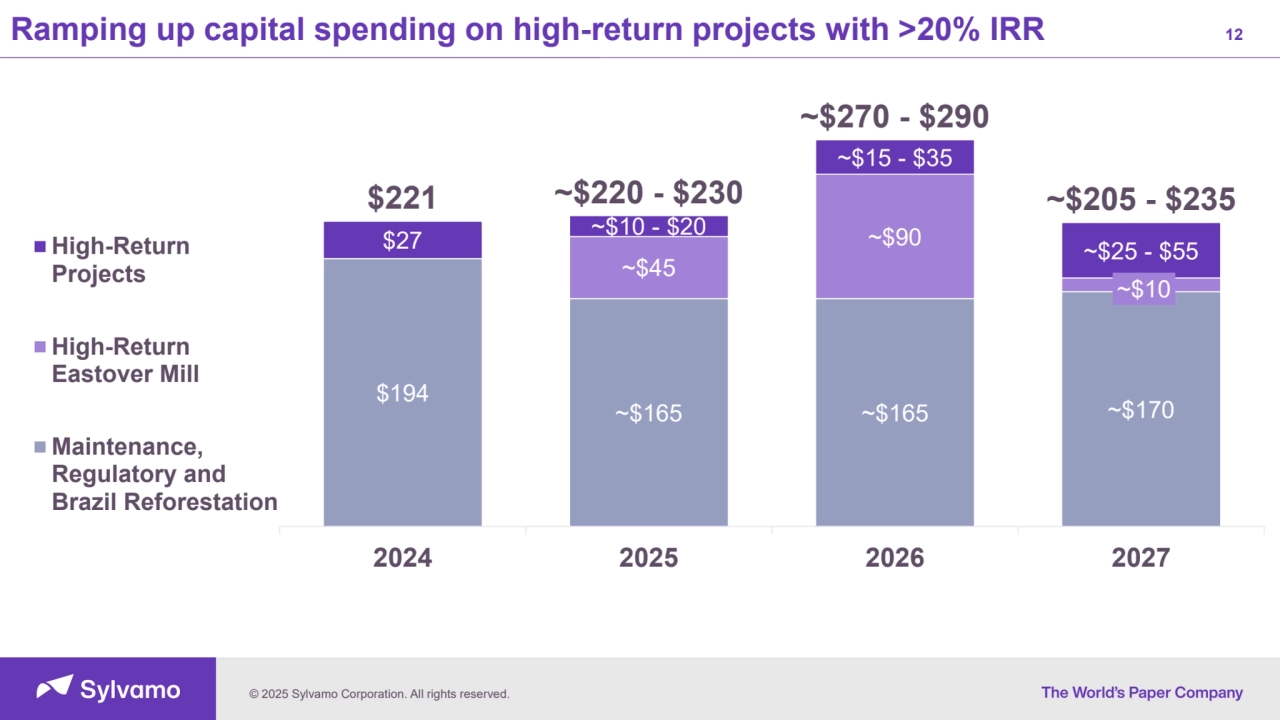
- 12. © 2025 Sylvamo Corporation. All rights reserved. Ramping up capital spending on high-return projects with >20% IRR 12 $194 ~$165 ~$165 ~$170 ~$45 ~$90 ~$10 $27 ~$10 - $20 ~$15 - $35 ~$25 - $55 $221 ~$220 - $230 ~$270 - $290 ~$205 - $235 2024 2025 2026 2027 High-Return Projects High-Return Eastover Mill Maintenance, Regulatory and Brazil Reforestation
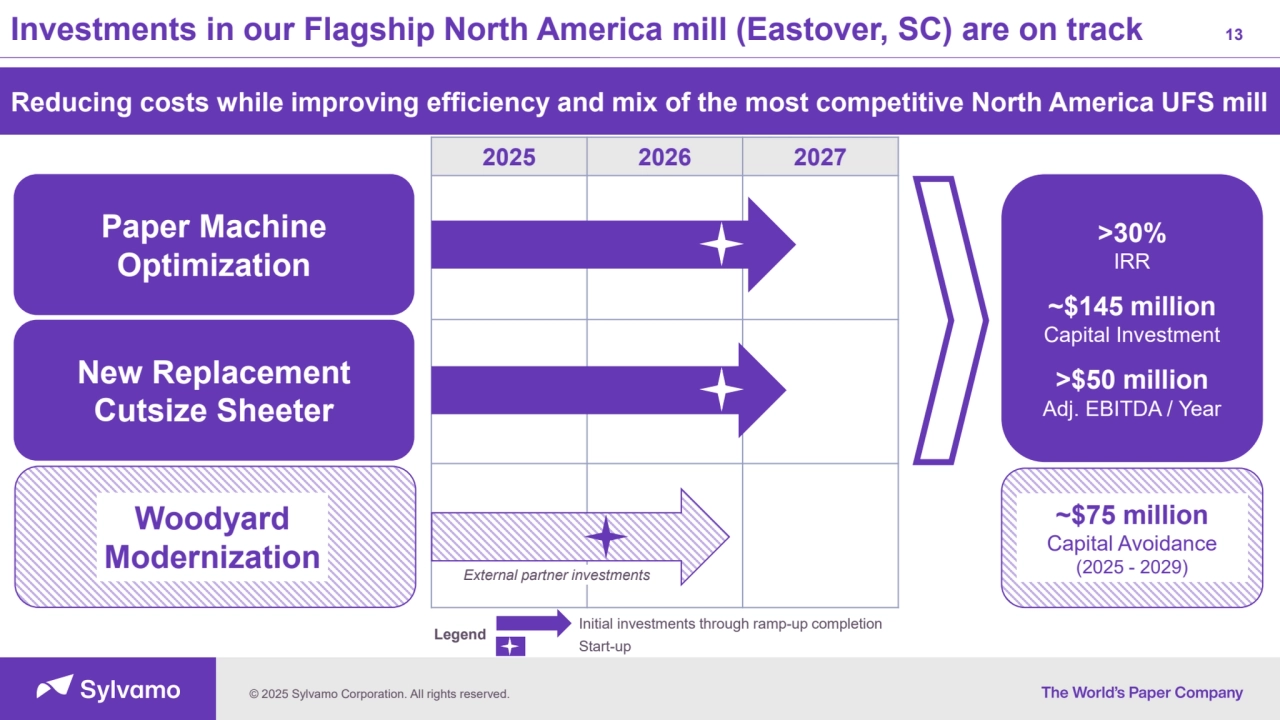
- 13. © 2025 Sylvamo Corporation. All rights reserved. Investments in our Flagship North America mill (Eastover, SC) are on track 13 Paper Machine Optimization New Replacement Cutsize Sheeter >30% IRR ~$145 million Capital Investment >$50 million Adj. EBITDA / Year Reducing costs while improving efficiency and mix of the most competitive North America UFS mill Woodyard Modernization 2025 2026 2027 $70 - $80 million Capital Avoidance (2025 - 2030) Initial investments through ramp-up completion Start-up Legend External partner investments Woodyard Modernization ~$75 million Capital Avoidance (2025 - 2029)
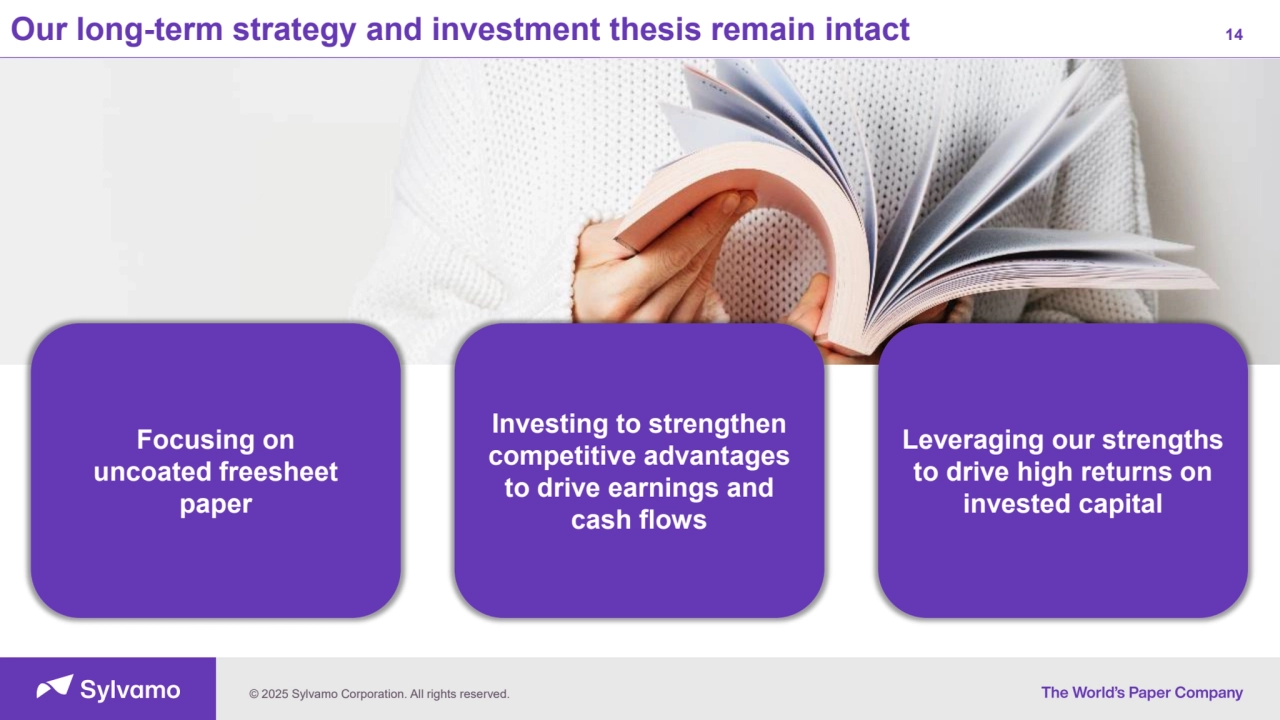
- 14. © 2025 Sylvamo Corporation. All rights reserved. Our long-term strategy and investment thesis remain intact 14 Focusing on uncoated freesheet paper Leveraging our strengths to drive high returns on invested capital Investing to strengthen competitive advantages to drive earnings and cash flows
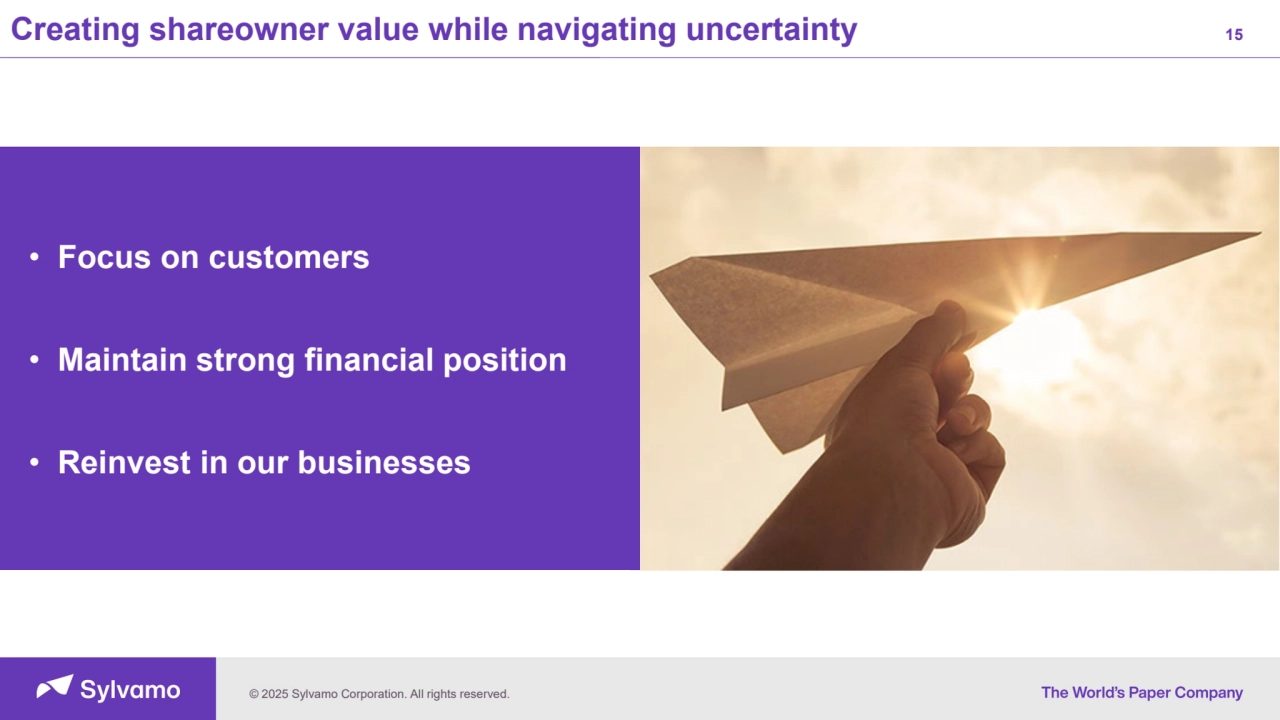
- 15. © 2025 Sylvamo Corporation. All rights reserved. Creating shareowner value while navigating uncertainty 15 • Focus on customers • Maintain strong financial position • Reinvest in our businesses
- 16. © 2025 Sylvamo Corporation. All rights reserved. 16 Appendix
- 17. © 2025 Sylvamo Corporation. All rights reserved. Contacts 17 Investor Relations Hans Bjorkman Vice President, Investor Relations +1-901-519-8030 hans.bjorkman@sylvamo.com Media Adam Ghassemi Director, Corporate Communications +1-901-519-8115 adam.ghassemi@sylvamo.com
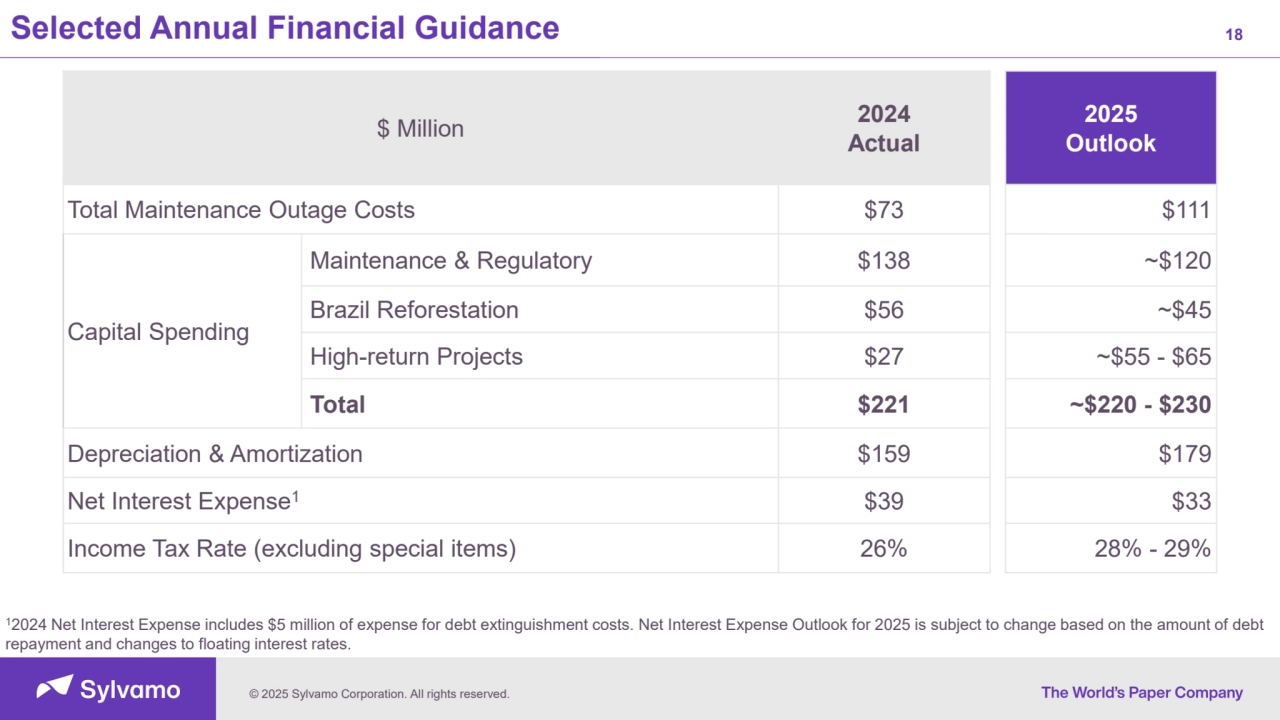
- 18. © 2025 Sylvamo Corporation. All rights reserved. Selected Annual Financial Guidance 18 $ Million 2024 Actual 2025 Outlook Total Maintenance Outage Costs $73 $111 Capital Spending Maintenance & Regulatory $138 ~$120 Brazil Reforestation $56 ~$45 High-return Projects $27 ~$55 - $65 Total $221 ~$220 - $230 Depreciation & Amortization $159 $179 Net Interest Expense1 $39 $33 Income Tax Rate (excluding special items) 26% 28% - 29% 12024 Net Interest Expense includes $5 million of expense for debt extinguishment costs. Net Interest Expense Outlook for 2025 is subject to change based on the amount of debt repayment and changes to floating interest rates.
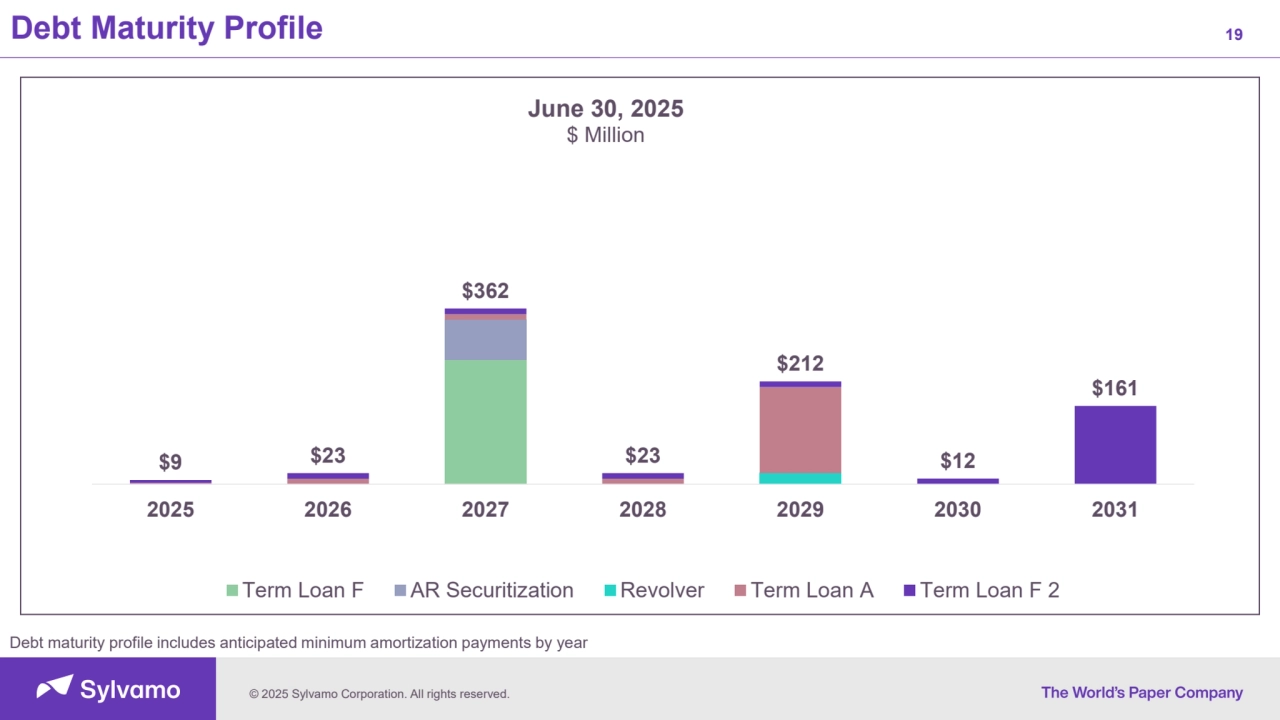
- 19. © 2025 Sylvamo Corporation. All rights reserved. Debt Maturity Profile 19 $9 $23 $362 $23 $212 $12 $161 2025 2026 2027 2028 2029 2030 2031 June 30, 2025 $ Million Term Loan F AR Securitization Revolver Term Loan A Term Loan F 2 Debt maturity profile includes anticipated minimum amortization payments by year
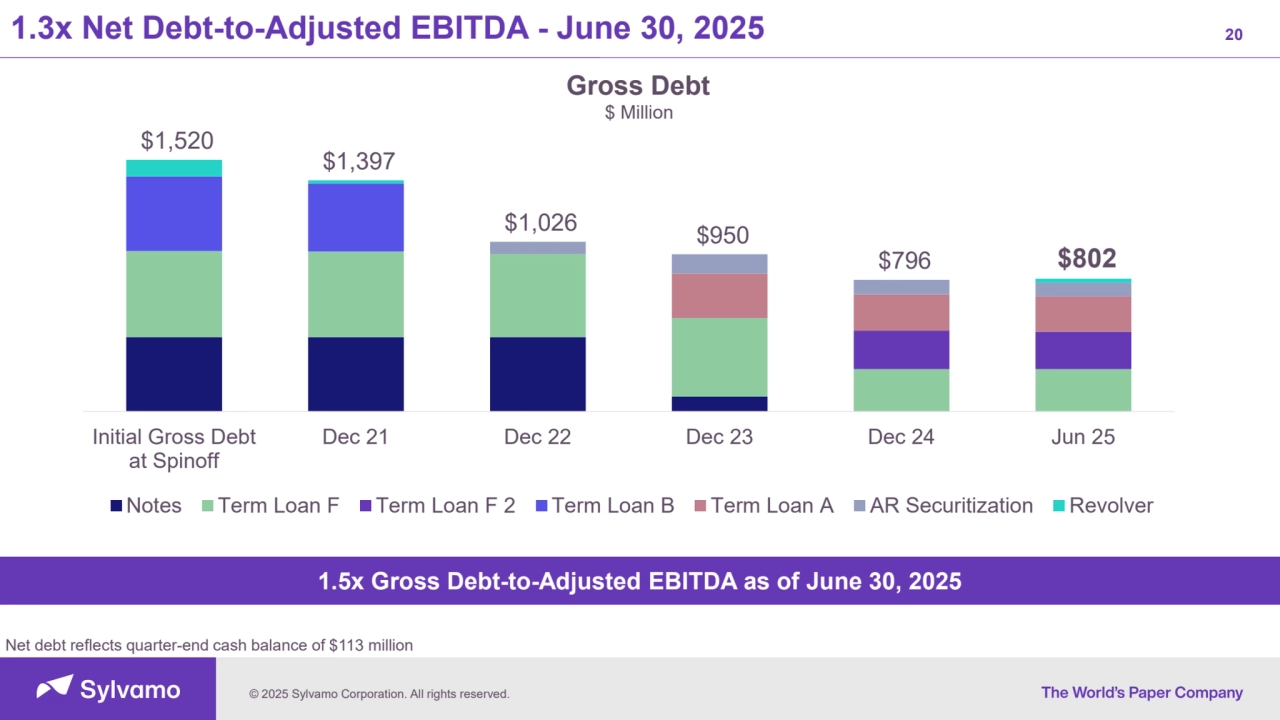
- 20. © 2025 Sylvamo Corporation. All rights reserved. 1.3x Net Debt-to-Adjusted EBITDA - June 30, 2025 20 $1,520 $1,397 $1,026 $950 $796 $802 Initial Gross Debt at Spinoff Dec 21 Dec 22 Dec 23 Dec 24 Jun 25 Notes Term Loan F Term Loan F 2 Term Loan B Term Loan A AR Securitization Revolver Gross Debt $ Million Net debt reflects quarter-end cash balance of $113 million 1.5x Gross Debt-to-Adjusted EBITDA as of June 30, 2025
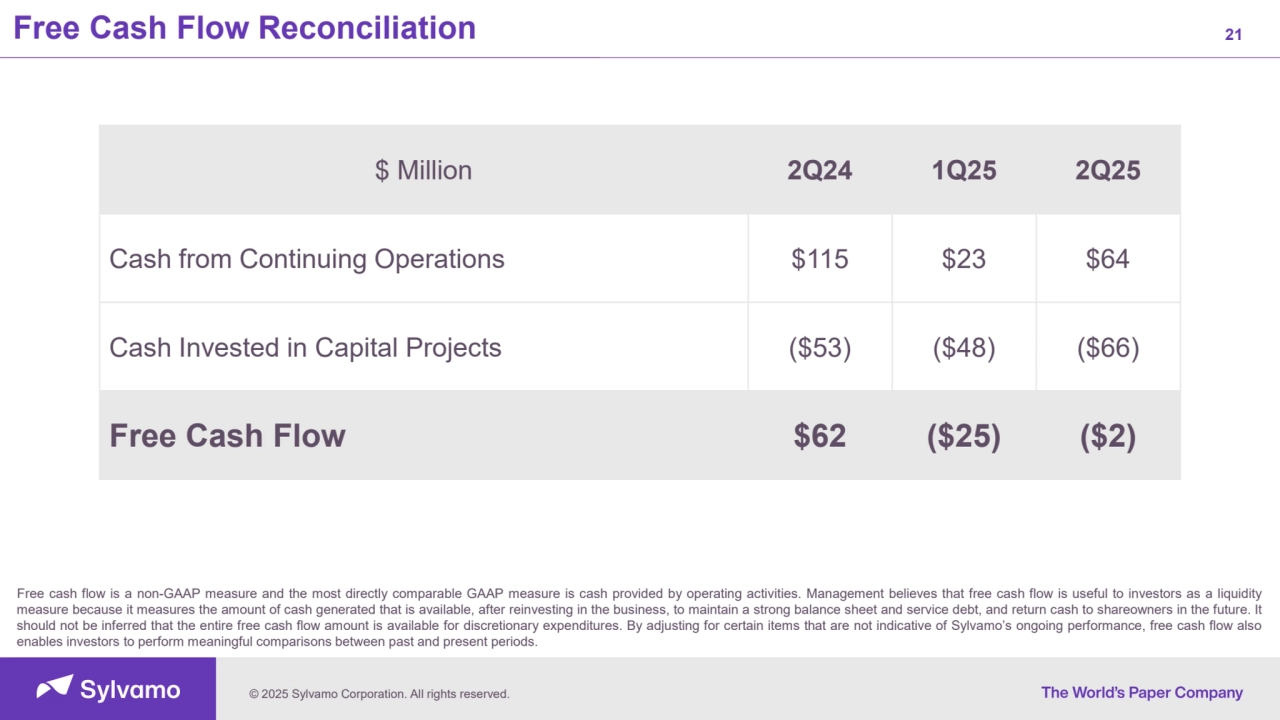
- 21. © 2025 Sylvamo Corporation. All rights reserved. Free Cash Flow Reconciliation 21 $ Million 2Q24 1Q25 2Q25 Cash from Continuing Operations $115 $23 $64 Cash Invested in Capital Projects ($53) ($48) ($66) Free Cash Flow $62 ($25) ($2) Free cash flow is a non-GAAP measure and the most directly comparable GAAP measure is cash provided by operating activities. Management believes that free cash flow is useful to investors as a liquidity measure because it measures the amount of cash generated that is available, after reinvesting in the business, to maintain a strong balance sheet and service debt, and return cash to shareowners in the future. It should not be inferred that the entire free cash flow amount is available for discretionary expenditures. By adjusting for certain items that are not indicative of Sylvamo’s ongoing performance, free cash flow also enables investors to perform meaningful comparisons between past and present periods.
- 22. © 2025 Sylvamo Corporation. All rights reserved. 2Q25 vs. 1Q25 Free Cash Flow 22 $ Million 1Q25 2Q25 Variance Adjusted EBITDA $90 $82 ($8) Cash Taxes ($14) ($35) ($21) Cash Interest ($6) ($10) ($4) Cash Special Items - ($2) ($2) Other Changes in Working Capital ($47) $29 $76 Cash Provided by Operating Activities $23 $64 $41 Capital Spending ($48) ($66) ($18) Free Cash Flow ($25) ($2) $23
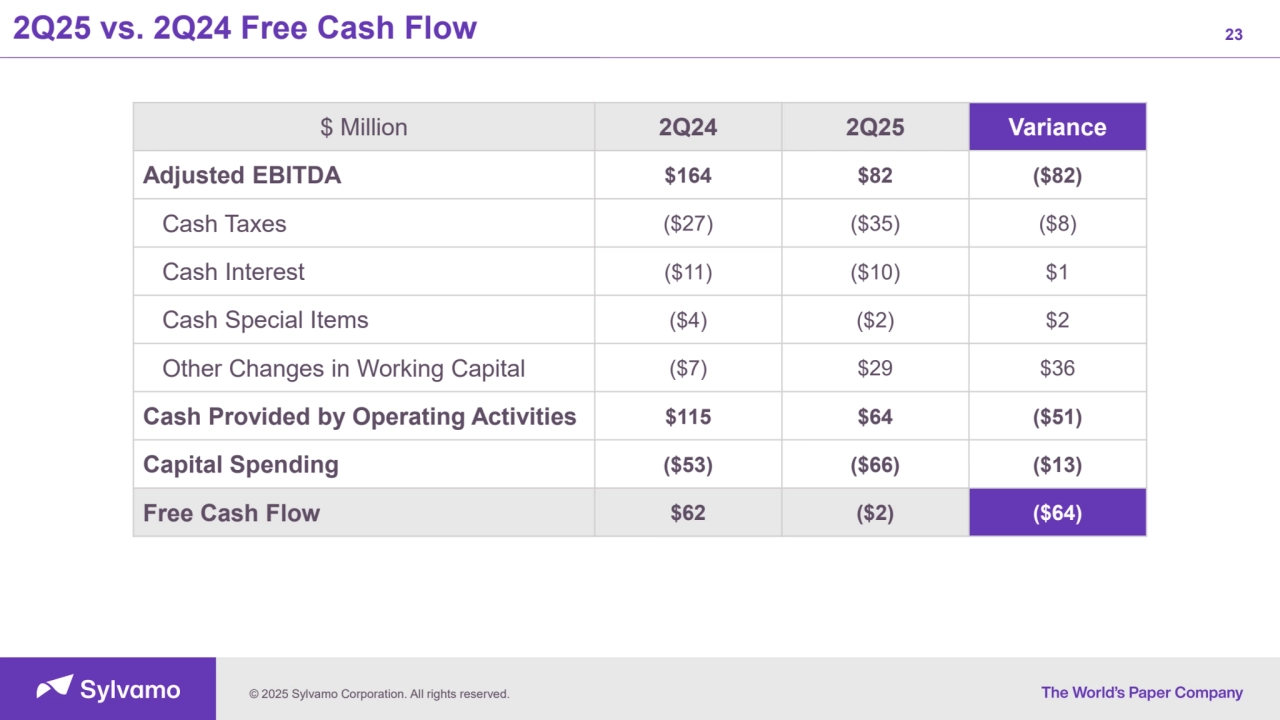
- 23. © 2025 Sylvamo Corporation. All rights reserved. 2Q25 vs. 2Q24 Free Cash Flow 23 $ Million 2Q24 2Q25 Variance Adjusted EBITDA $164 $82 ($82) Cash Taxes ($27) ($35) ($8) Cash Interest ($11) ($10) $1 Cash Special Items ($4) ($2) $2 Other Changes in Working Capital ($7) $29 $36 Cash Provided by Operating Activities $115 $64 ($51) Capital Spending ($53) ($66) ($13) Free Cash Flow $62 ($2) ($64)
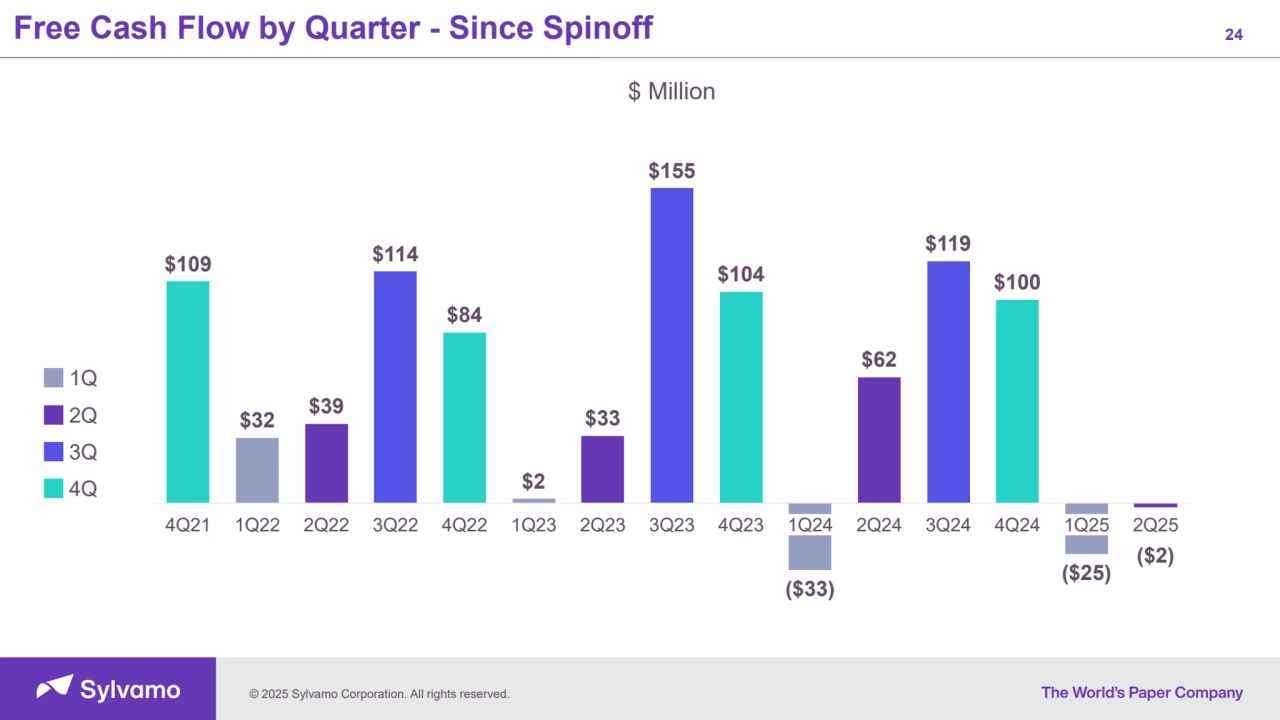
- 24. © 2025 Sylvamo Corporation. All rights reserved. 24 $109 $32 $39 $114 $84 $2 $33 $155 $104 ($33) $62 $119 $100 ($25) ($2) 4Q21 1Q22 2Q22 3Q22 4Q22 1Q23 2Q23 3Q23 4Q23 1Q24 2Q24 3Q24 4Q24 1Q25 2Q25 Free Cash Flow by Quarter - Since Spinoff $ Million 1Q 2Q 3Q 4Q
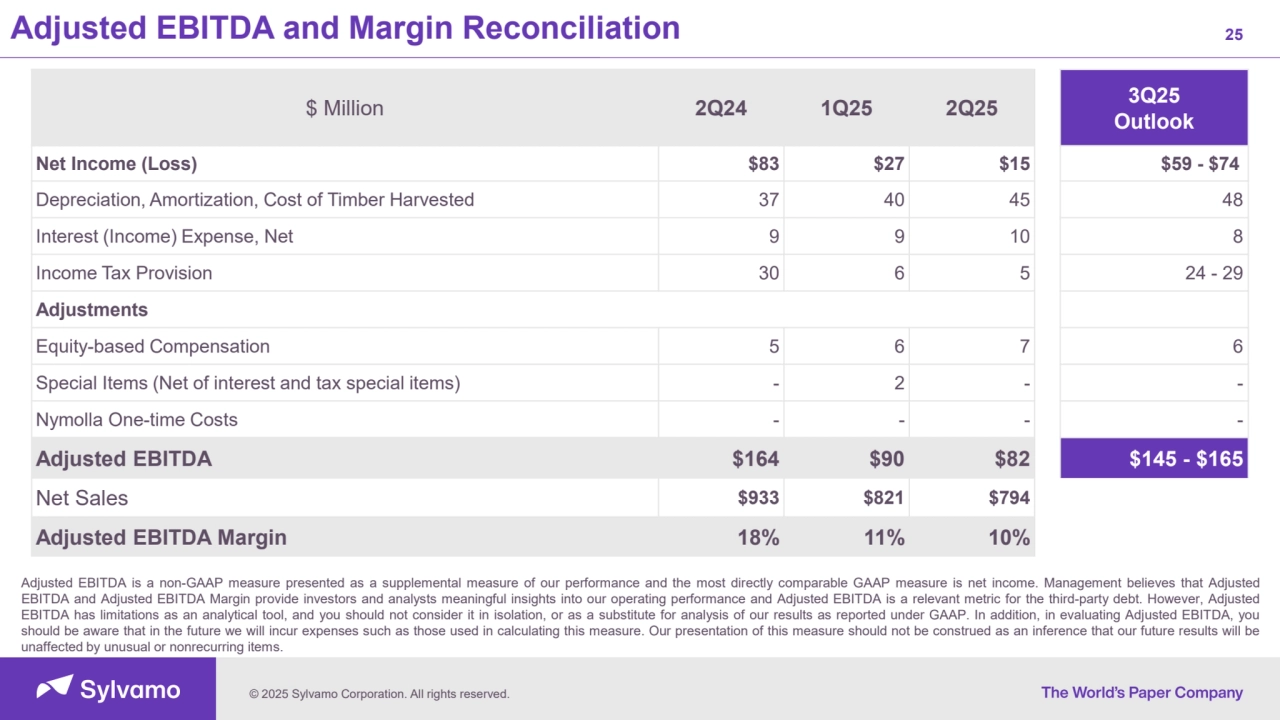
- 25. © 2025 Sylvamo Corporation. All rights reserved. Adjusted EBITDA and Margin Reconciliation 25 Adjusted EBITDA is a non-GAAP measure presented as a supplemental measure of our performance and the most directly comparable GAAP measure is net income. Management believes that Adjusted EBITDA and Adjusted EBITDA Margin provide investors and analysts meaningful insights into our operating performance and Adjusted EBITDA is a relevant metric for the third-party debt. However, Adjusted EBITDA has limitations as an analytical tool, and you should not consider it in isolation, or as a substitute for analysis of our results as reported under GAAP. In addition, in evaluating Adjusted EBITDA, you should be aware that in the future we will incur expenses such as those used in calculating this measure. Our presentation of this measure should not be construed as an inference that our future results will be unaffected by unusual or nonrecurring items. $ Million 2Q24 1Q25 2Q25 3Q25 Outlook Net Income (Loss) $83 $27 $15 $59 - $74 Depreciation, Amortization, Cost of Timber Harvested 37 40 45 48 Interest (Income) Expense, Net 9 9 10 8 Income Tax Provision 30 6 5 24 - 29 Adjustments Equity-based Compensation 5 6 7 6 Special Items (Net of interest and tax special items) - 2 - - Nymolla One-time Costs - - - - Adjusted EBITDA $164 $90 $82 $145 - $165 Net Sales $933 $821 $794 Adjusted EBITDA Margin 18% 11% 10%
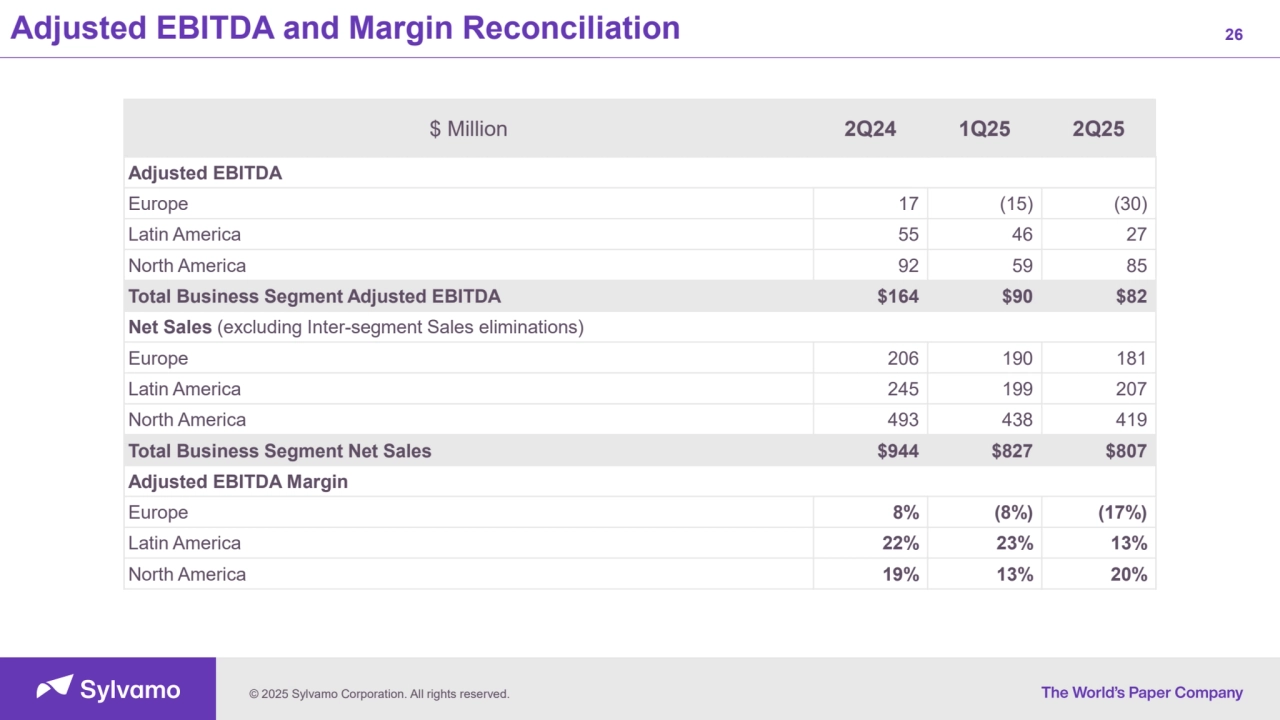
- 26. © 2025 Sylvamo Corporation. All rights reserved. Adjusted EBITDA and Margin Reconciliation 26 $ Million 2Q24 1Q25 2Q25 Adjusted EBITDA Europe 17 (15) (30) Latin America 55 46 27 North America 92 59 85 Total Business Segment Adjusted EBITDA $164 $90 $82 Net Sales (excluding Inter-segment Sales eliminations) Europe 206 190 181 Latin America 245 199 207 North America 493 438 419 Total Business Segment Net Sales $944 $827 $807 Adjusted EBITDA Margin Europe 8% (8%) (17%) Latin America 22% 23% 13% North America 19% 13% 20%
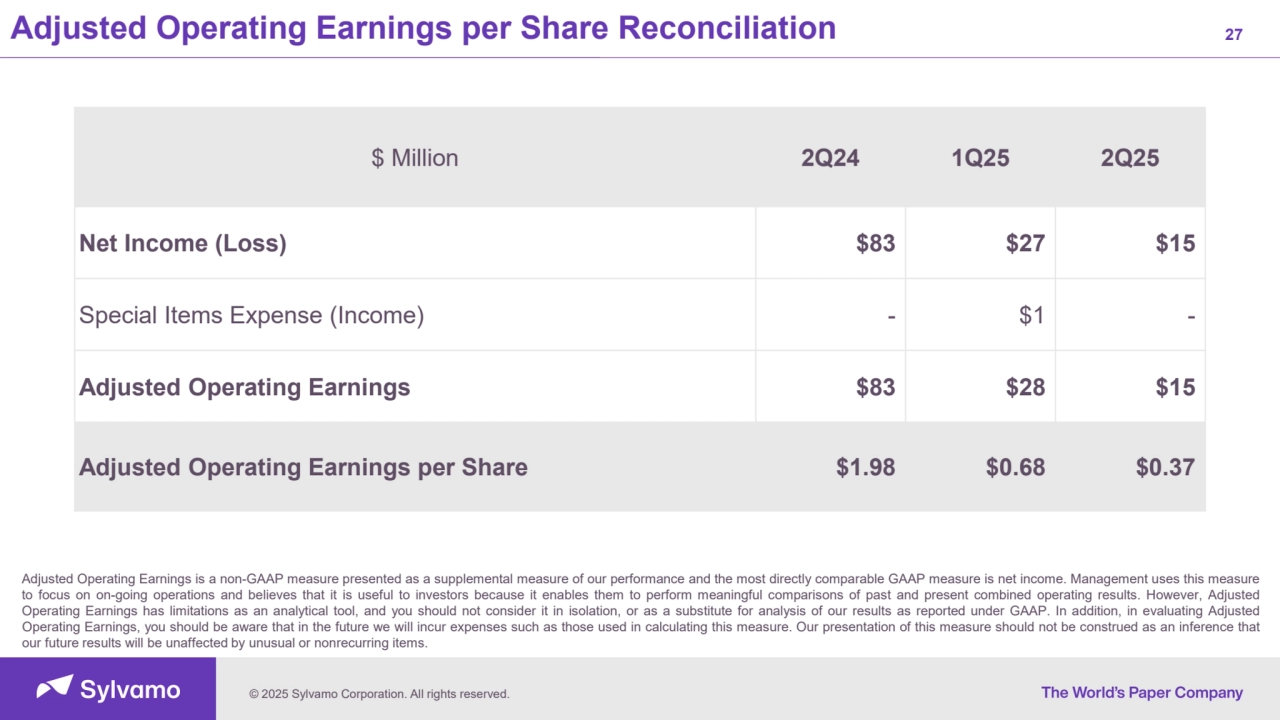
- 27. © 2025 Sylvamo Corporation. All rights reserved. Adjusted Operating Earnings per Share Reconciliation 27 $ Million 2Q24 1Q25 2Q25 Net Income (Loss) $83 $27 $15 Special Items Expense (Income) - $1 - Adjusted Operating Earnings $83 $28 $15 Adjusted Operating Earnings per Share $1.98 $0.68 $0.37 Adjusted Operating Earnings is a non-GAAP measure presented as a supplemental measure of our performance and the most directly comparable GAAP measure is net income. Management uses this measure to focus on on-going operations and believes that it is useful to investors because it enables them to perform meaningful comparisons of past and present combined operating results. However, Adjusted Operating Earnings has limitations as an analytical tool, and you should not consider it in isolation, or as a substitute for analysis of our results as reported under GAAP. In addition, in evaluating Adjusted Operating Earnings, you should be aware that in the future we will incur expenses such as those used in calculating this measure. Our presentation of this measure should not be construed as an inference that our future results will be unaffected by unusual or nonrecurring items.
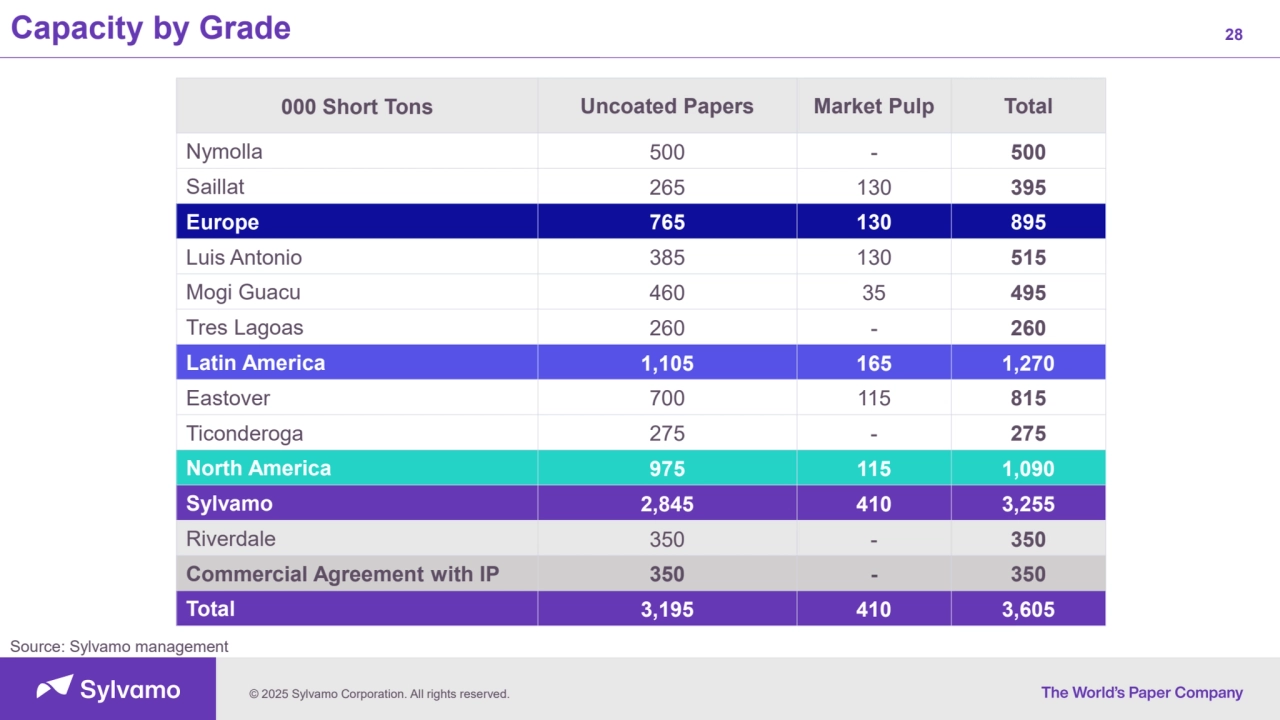
- 28. © 2025 Sylvamo Corporation. All rights reserved. Capacity by Grade 28 000 Short Tons Uncoated Papers Market Pulp Total Nymolla 500 - 500 Saillat 265 130 395 Europe 765 130 895 Luis Antonio 385 130 515 Mogi Guacu 460 35 495 Tres Lagoas 260 - 260 Latin America 1,105 165 1,270 Eastover 700 115 815 Ticonderoga 275 - 275 North America 975 115 1,090 Sylvamo 2,845 410 3,255 Riverdale 350 - 350 Commercial Agreement with IP 350 - 350 Total 3,195 410 3,605 Source: Sylvamo management
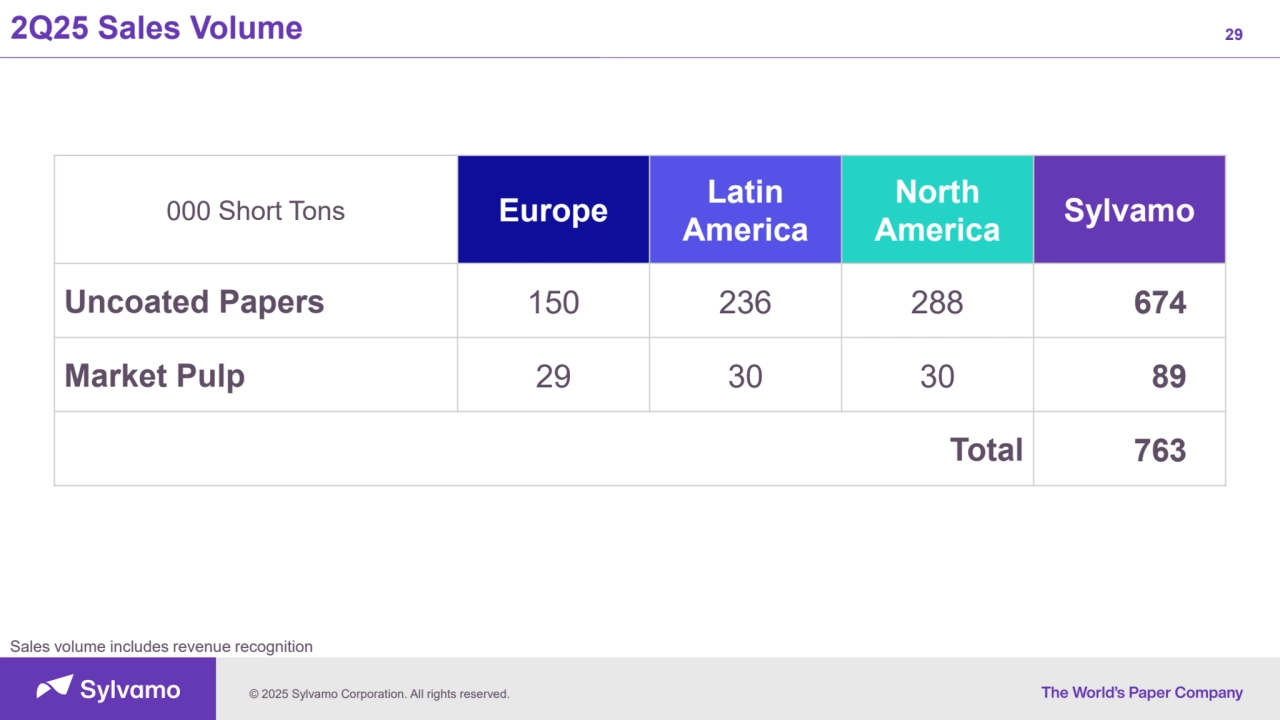
- 29. © 2025 Sylvamo Corporation. All rights reserved. 2Q25 Sales Volume 29 000 Short Tons Europe Latin America North America Sylvamo Uncoated Papers 150 236 288 674 Market Pulp 29 30 30 89 Total 763 Sales volume includes revenue recognition
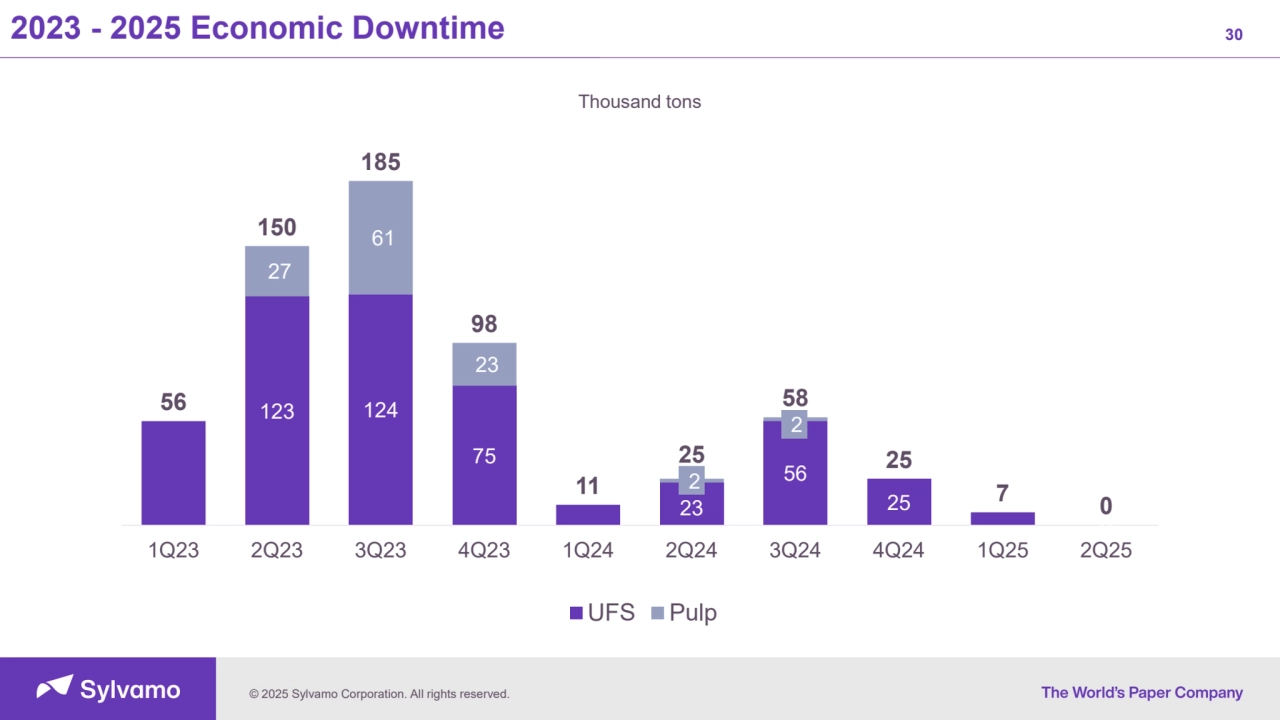
- 30. © 2025 Sylvamo Corporation. All rights reserved. 30 123 124 75 23 56 25 0 27 61 23 2 2 56 150 185 98 11 25 58 25 7 0 1Q23 2Q23 3Q23 4Q23 1Q24 2Q24 3Q24 4Q24 1Q25 2Q25 UFS Pulp 2023 - 2025 Economic Downtime Thousand tons
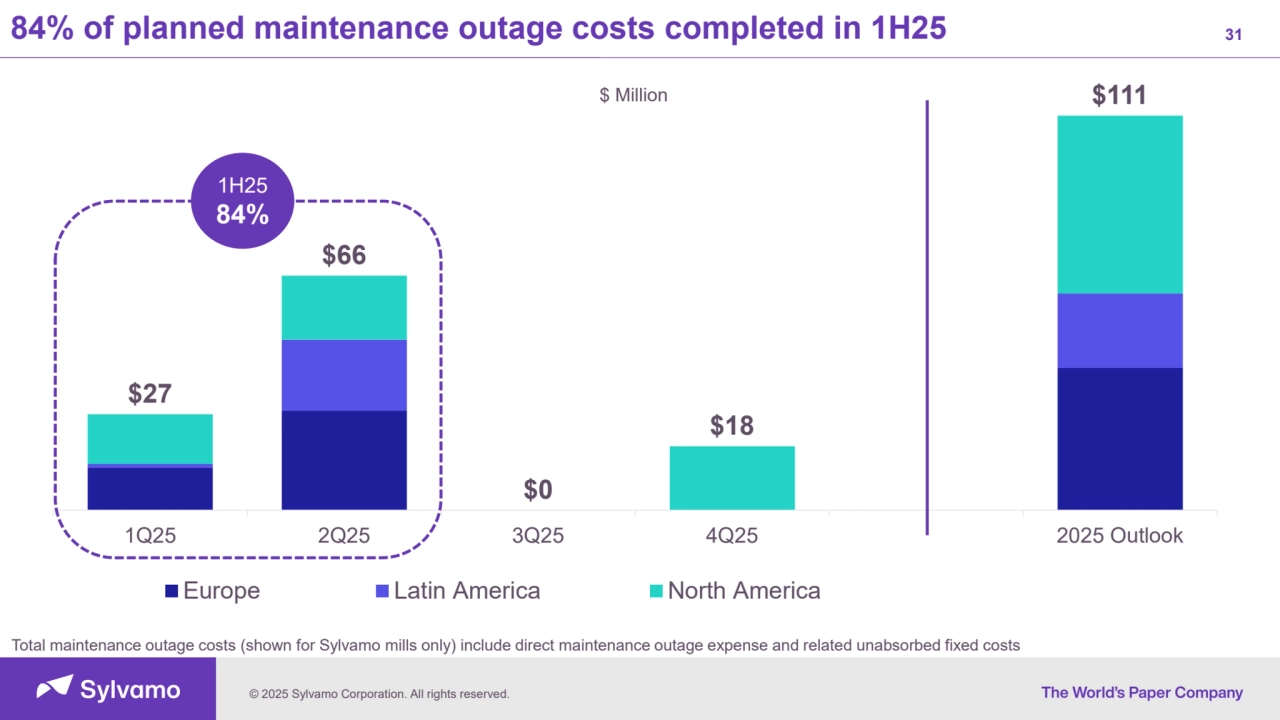
- 31. © 2025 Sylvamo Corporation. All rights reserved. 84% of planned maintenance outage costs completed in 1H25 31 Total maintenance outage costs (shown for Sylvamo mills only) include direct maintenance outage expense and related unabsorbed fixed costs $27 $66 $0 $18 $111 1Q25 2Q25 3Q25 4Q25 2025 Outlook Europe Latin America North America 1H25 84% $ Million
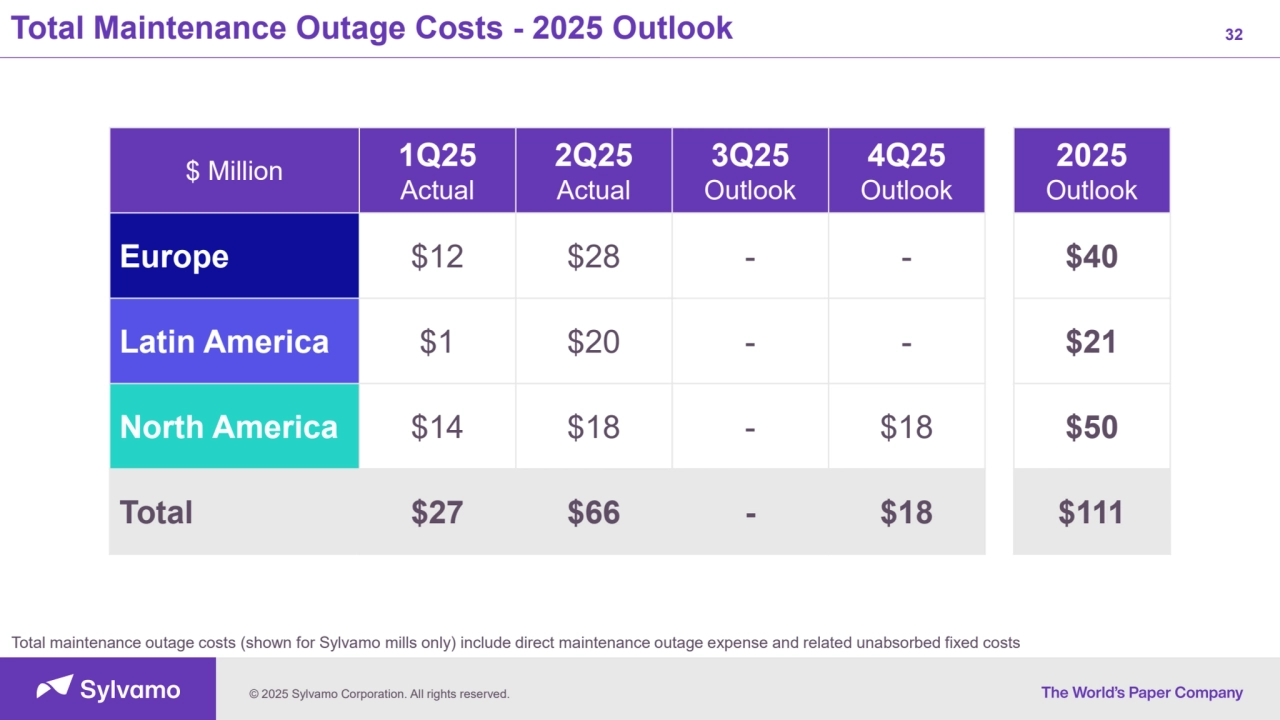
- 32. © 2025 Sylvamo Corporation. All rights reserved. Total Maintenance Outage Costs - 2025 Outlook 32 $ Million 1Q25 Actual 2Q25 Actual 3Q25 Outlook 4Q25 Outlook 2025 Outlook Europe $12 $28 - - $40 Latin America $1 $20 - - $21 North America $14 $18 - $18 $50 Total $27 $66 - $18 $111 Total maintenance outage costs (shown for Sylvamo mills only) include direct maintenance outage expense and related unabsorbed fixed costs
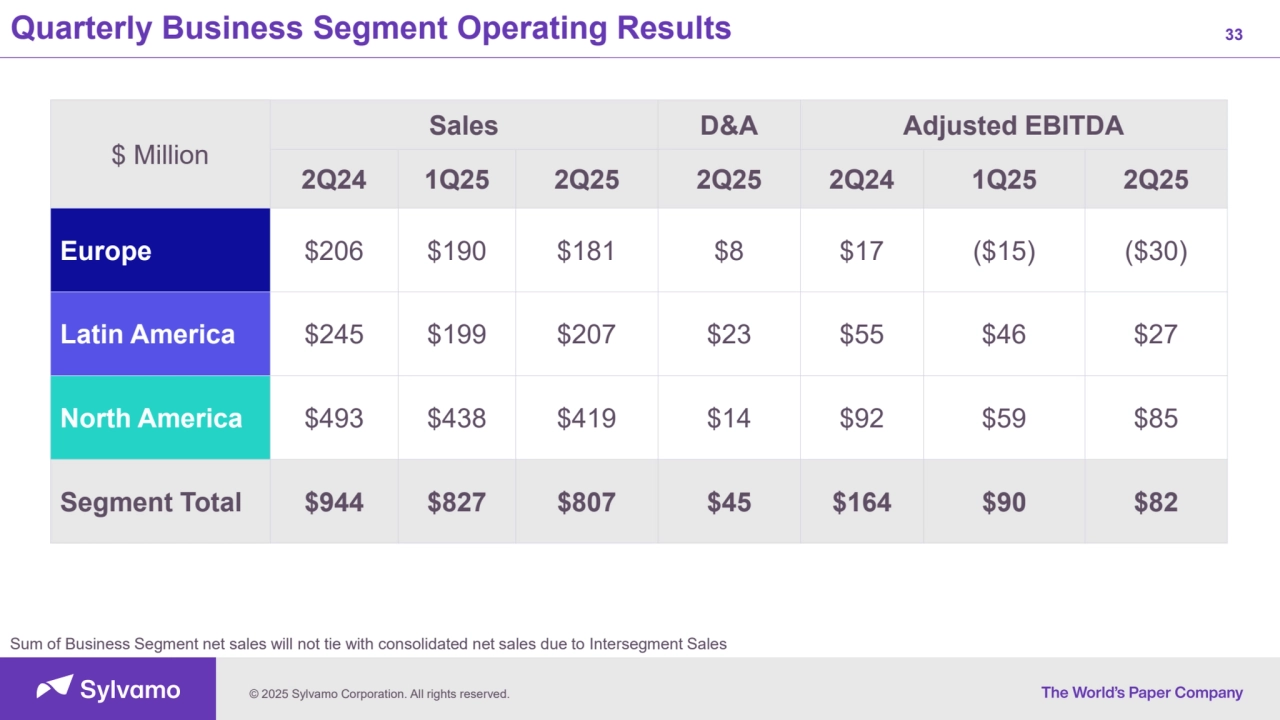
- 33. © 2025 Sylvamo Corporation. All rights reserved. Quarterly Business Segment Operating Results 33 $ Million Sales D&A Adjusted EBITDA 2Q24 1Q25 2Q25 2Q25 2Q24 1Q25 2Q25 Europe $206 $190 $181 $8 $17 ($15) ($30) Latin America $245 $199 $207 $23 $55 $46 $27 North America $493 $438 $419 $14 $92 $59 $85 Segment Total $944 $827 $807 $45 $164 $90 $82 Sum of Business Segment net sales will not tie with consolidated net sales due to Intersegment Sales
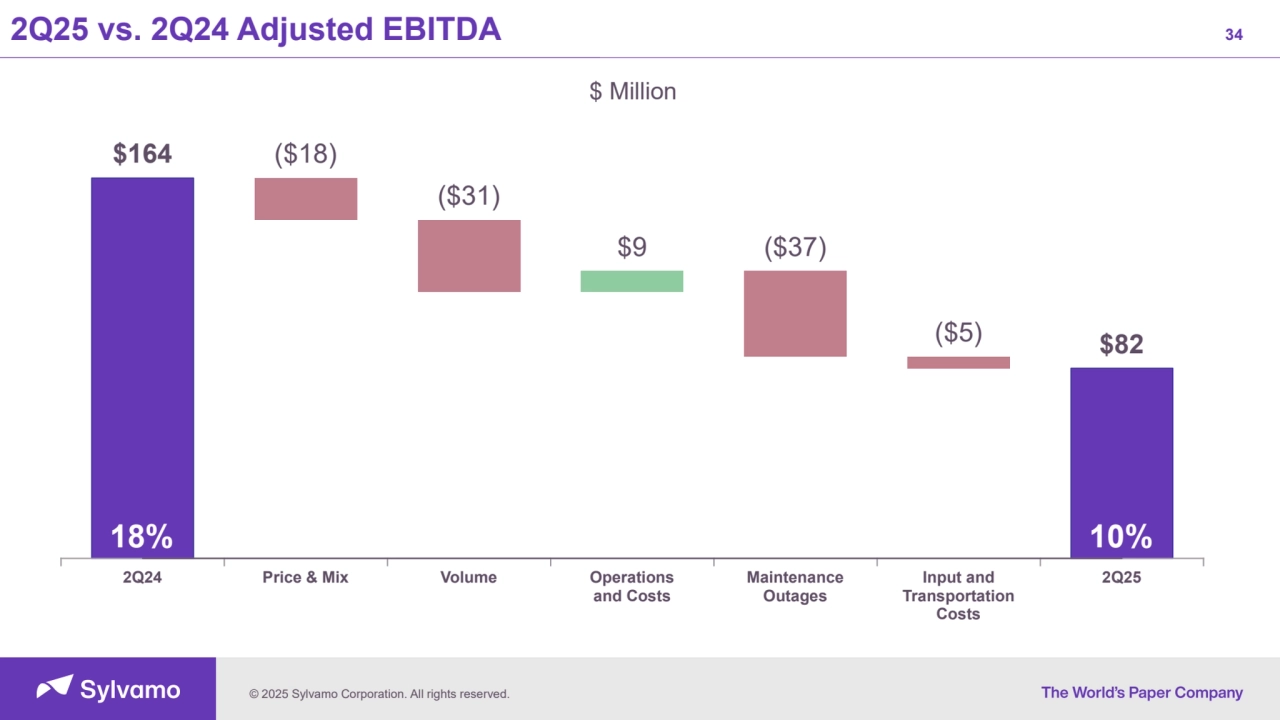
- 34. © 2025 Sylvamo Corporation. All rights reserved. 34 $164 ($18) ($31) $9 ($37) ($5) $82 2Q24 Price & Mix Volume Operations and Costs Maintenance Outages Input and Transportation Costs 2Q25 2Q25 vs. 2Q24 Adjusted EBITDA 10% $ Million 18%
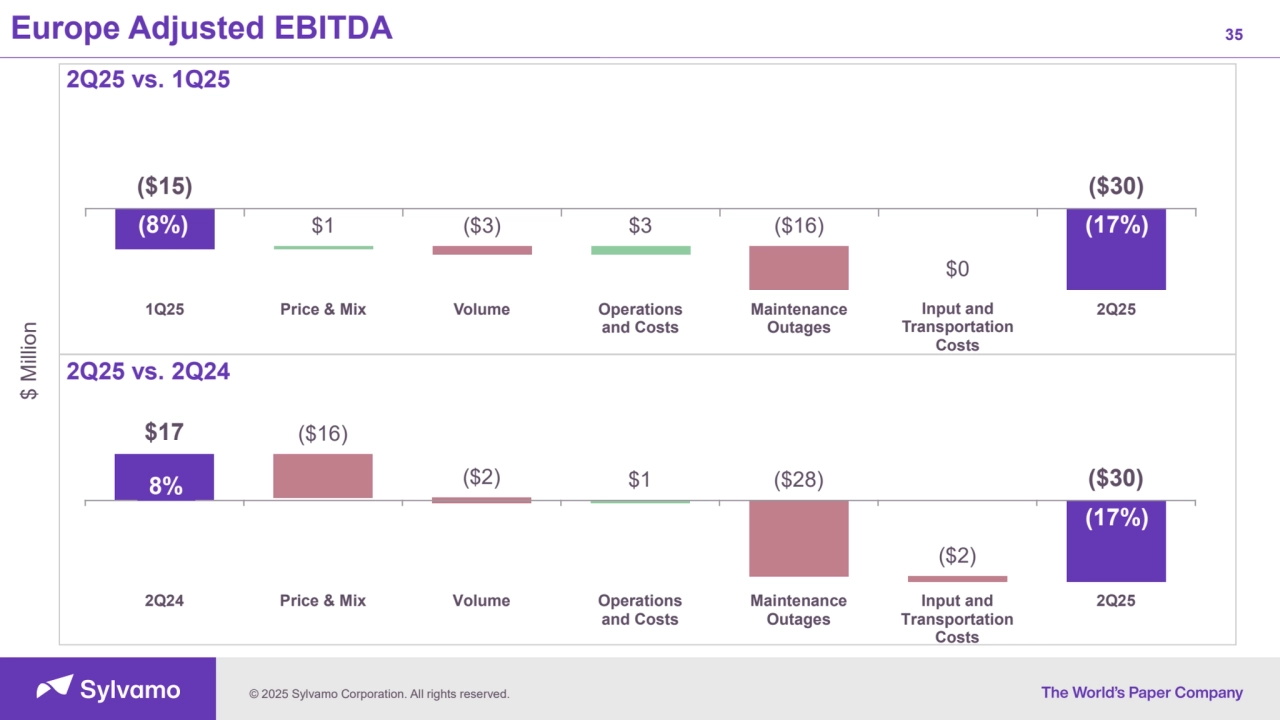
- 35. © 2025 Sylvamo Corporation. All rights reserved. 35 ($15) $1 ($3) $3 ($16) $0 ($30) 1Q25 Price & Mix Volume Operations and Costs Maintenance Outages Input and Transportation Costs 2Q25 Europe Adjusted EBITDA $ Million $17 ($16) ($2) $1 ($28) ($2) ($30) 2Q24 Price & Mix Volume Operations and Costs Maintenance Outages Input and Transportation Costs 2Q25 (17%) 2Q25 vs. 1Q25 2Q25 vs. 2Q24 (17%) (8%) 8%
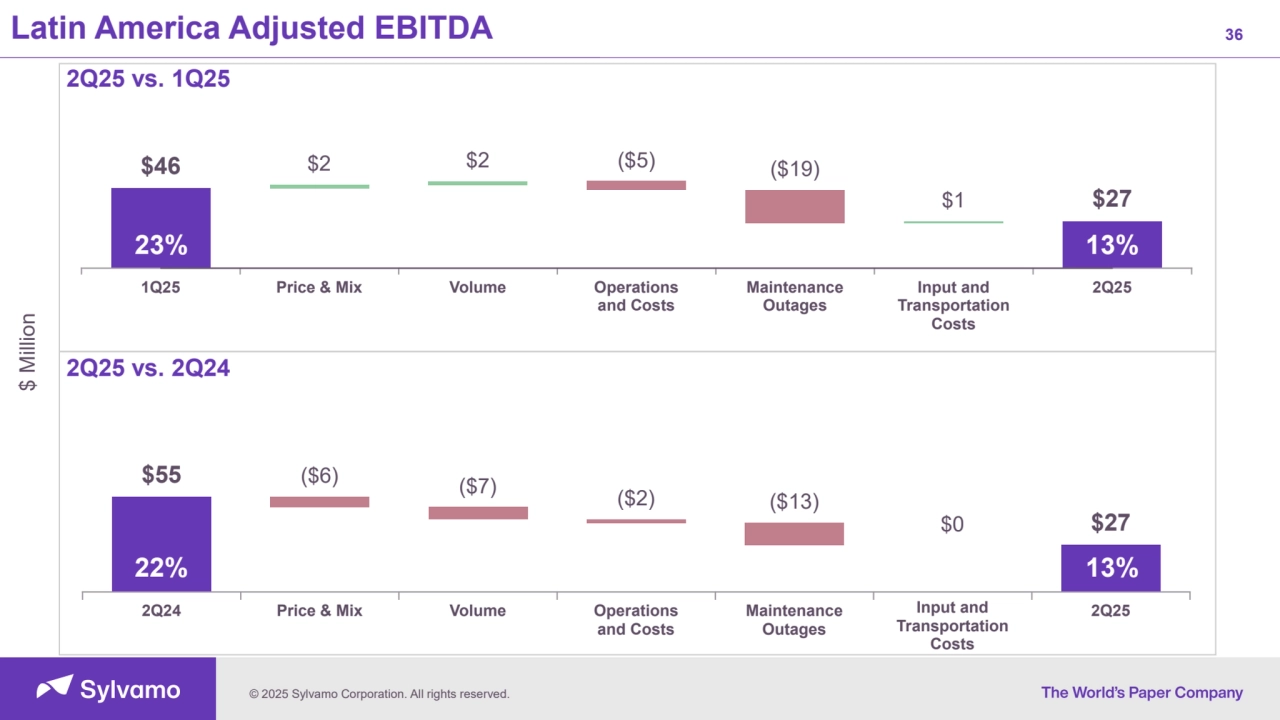
- 36. © 2025 Sylvamo Corporation. All rights reserved. 36 $46 $2 $2 ($5) ($19) $1 $27 1Q25 Price & Mix Volume Operations and Costs Maintenance Outages Input and Transportation Costs 2Q25 9% Latin America Adjusted EBITDA $ Million 19%$55 ($6) ($7) ($2) ($13) $0 $27 2Q24 Price & Mix Volume Operations and Costs Maintenance Outages Input and Transportation Costs 2Q25 22% 13% 23% 13% 2Q25 vs. 1Q25 2Q25 vs. 2Q24
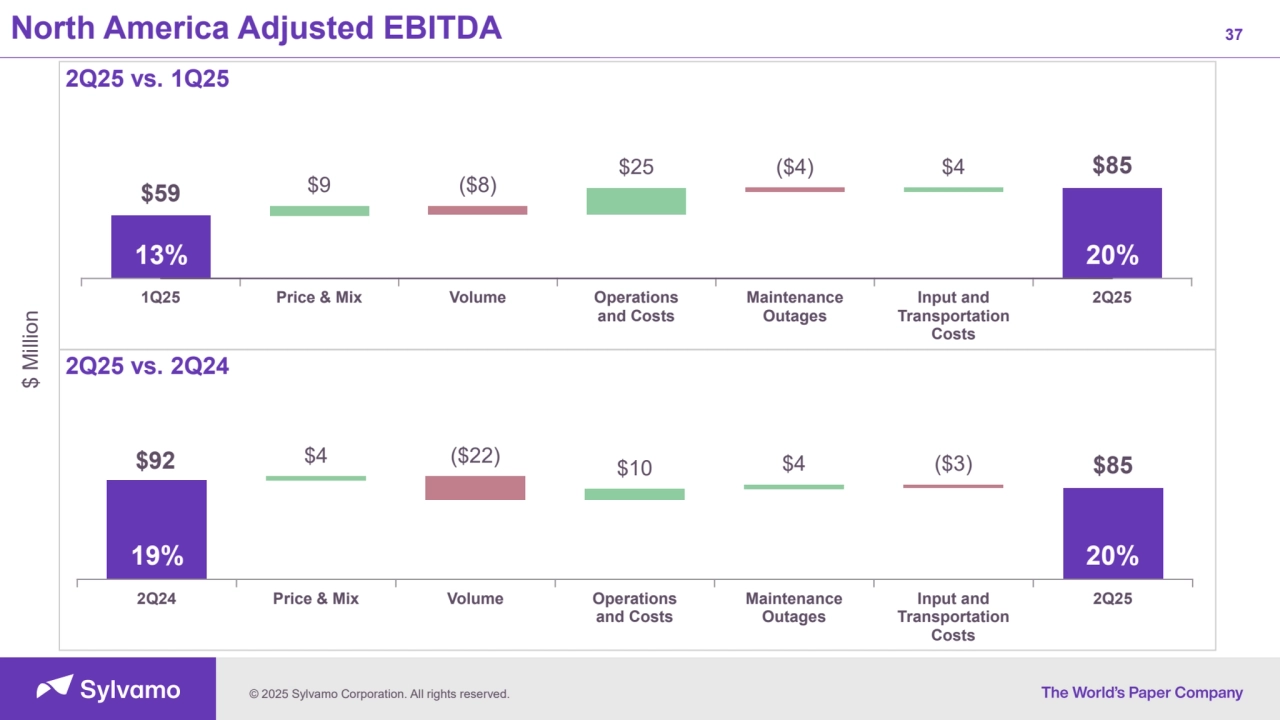
- 37. © 2025 Sylvamo Corporation. All rights reserved. 37 $59 $9 ($8) $25 ($4) $4 $85 1Q25 Price & Mix Volume Operations and Costs Maintenance Outages Input and Transportation Costs 2Q25 9% North America Adjusted EBITDA $ Million 19%$92 $4 ($22) $10 $4 ($3) $85 2Q24 Price & Mix Volume Operations and Costs Maintenance Outages Input and Transportation Costs 2Q25 19% 20% 13% 20% 2Q25 vs. 1Q25 2Q25 vs. 2Q24
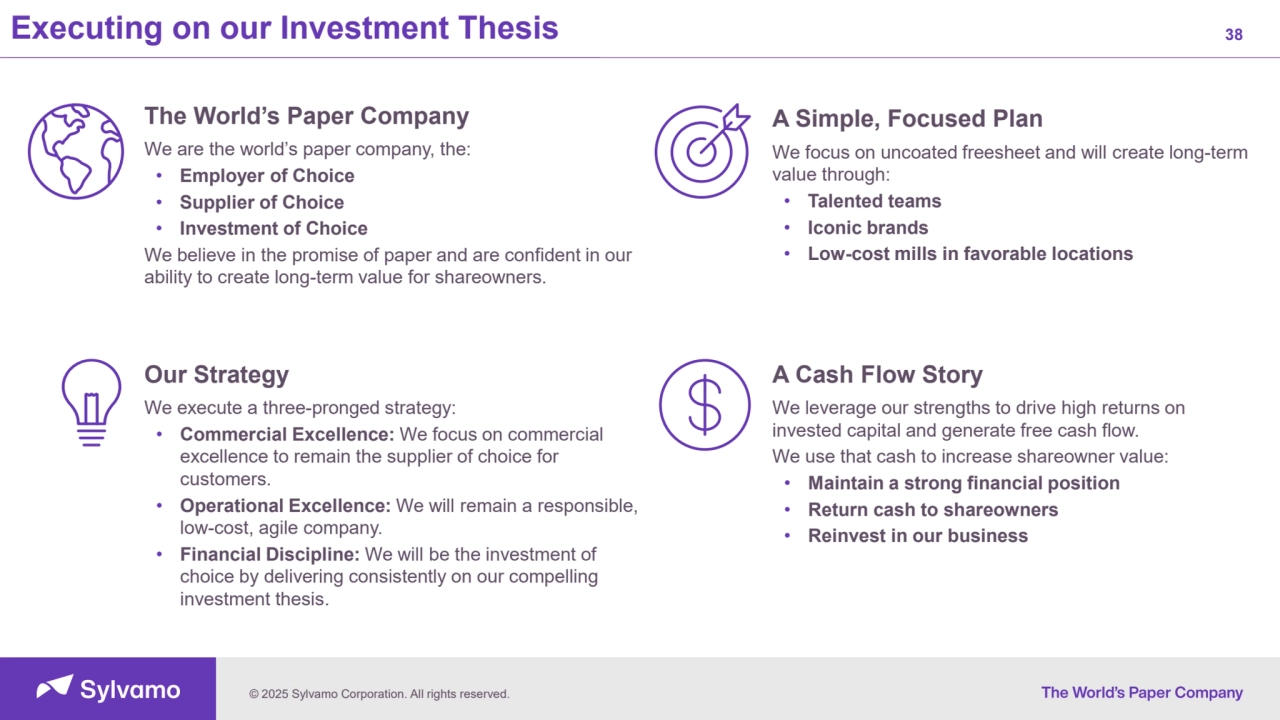
- 38. © 2025 Sylvamo Corporation. All rights reserved. Executing on our Investment Thesis 38 The World’s Paper Company We are the world’s paper company, the: • Employer of Choice • Supplier of Choice • Investment of Choice We believe in the promise of paper and are confident in our ability to create long-term value for shareowners. Our Strategy We execute a three-pronged strategy: • Commercial Excellence: We focus on commercial excellence to remain the supplier of choice for customers. • Operational Excellence: We will remain a responsible, low-cost, agile company. • Financial Discipline: We will be the investment of choice by delivering consistently on our compelling investment thesis. A Simple, Focused Plan We focus on uncoated freesheet and will create long-term value through: • Talented teams • Iconic brands • Low-cost mills in favorable locations A Cash Flow Story We leverage our strengths to drive high returns on invested capital and generate free cash flow. We use that cash to increase shareowner value: • Maintain a strong financial position • Return cash to shareowners • Reinvest in our business
- 39. © 2025 Sylvamo Corporation. All rights reserved. 39 Building a better future for people, the planet and our company