Tesla investor Day 2023 Keynote presentation


![A Sustainable Energy Economy Is 60%
The Cost of Continuing Fossil Fuel Investments
$-
Dollars of Capital Investment [Trillions]
$2
$4
$6
$8
$10
$12
$14
$16
20 Years of Investment
In Fossil Fuels at 2022 Rate
20 Years Investment in
Sustainable Energy Economy
Coal Natural Gas Oil
$10T
$14T](https://d2z384uprhdr6y.cloudfront.net/fqMOO21hEFJvmCM_bW9loj0esI4MjkPWRPsCoHSBCkY/rt:fill/q:100/w:1280/h:0/gravity:sm/czM6Ly9qYXVudC1wcm9kdWN0aW9uLXVwbG9hZHMvMjAyNC8xMi8xNS8zODY1ZWJjNS1jODhhLTRkNWYtOTMyMS04YjA2YzQyYWRkZDIvc2xpZGVfMjMtbC53ZWJw.webp)


Tesla investor Day 2023 Keynote presentation
- 2. Certain statements in this presentation, including, but not limited to, statements relating to the future development, ramp, production capacity and output rates, supply chain, demand and market growth, cost, pricing and profitability, deliveries, deployment, availability and other features and improvements and timing of existing and future Tesla products and technologies such as Model 3, Model Y, Model X, Model S, Cybertruck, Tesla Semi, Robotaxi, our next generation vehicle platform, our Autopilot, Full Self-Driving and other vehicle software and our energy storage and solar products; statements regarding operating margin, operating profits, spending and liquidity; and statements regarding expansion, improvements and/or ramp and related timing at existing or new factories are “forward-looking statements” that are subject to risks and uncertainties. These forward-looking statements are based on management’s current expectations, and as a result of certain risks and uncertainties, actual results may differ materially from those projected. The following important factors, without limitation, could cause actual results to differ materially from those in the forward-looking statements: uncertainties in future macroeconomic and regulatory conditions arising from the current global pandemic; the risk of delays in launching and manufacturing our products and features cost-effectively; our ability to grow our sales, delivery, installation, servicing and charging capabilities and effectively manage this growth; consumers’ demand for electric vehicles generally and our vehicles specifically; the ability of suppliers to deliver components according to schedules, prices, quality and volumes acceptable to us, and our ability to manage such components effectively; any issues with lithium-ion cells or other components manufactured at Gigafactory Nevada and Gigafactory Shanghai; our ability to ramp Gigafactory Shanghai, Gigafactory Berlin-Brandenburg, Gigafactory Texas and new factories in accordance with our plans; our ability to procure supply of battery cells, including through our own manufacturing; risks relating to international expansion; any failures by Tesla products to perform as expected or if product recalls occur; the risk of product liability claims; competition in the automotive and energy product markets; our ability to maintain public credibility and confidence in our long-term business prospects; our ability to manage risks relating to our various product financing programs; the status of government and economic incentives for electric vehicles and energy products; our ability to attract, hire and retain key employees and qualified personnel and ramp our installation teams; our ability to maintain the security of our information and production and product systems; our compliance with various regulations and laws applicable to our operations and products, which may evolve from time to time; risks relating to our indebtedness and financing strategies; and adverse foreign exchange movements. More information on potential factors that could affect our financial results is included from time to time in our Securities and Exchange Commission filings and reports, including the risks identified under the section captioned “Risk Factors” in our annual report on Form 10-K filed with the SEC on January 31, 2023. Tesla disclaims any obligation to update information contained in these forward-looking statements whether as a result of new information, future events or otherwise.
- 5. Sustainable Energy For All of Earth
- 6. Our Energy Economy Is Dirty & Wasteful Current State SUSTAINABLE FOSSIL FUELS 165 PWh/yr Primary Energy Consumption Over 80% of Global Energy Comes From Fossil Fuels Only 1/3 of Global Energy Delivers Useful Work or Heat
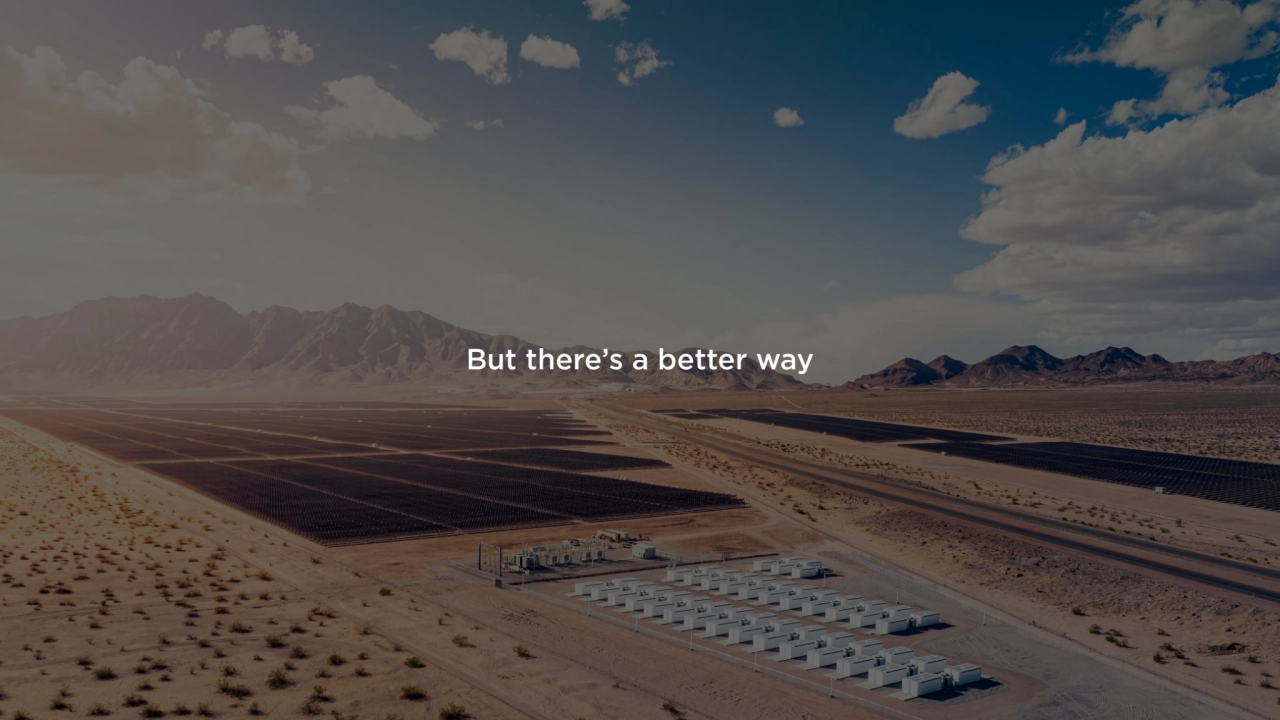
- 7. But there’s a better way
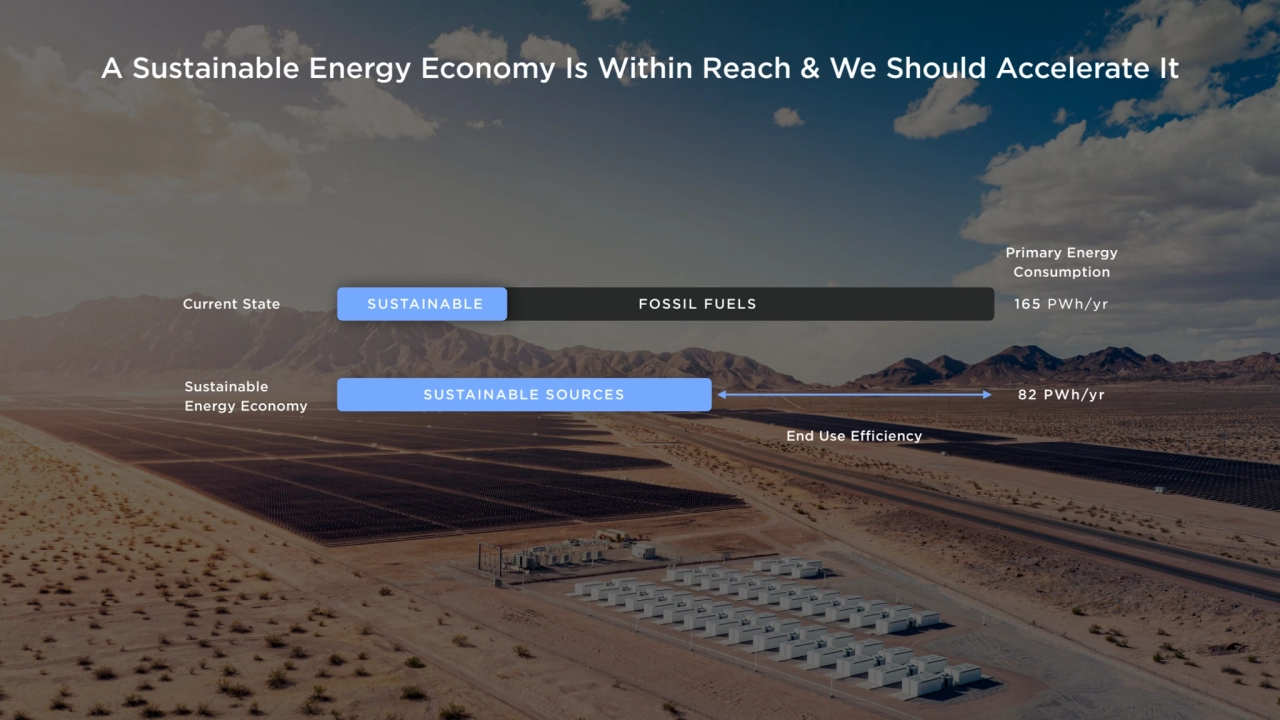
- 8. A Sustainable Energy Economy Is Within Reach & We Should Accelerate It Current State FOSSIL FUELS SUSTAINABLE SOURCES 82 PWh/yr Sustainable Energy Economy SUSTAINABLE Primary Energy Consumption 165 PWh/yr End Use Efficiency
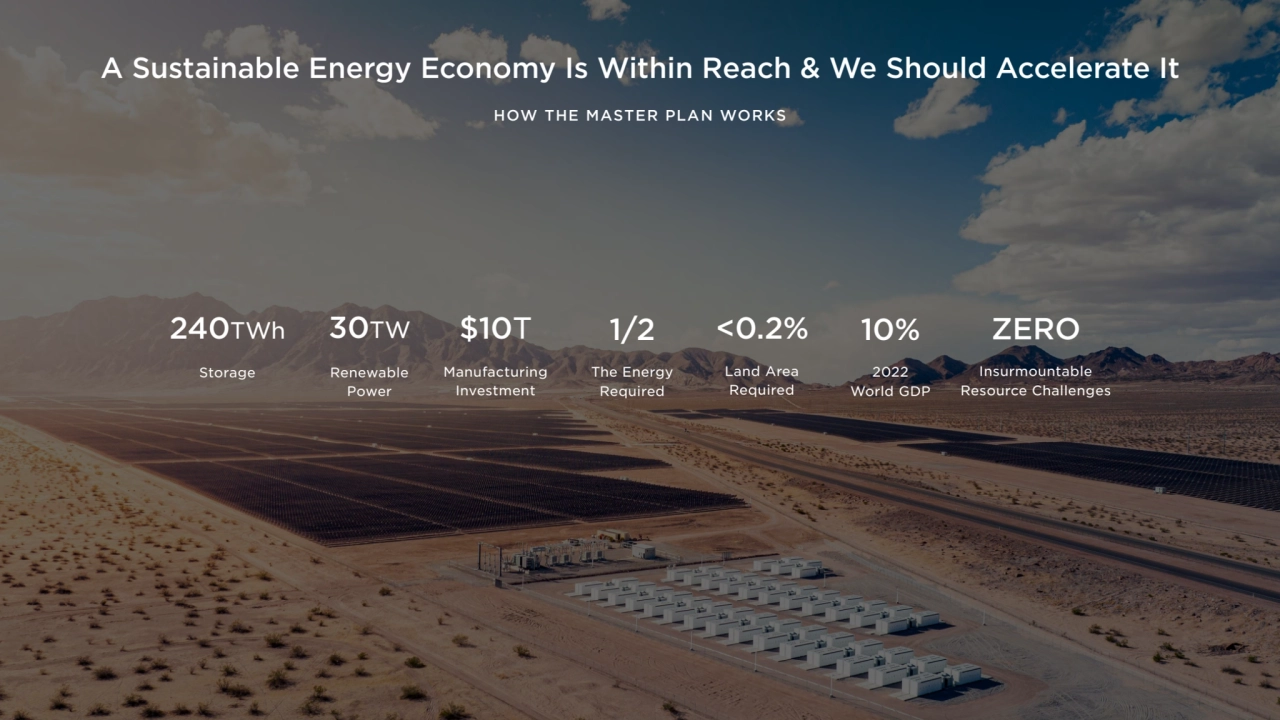
- 9. A Sustainable Energy Economy Is Within Reach & We Should Accelerate It $10T Manufacturing Investment 30TW Renewable Power 240TWh Storage <0.2% Land Area Required ZERO Insurmountable Resource Challenges 10% 2022 World GDP 1/2 The Energy Required HOW THE MASTER PLAN WORKS
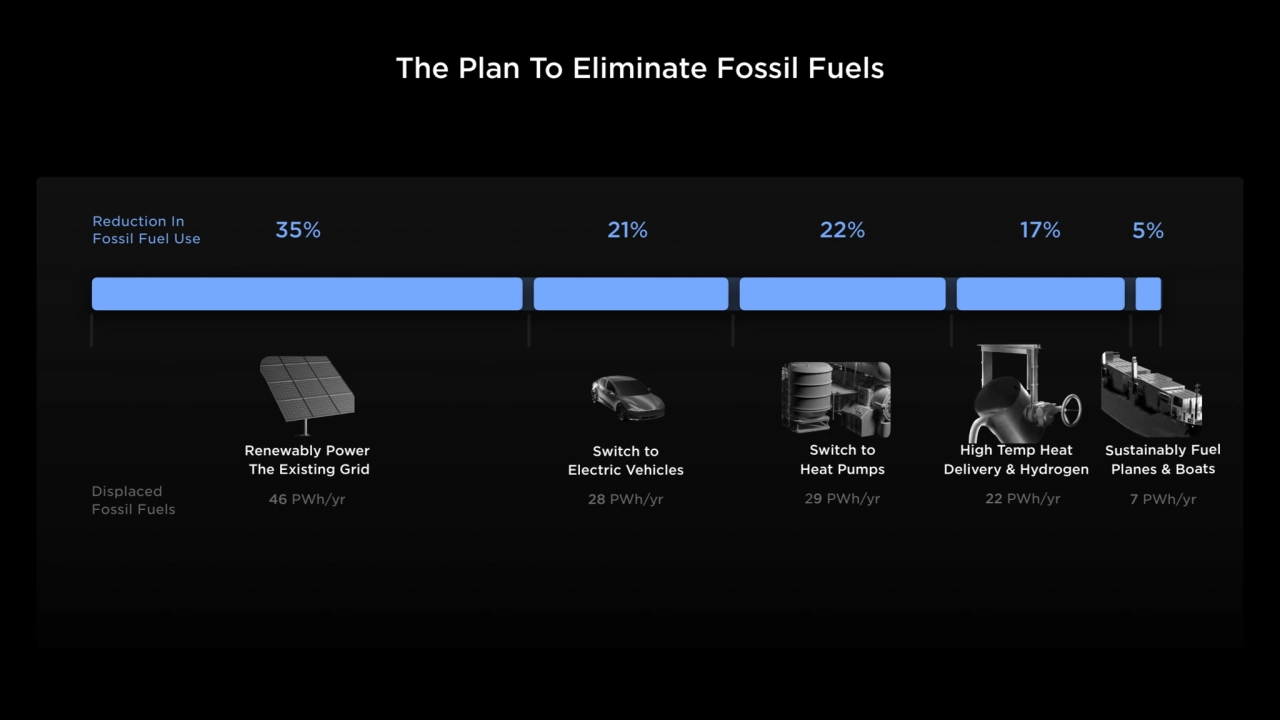
- 10. The Plan To Eliminate Fossil Fuels Renewably Power The Existing Grid 46 PWh/yr 35% 28 PWh/yr 21% 29 PWh/yr 22% 22 PWh/yr 17% 7 PWh/yr 5% ` Switch to Electric Vehicles Switch to Heat Pumps High Temp Heat Delivery & Hydrogen Sustainably Fuel Planes & Boats Reduction In Fossil Fuel Use Displaced Fossil Fuels
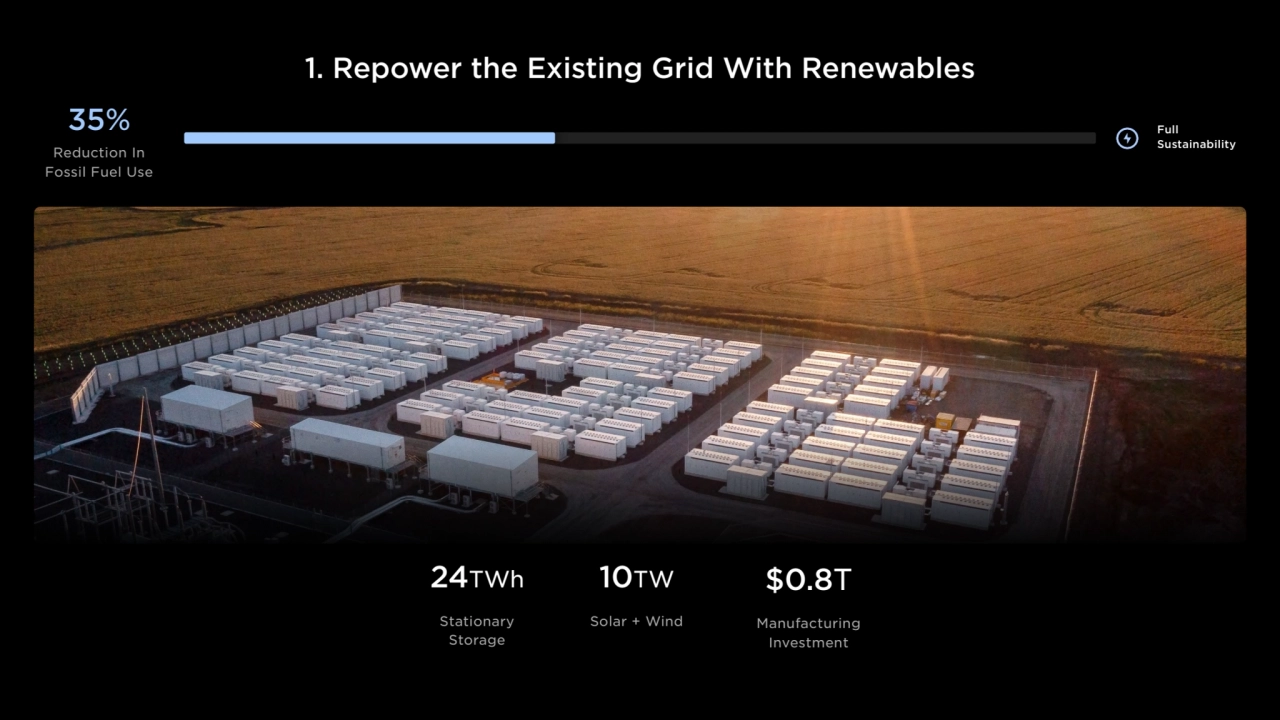
- 11. 1. Repower the Existing Grid With Renewables Full Sustainability $0.8T Manufacturing Investment 24TWh Stationary Storage 10TW Solar + Wind 35% Reduction In Fossil Fuel Use
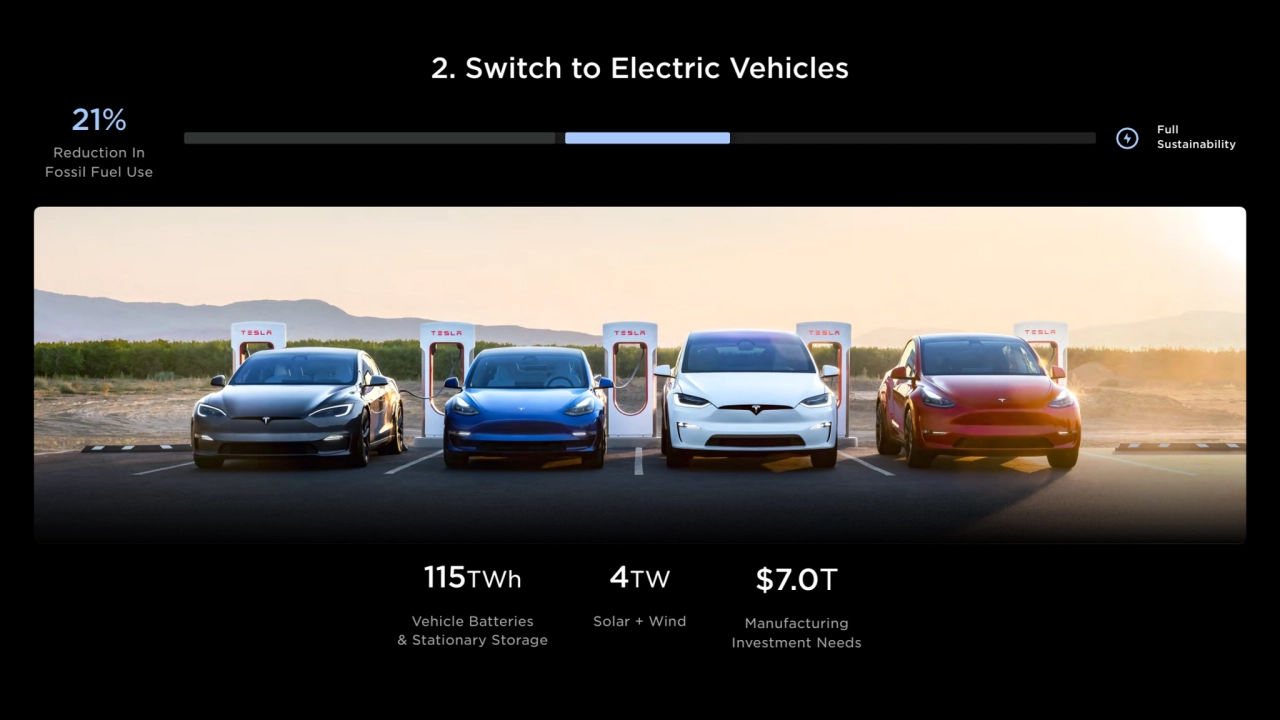
- 12. 2. Switch to Electric Vehicles Full Sustainability 21% $7.0T Manufacturing Investment Needs 115TWh Vehicle Batteries & Stationary Storage 4TW Solar + Wind Reduction In Fossil Fuel Use
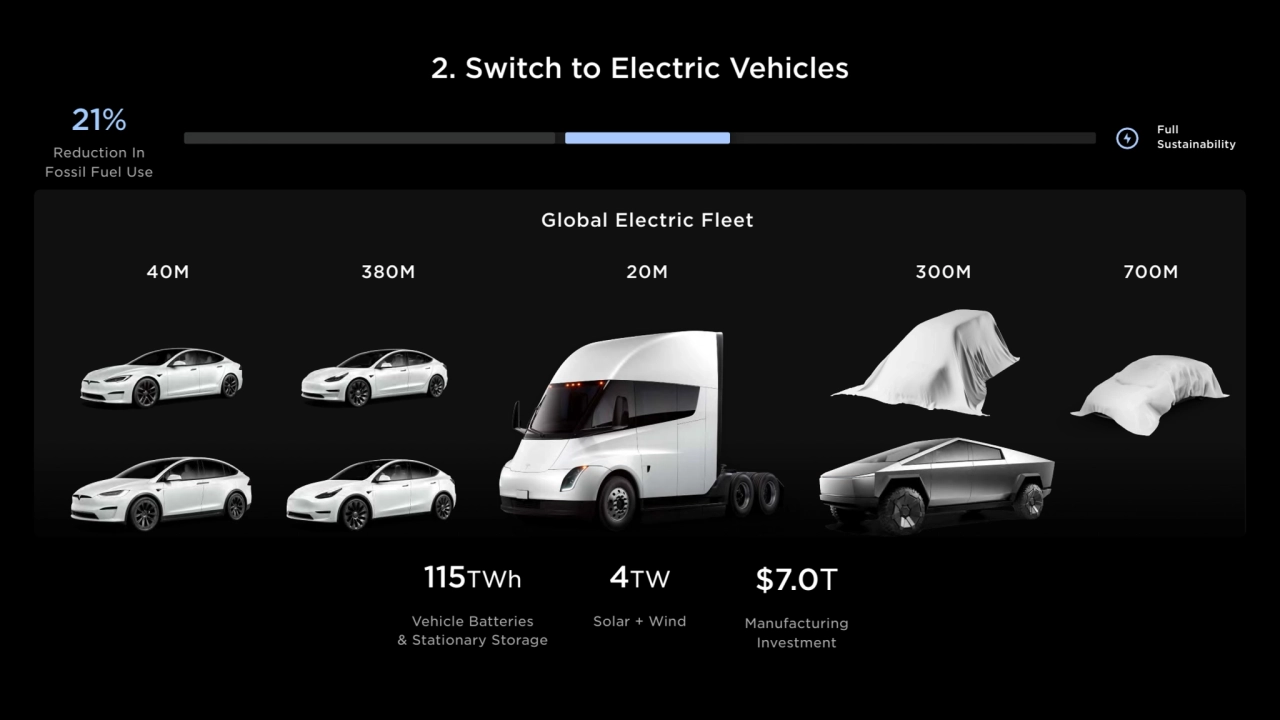
- 13. 2. Switch to Electric Vehicles Full Sustainability 21% $7.0T Manufacturing Investment 115TWh Vehicle Batteries & Stationary Storage 4TW Solar + Wind 40M 380M 20M 300M 700M Reduction In Fossil Fuel Use Global Electric Fleet
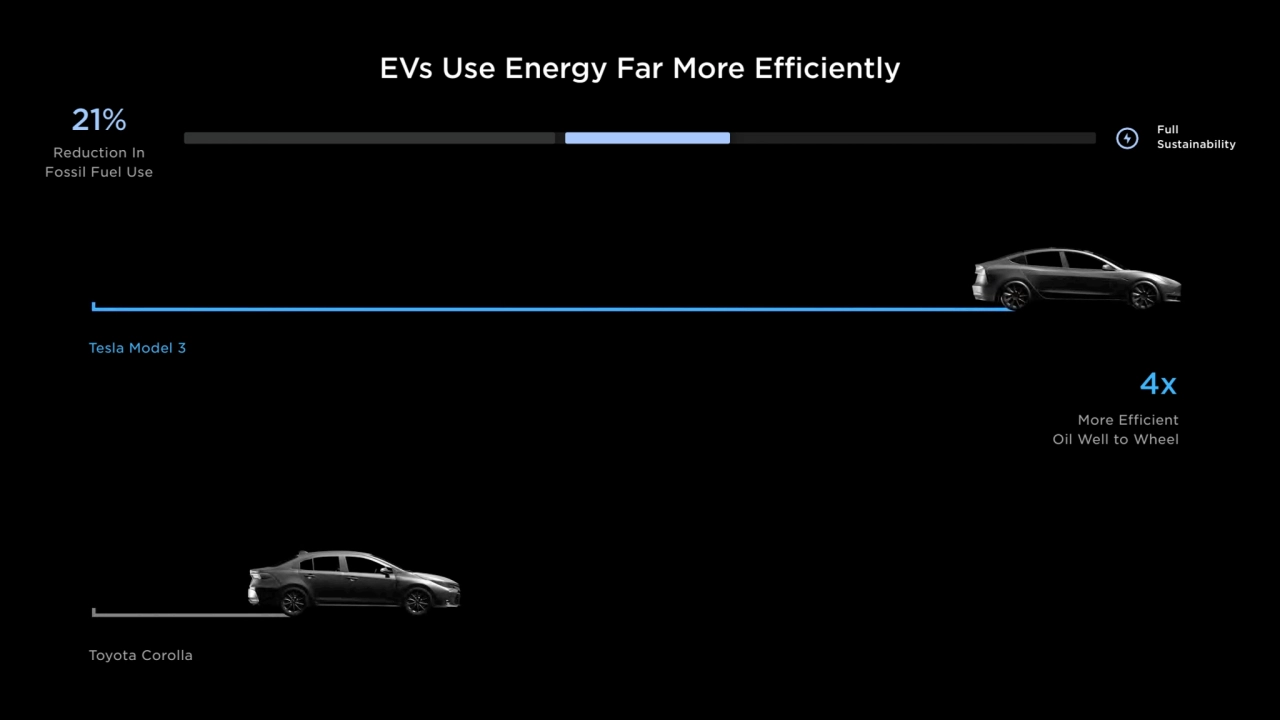
- 14. EVs Use Energy Far More Efficiently Full Sustainability 21% 4x More Efficient Oil Well to Wheel Tesla Model 3 Toyota Corolla Reduction In Fossil Fuel Use
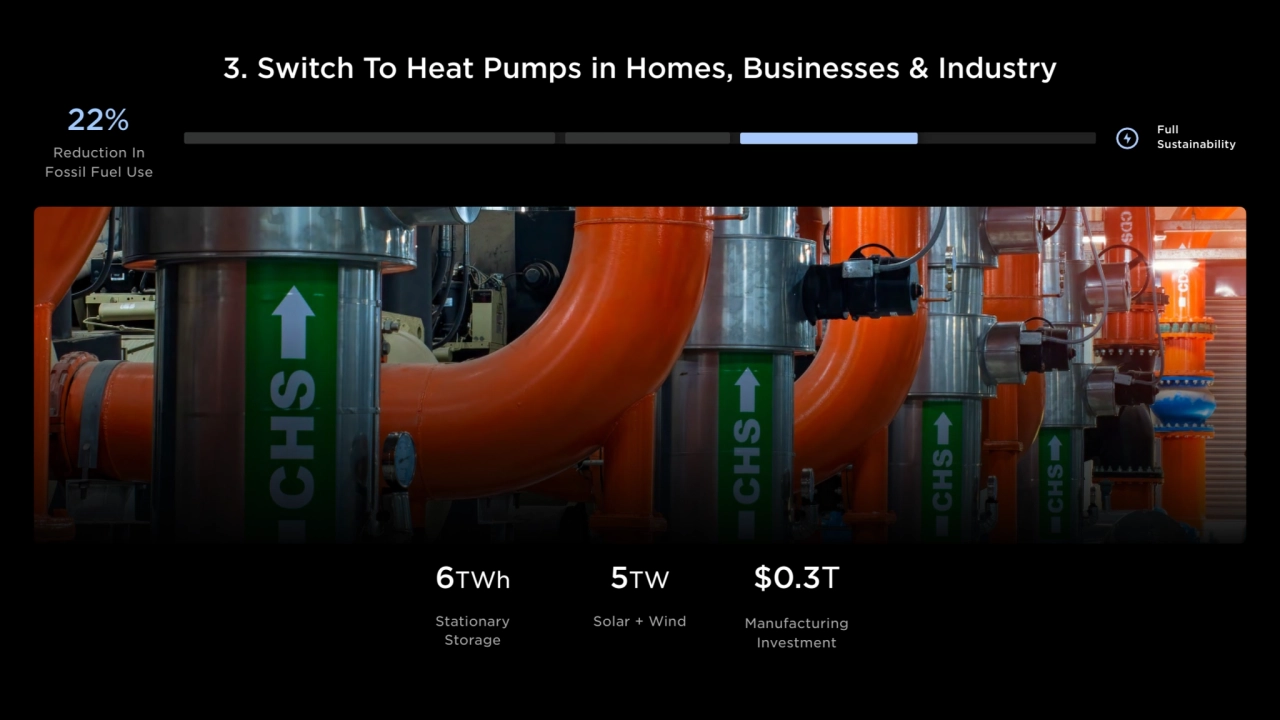
- 15. 3. Switch To Heat Pumps in Homes, Businesses & Industry Full Sustainability 22% $0.3T Manufacturing Investment 6TWh Stationary Storage 5TW Solar + Wind Reduction In Fossil Fuel Use
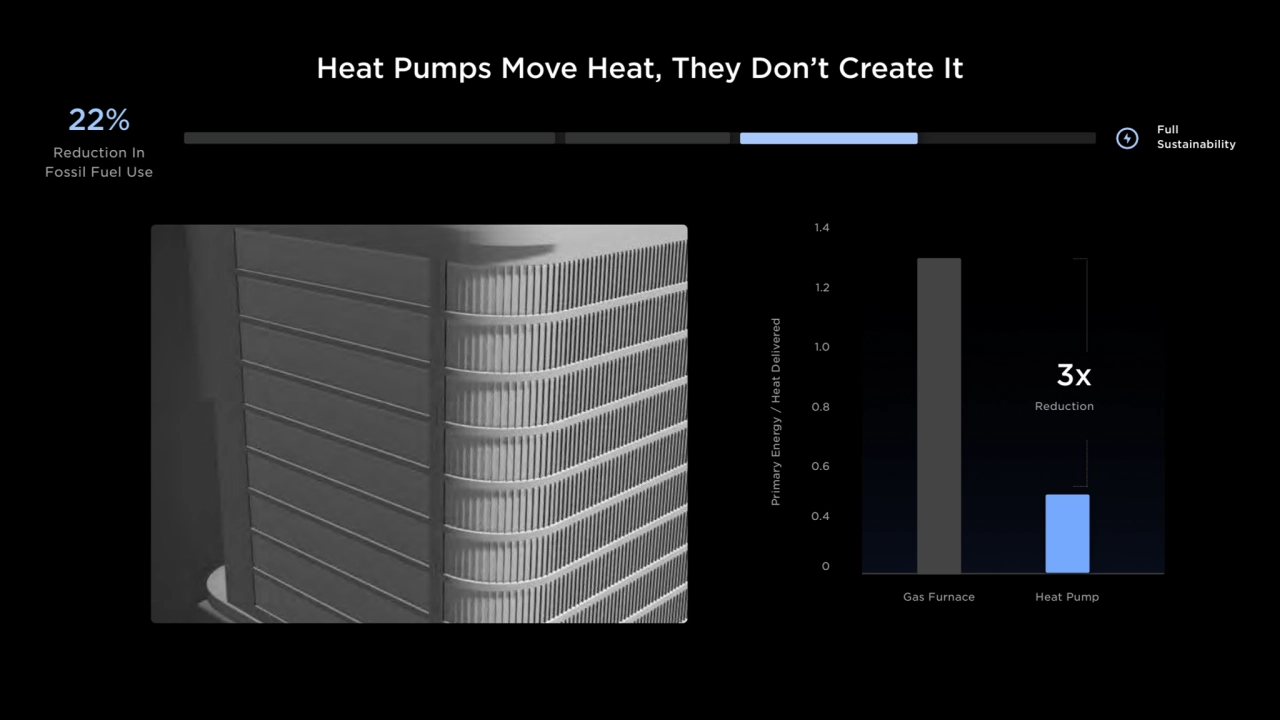
- 16. Heat Pumps Move Heat, They Don’t Create It 0 Primary Energy / Heat Delivered 0.4 0.6 0.8 1.0 Gas Furnace Heat Pump 1.2 1.4 3x Reduction Full Sustainability 22% Reduction In Fossil Fuel Use
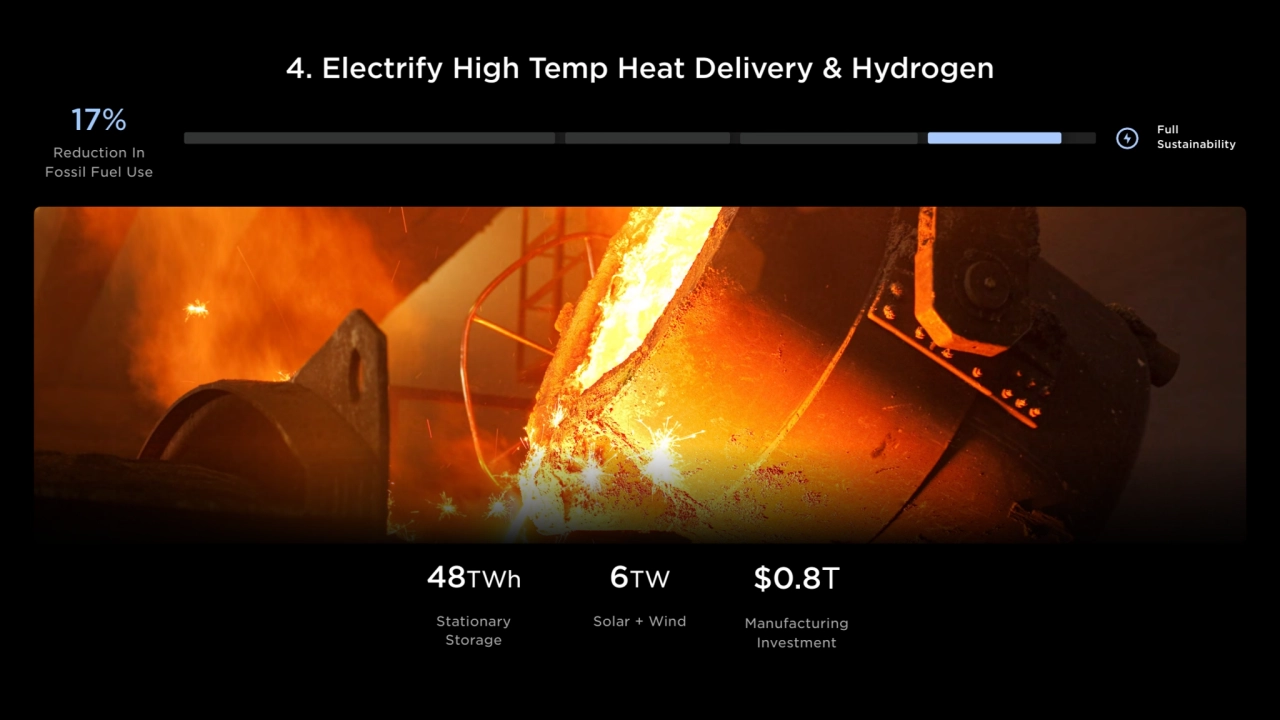
- 17. Full Sustainability 17% $0.8T Manufacturing Investment 48TWh Stationary Storage 6TW Solar + Wind Reduction In Fossil Fuel Use 4. Electrify High Temp Heat Delivery & Hydrogen
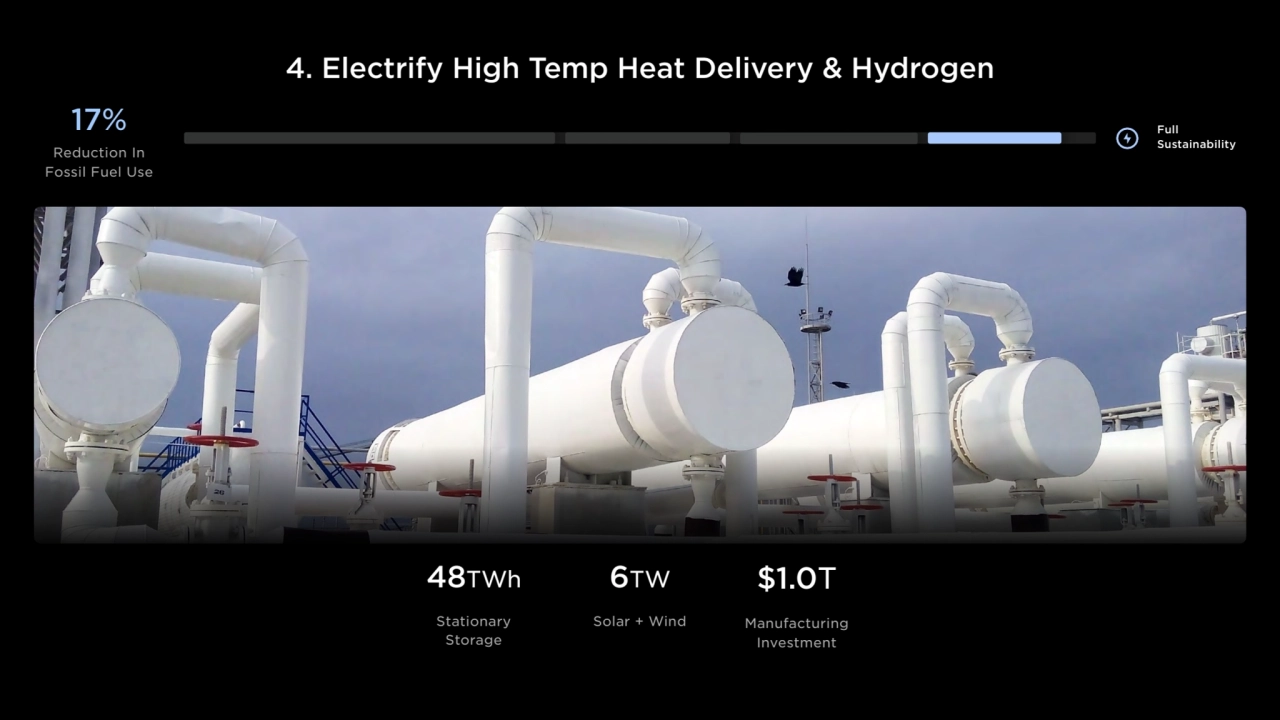
- 18. 4. Electrify High Temp Heat Delivery & Hydrogen Full Sustainability 17% $1.0T Manufacturing Investment 48TWh Stationary Storage 6TW Solar + Wind Reduction In Fossil Fuel Use
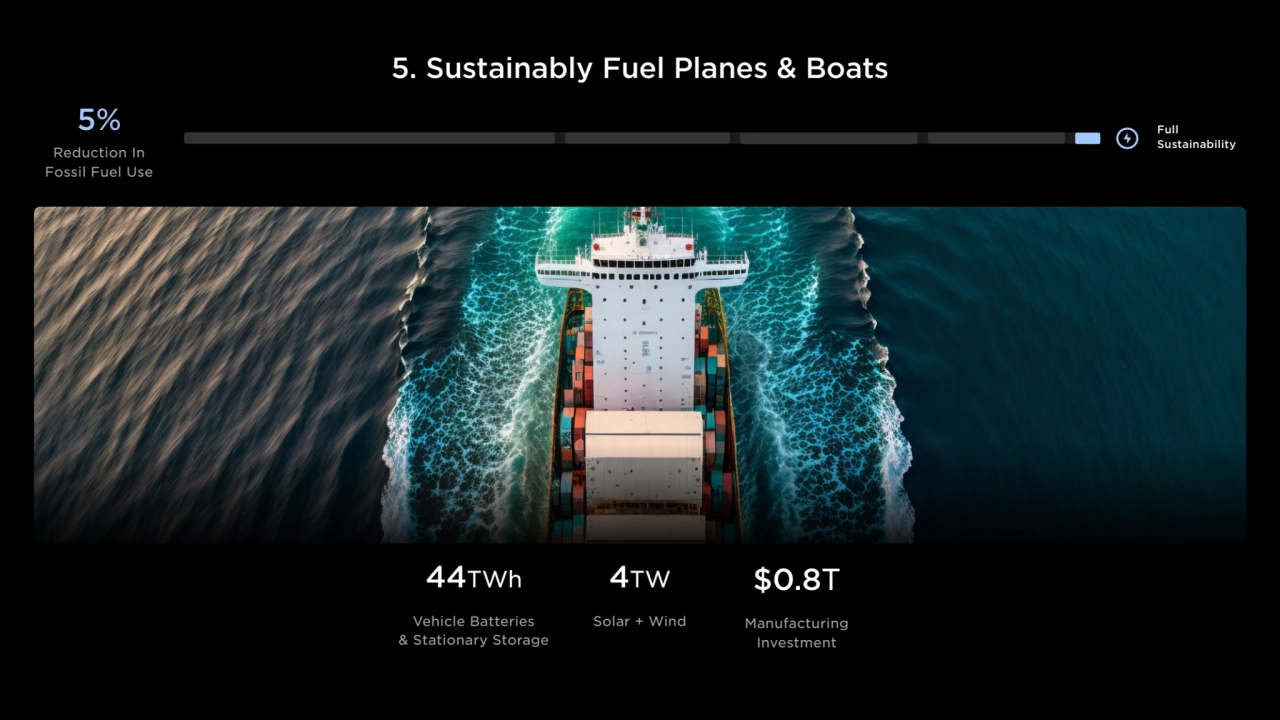
- 19. 5. Sustainably Fuel Planes & Boats Full Sustainability 5% $0.8T Manufacturing Investment 44TWh Vehicle Batteries & Stationary Storage 4TW Solar + Wind Reduction In Fossil Fuel Use
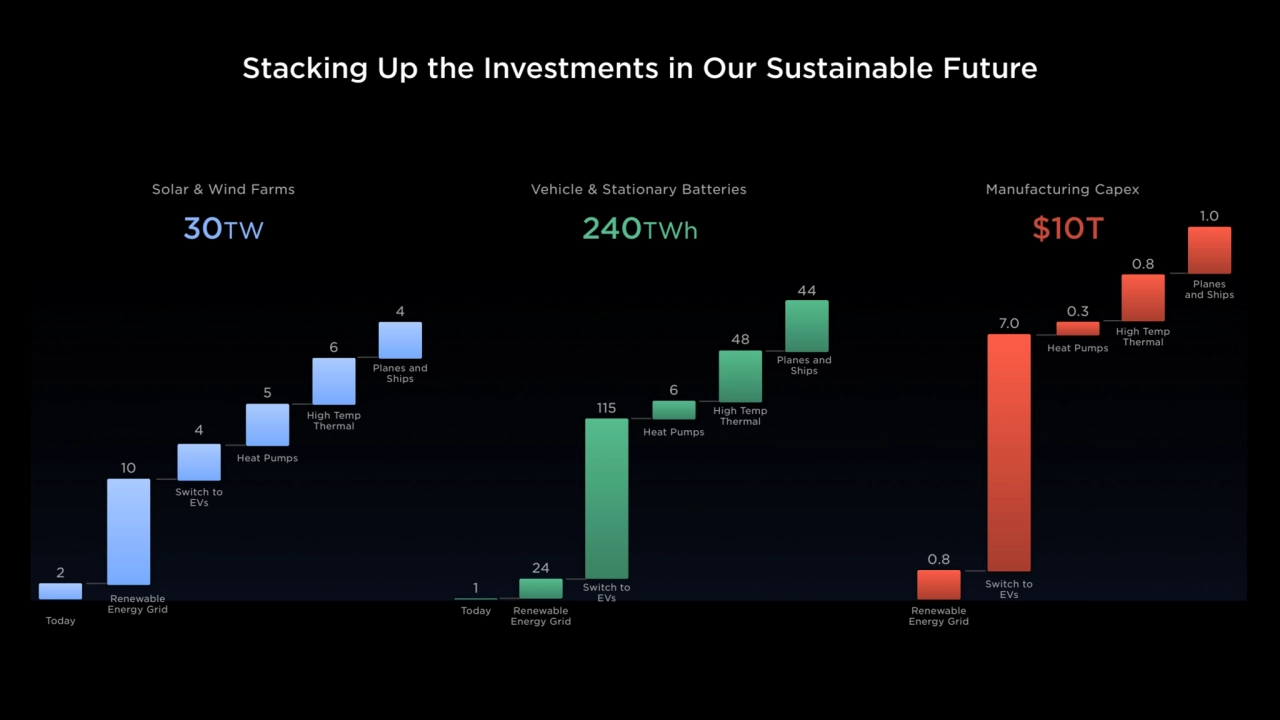
- 20. Stacking Up the Investments in Our Sustainable Future 2 10 4 5 6 Solar & Wind Farms Today Renewable Energy Grid Switch to EVs Heat Pumps High Temp Thermal 1 115 48 24 6 Today Renewable Energy Grid Switch to EVs Heat Pumps High Temp Thermal Vehicle & Stationary Batteries 7.0 0.8 0.8 0.3 Renewable Energy Grid Switch to EVs Heat Pumps High Temp Thermal Manufacturing Capex 4 Planes and Ships 44 Planes and Ships 1.0 Planes and Ships 30TW 240TWh $10T
- 21. It’s Entirely Feasible
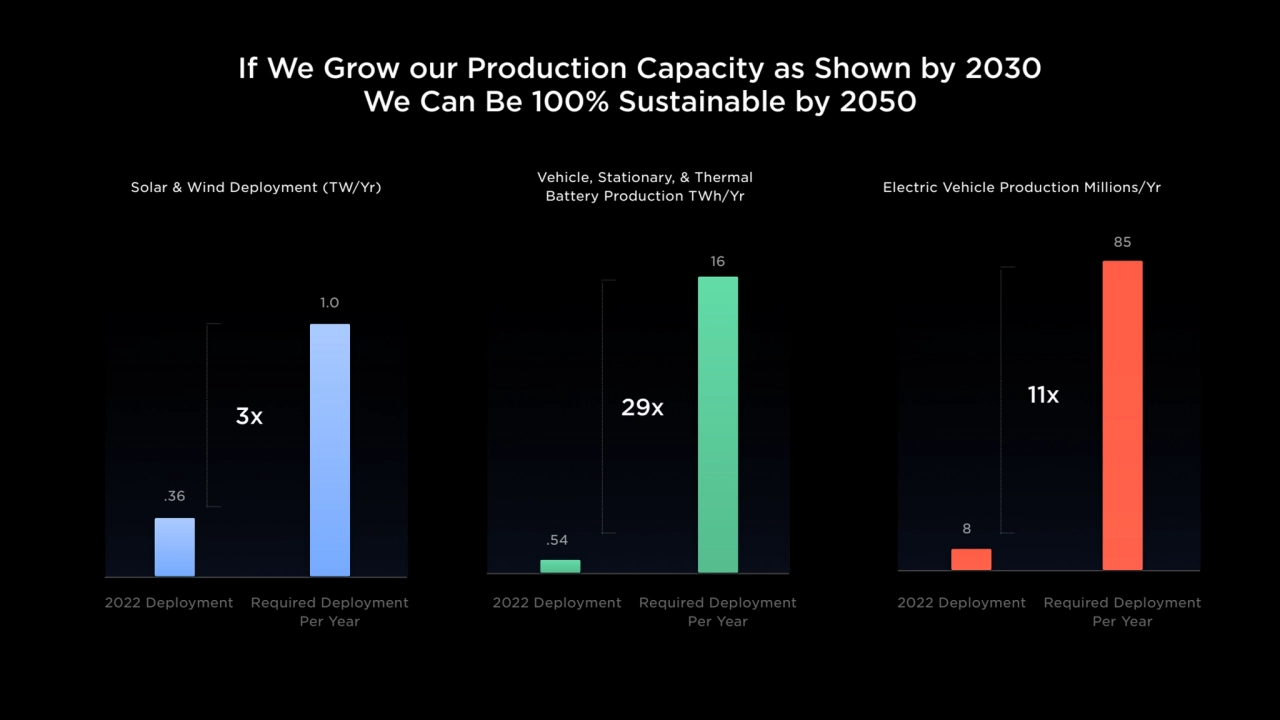
- 22. If We Grow our Production Capacity as Shown by 2030 We Can Be 100% Sustainable by 2050 2022 Deployment Required Deployment Per Year Solar & Wind Deployment (TW/Yr) Vehicle, Stationary, & Thermal Battery Production TWh/Yr Electric Vehicle Production Millions/Yr .36 1.0 2022 Deployment Required Deployment Per Year .54 2022 Deployment Required Deployment Per Year 8 85 16 11x 29x 3x
- 23. A Sustainable Energy Economy Is 60% The Cost of Continuing Fossil Fuel Investments $- Dollars of Capital Investment [Trillions] $2 $4 $6 $8 $10 $12 $14 $16 20 Years of Investment In Fossil Fuels at 2022 Rate 20 Years Investment in Sustainable Energy Economy Coal Natural Gas Oil $10T $14T
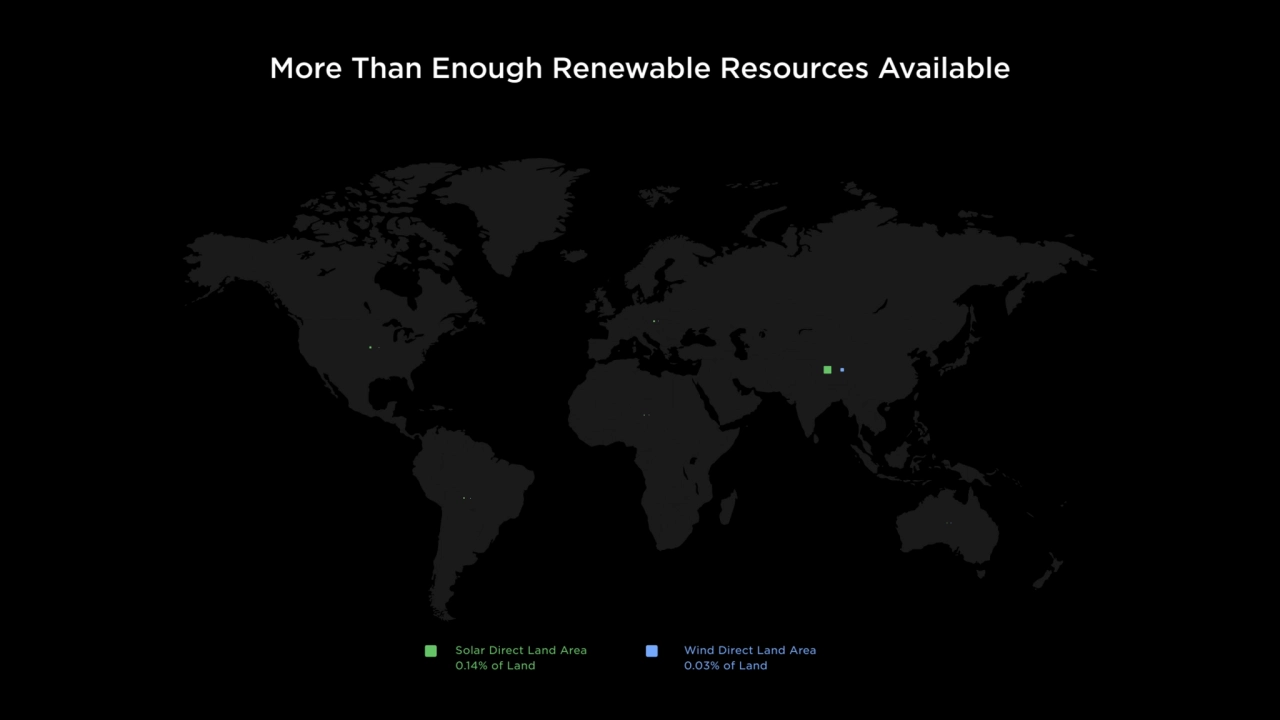
- 24. More Than Enough Renewable Resources Available Solar Direct Land Area 0.14% of Land Wind Direct Land Area 0.03% of Land
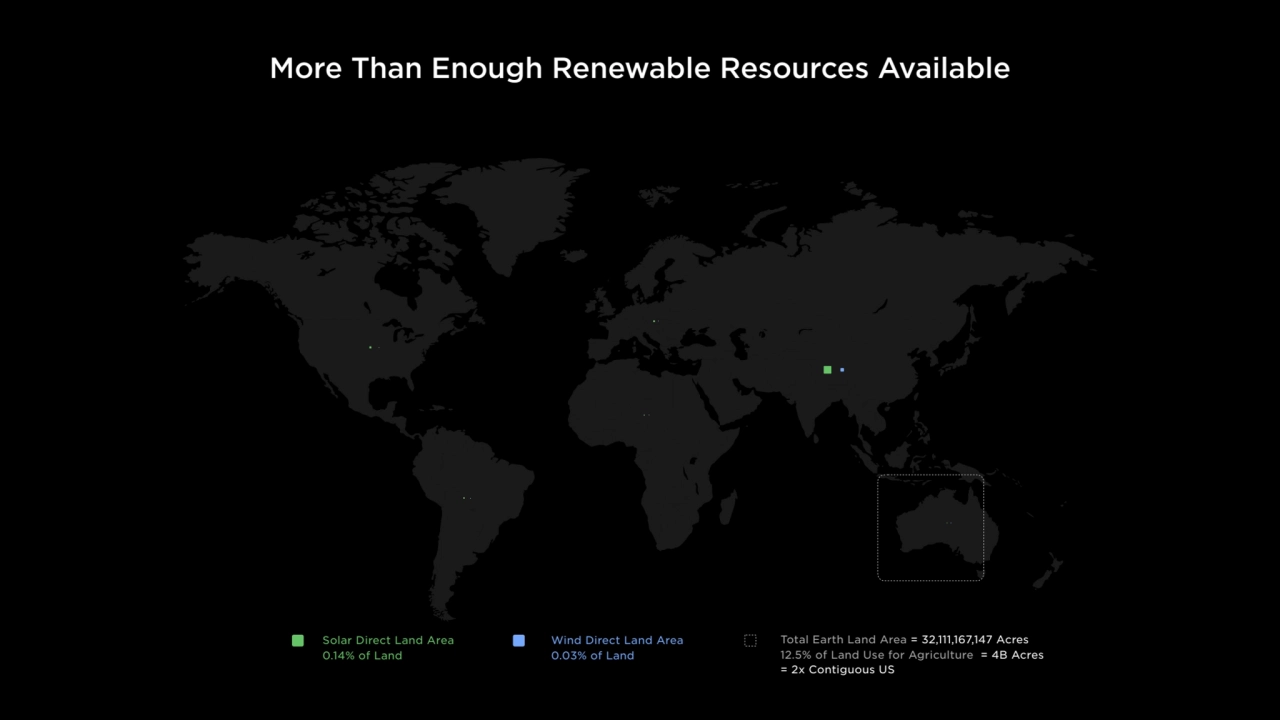
- 25. More Than Enough Renewable Resources Available Solar Direct Land Area 0.14% of Land Wind Direct Land Area 0.03% of Land Total Earth Land Area = 32,111,167,147 Acres 12.5% of Land Use for Agriculture = 4B Acres = 2x Contiguous US
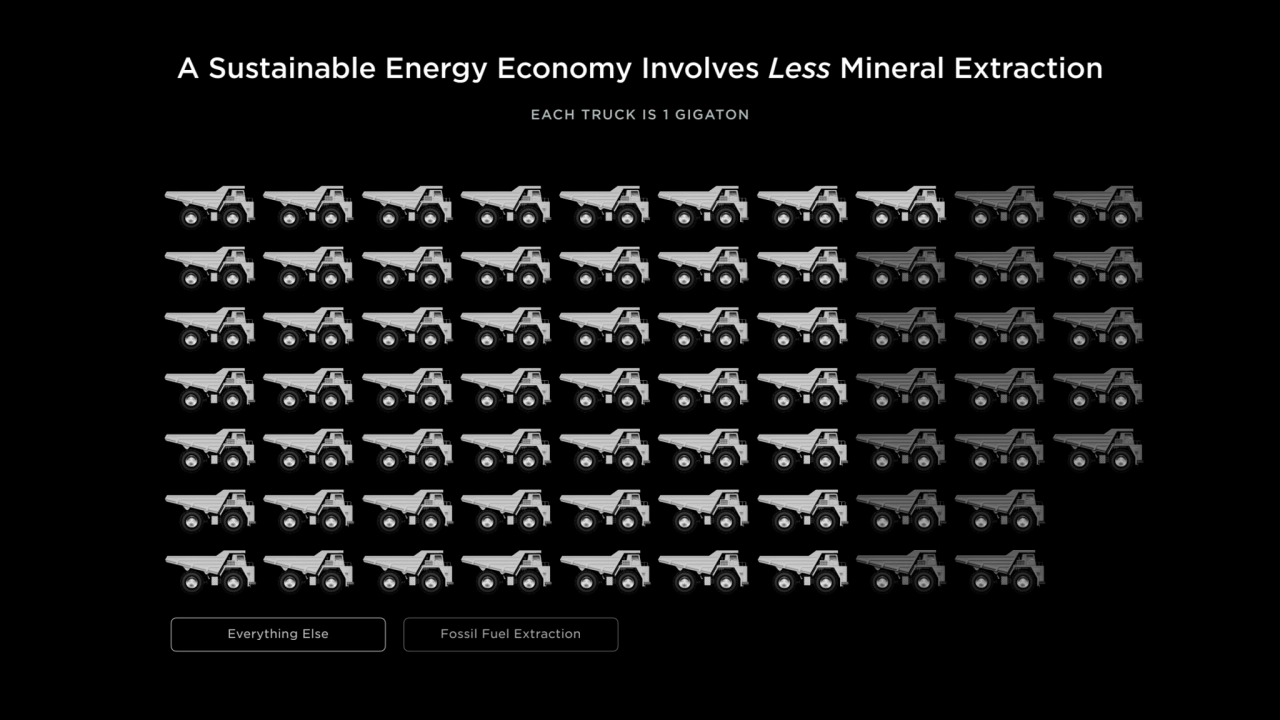
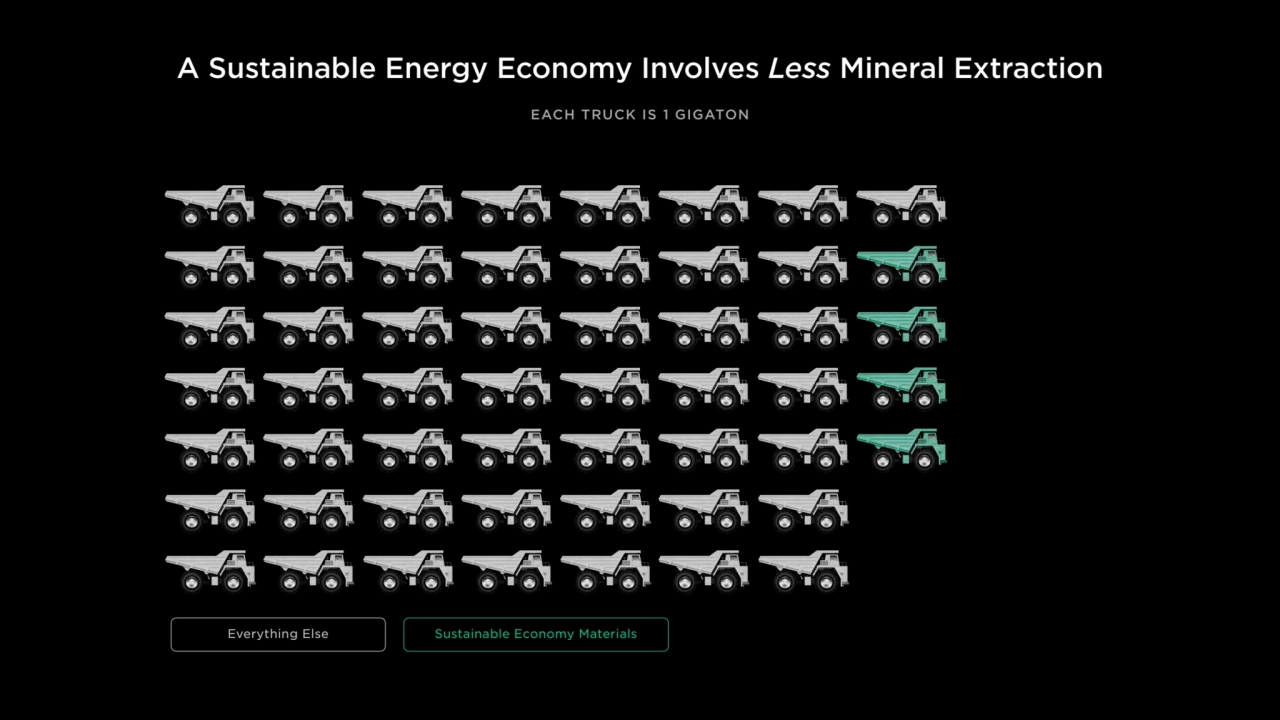
- 26. A Sustainable Energy Economy Involves Less Mineral Extraction EACH TRUCK IS 1 GIGATON Everything Else Fossil Fuel Extraction
- 27. EACH TRUCK IS 1 GIGATON A Sustainable Energy Economy Involves Less Mineral Extraction Everything Else Sustainable Economy Materials
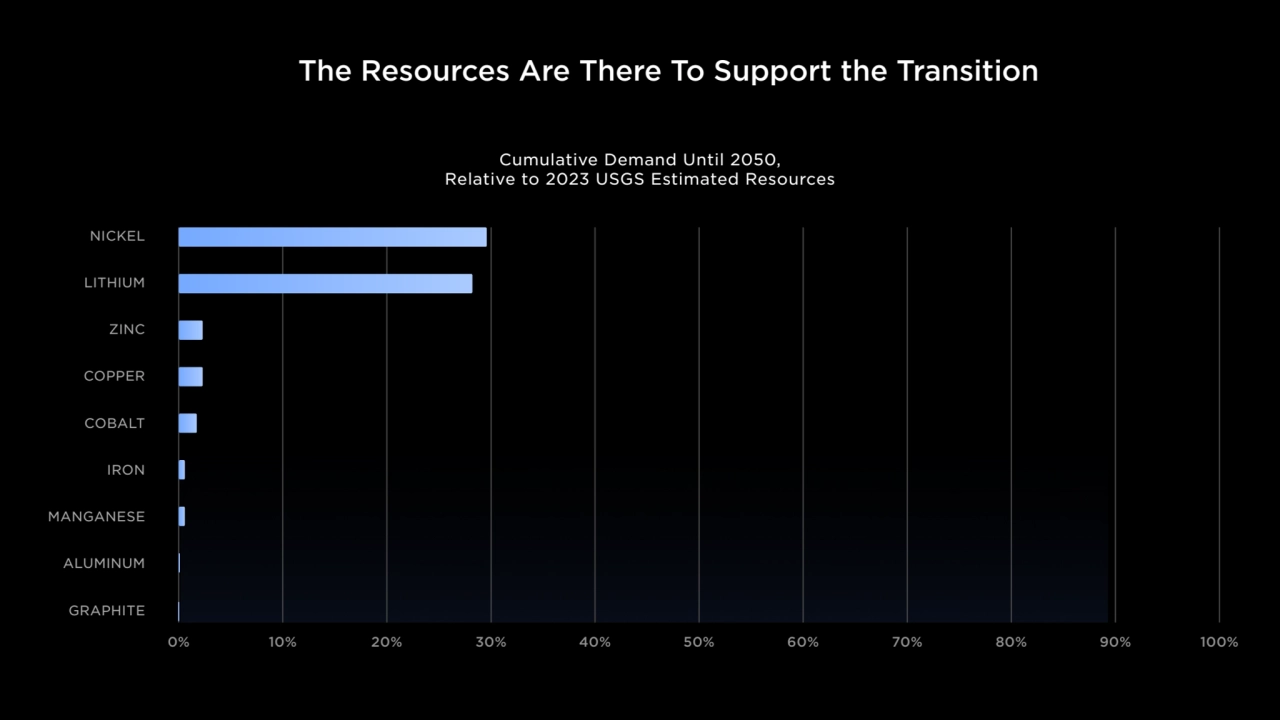
- 28. The Resources Are There To Support the Transition GRAPHITE ALUMINUM MANGANESE IRON COBALT COPPER ZINC LITHIUM NICKEL 0% 10% 20% 30% 40% 50% 60% 70% 80% 90% 100% Cumulative Demand Until 2050, Relative to 2023 USGS Estimated Resources
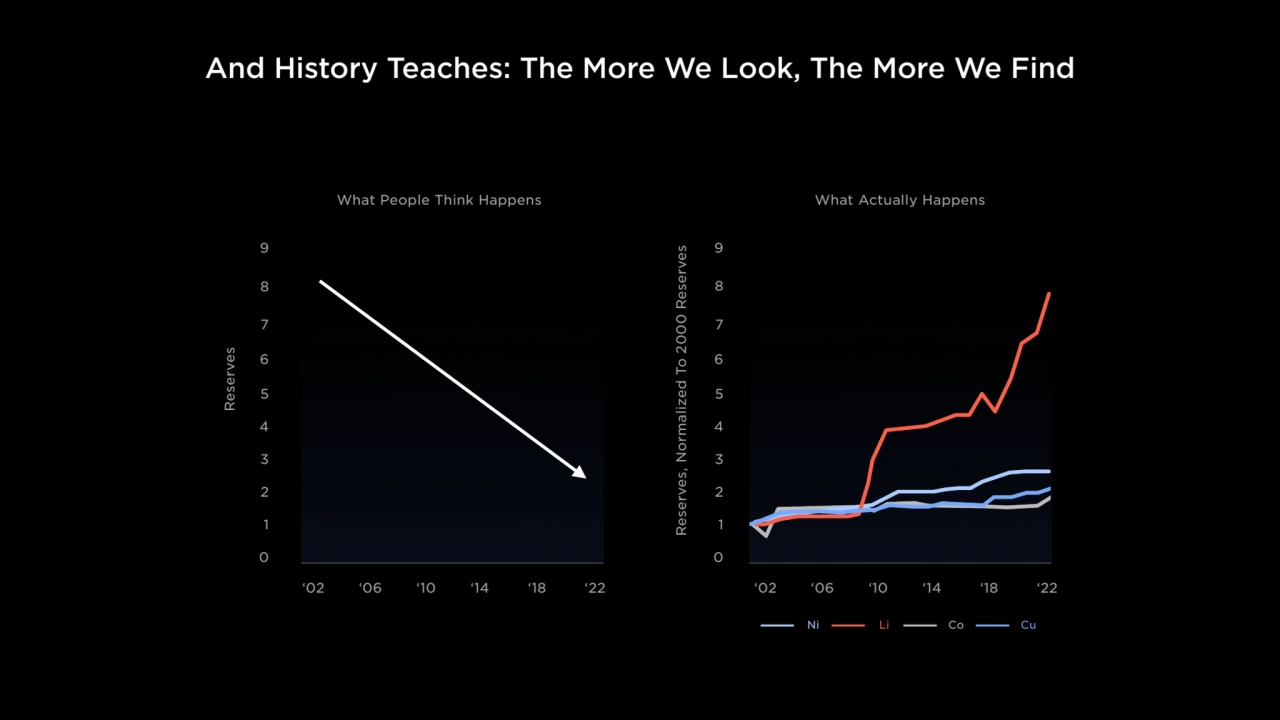
- 29. And History Teaches: The More We Look, The More We Find 0 What People Think Happens 1 2 3 4 5 6 7 8 9 Reserves, Normalized To 2000 Reserves What Actually Happens ‘02 ‘06 ‘10 ‘14 ‘18 ‘22 ‘02 ‘06 ‘10 ‘14 ‘18 ‘22 0 1 2 3 4 5 6 7 8 9 Ni Li Co Reserves Cu
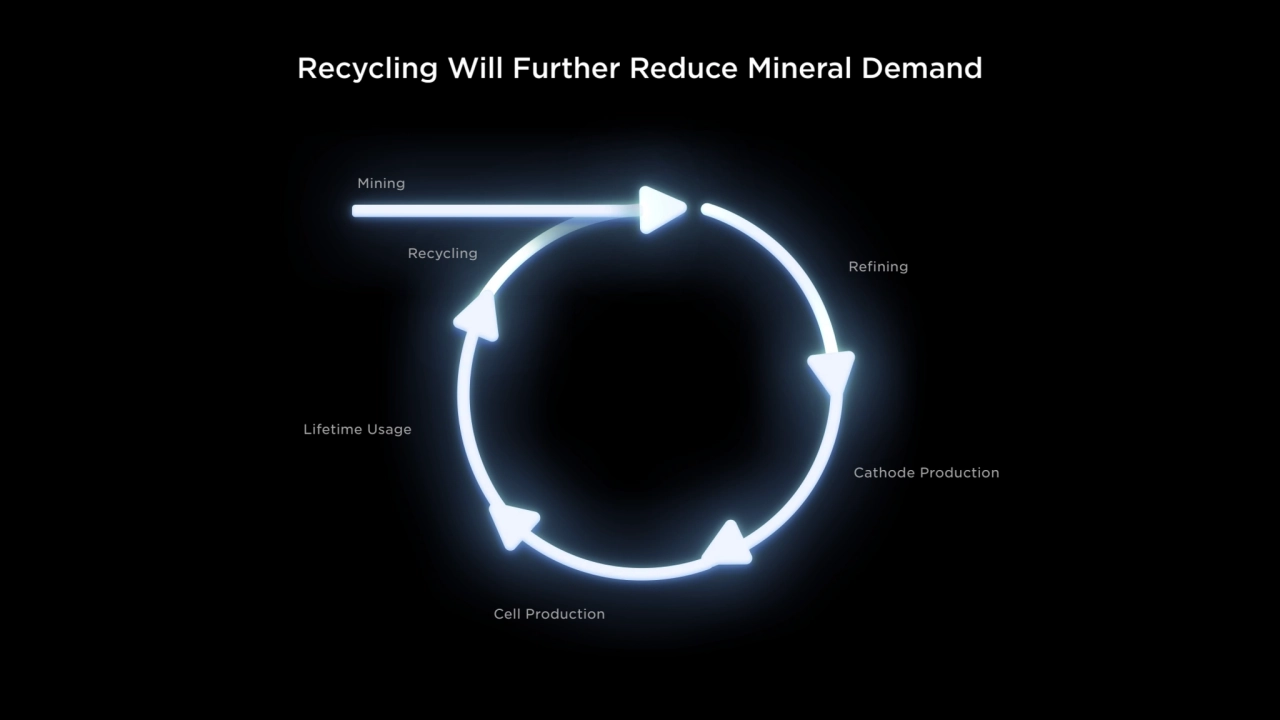
- 30. Recycling Will Further Reduce Mineral Demand Recycling Refining Cathode Production Cell Production Lifetime Usage Mining
- 31. A Sustainable Energy Economy Is Within Reach & We Should Accelerate It $10T Manufacturing Investment 30TW Renewable Power 240TWh Storage <0.2% Land Area Required ZERO Insurmountable Resource Challenges 10% 2022 World GDP 1/2 The Energy Required HOW THE MASTER PLAN WORKS
- 32. 01 Vehicle Design Franz von Holzhausen, Lars Moravy
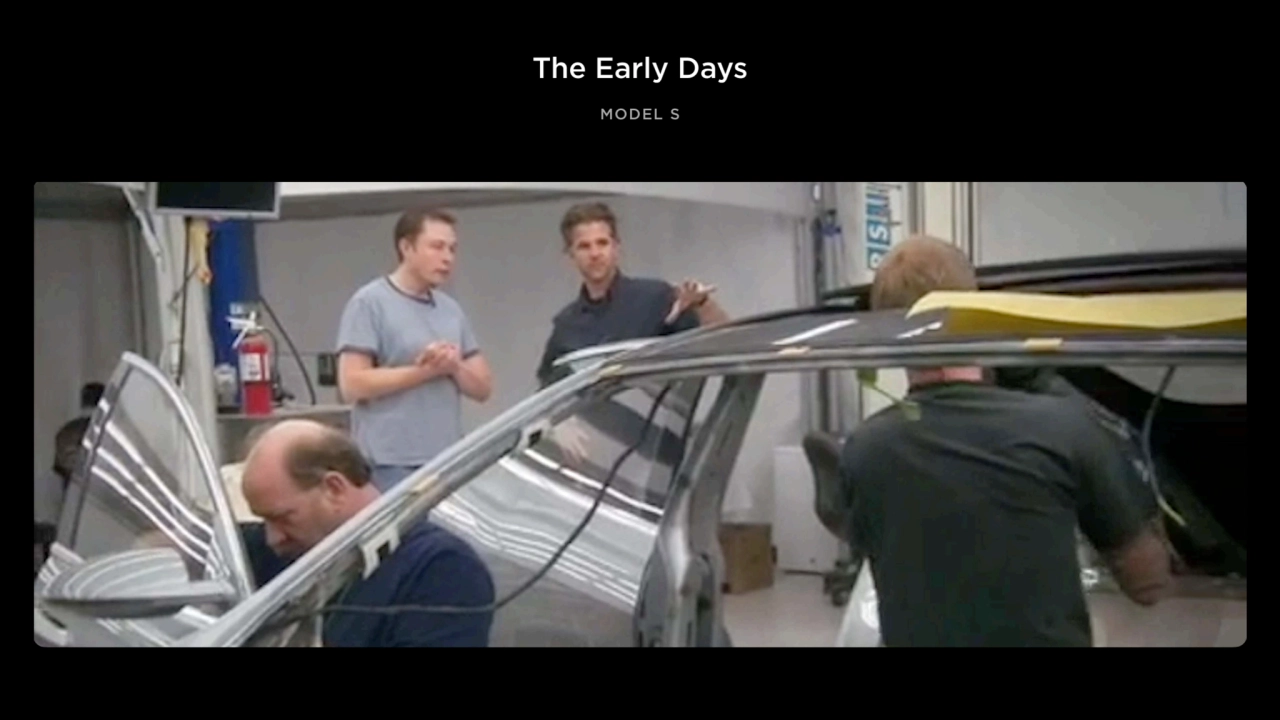
- 33. The Early Days MODEL S
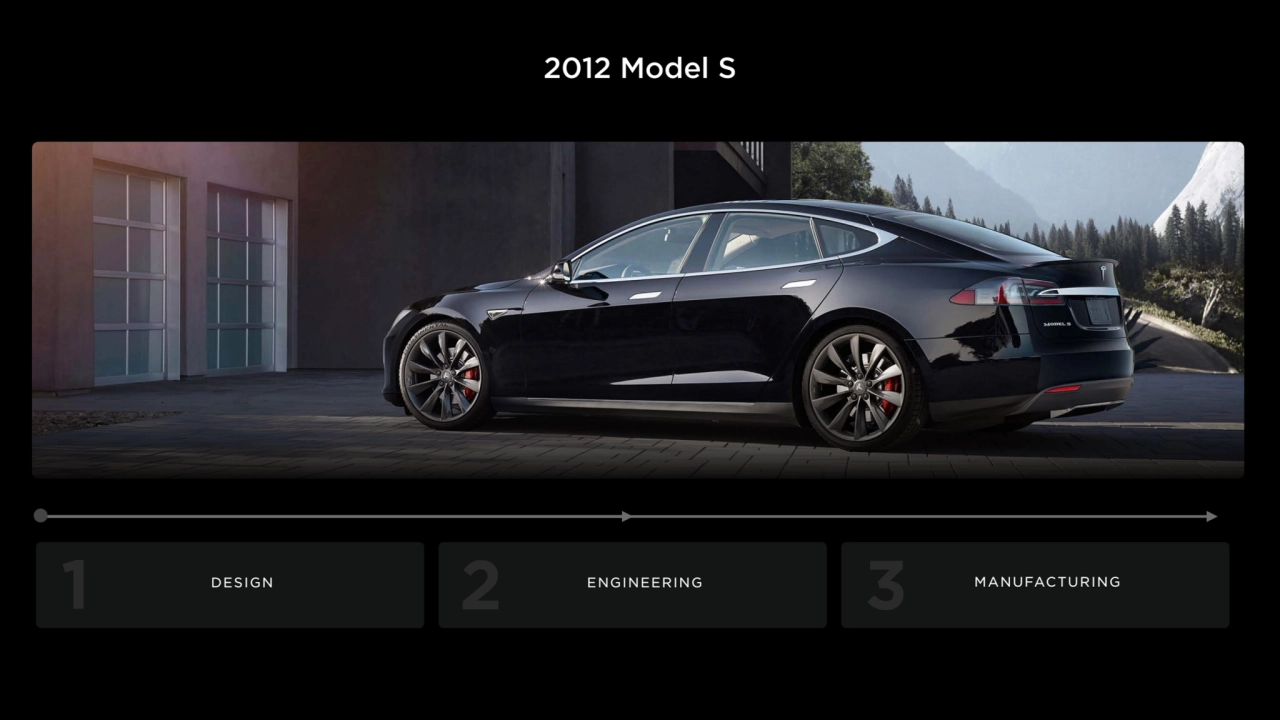
- 34. 2012 Model S DESIGN ENGINEERING MANUFACTURING 1 2 3
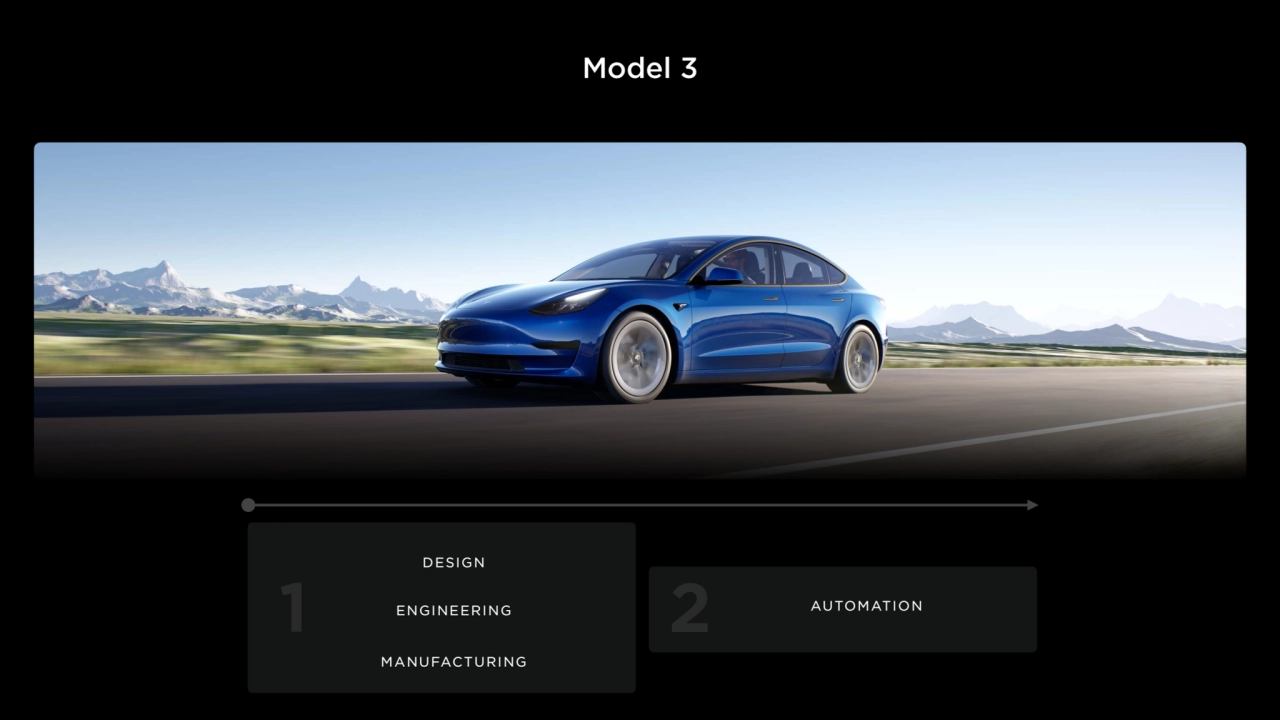
- 35. Model 3 DESIGN ENGINEERING MANUFACTURING 1 2 AUTOMATION
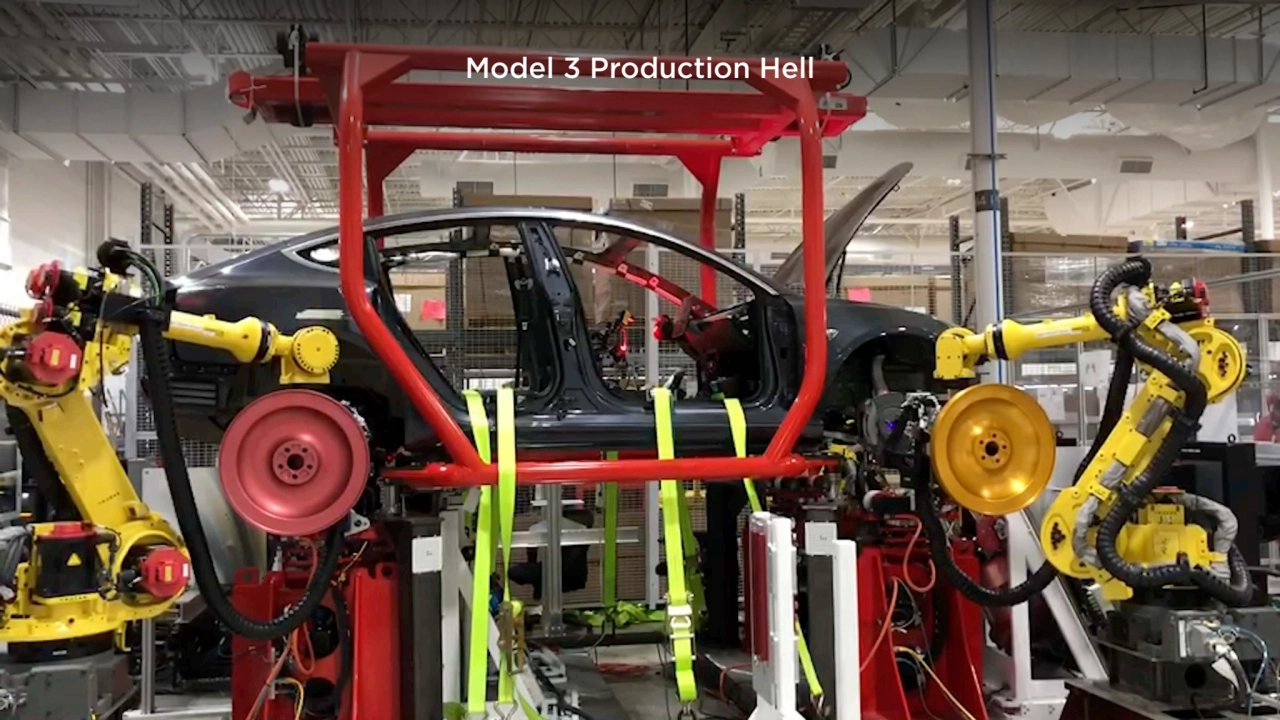
- 36. Model 3 Production Hell
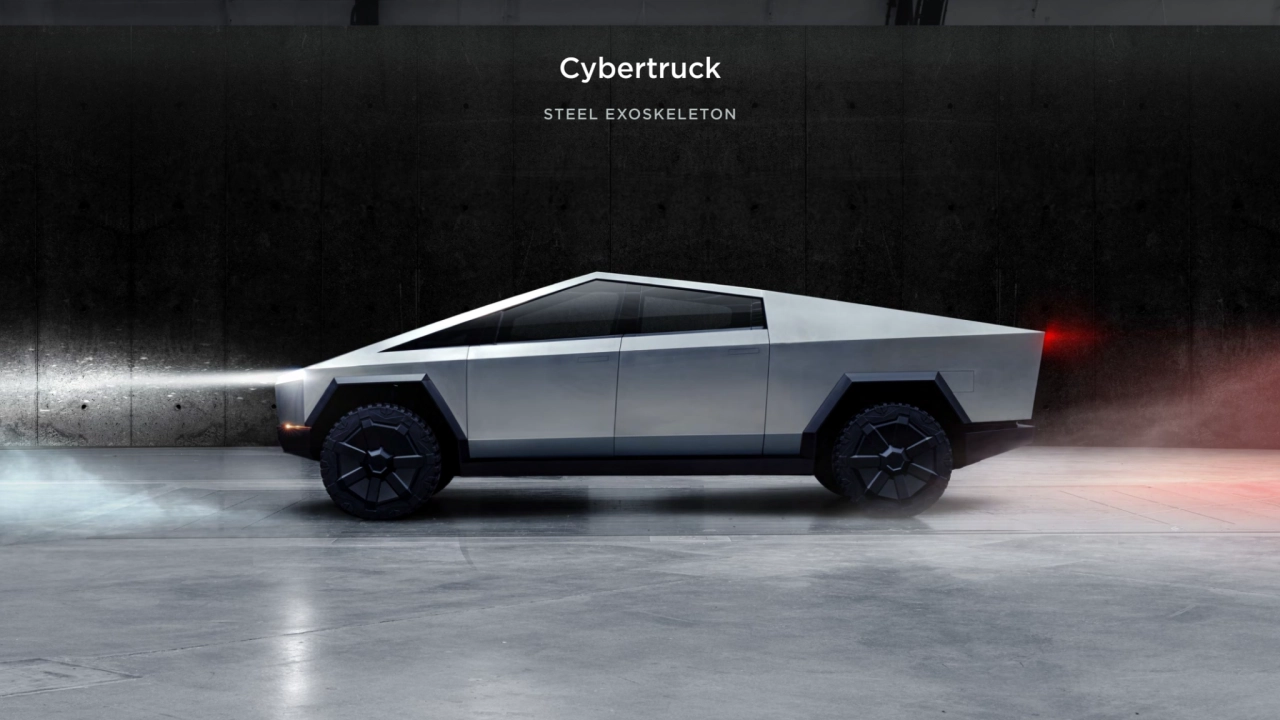
- 37. Cybertruck STEEL EXOSKELETON
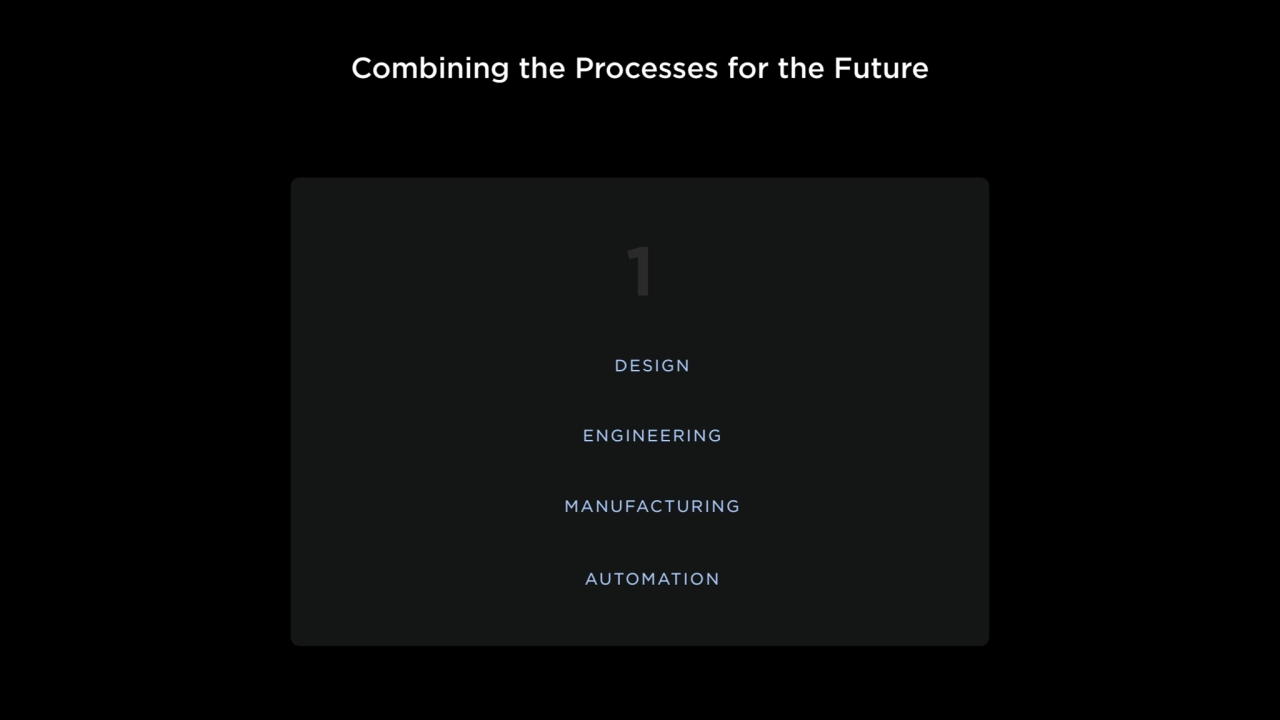
- 38. Combining the Processes for the Future DESIGN ENGINEERING MANUFACTURING 1 AUTOMATION
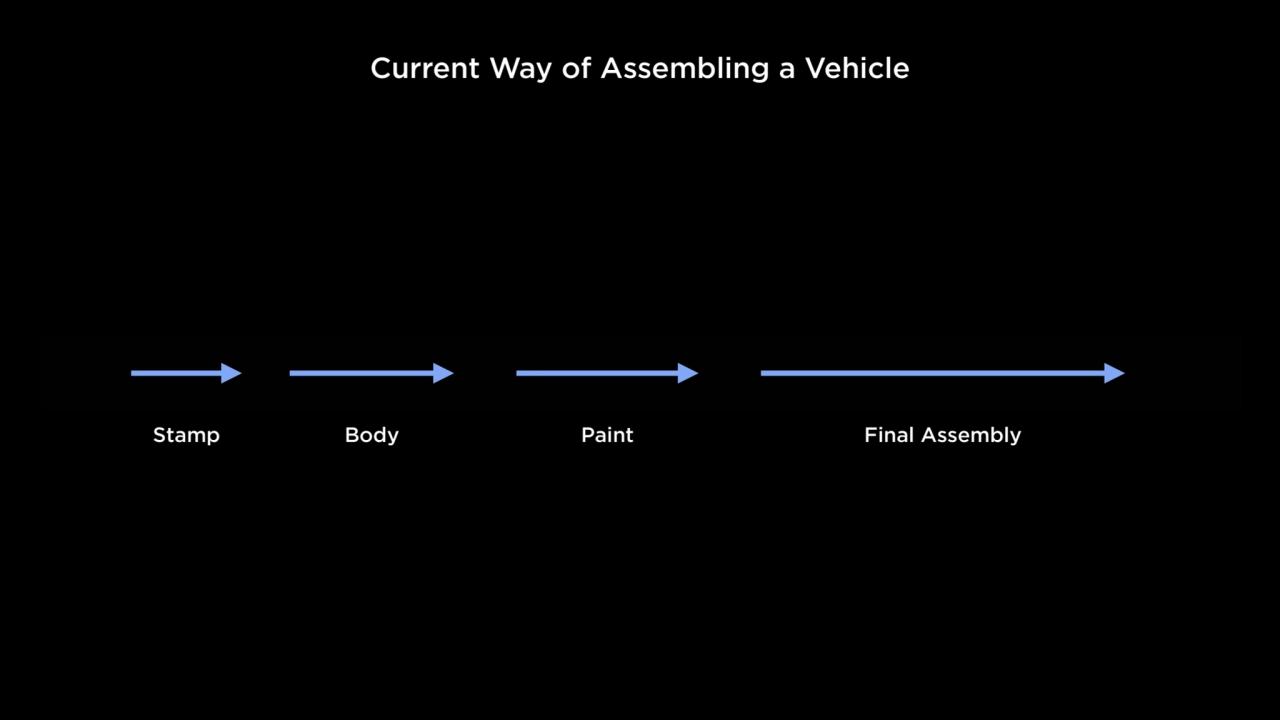
- 39. Current Way of Assembling a Vehicle Stamp Body Paint Final Assembly
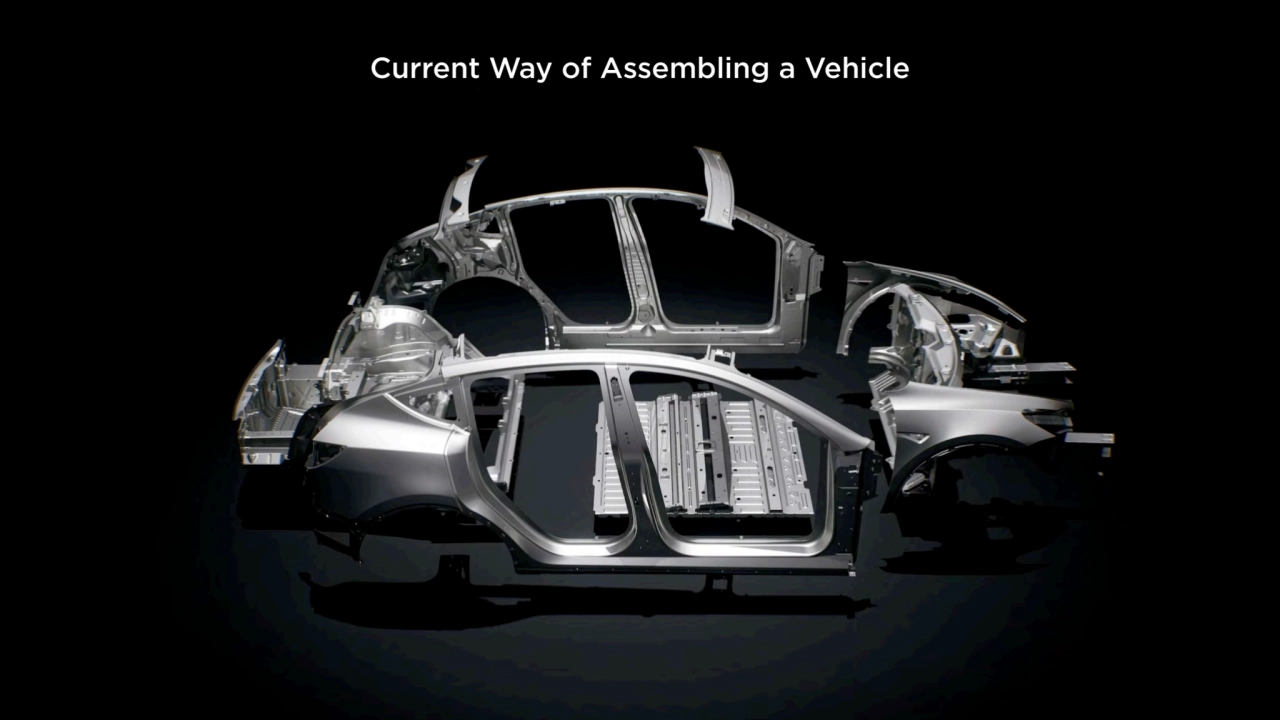
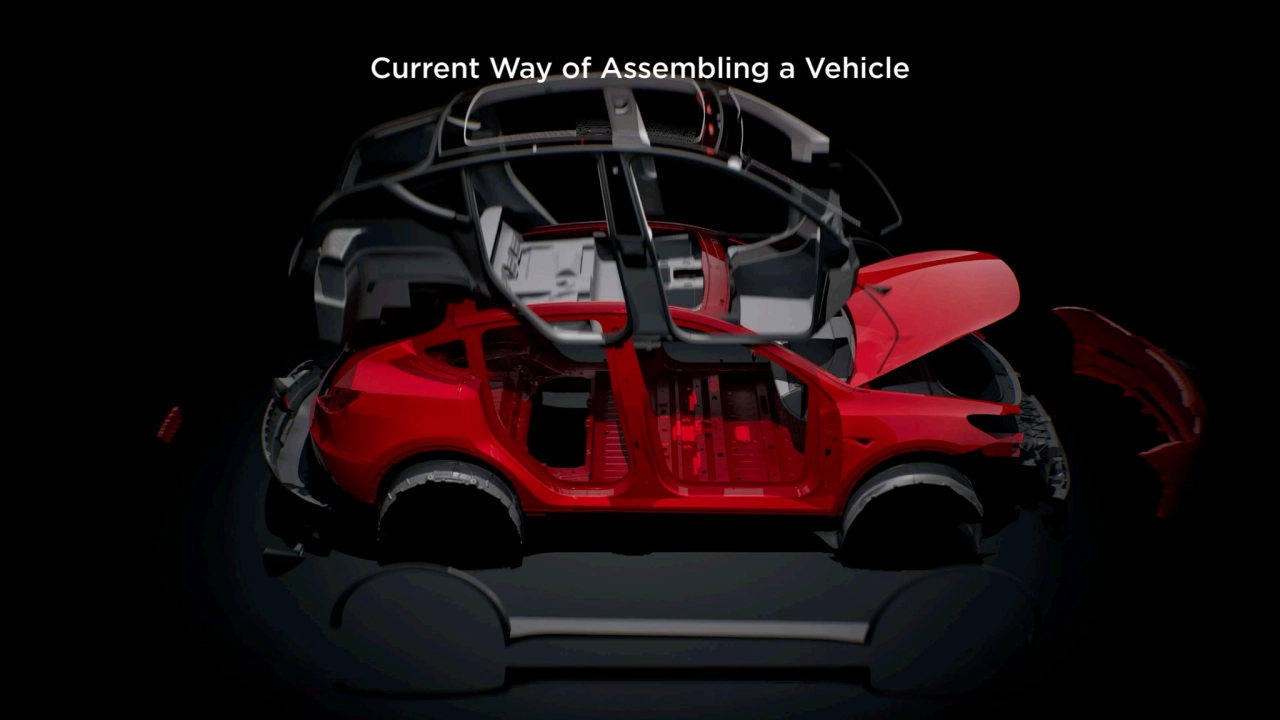
- 40. Current Way of Assembling a Vehicle
- 41. Current Way of Assembling a Vehicle
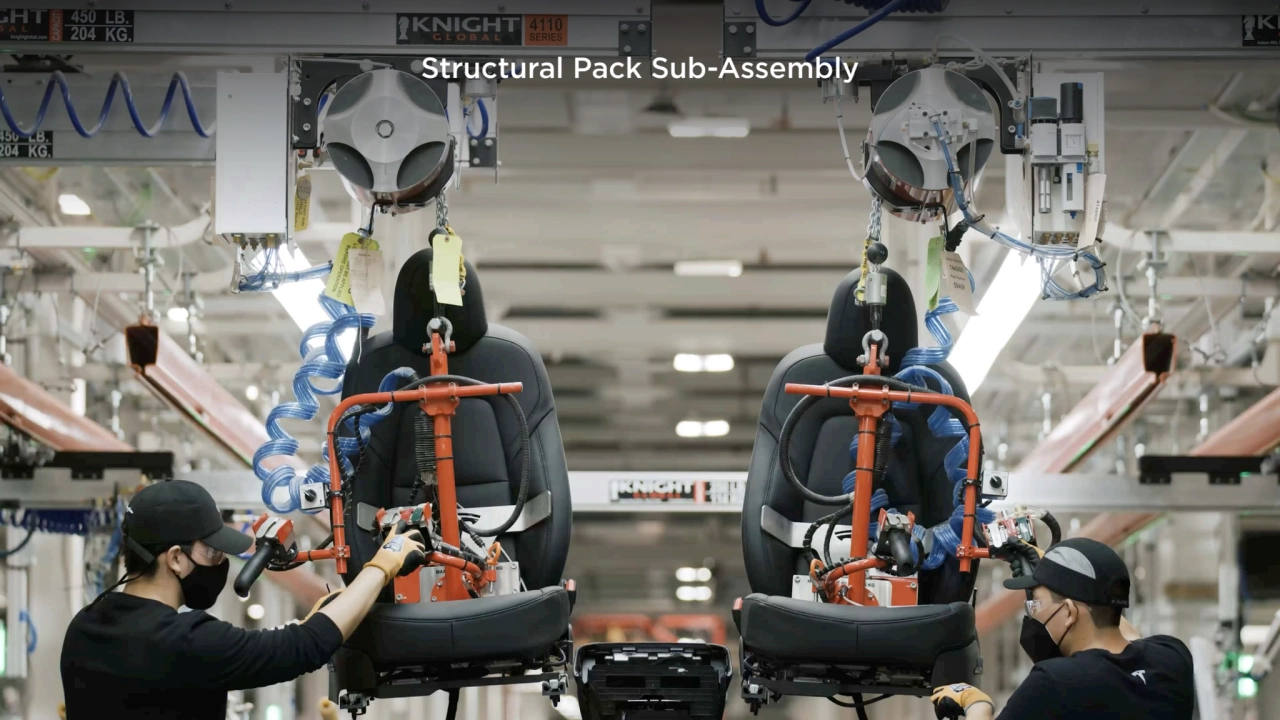
- 42. Structural Pack Sub-Assembly
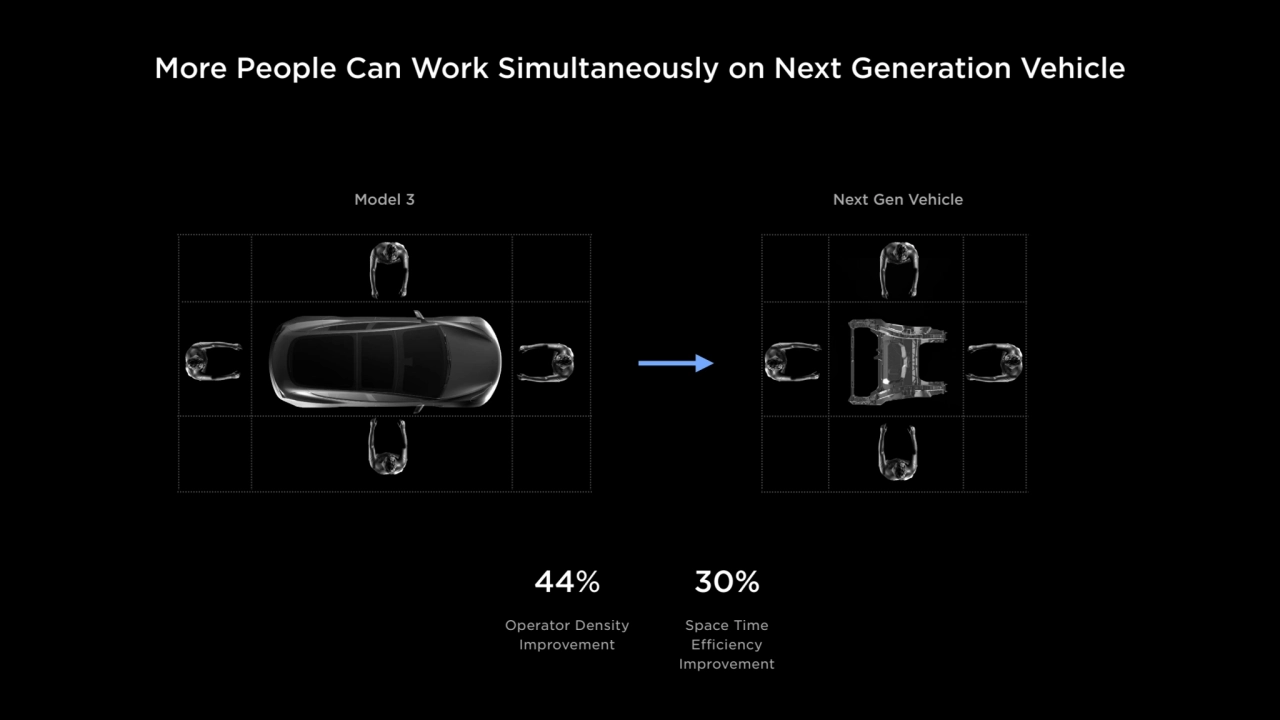
- 43. More People Can Work Simultaneously on Next Generation Vehicle 44% Operator Density Improvement 30% Space Time Efficiency Improvement Model 3 Next Gen Vehicle
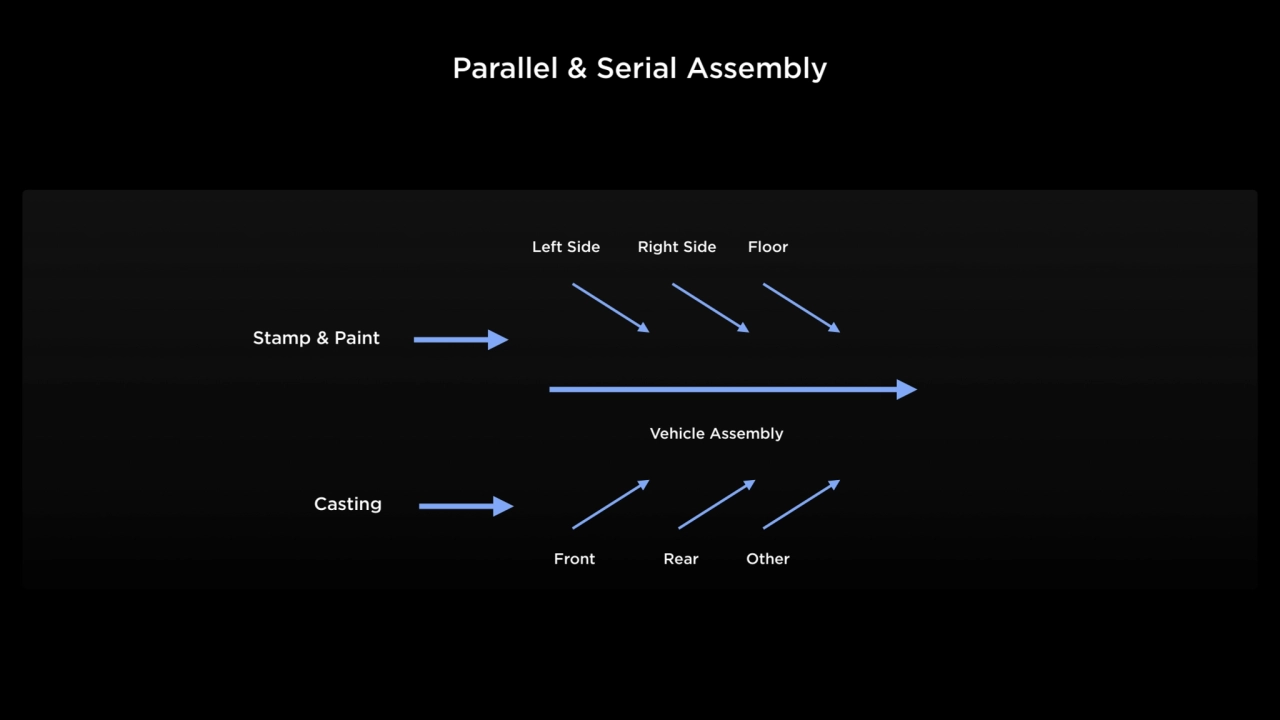
- 44. Parallel & Serial Assembly Stamp & Paint Casting Vehicle Assembly Left Side Right Side Floor Front Rear Other
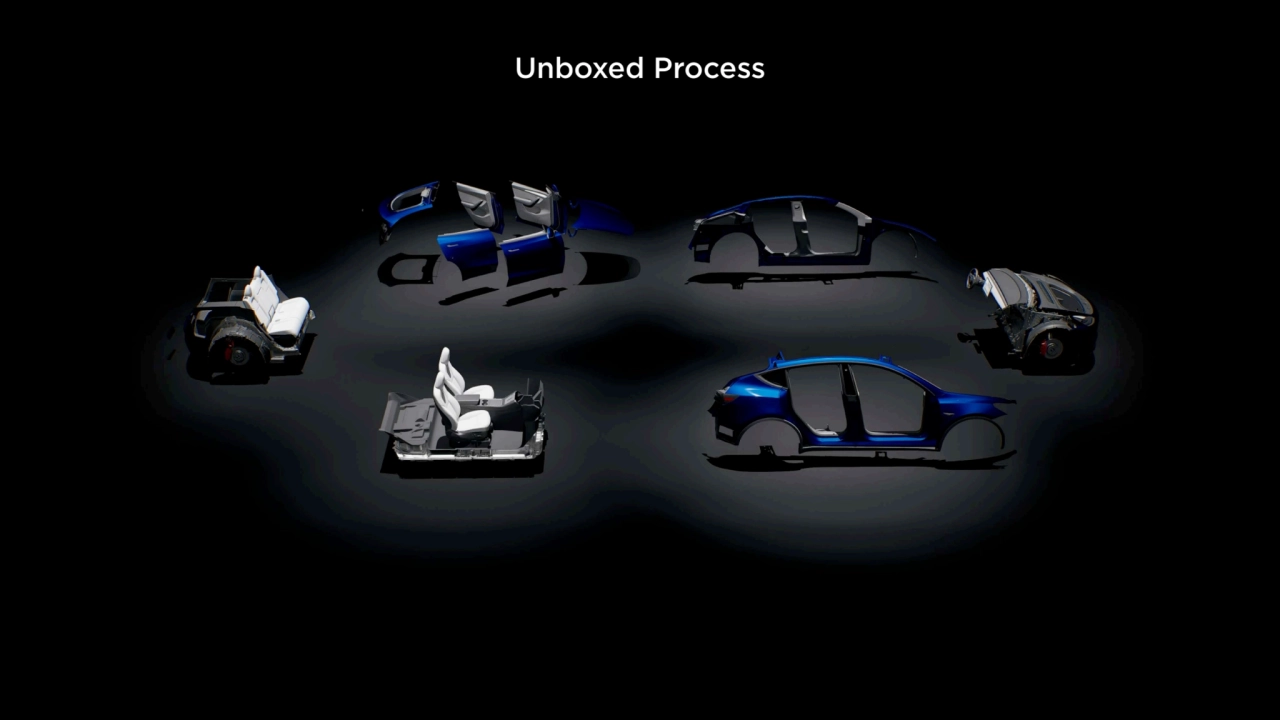
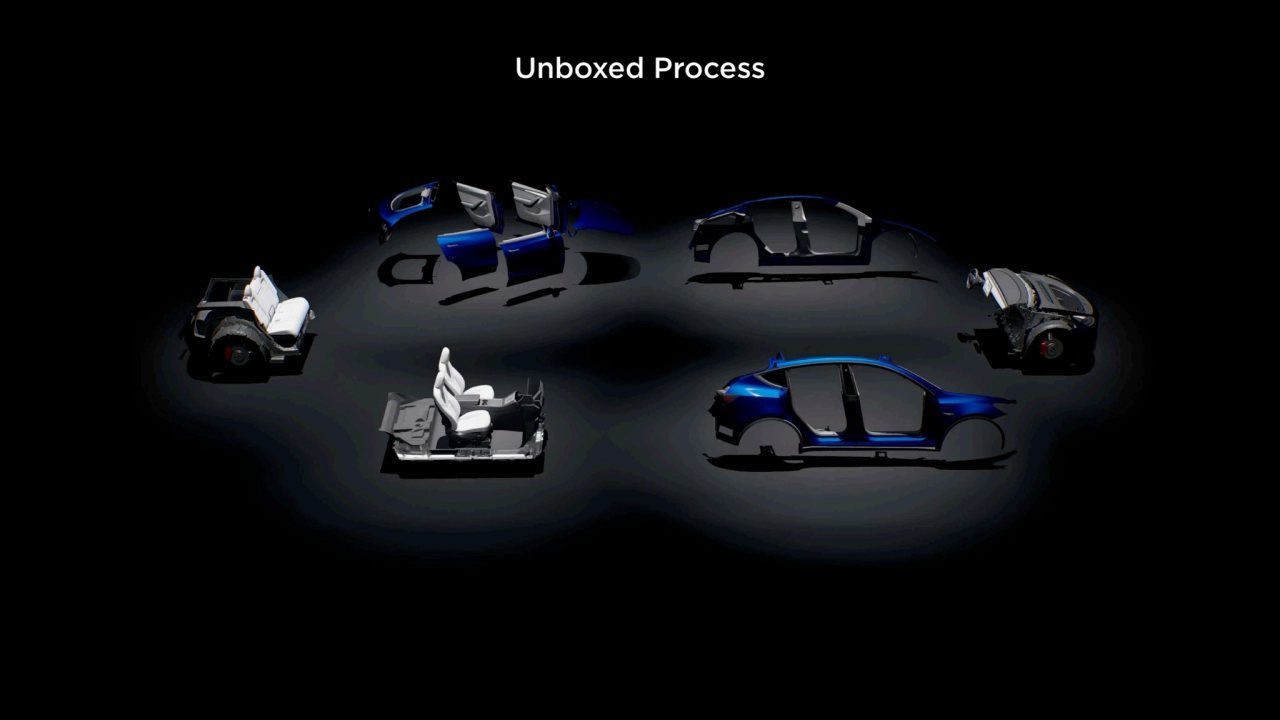
- 45. Unboxed Process
- 46. Unboxed Process
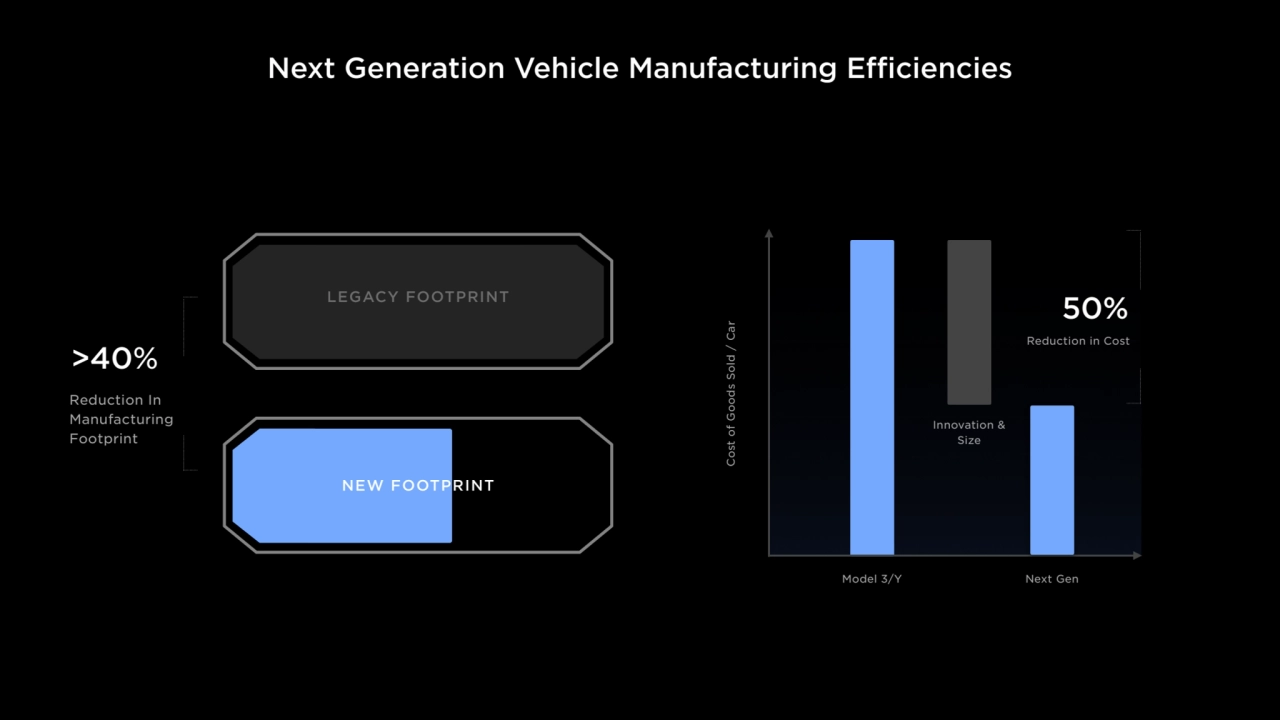
- 47. Next Generation Vehicle Manufacturing Efficiencies >40% Reduction In Manufacturing Footprint LEGACY FOOTPRINT NEW FOOTPRINT Cost of Goods Sold / Car Model 3/Y Next Gen 50% Reduction in Cost Innovation & Size
- 48. 02 Powertrain Colin Campbell
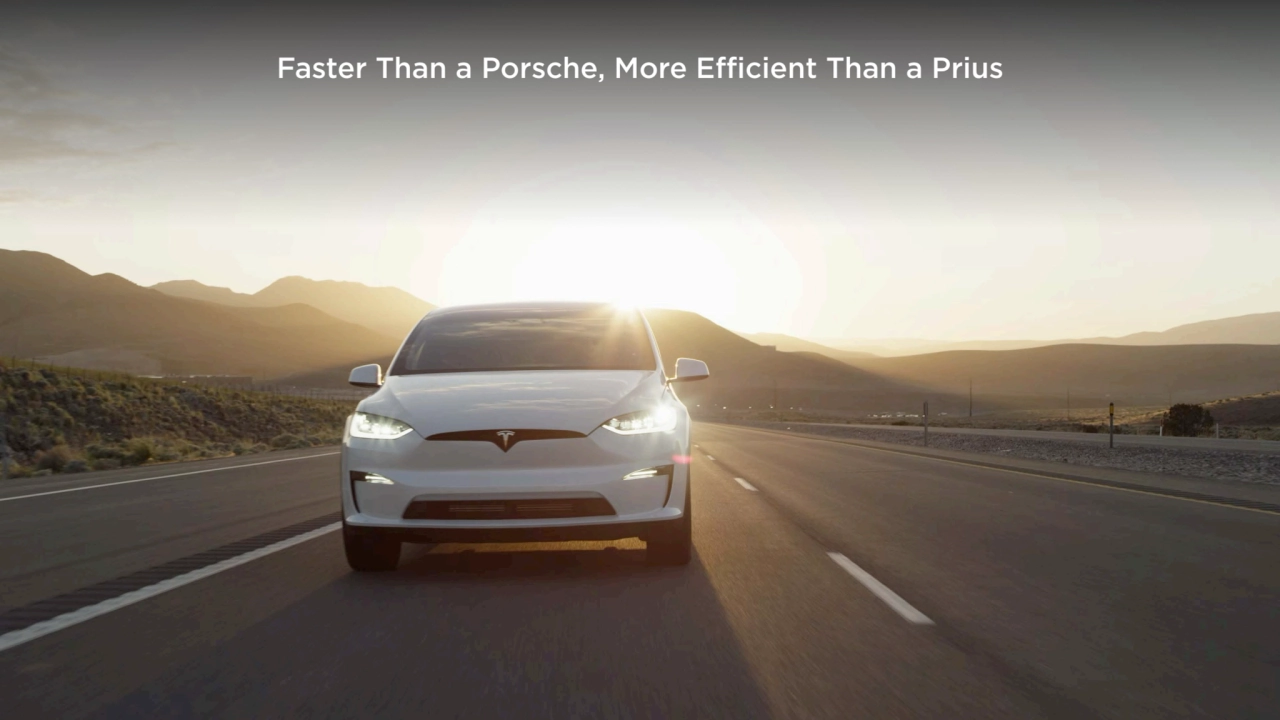
- 49. Faster Than a Porsche, More Efficient Than a Prius
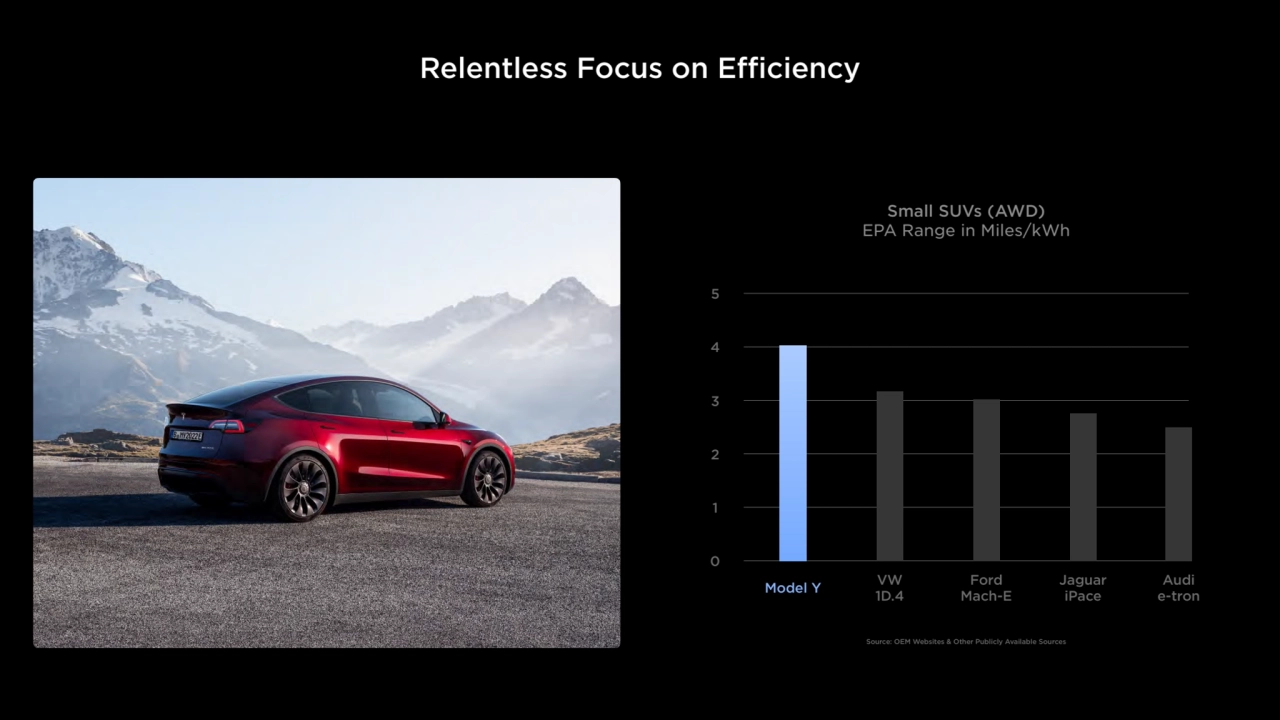
- 50. Small SUVs (AWD) EPA Range in Miles/kWh 5 4 3 2 1 0 Model Y VW 1D.4 Ford Mach-E Jaguar iPace Relentless Focus on Efficiency Source: OEM Websites & Other Publicly Available Sources Audi e-tron
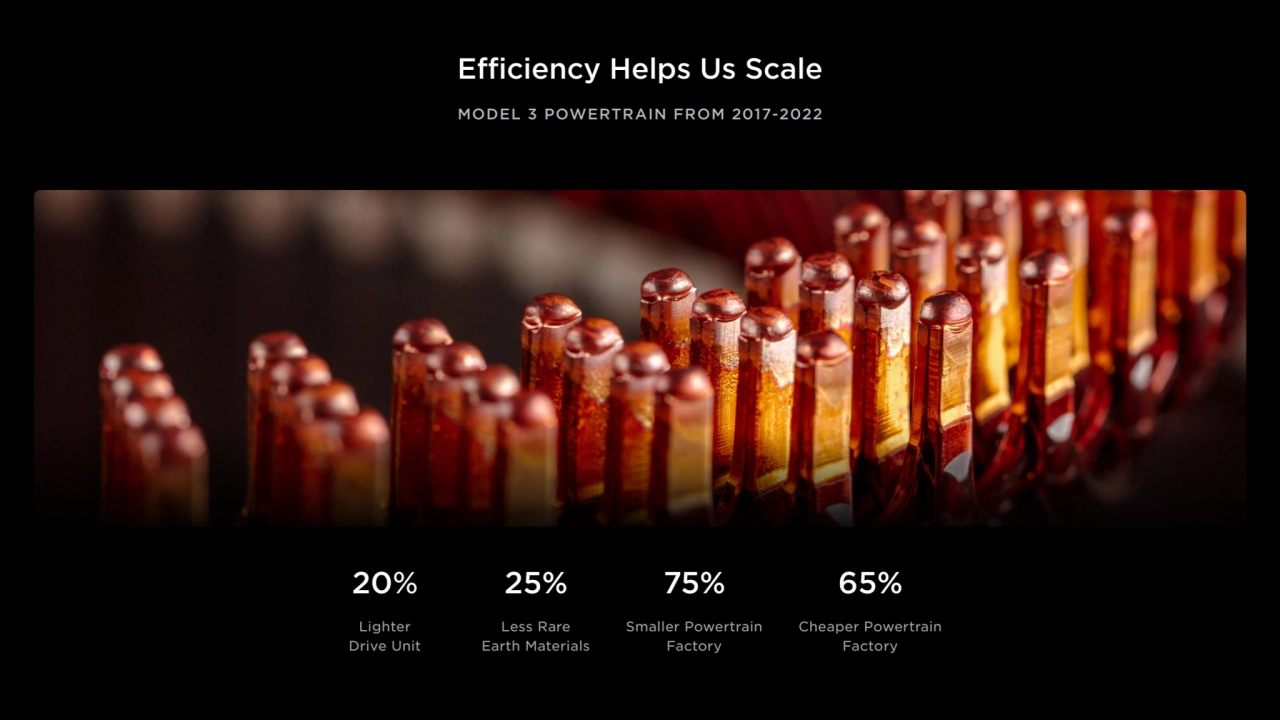
- 51. Efficiency Helps Us Scale MODEL 3 POWERTRAIN FROM 2017-2022 20% Lighter Drive Unit 25% Less Rare Earth Materials 75% Smaller Powertrain Factory 65% Cheaper Powertrain Factory
- 52. The Key: Holistic Thinking
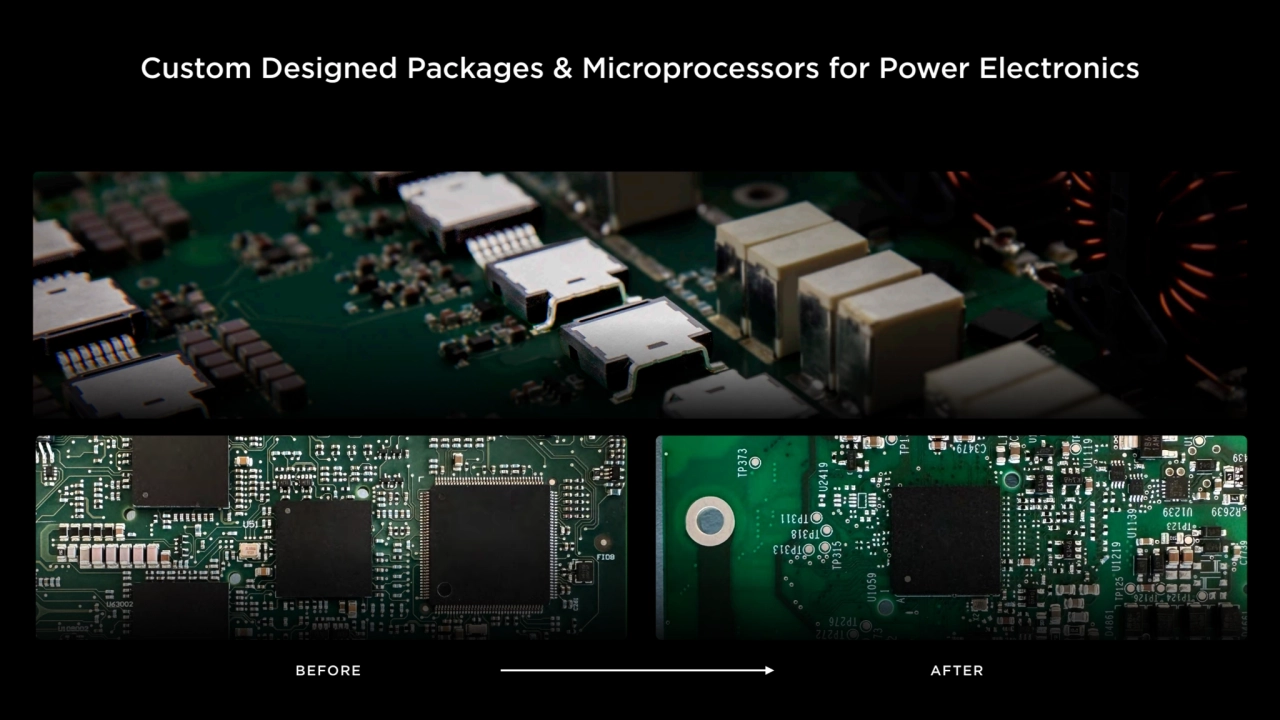
- 53. Custom Designed Packages & Microprocessors for Power Electronics Custom Microprocessor for High-Power Electronics BEFORE AFTER
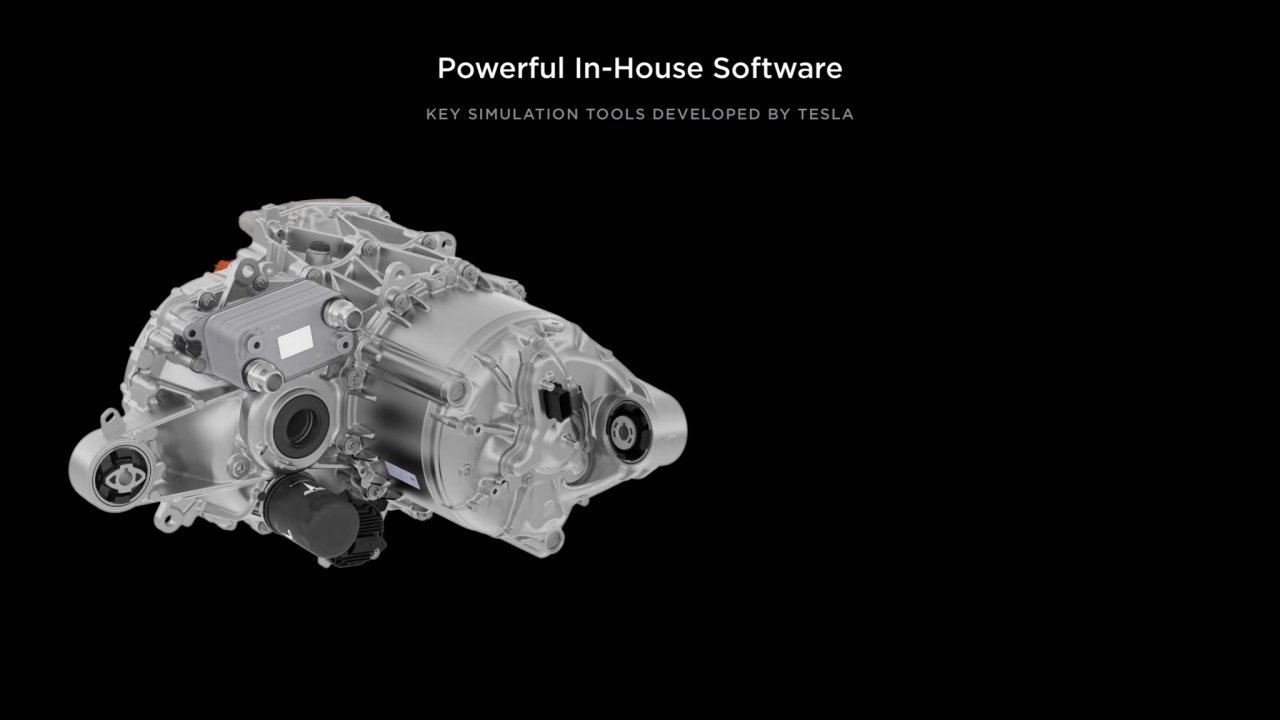
- 54. Powerful In-House Software KEY SIMULATION TOOLS DEVELOPED BY TESLA
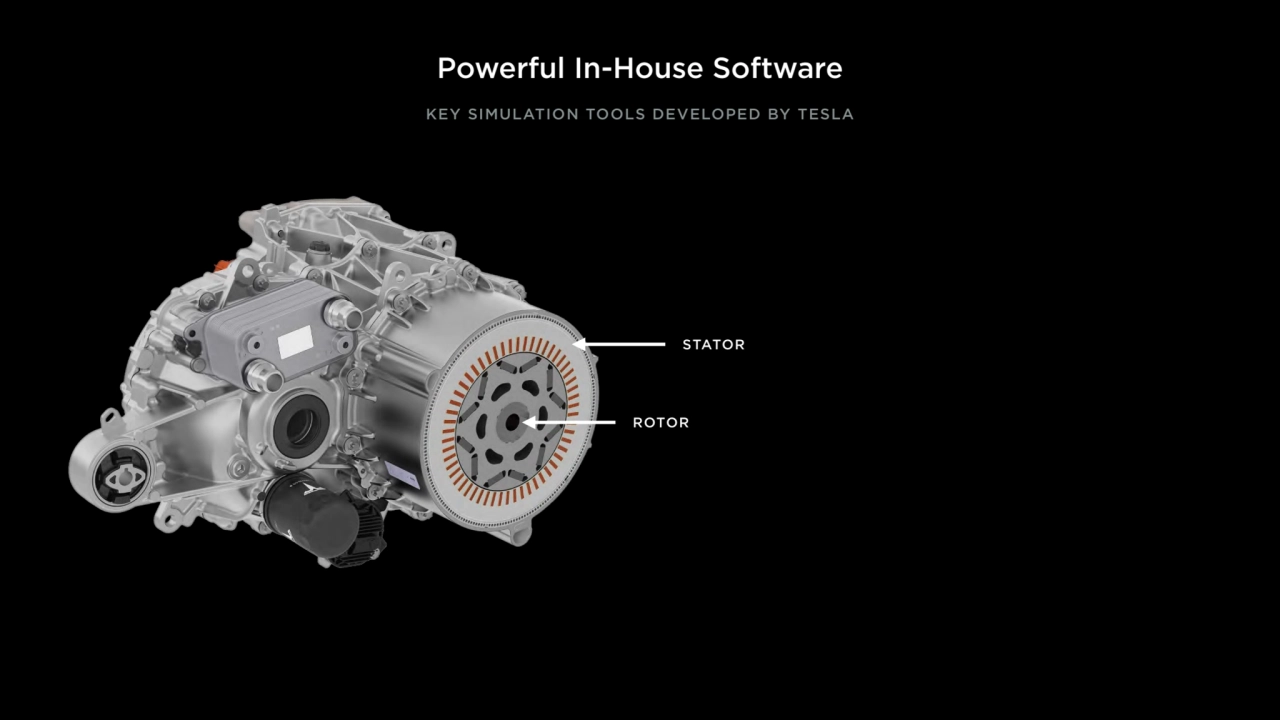
- 55. Powerful In-House Software STATOR ROTOR KEY SIMULATION TOOLS DEVELOPED BY TESLA
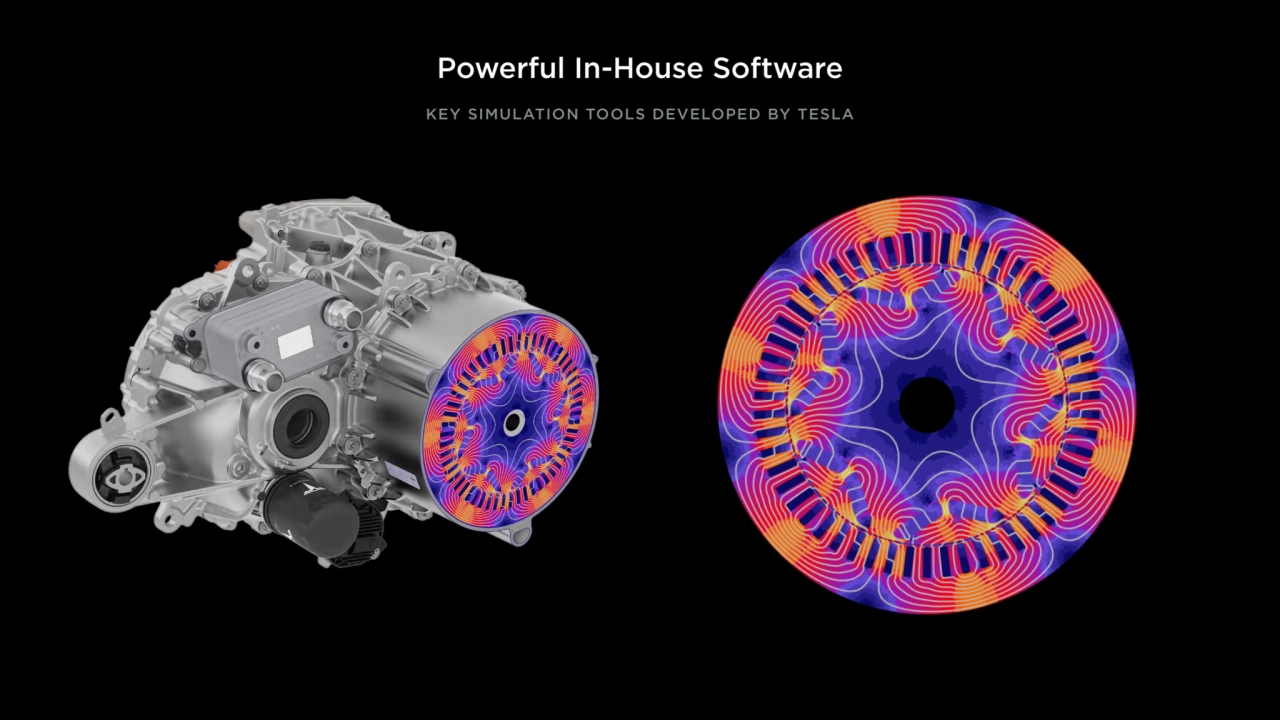
- 56. Powerful In-House Software KEY SIMULATION TOOLS DEVELOPED BY TESLA
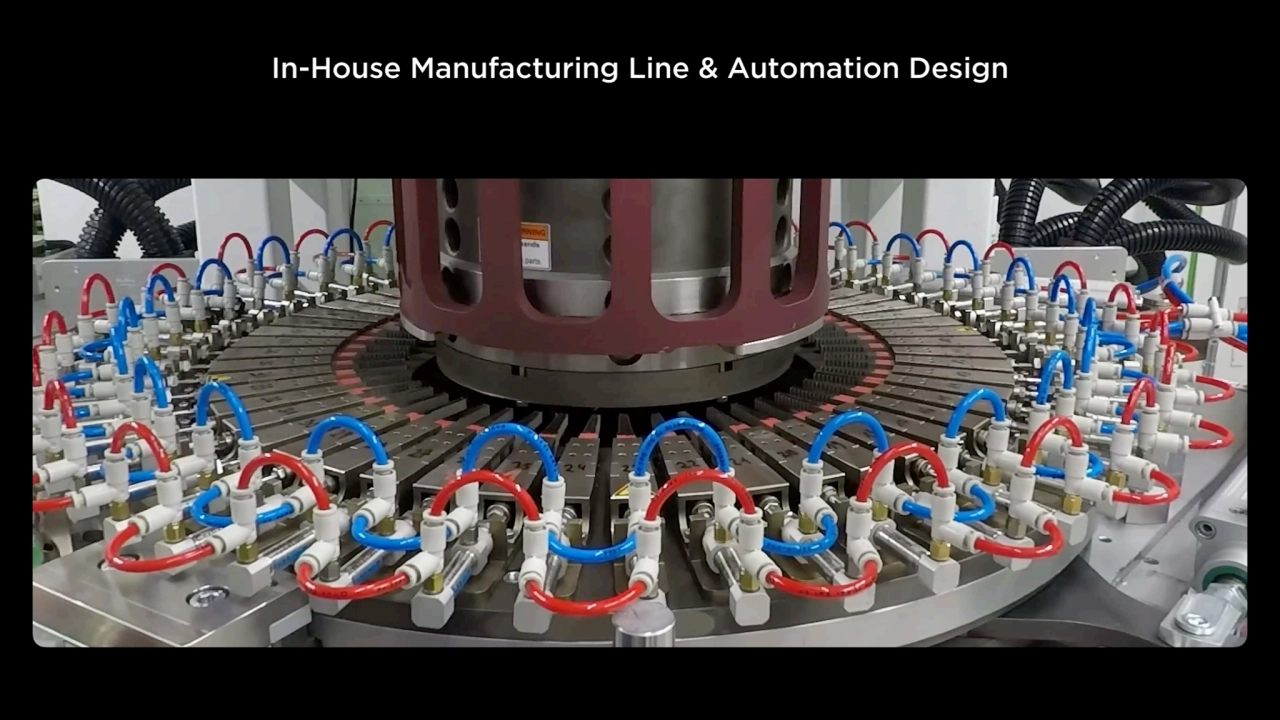
- 57. In-House Manufacturing Line & Automation Design
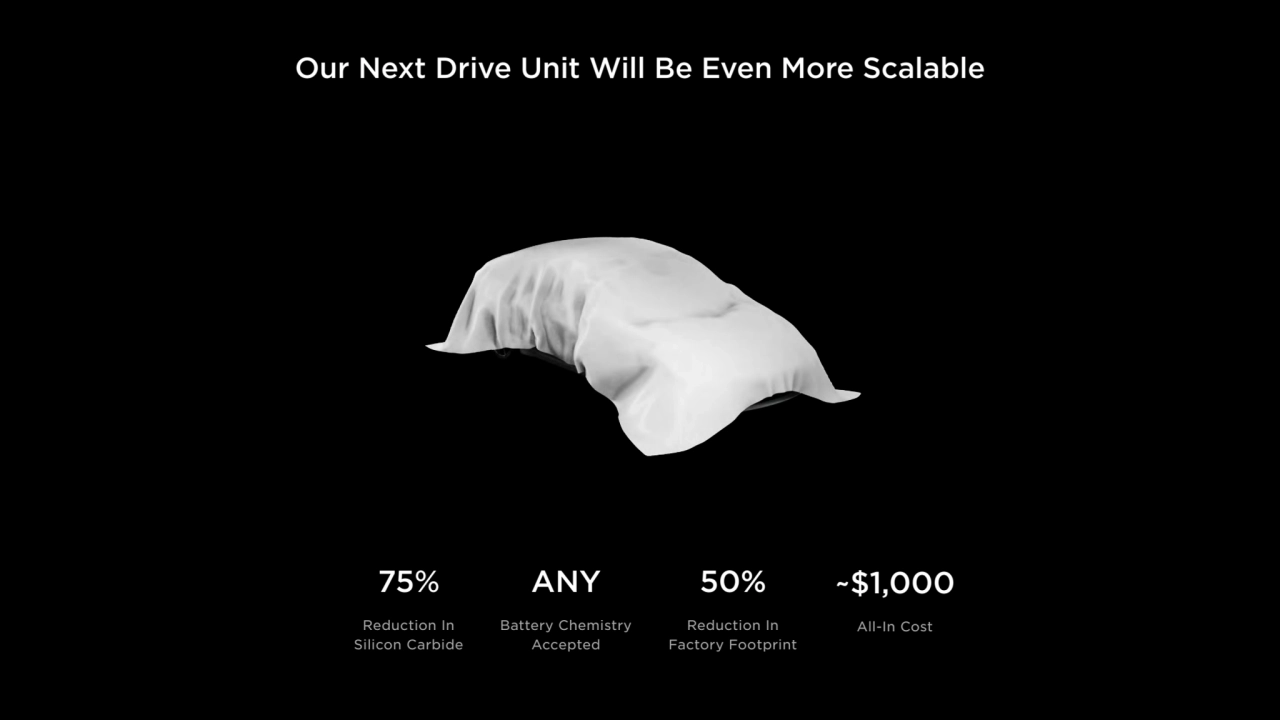
- 58. Our Next Drive Unit Will Be Even More Scalable 75% Reduction In Silicon Carbide ANY Battery Chemistry Accepted ~$1,000 All-In Cost 50% Reduction In Factory Footprint
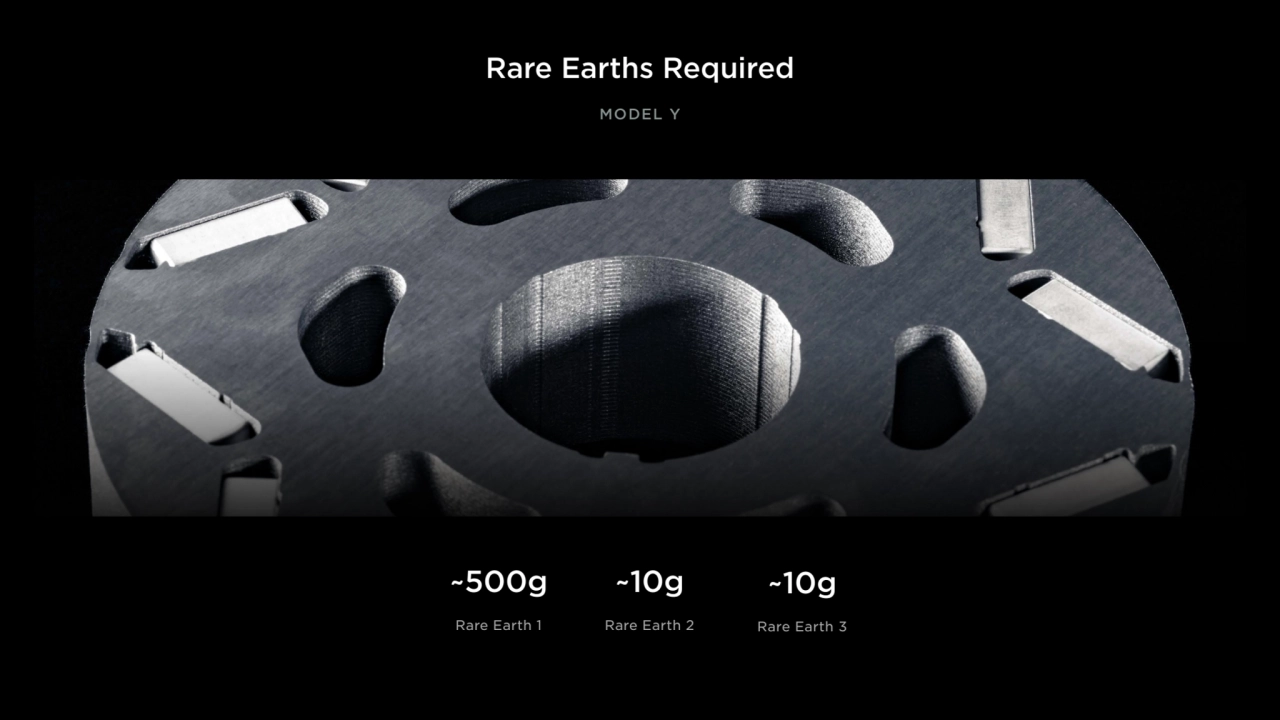
- 59. Rare Earths Required ~500g Rare Earth 1 ~10g Rare Earth 2 ~10g Rare Earth 3 MODEL Y
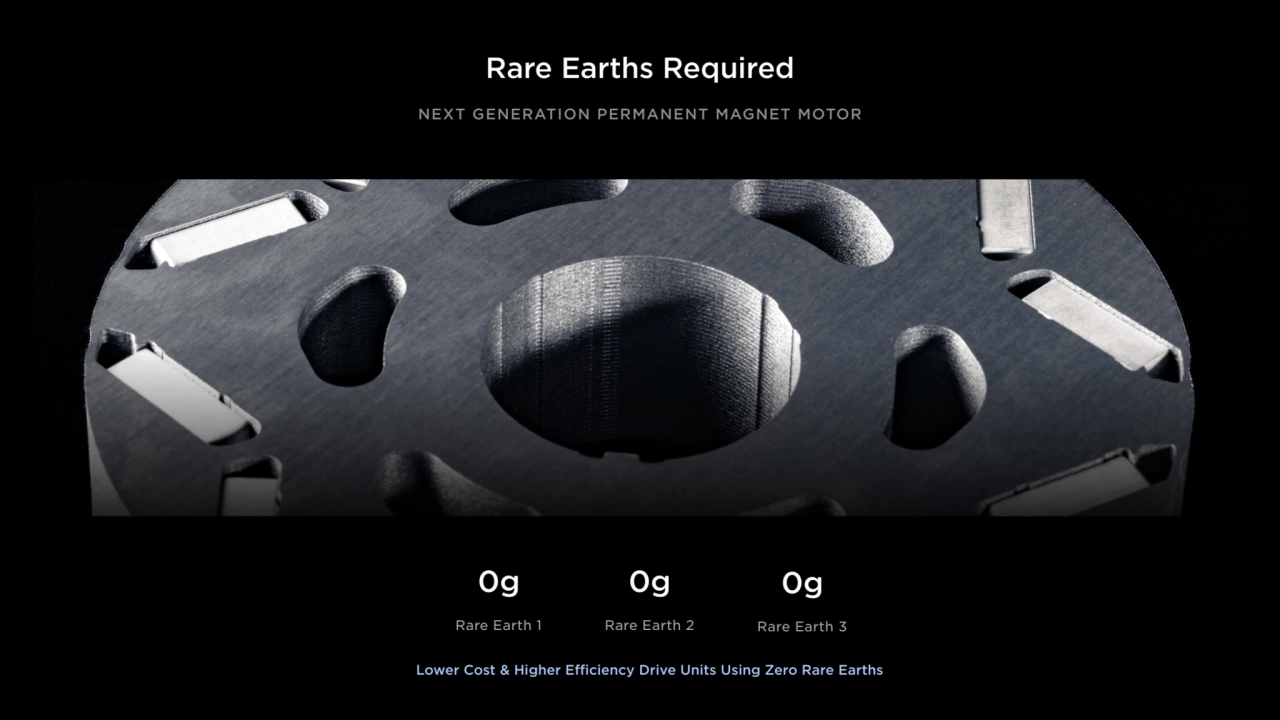
- 60. Rare Earths Required 0g Rare Earth 1 0g Rare Earth 2 0g Rare Earth 3 NEXT GENERATION PERMANENT MAGNET MOTOR Lower Cost & Higher Efficiency Drive Units Using Zero Rare Earths
- 61. 03 Electronic Architecture Pete Bannon
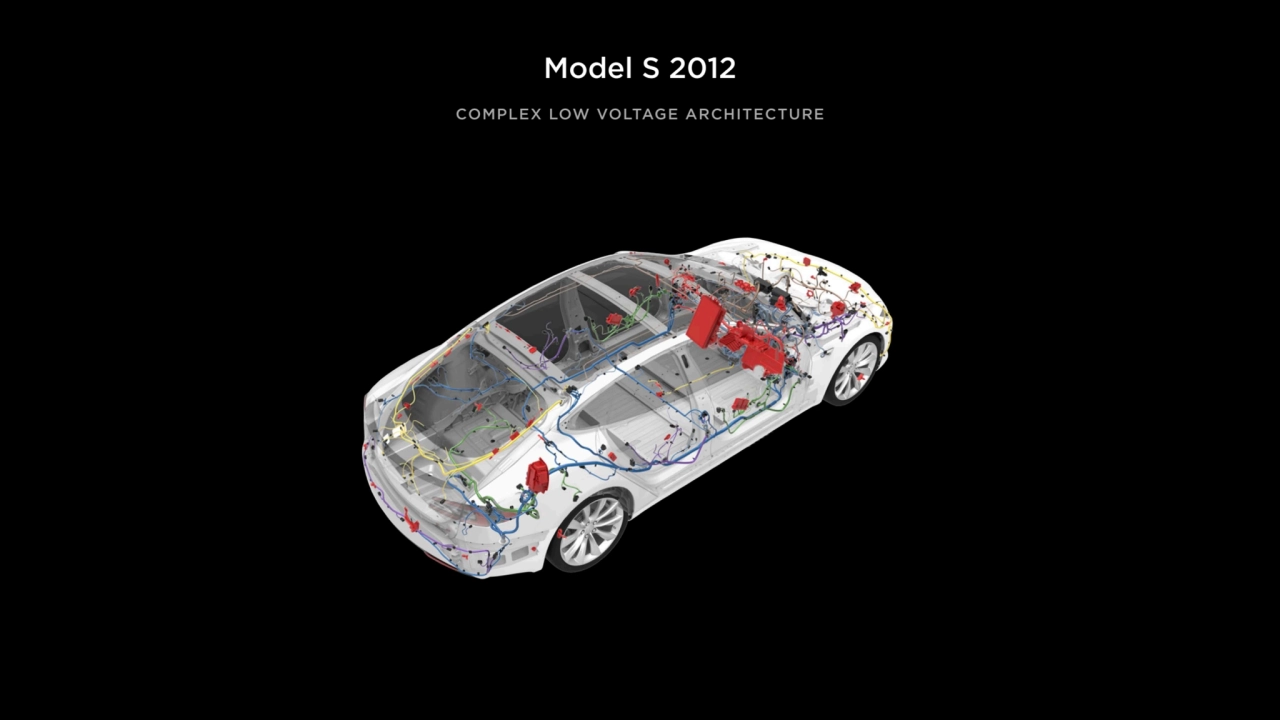
- 62. Model S 2012 COMPLEX LOW VOLTAGE ARCHITECTURE
- 63. It’s Been Messy
- 64. Progress So Far
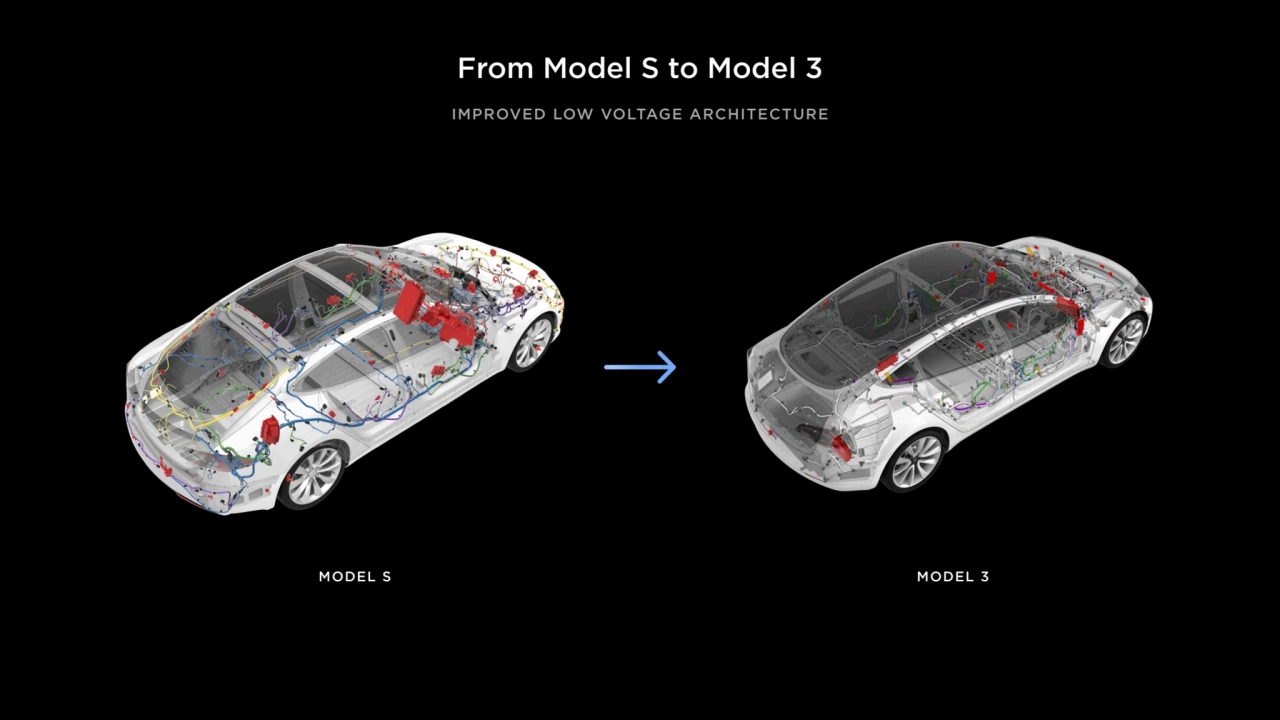
- 65. From Model S to Model 3 IMPROVED LOW VOLTAGE ARCHITECTURE MODEL S MODEL 3
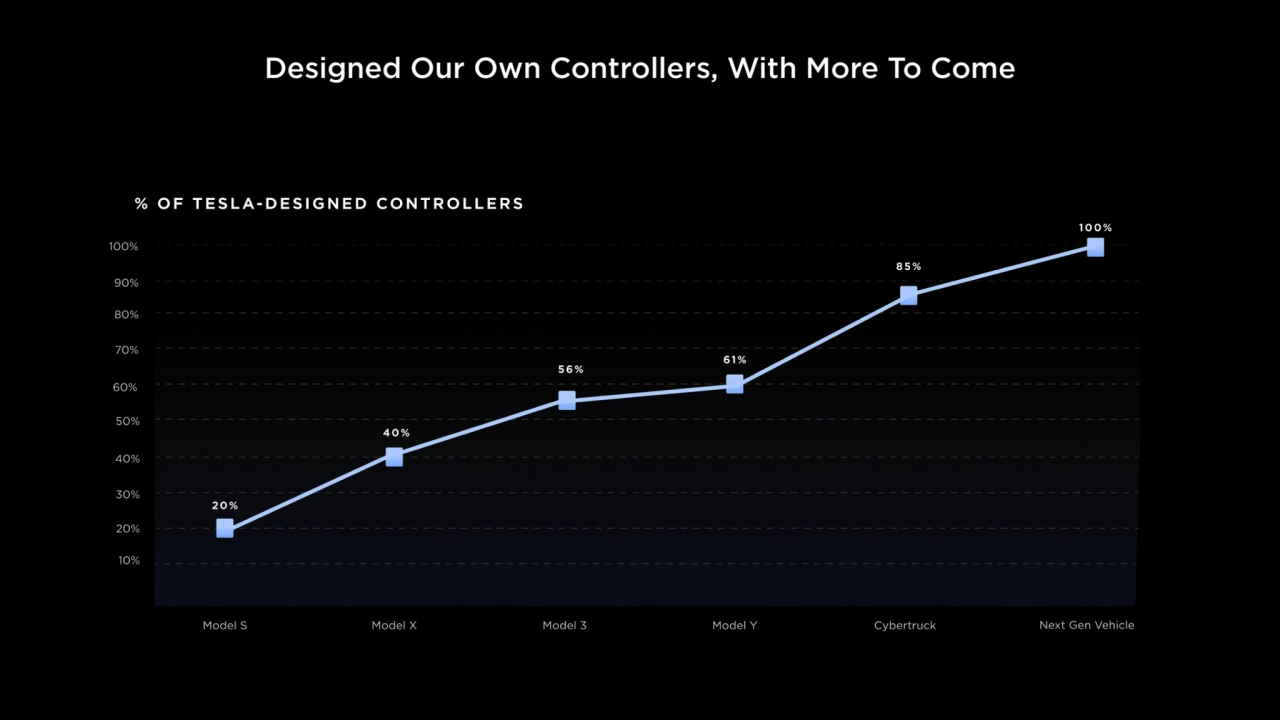
- 66. Designed Our Own Controllers, With More To Come
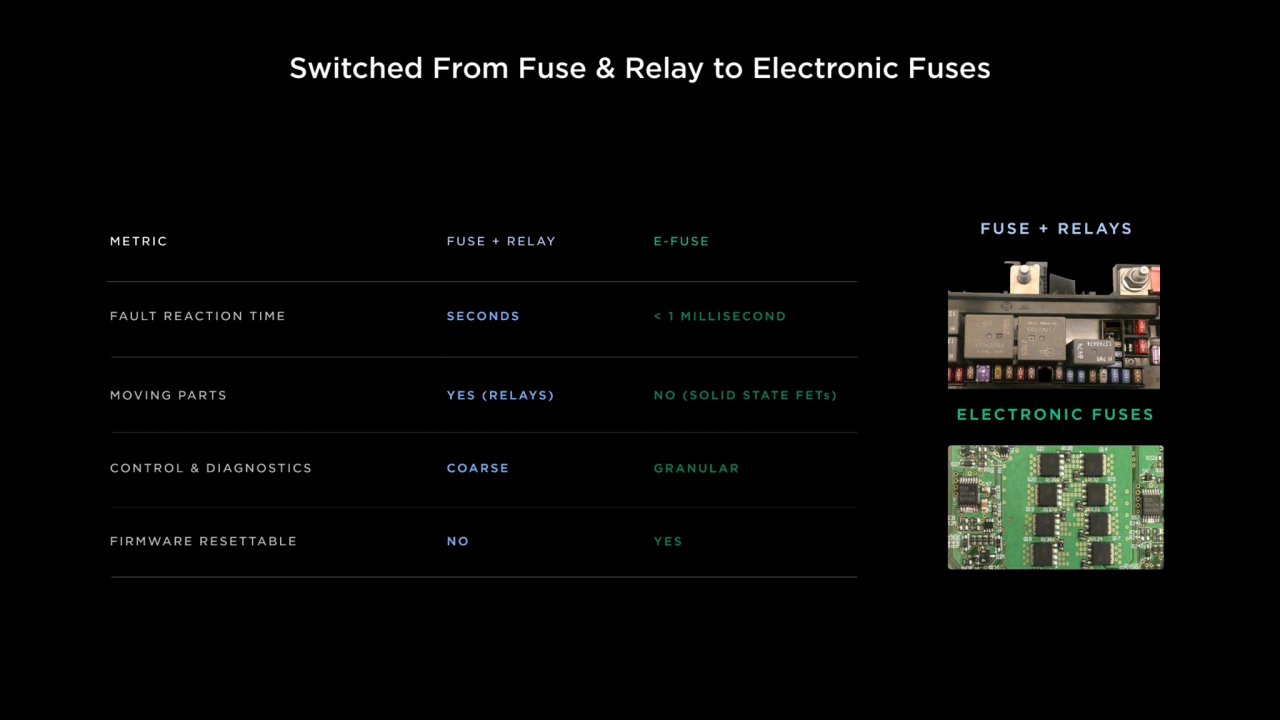
- 67. Switched From Fuse & Relay to Electronic Fuses
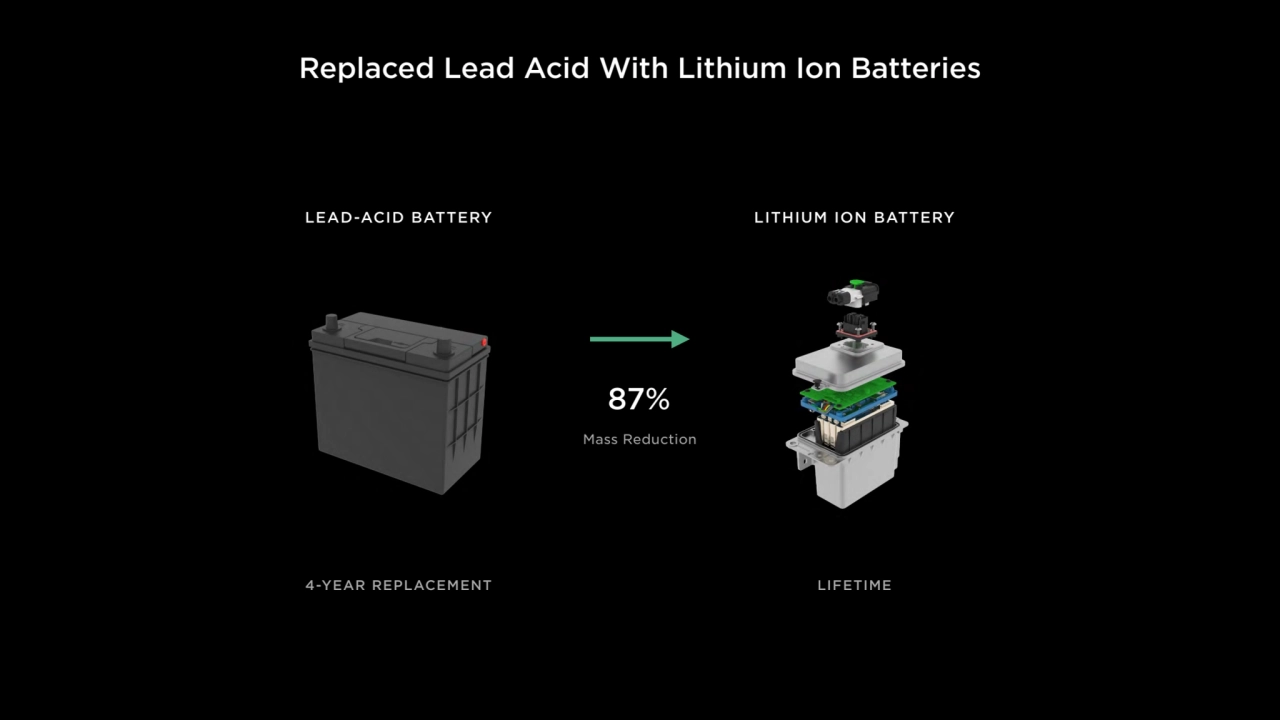
- 68. Replaced Lead Acid With Lithium Ion Batteries LEAD-ACID BATTERY LITHIUM ION BATTERY 87% Mass Reduction 4-YEAR REPLACEMENT LIFETIME
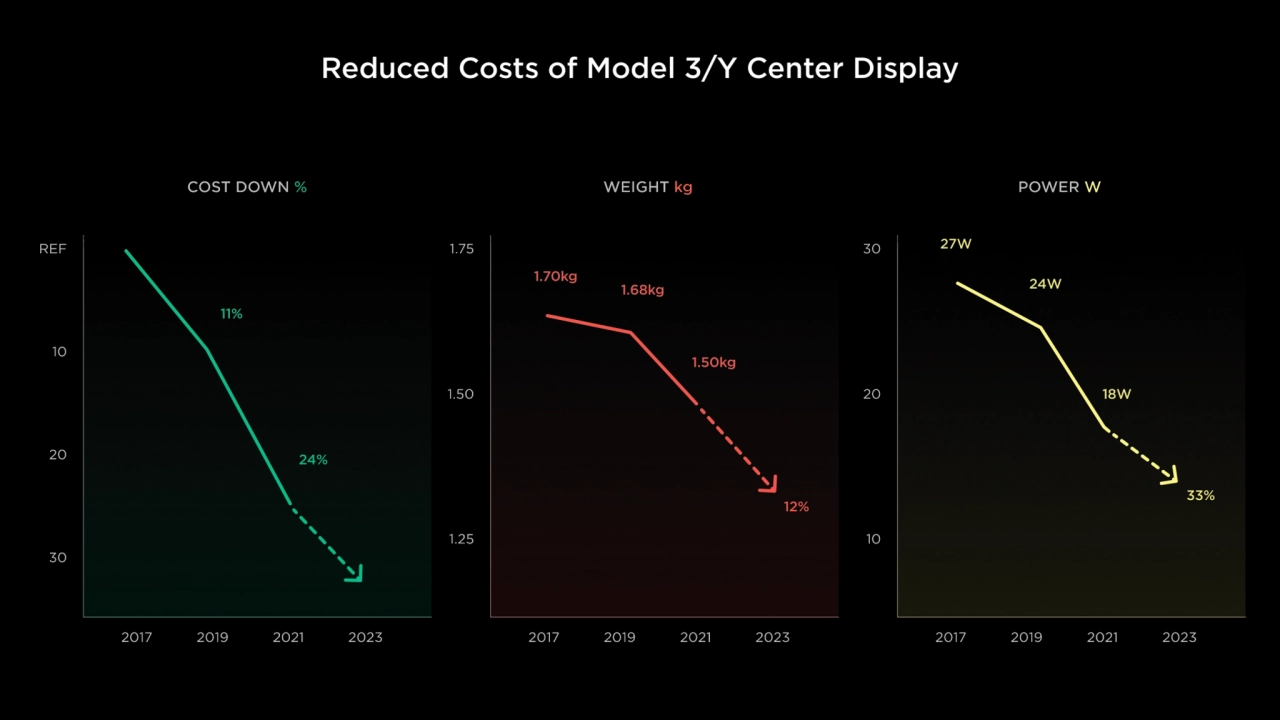
- 69. Reduced Costs of Model 3/Y Center Display
- 70. What’s Next
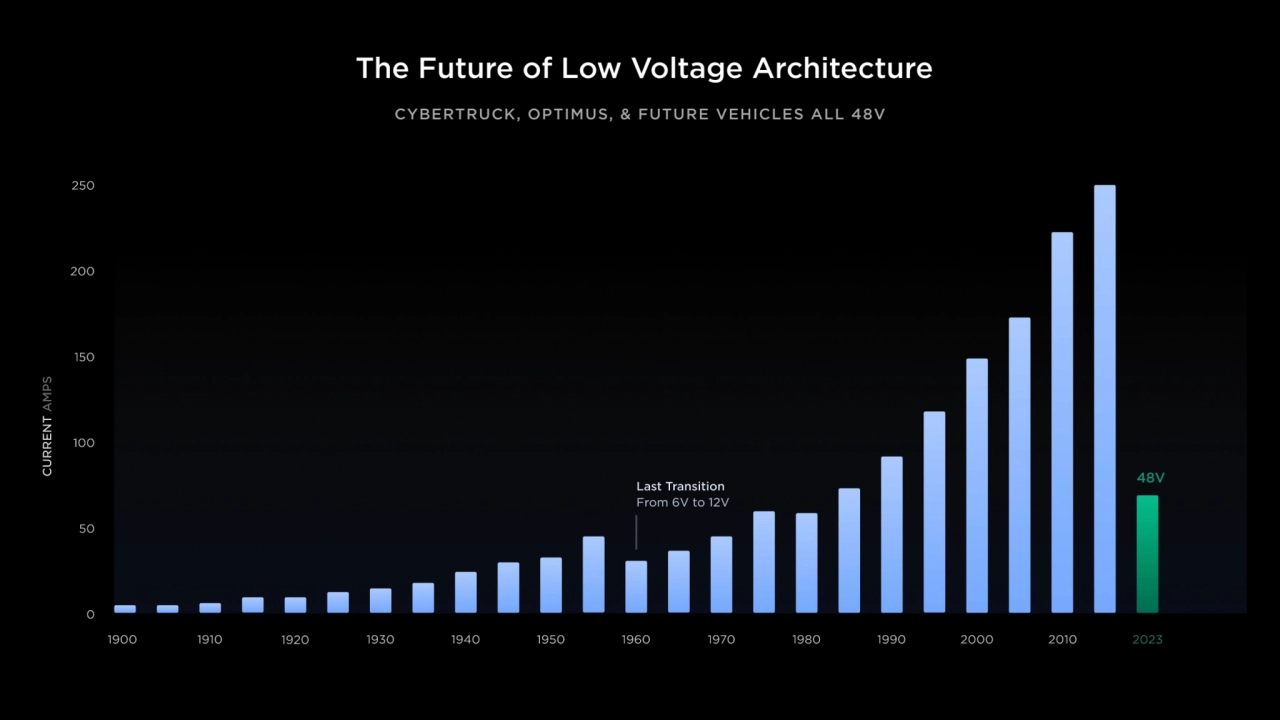
- 71. The Future of Low Voltage Architecture CYBERTRUCK, OPTIMUS, & FUTURE VEHICLES ALL 48V
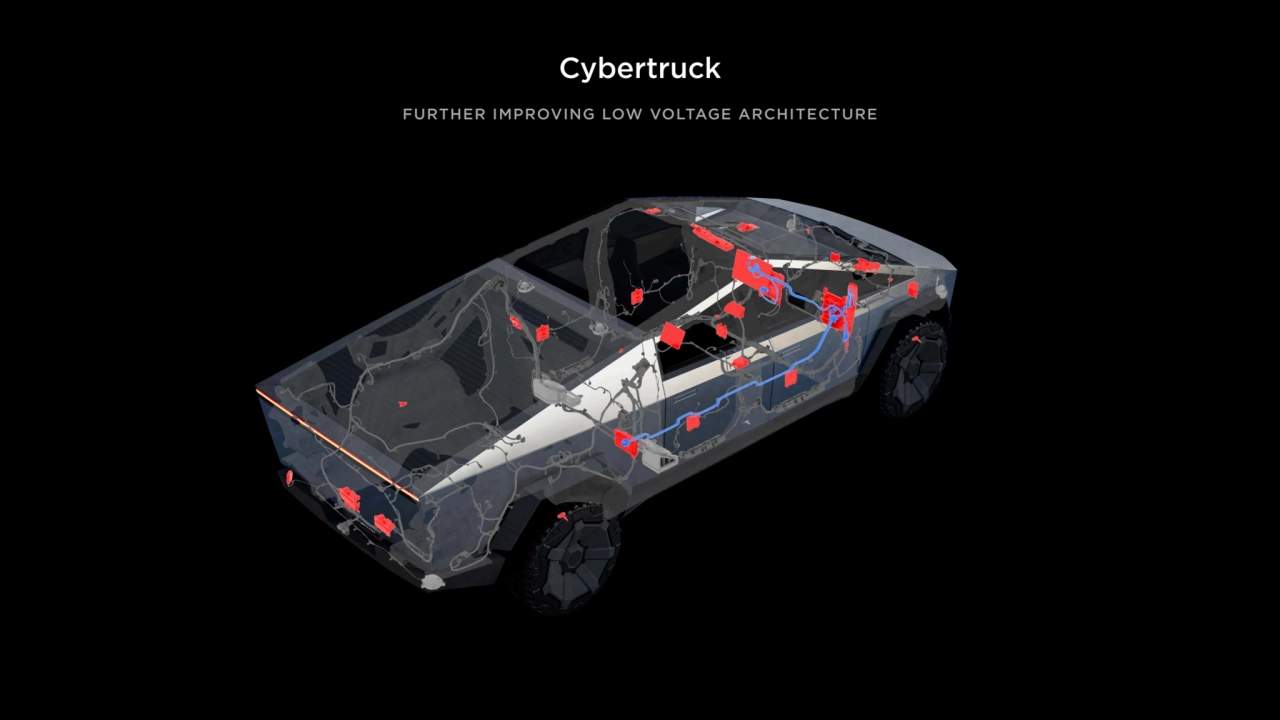
- 72. Cybertruck FURTHER IMPROVING LOW VOLTAGE ARCHITECTURE
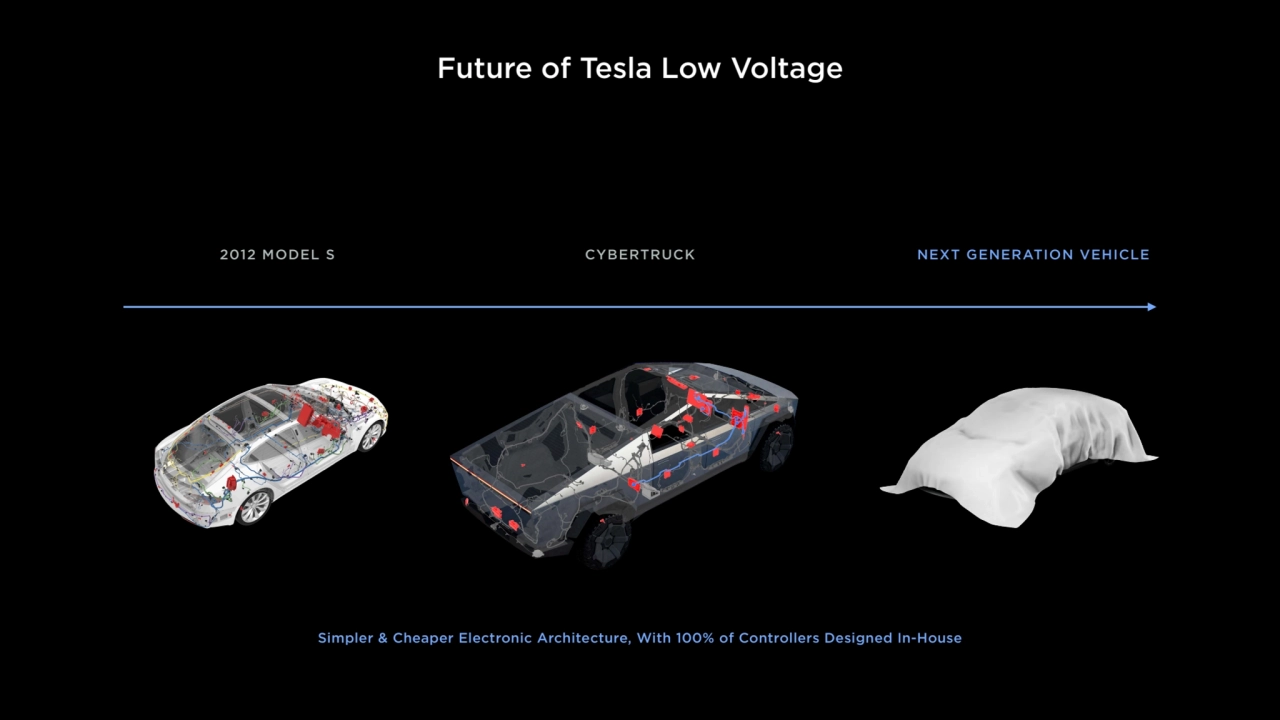
- 73. Future of Tesla Low Voltage 2012 MODEL S CYBERTRUCK NEXT GENERATION VEHICLE Simpler & Cheaper Electronic Architecture, With 100% of Controllers Designed In-House
- 74. 04 Software David Lau
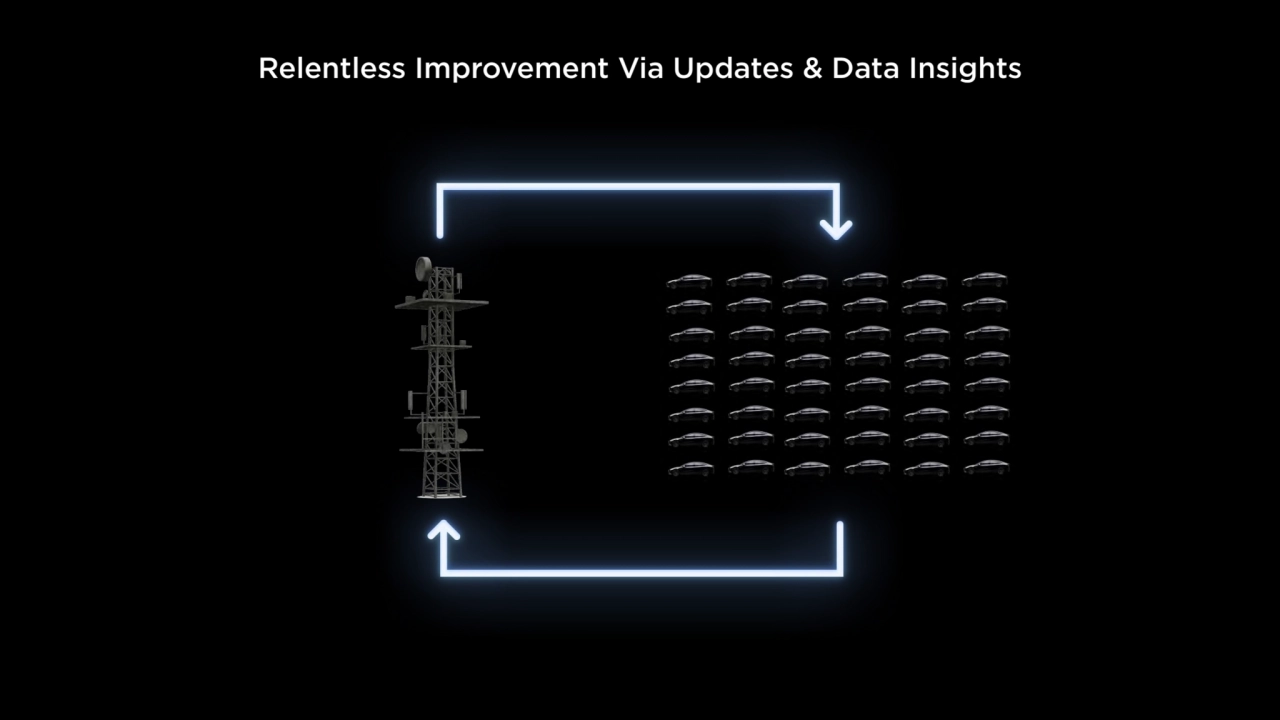
- 75. Relentless Improvement Via Updates & Data Insights
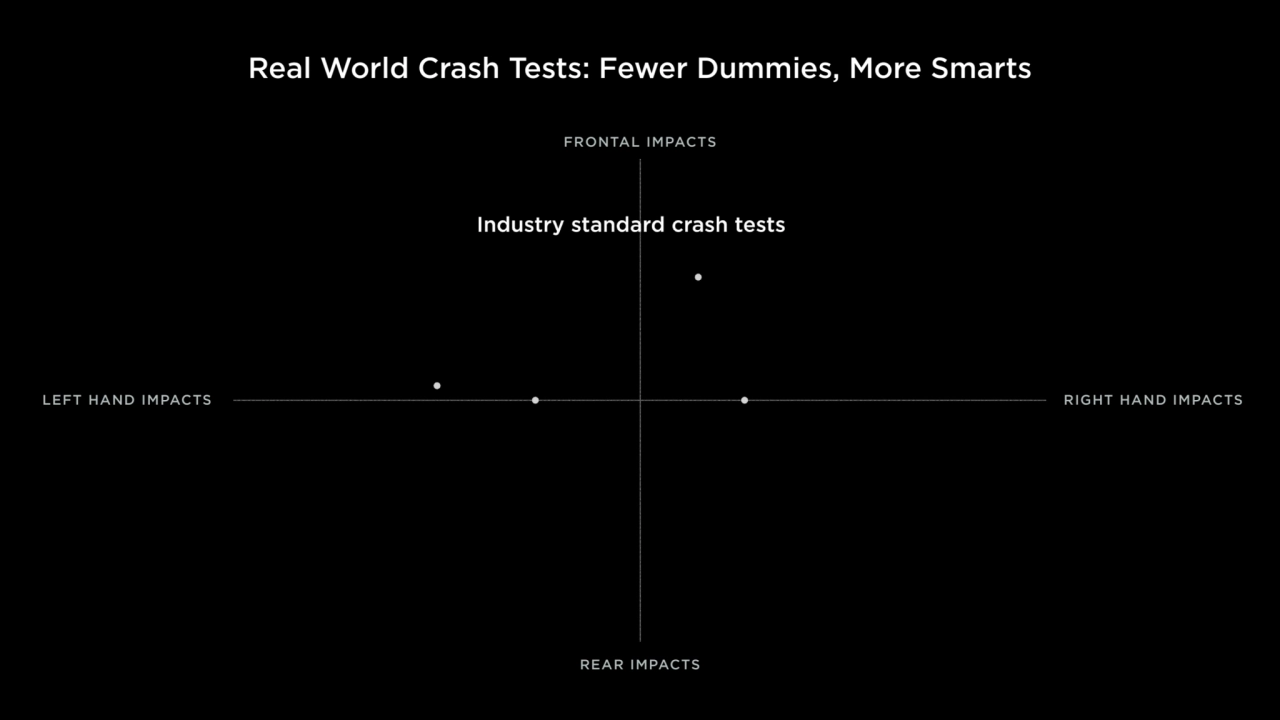
- 76. Real World Crash Tests: Fewer Dummies, More Smarts FRONTAL IMPACTS LEFT HAND IMPACTS RIGHT HAND IMPACTS REAR IMPACTS
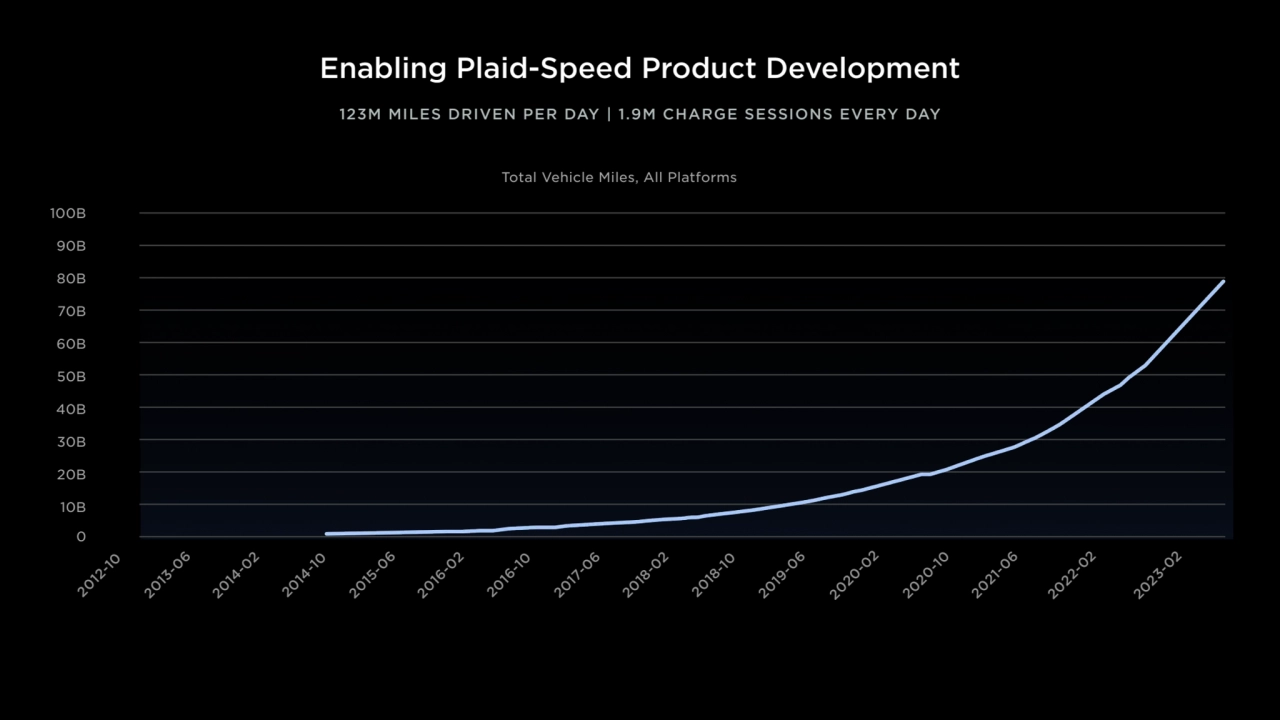
- 77. Enabling Plaid-Speed Product Development 0 2012-10 90B 100B 80B 70B 60B 50B 40B 30B 20B 10B 2013-06 2014-02 2014-10 2015-06 2016-02 2016-10 2017-06 2018-02 2018-10 2019-06 2020-02 2020-10 2021-06 2022-02 2023-02 Total Vehicle Miles, All Platforms 123M MILES DRIVEN PER DAY | 1.9M CHARGE SESSIONS EVERY DAY
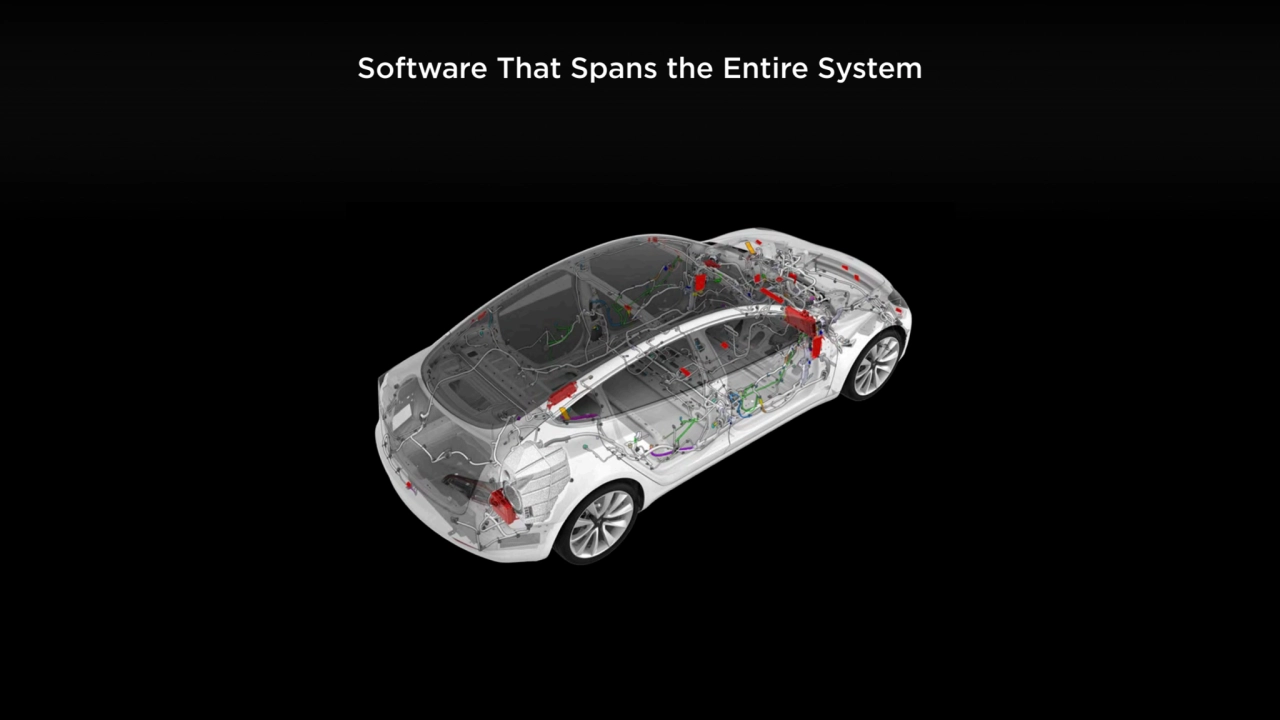
- 78. Software That Spans the Entire System
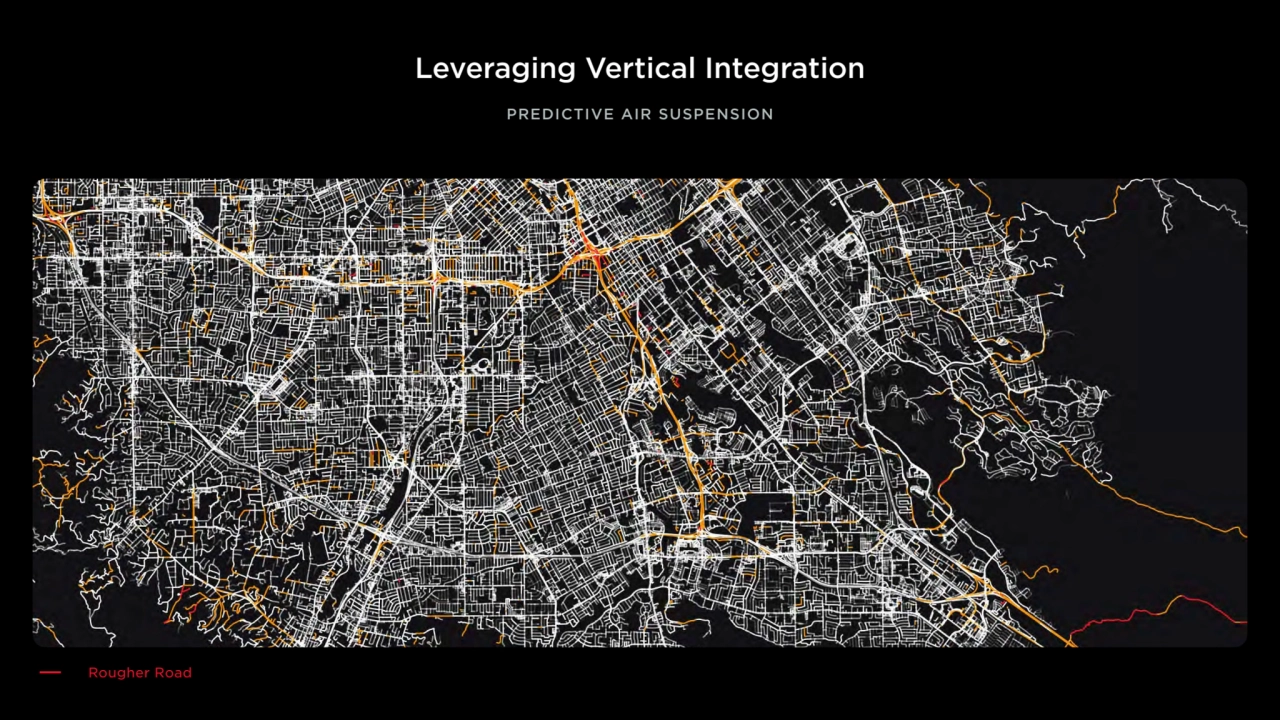
- 79. Leveraging Vertical Integration PREDICTIVE AIR SUSPENSION Rougher Road
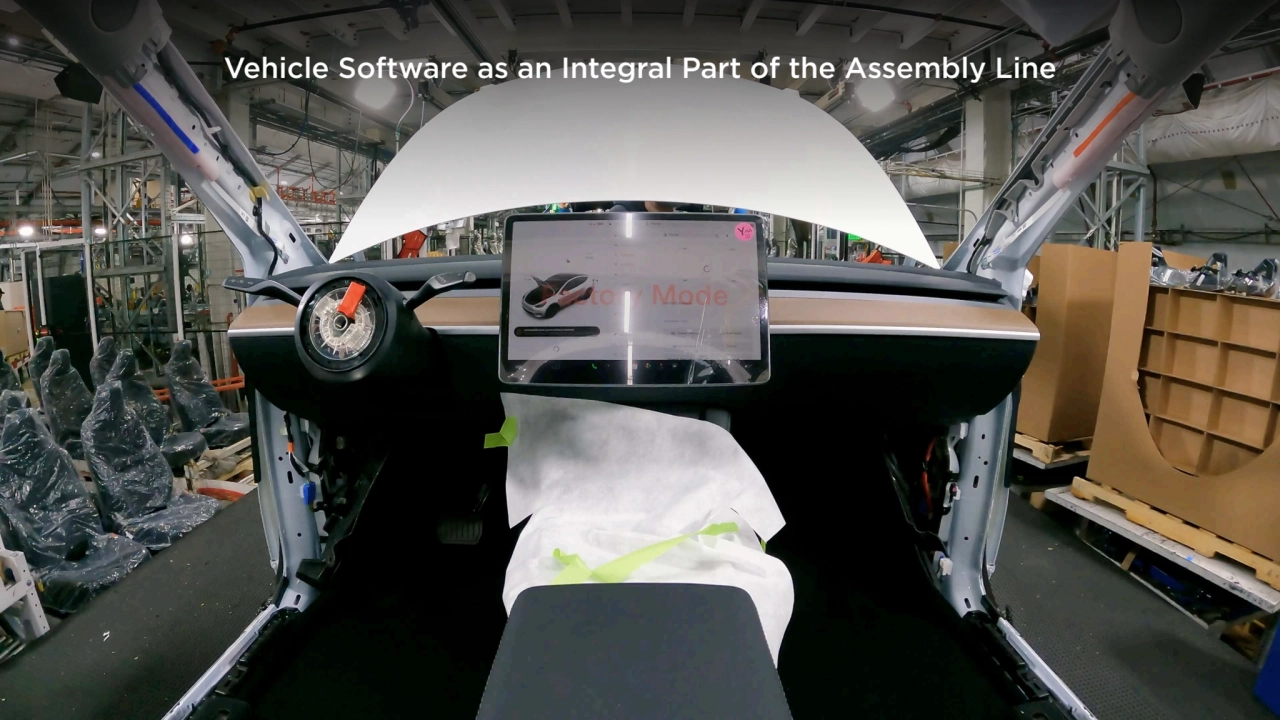
- 80. Vehicle Software as an Integral Part of the Assembly Line
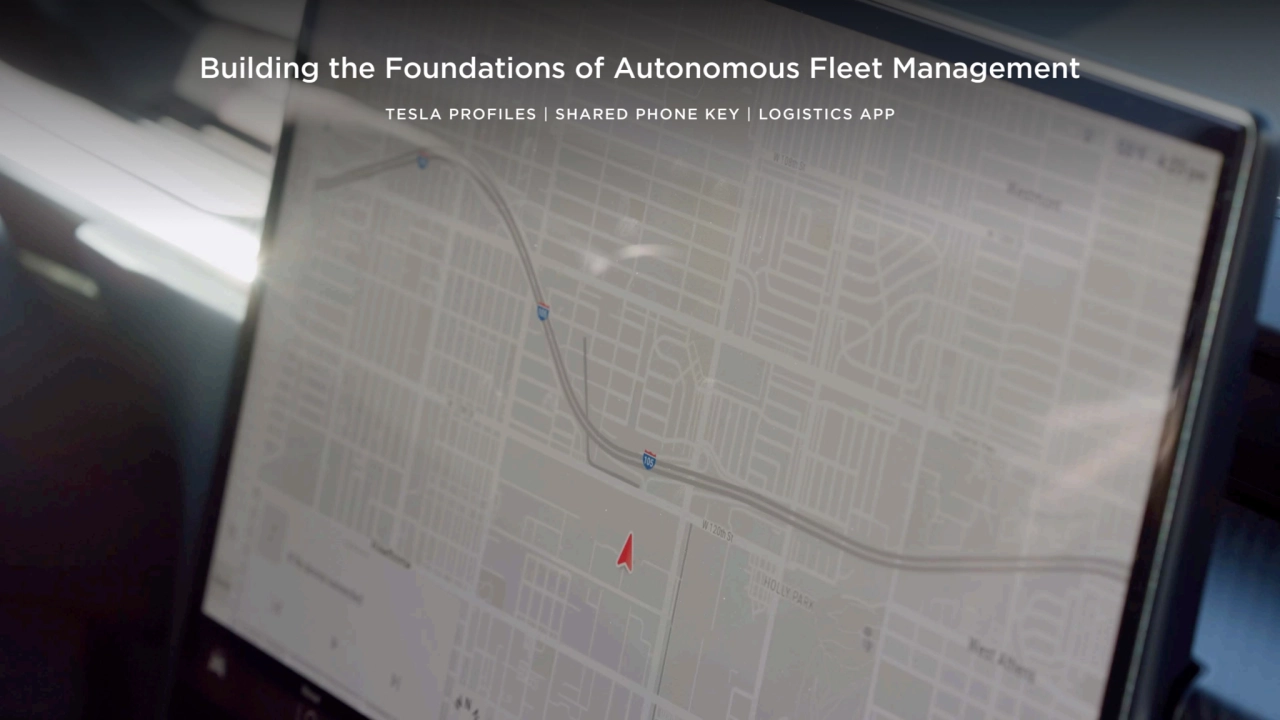
- 81. Building the Foundations of Autonomous Fleet Management TESLA PROFILES | SHARED PHONE KEY | LOGISTICS APP
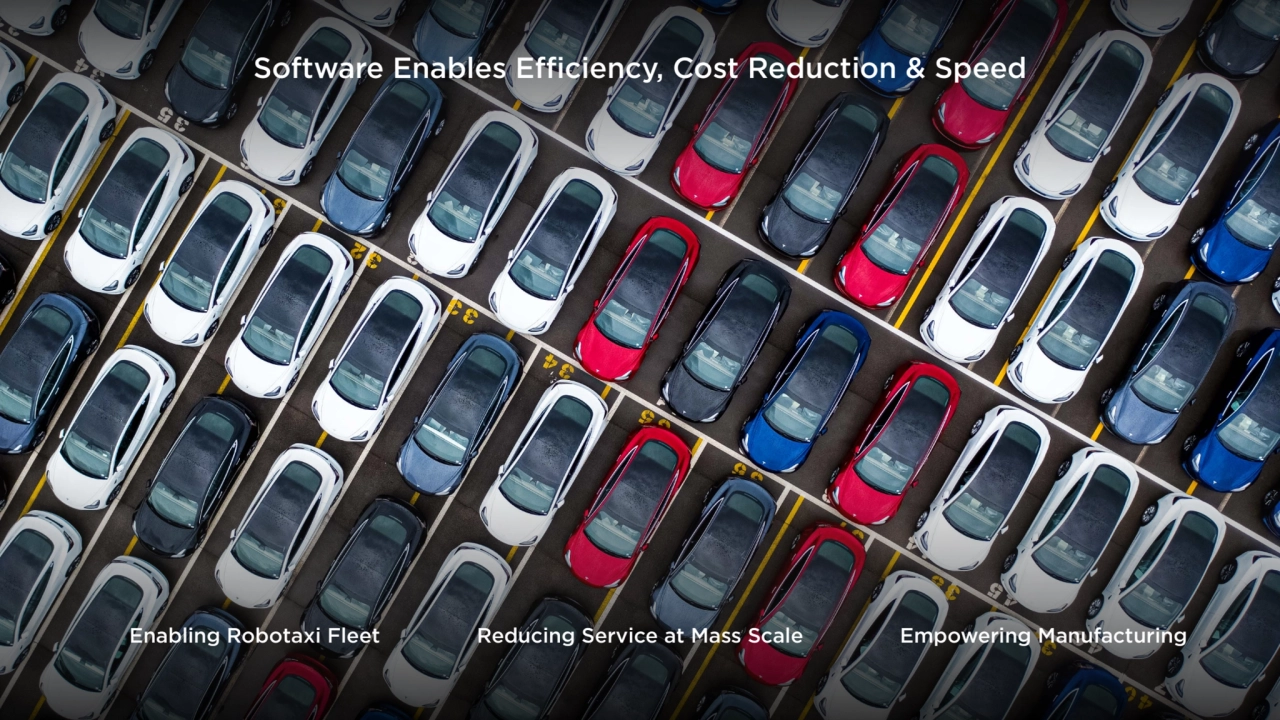
- 82. Software Enables Efficiency, Cost Reduction & Speed Enabling Robotaxi Fleet Reducing Service at Mass Scale Empowering Manufacturing
- 83. 05 Full Self-Driving Ashok Elluswamy
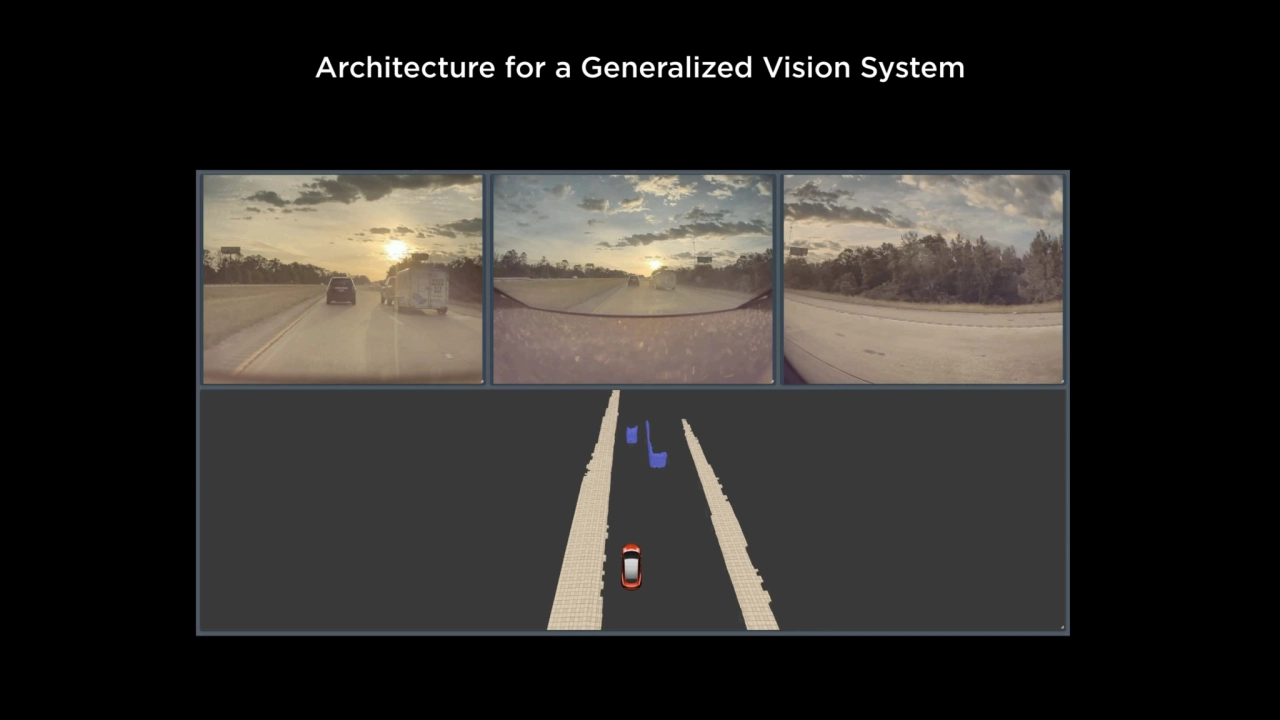
- 84. Architecture for a Generalized Vision System
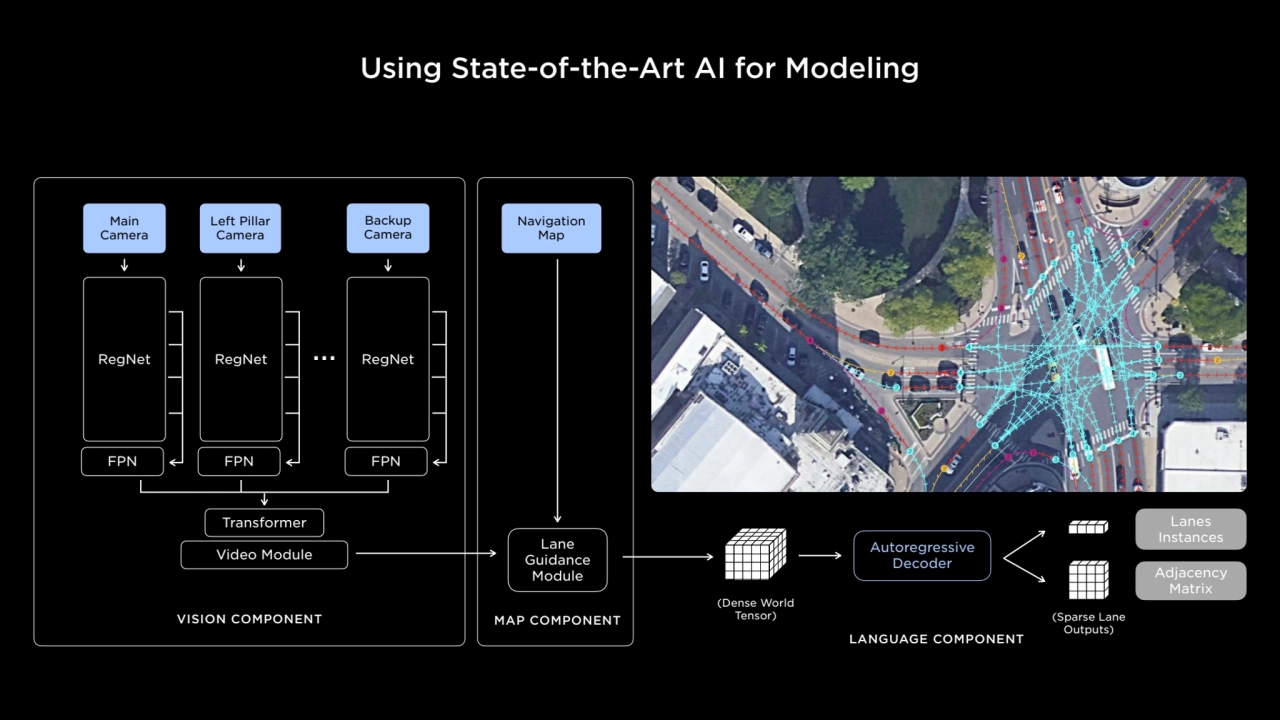
- 85. RegNet FPN Main Camera … Transformer Video Module RegNet FPN Left Pillar Camera RegNet FPN Backup Camera Navigation Map MAP COMPONENT Lanes Instances Autoregressive Decoder Adjacency Matrix (Dense World Tensor) (Sparse Lane Outputs) Lane Guidance Module LANGUAGE COMPONENT VISION COMPONENT Using State-of-the-Art AI for Modeling
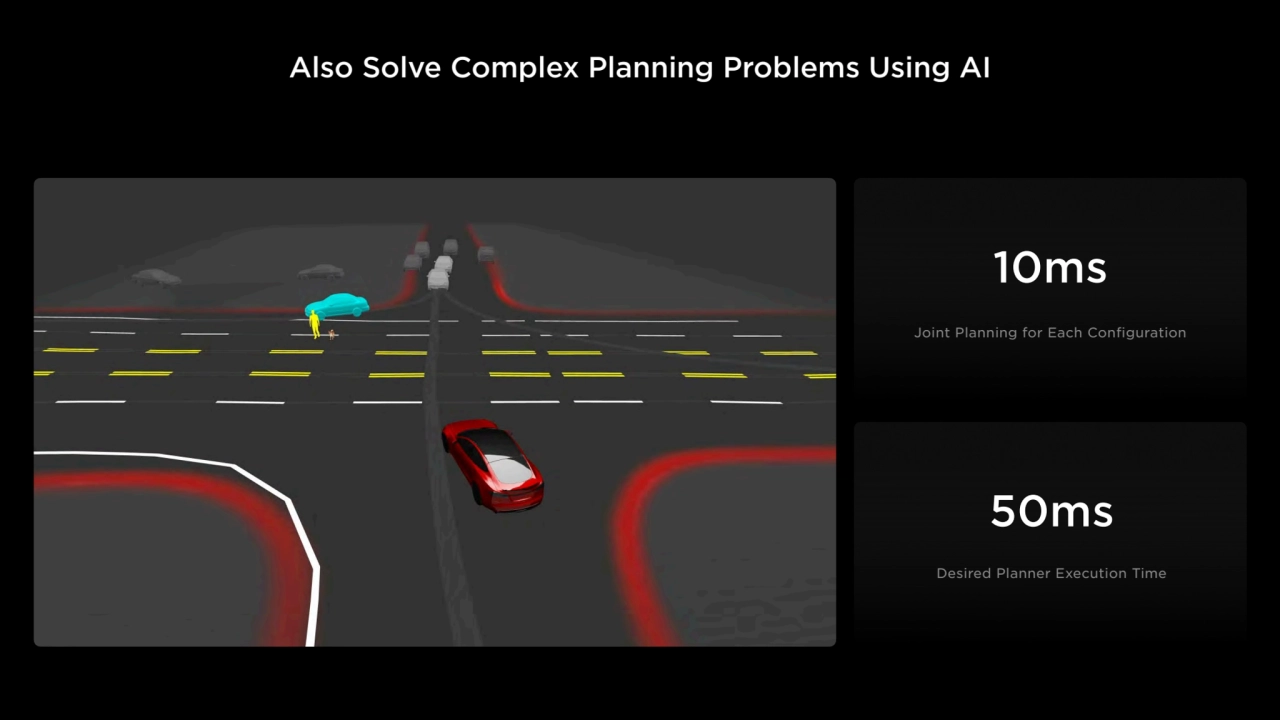
- 86. Also Solve Complex Planning Problems Using AI 10ms Joint Planning for Each Configuration 50ms Desired Planner Execution Time
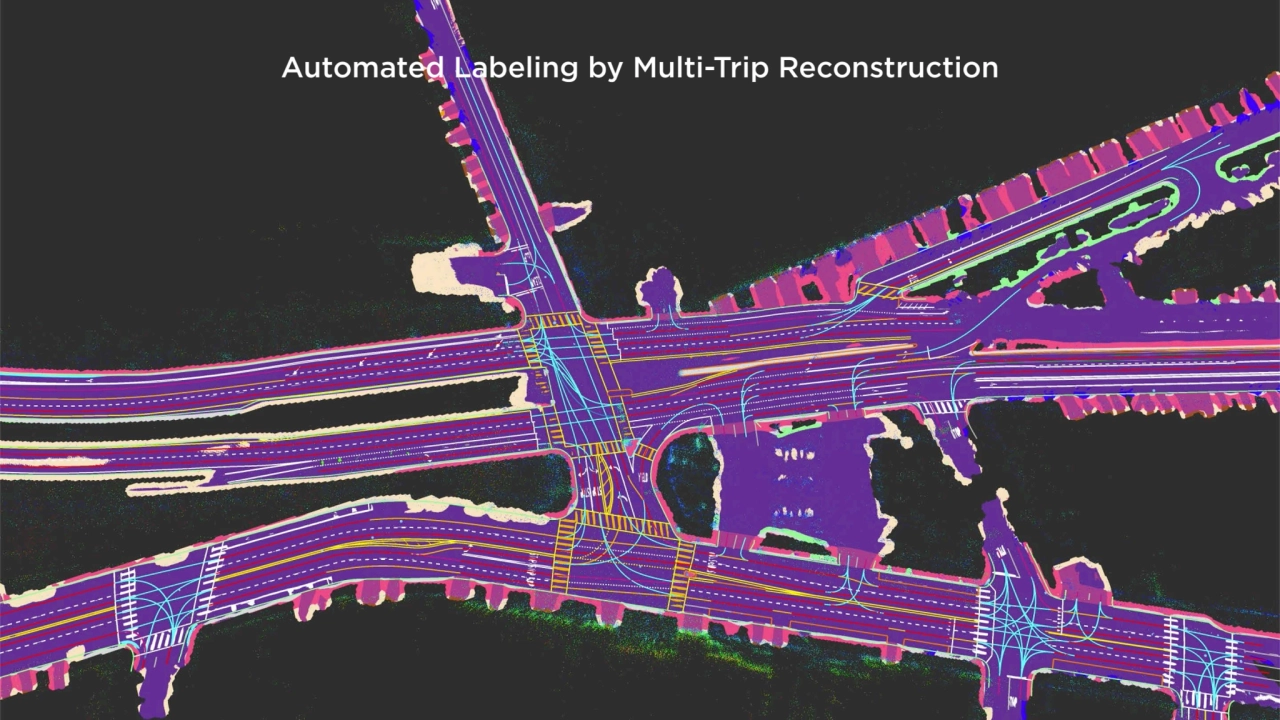
- 87. Automated Labeling by Multi-Trip Reconstruction
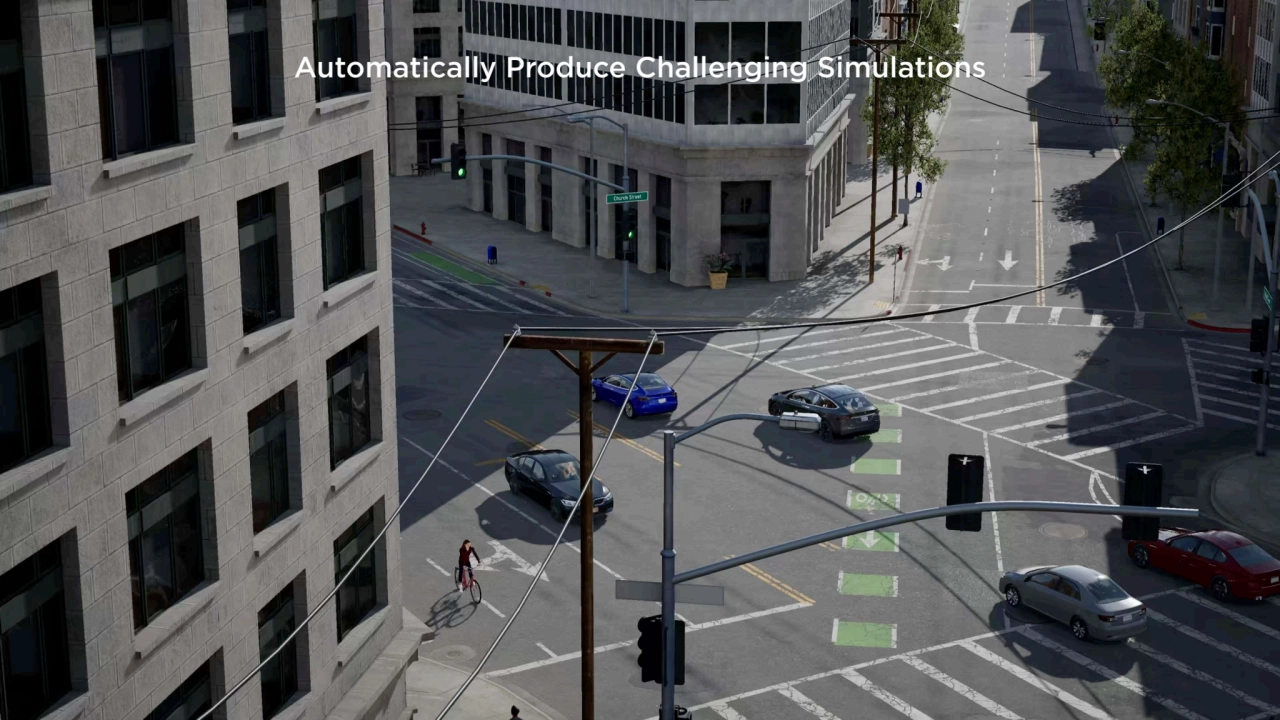
- 88. Automatically Produce Challenging Simulations
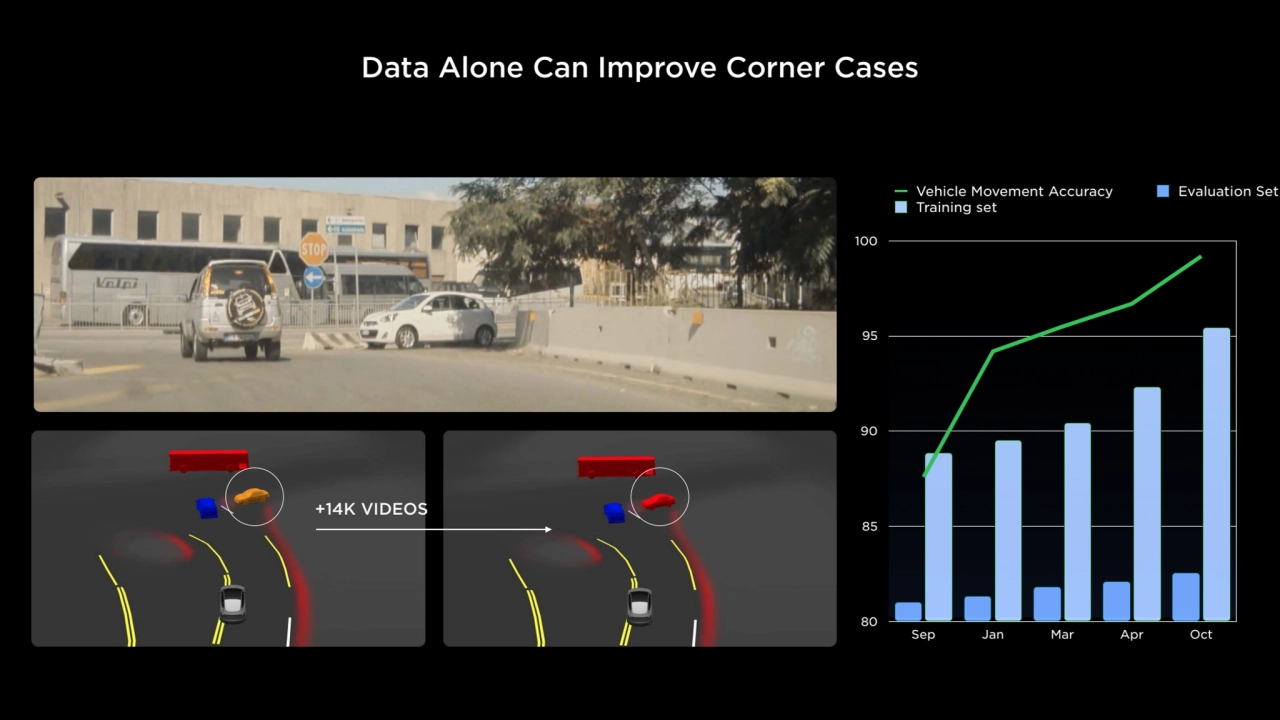
- 89. Data Alone Can Improve Corner Cases 80 85 90 95 100 Sep Jan Mar Apr Oct Vehicle Movement Accuracy Evaluation Set Training set +14K VIDEOS
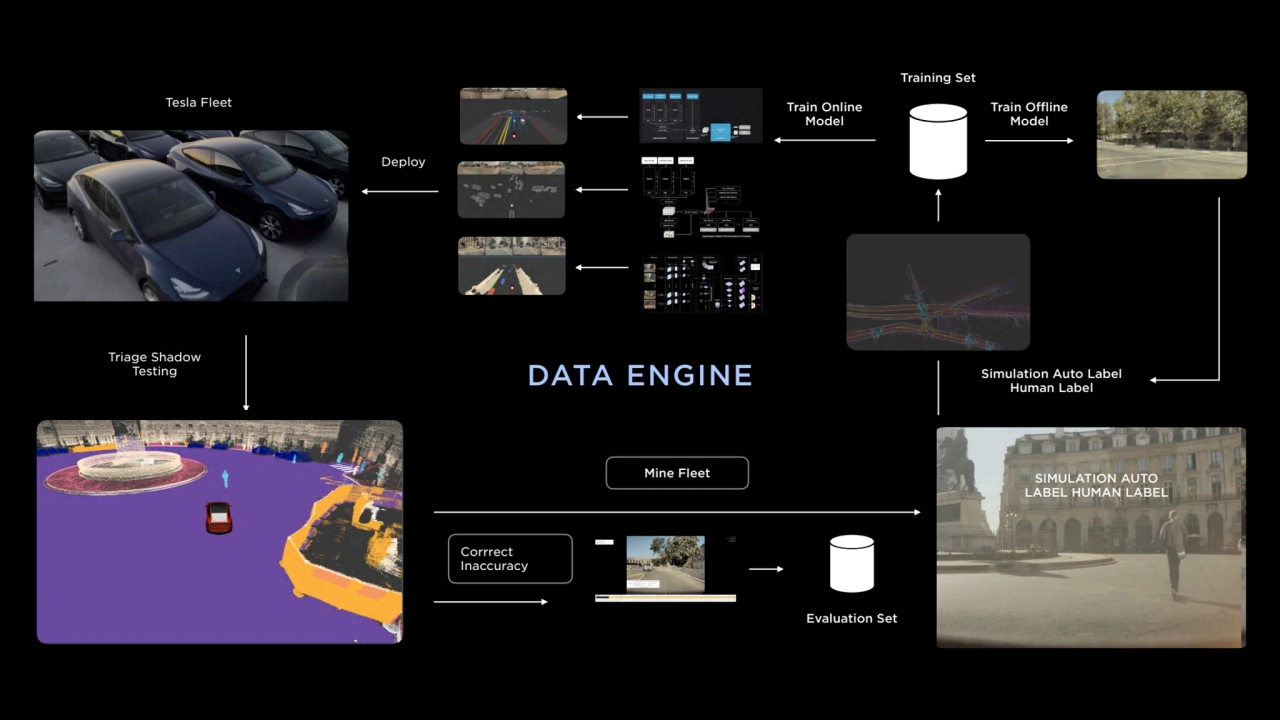
- 90. Triage Shadow Testing Mine Fleet Evaluation Set Simulation Auto Label Human Label Training Set Train Online Model Train Offline Model Corrrect Inaccuracy DATA ENGINE SIMULATION AUTO LABEL HUMAN LABEL Tesla Fleet Deploy
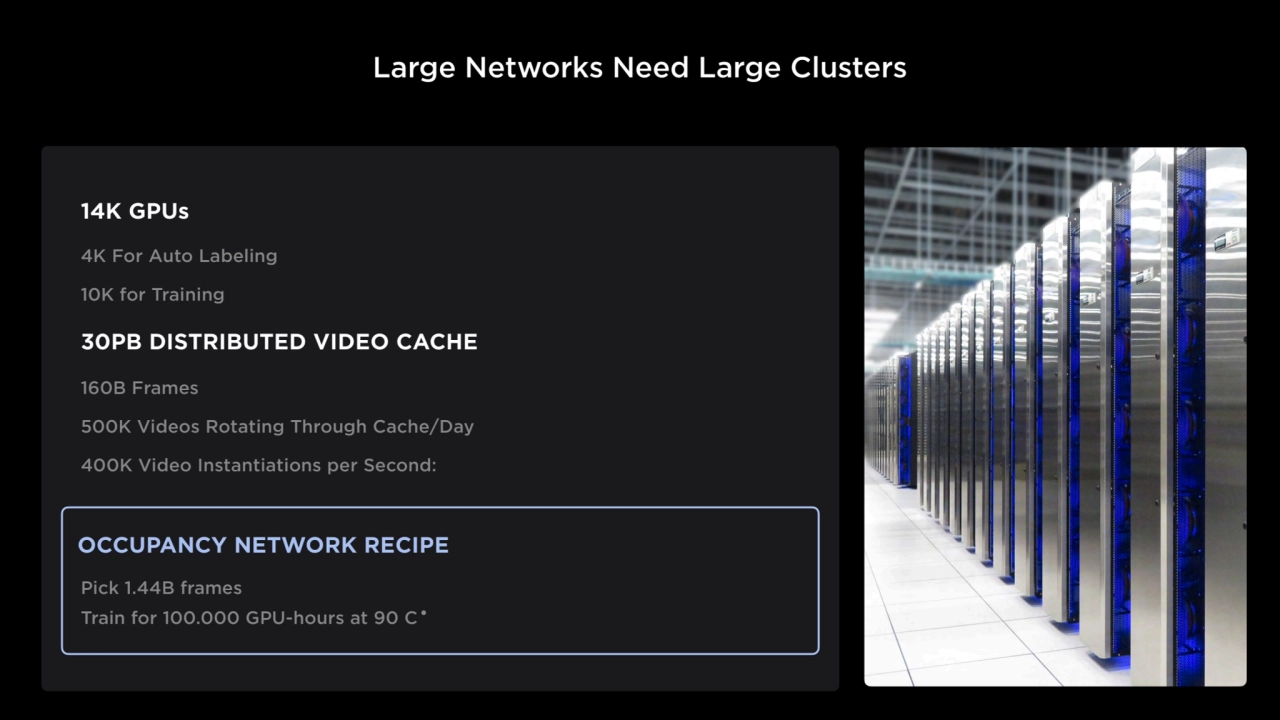
- 91. Trained With Large Dataset 14K GPUs 30PB DISTRIBUTED VIDEO CACHE 4K For Auto Labeling 10K for Training 160B Frames 500K Videos Rotating Through Cache/Day 400K Video Instantiations per Second: OCCUPANCY NETWORK RECIPE Pick 1.44B frames Train for 100.000 GPU-hours at 90 C Large Networks Need Large Clusters
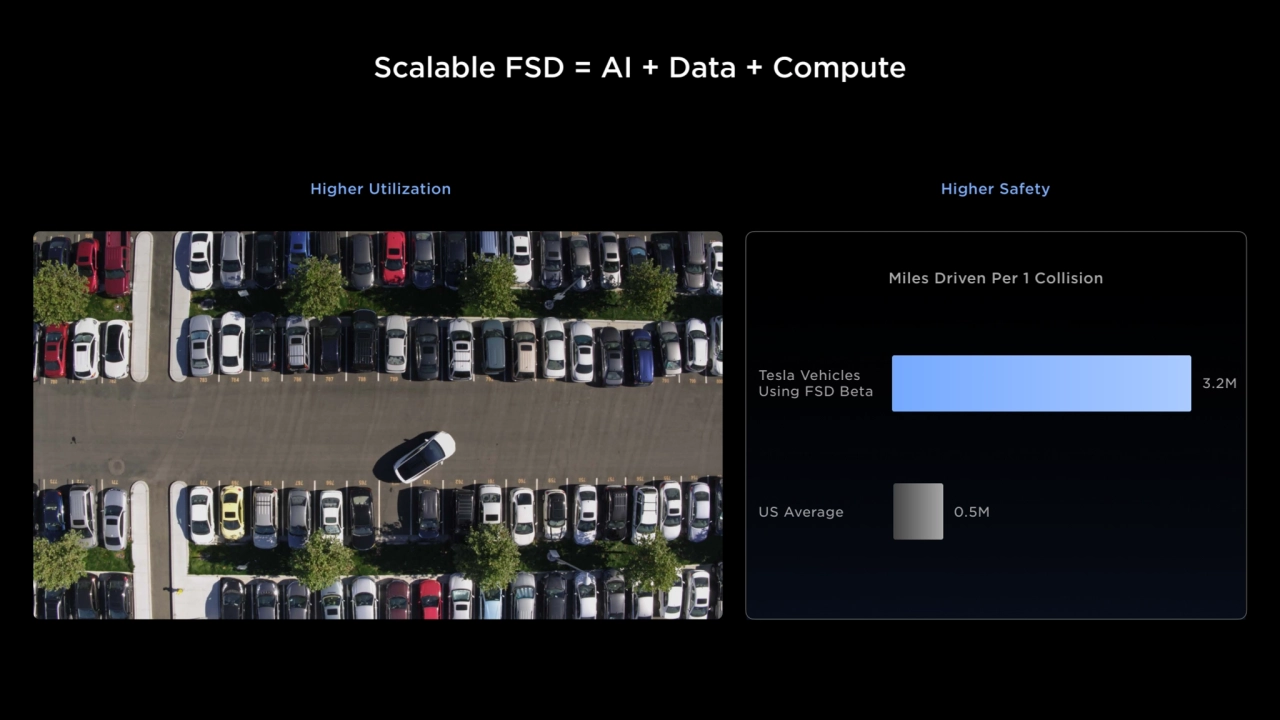
- 92. Scalable FSD = AI + Data + Compute Tesla Vehicles Using FSD Beta US Average 3.2M 0.5M Higher Utilization Higher Safety Miles Driven Per 1 Collision
- 94. 06 Charging Rebecca Tinucci
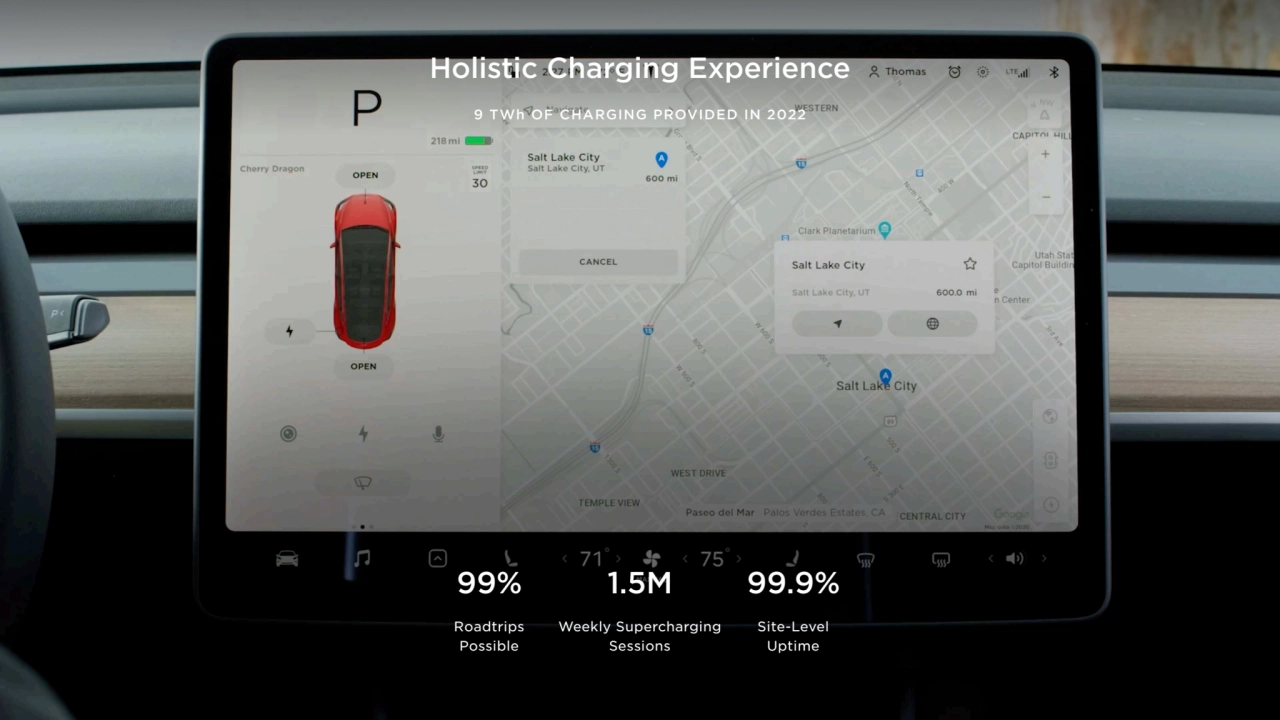
- 95. Holistic Charging Experience 1.5M Weekly Supercharging Sessions 99% Roadtrips Possible 99.9% Site-Level Uptime 9 TWh OF CHARGING PROVIDED IN 2022
- 96. How We Got Here
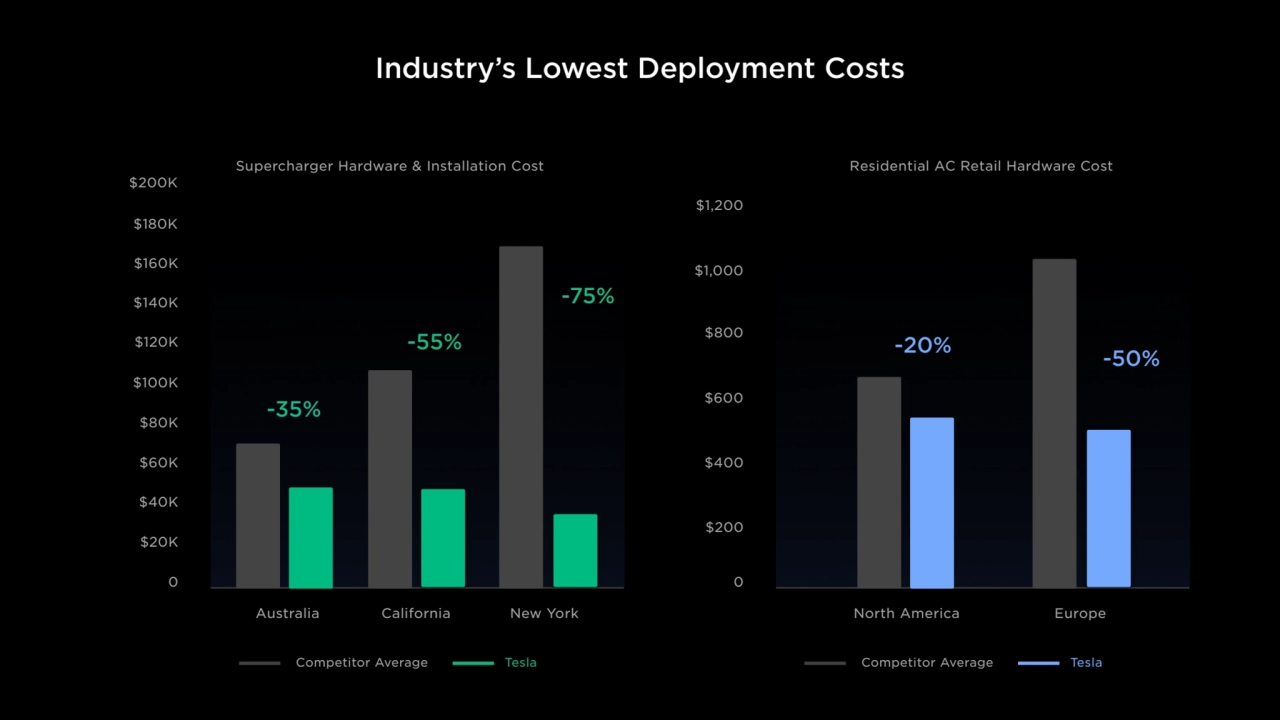
- 97. Industry’s Lowest Deployment Costs 0 Supercharger Hardware & Installation Cost $20K $40K $60K Australia California -35% $80K $100K $120K $140K $160K $180K $200K New York -55% -75% Competitor Average Tesla 0 $200 North America Europe -20% -50% Competitor Average Tesla Residential AC Retail Hardware Cost $400 $600 $800 $1,000 $1,200
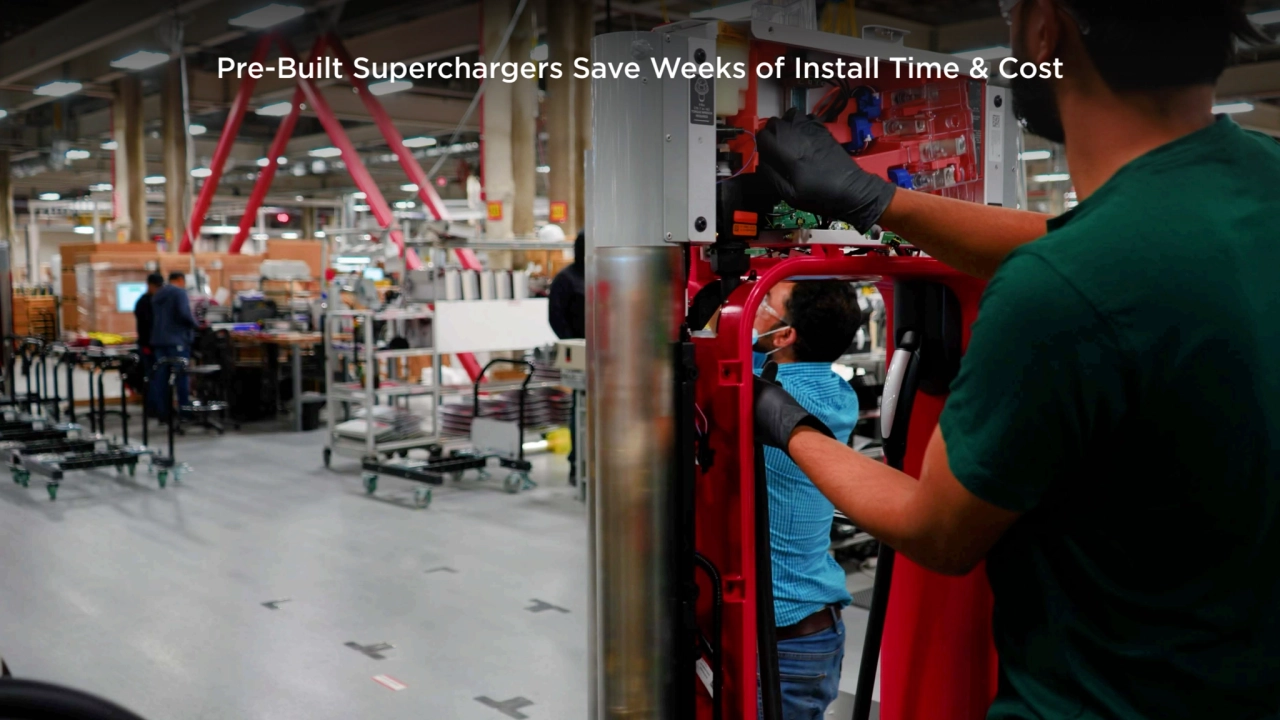
- 98. Pre-Built Superchargers Save Weeks of Install Time & Cost
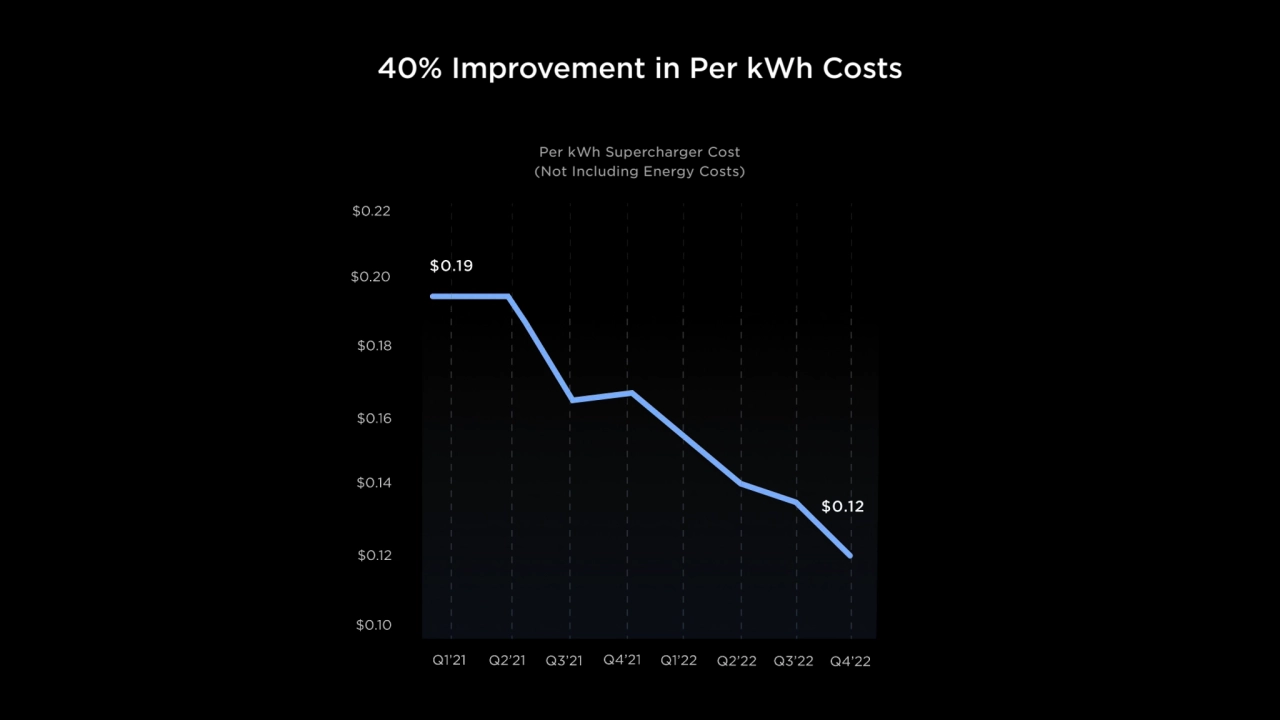
- 99. 40% Improvement in Per kWh Costs Per kWh Supercharger Cost (Not Including Energy Costs)
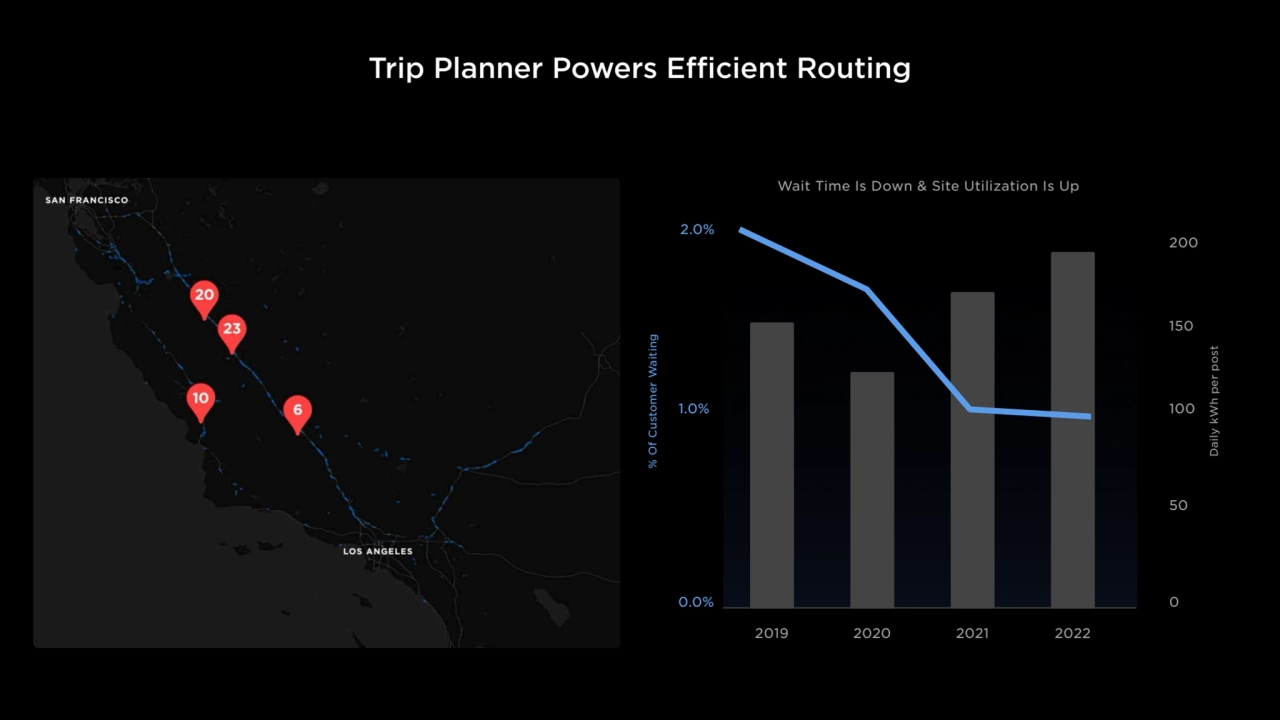
- 100. Trip Planner Powers Efficient Routing 0.0% 2019 Wait Time Is Down & Site Utilization Is Up 1.0% 2.0% 2020 2021 2022 0 100 200 150 50 % Of Customer Waiting Daily kWh per post
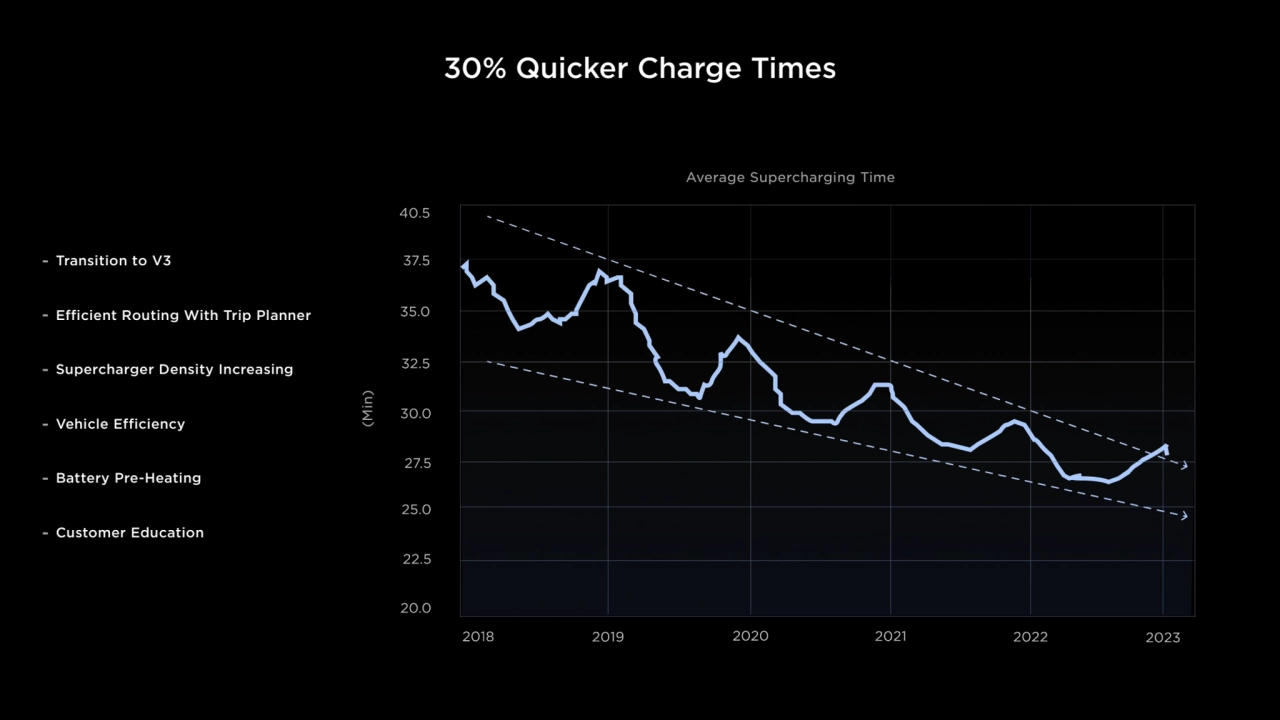
- 101. 30% Quicker Charge Times Average Supercharging Time - Transition to V3 - Efficient Routing With Trip Planner - Supercharger Density Increasing - Vehicle Efficiency - Battery Pre-Heating - Customer Education (Min)
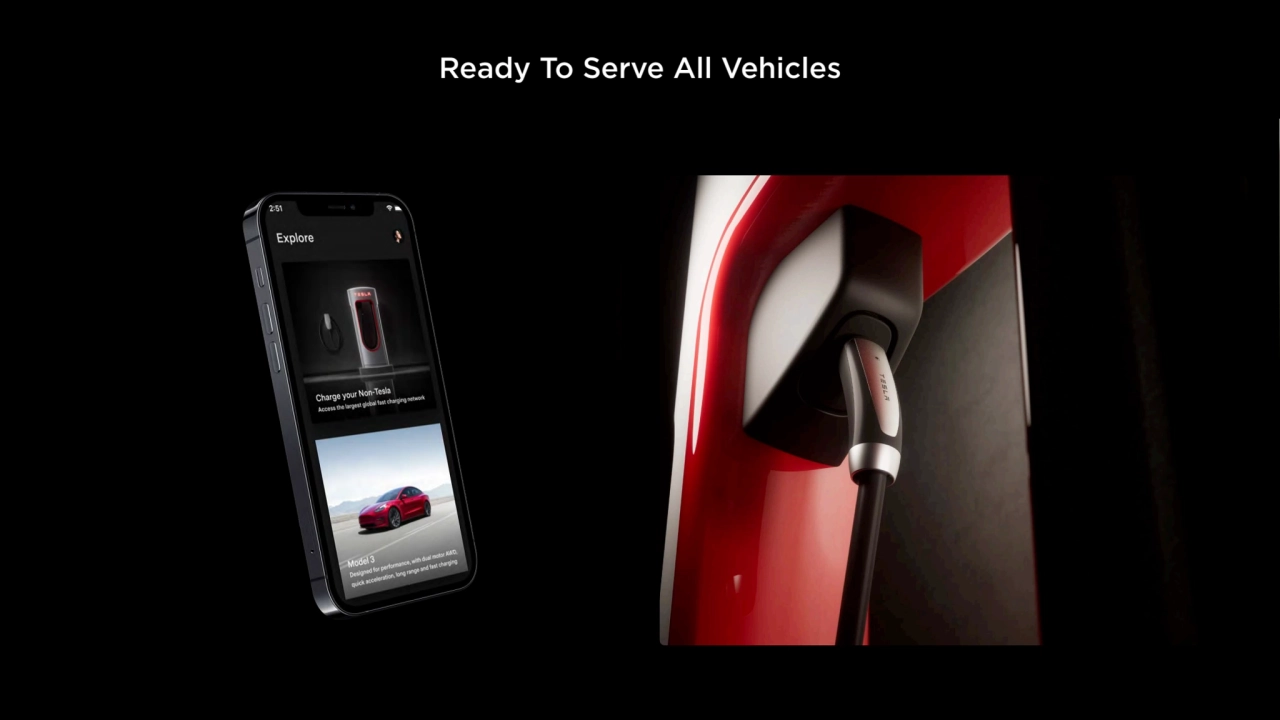
- 103. Ready To Serve All Vehicles
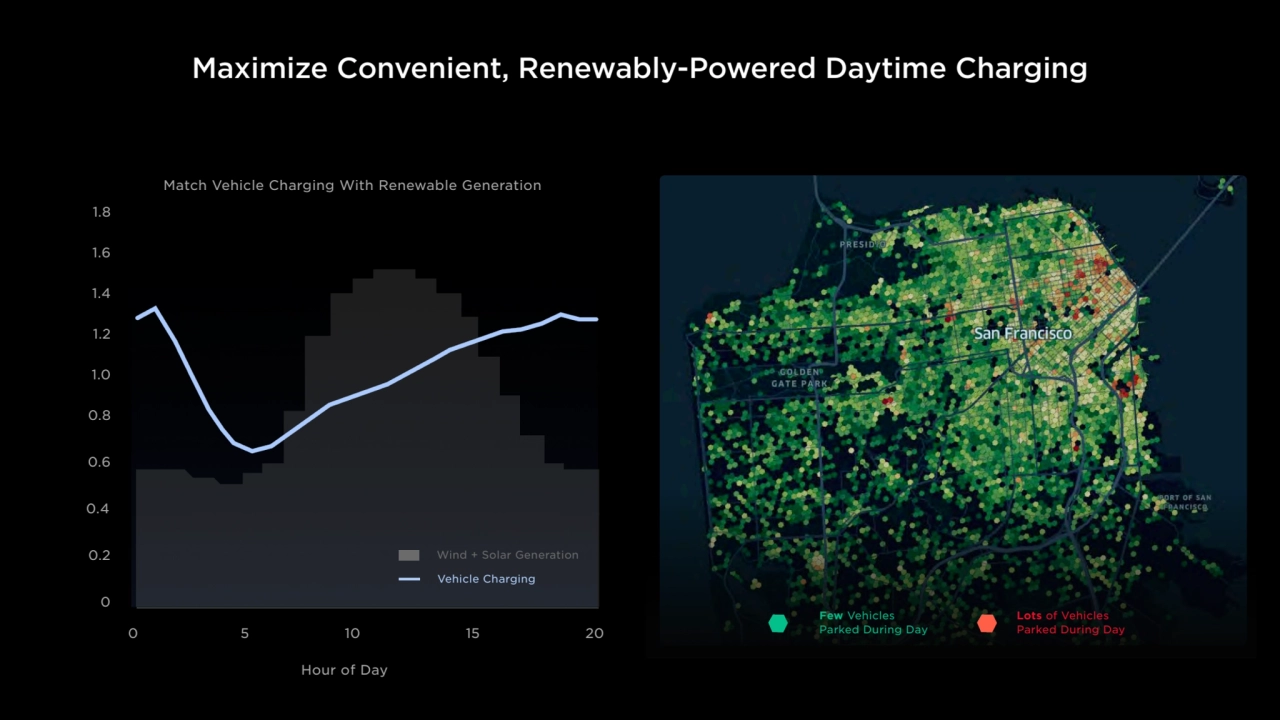
- 104. Maximize Convenient, Renewably-Powered Daytime Charging Lots of Vehicles Parked During Day 0 0 Match Vehicle Charging With Renewable Generation 5 10 15 20 0.2 0.4 0.6 0.8 1.0 1.2 1.4 1.6 1.8 Hour of Day Vehicle Charging Few Vehicles Parked During Day Wind + Solar Generation
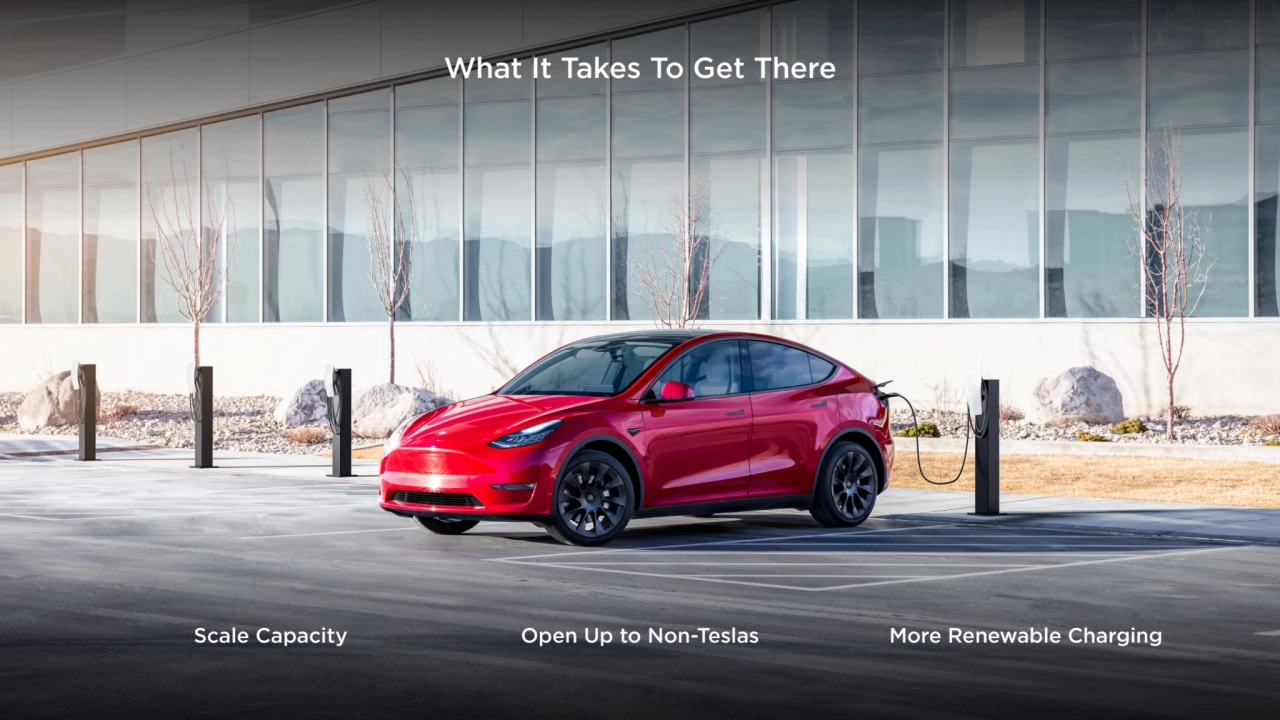
- 105. What It Takes To Get There Scale Capacity Open Up to Non-Teslas More Renewable Charging
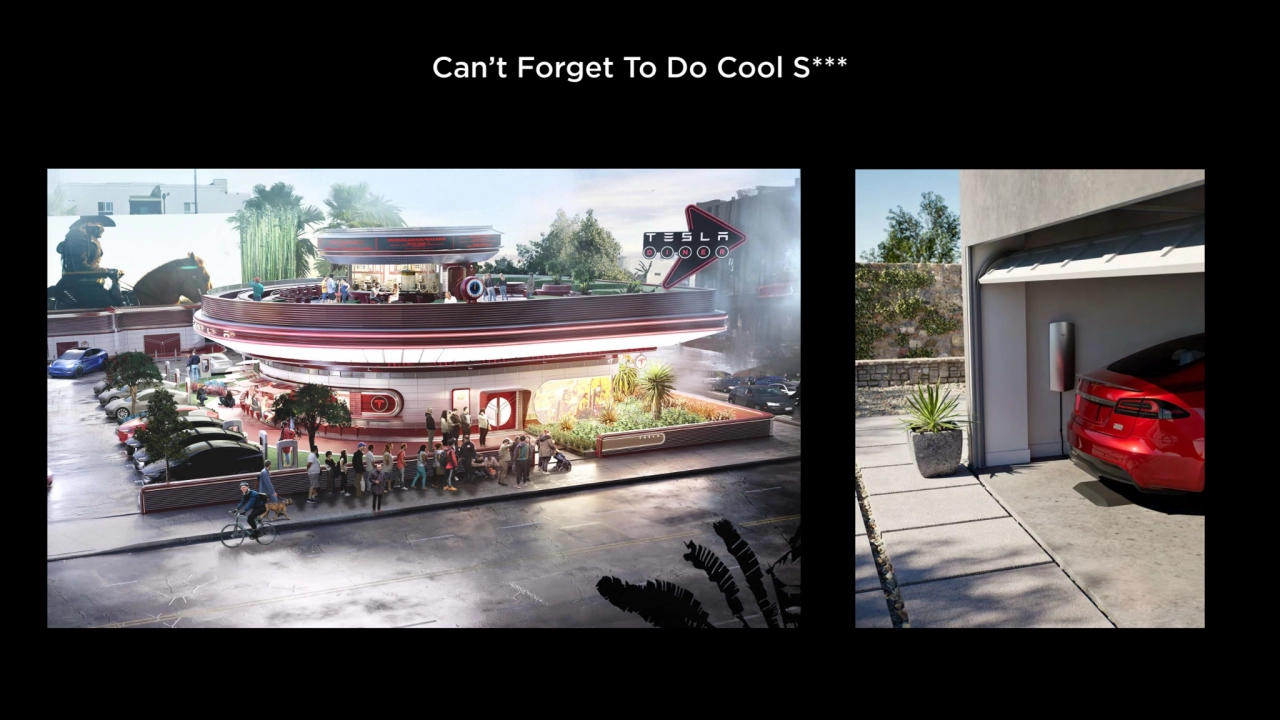
- 106. Can’t Forget To Do Cool S***
- 107. 07 Supply Chain Karn Budhiraj, Roshan Thomas
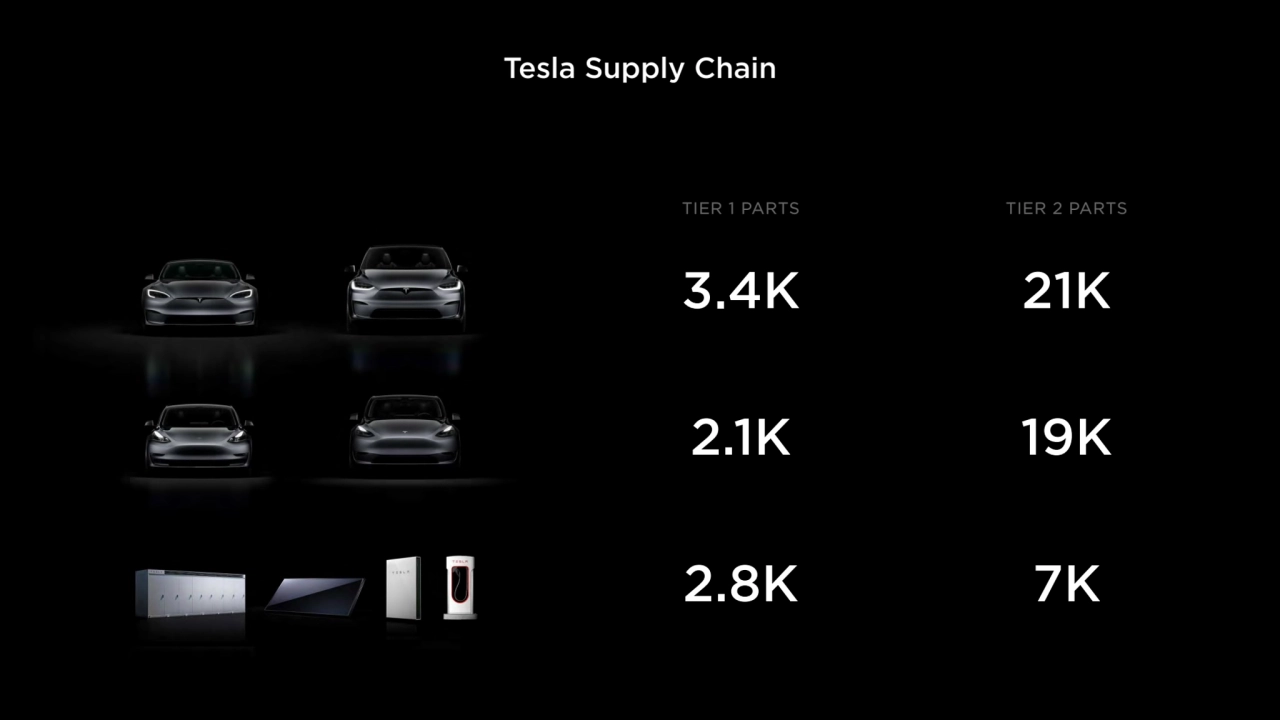
- 108. Tesla Supply Chain TIER 1 PARTS TIER 2 PARTS 3.4K 2.1K 2.8K 7K 19K 21K
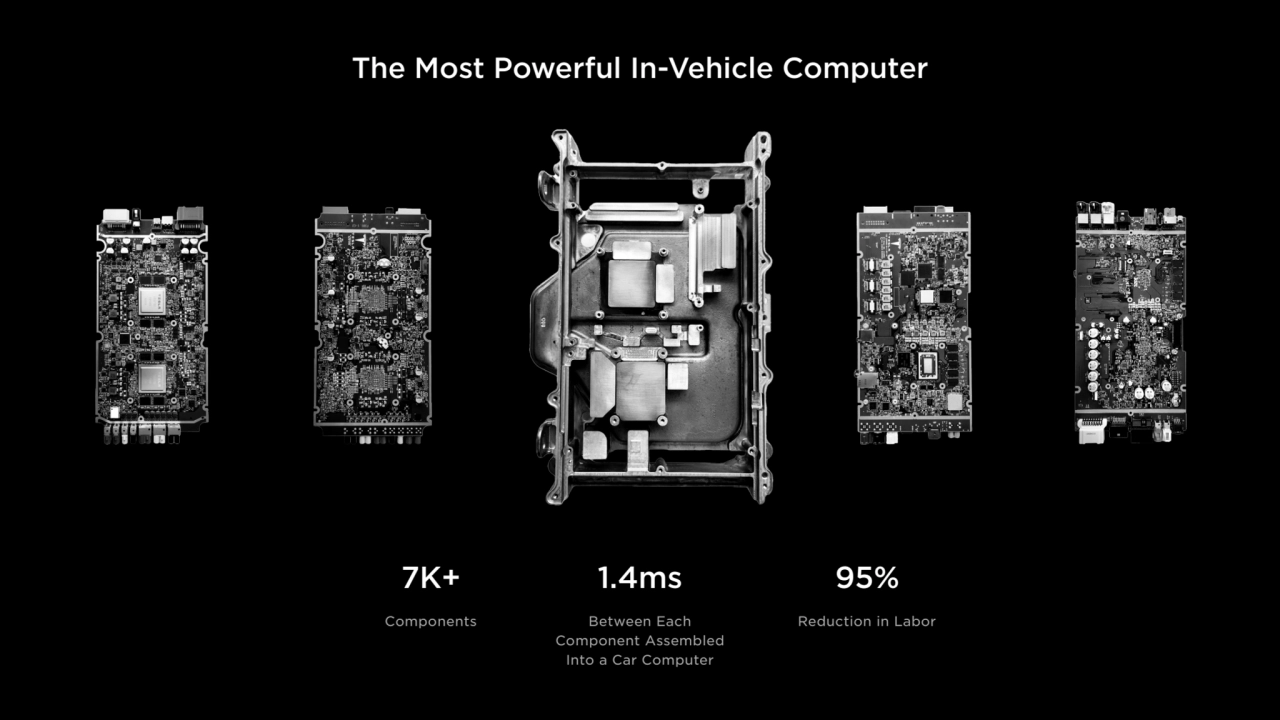
- 109. The Most Powerful In-Vehicle Computer 7K+ Components 1.4ms Between Each Component Assembled Into a Car Computer 95% Reduction in Labor
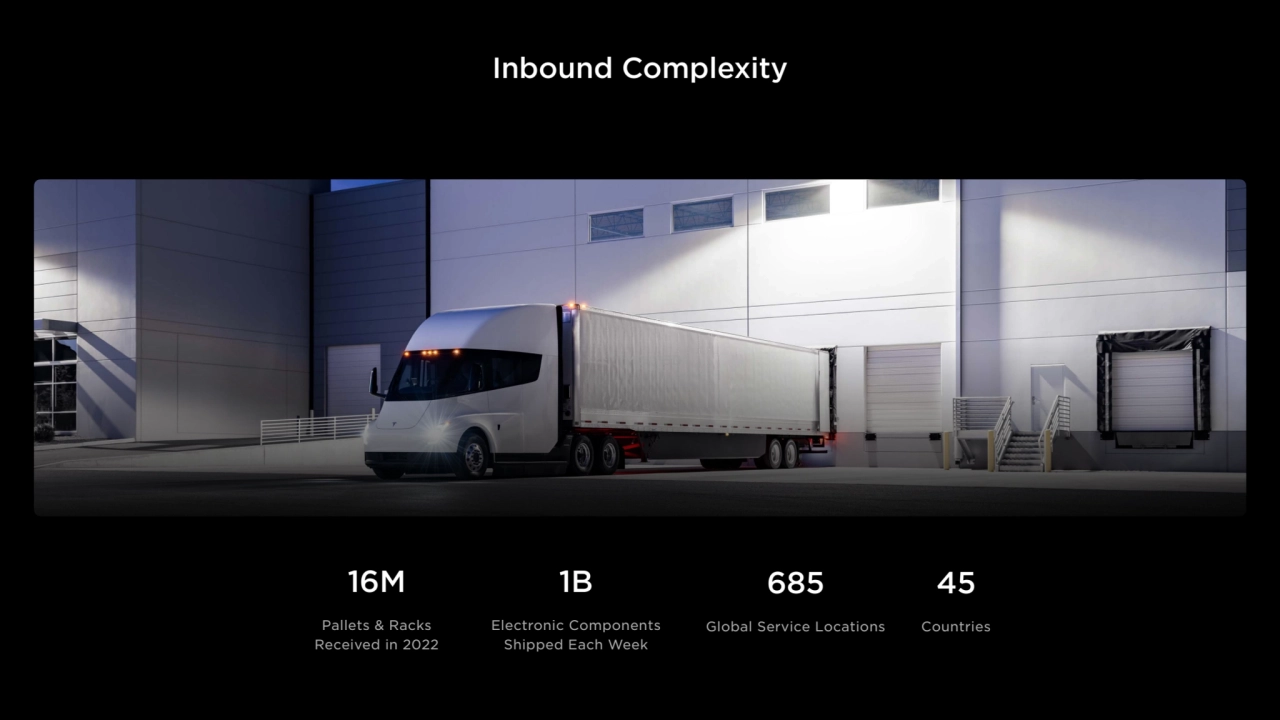
- 110. Inbound Complexity IMG TBD 16M Pallets & Racks Received in 2022 1B Electronic Components Shipped Each Week 45 Countries 685 Global Service Locations
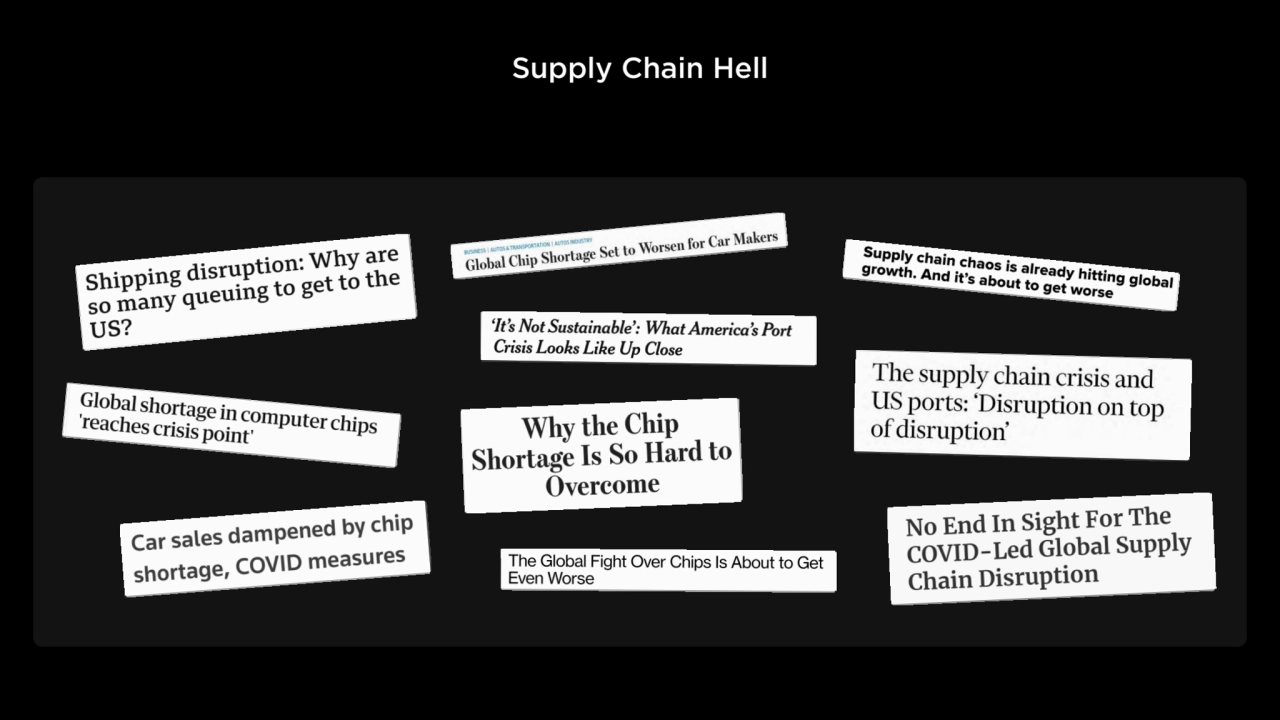
- 111. Supply Chain Hell
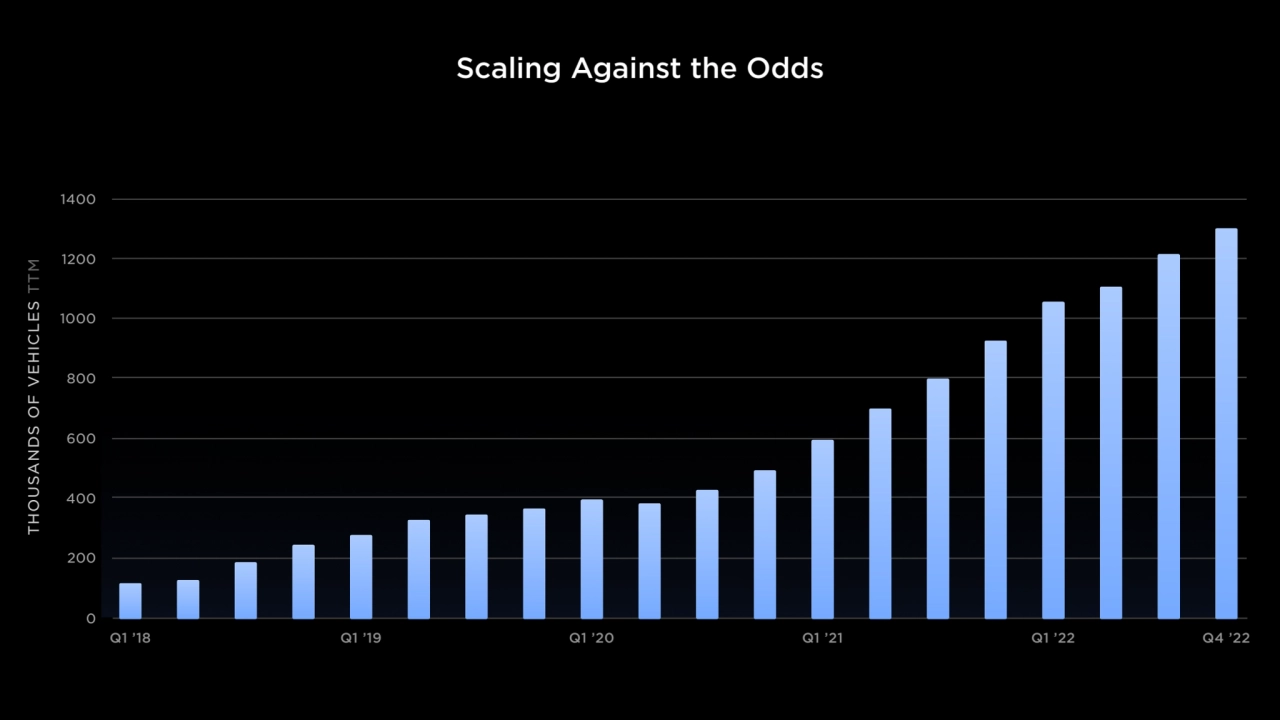
- 112. Scaling Against the Odds 0 200 Q1 ’18 400 600 800 1000 1200 1400 Q1 ’19 Q1 ’20 Q1 ’21 Q1 ’22 Q4 ’22 THOUSANDS OF VEHICLES TTM
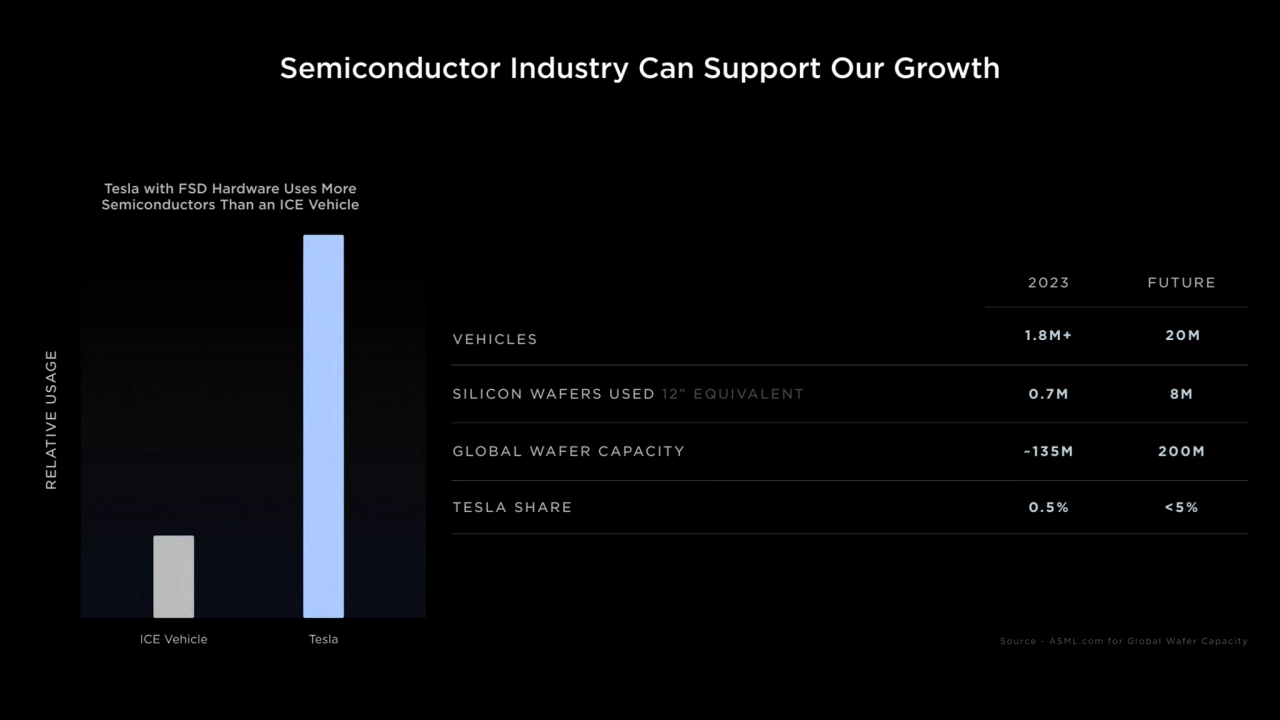
- 113. Semiconductor Industry Can Support Our Growth VEHICLES SILICON WAFERS USED 12” EQUIVALENT GLOBAL WAFER CAPACITY TESLA SHARE 2023 FUTURE 1.8M+ 0.7M ~135M 0.5% <5% 20M 8M 200M Tesla with FSD Hardware Uses More Semiconductors Than an ICE Vehicle RELATIVE USAGE
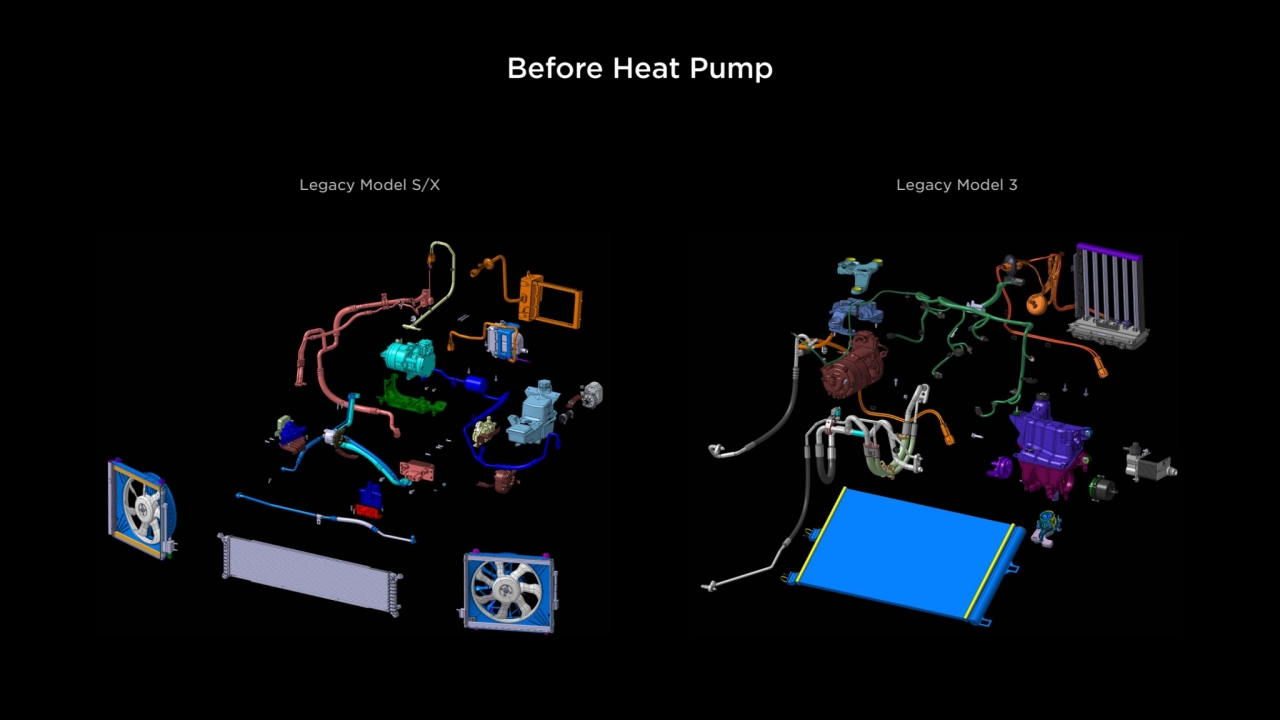
- 114. Before Heat Pump Legacy Model S/X Legacy Model 3
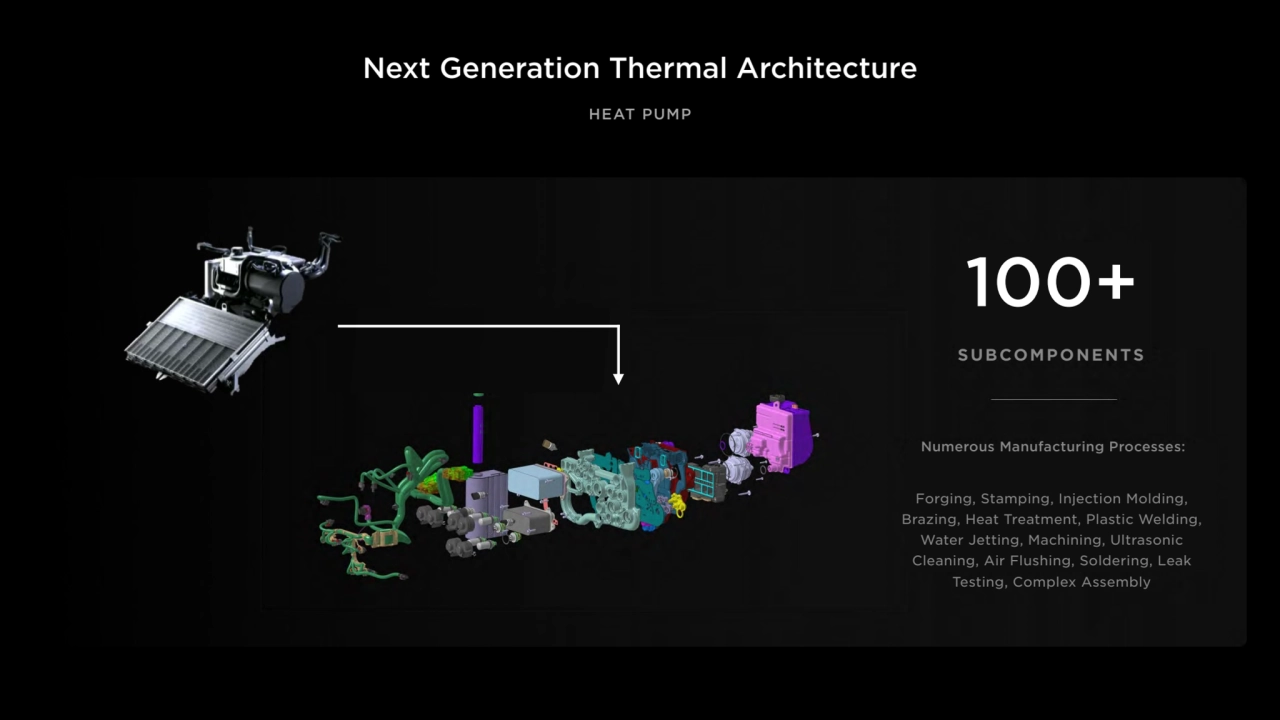
- 115. Next Generation Thermal Architecture SUBCOMPONENTS 100+ Numerous Manufacturing Processes: Forging, Stamping, Injection Molding, Brazing, Heat Treatment, Plastic Welding, Water Jetting, Machining, Ultrasonic Cleaning, Air Flushing, Soldering, Leak Testing, Complex Assembly HEAT PUMP
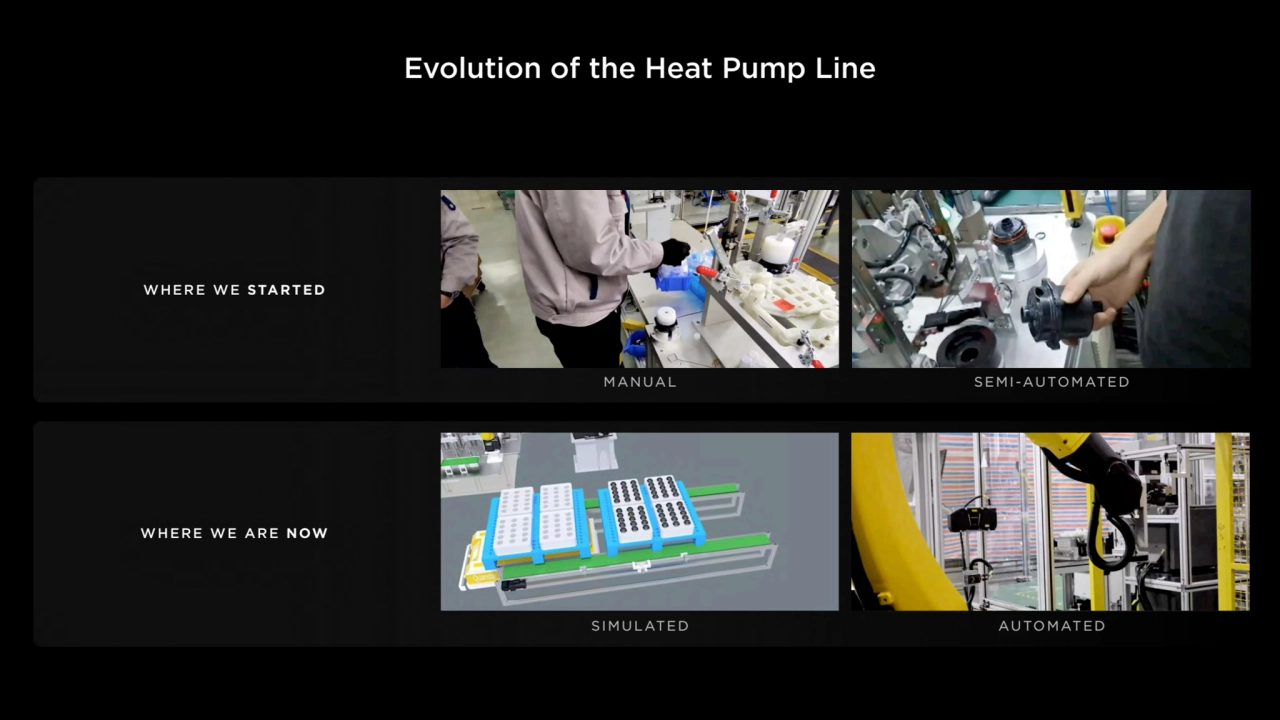
- 116. Evolution of the Heat Pump Line MANUAL SIMULATED SEMI-AUTOMATED AUTOMATED WHERE WE STARTED WHERE WE ARE NOW
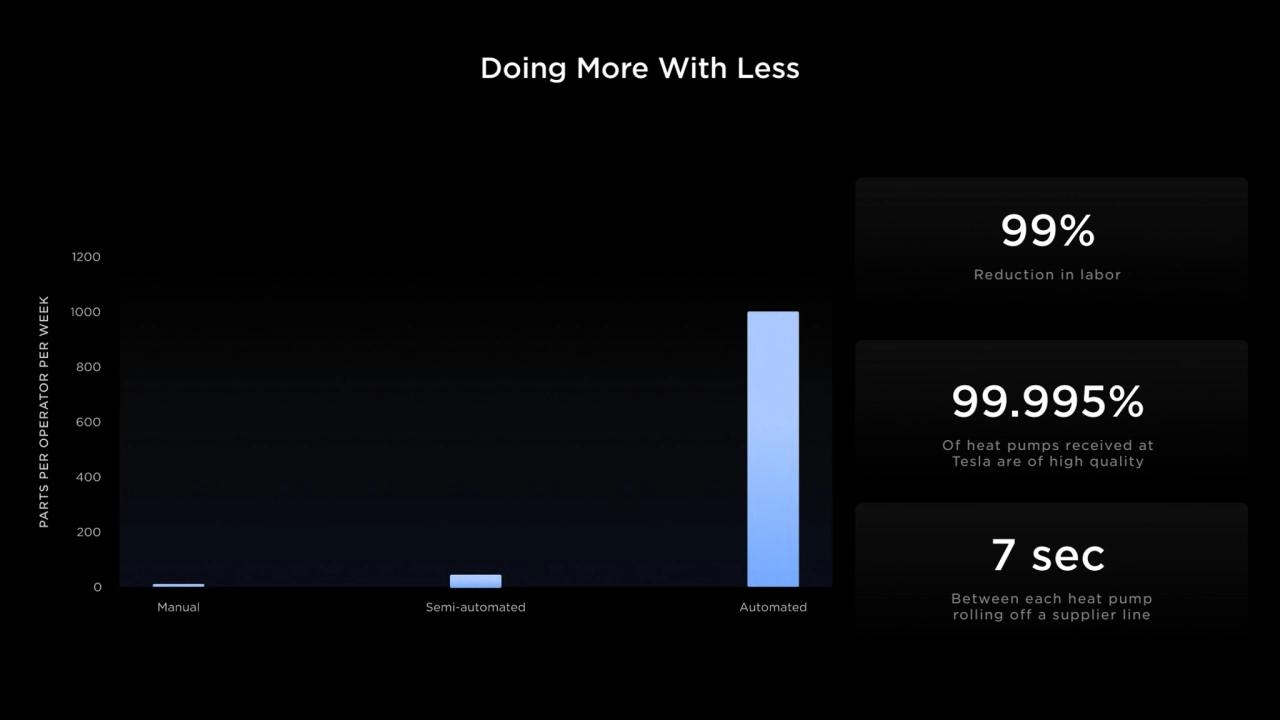
- 117. Doing More With Less 99% 99.995% 7 sec Reduction in labor Of heat pumps received at Tesla are of high quality Between each heat pump rolling off a supplier line
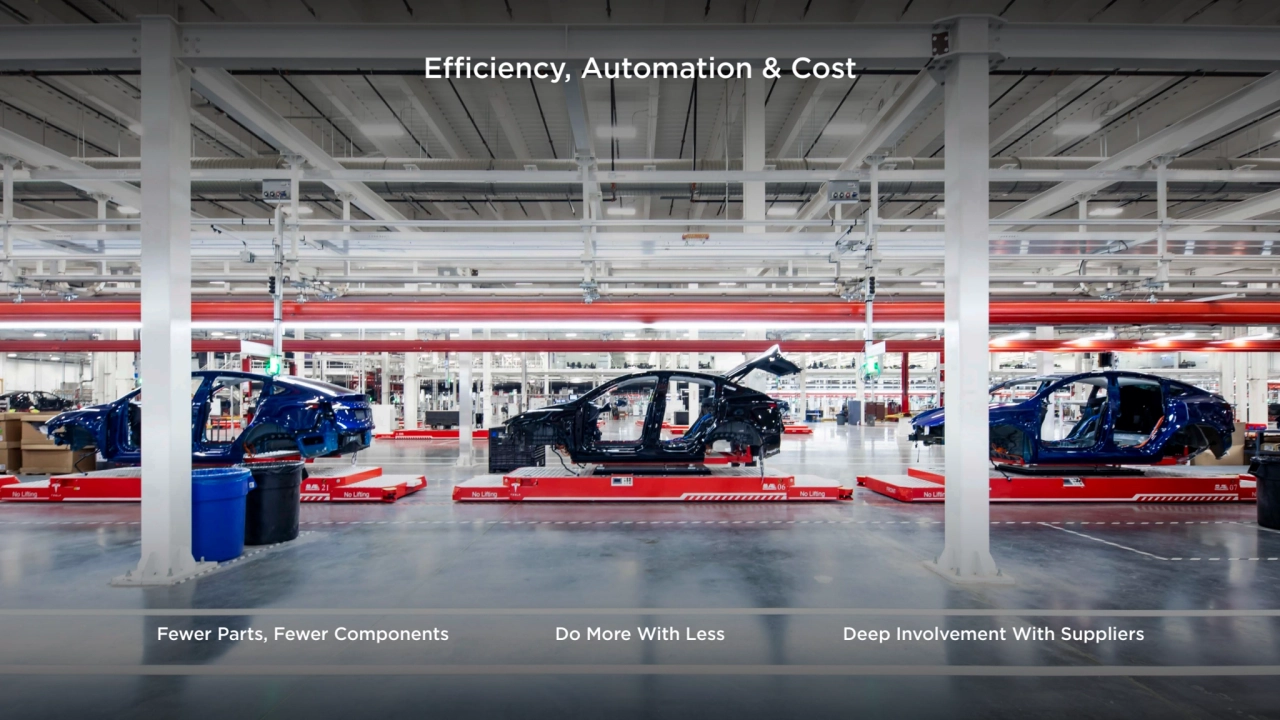
- 118. Efficiency, Automation & Cost Fewer Parts, Fewer Components Do More With Less Deep Involvement With Suppliers
- 119. 08 Manufacturing Tom Zhu, Drew Baglino
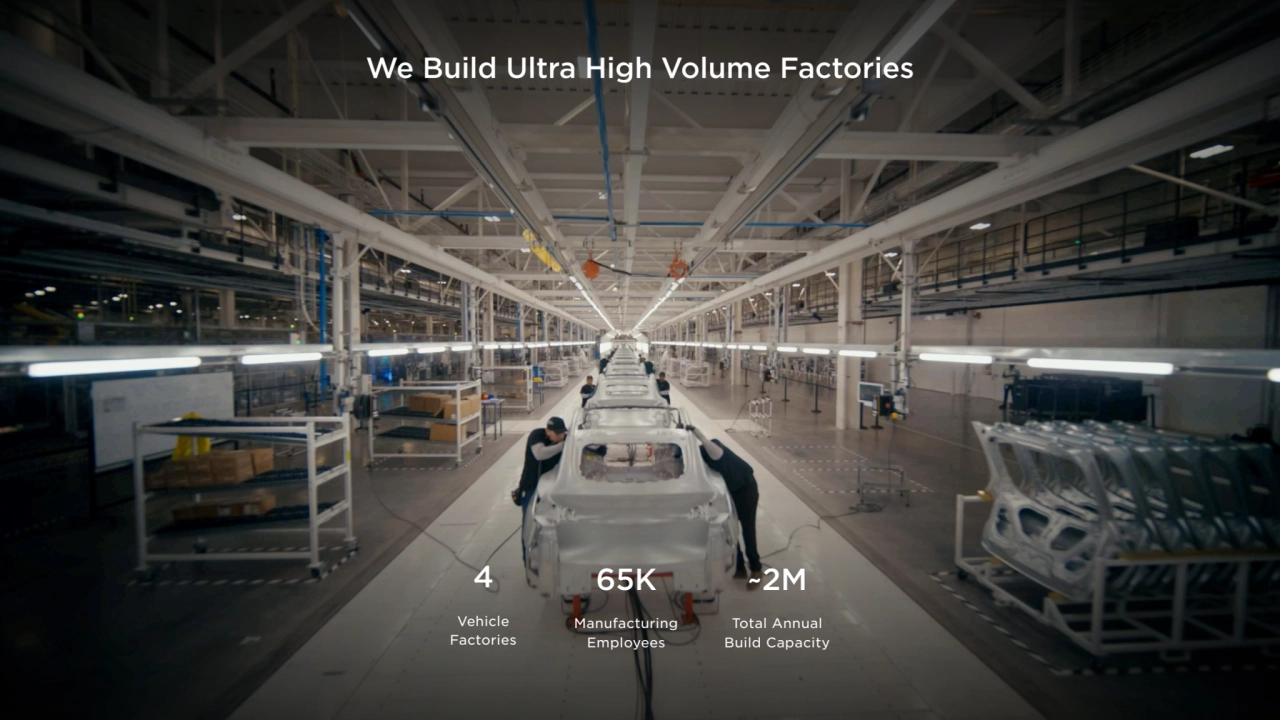
- 120. 65K Manufacturing Employees 4 Vehicle Factories We Build Ultra High Volume Factories ~2M Total Annual Build Capacity
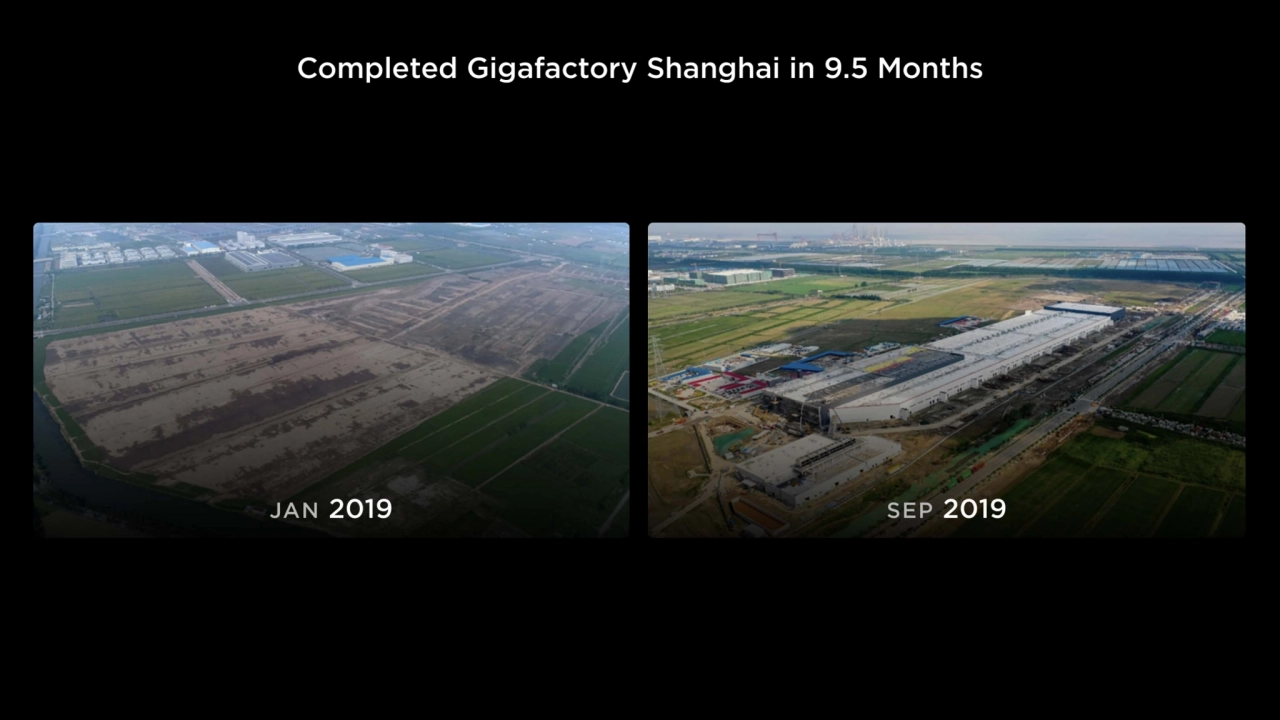
- 121. Completed Gigafactory Shanghai in 9.5 Months
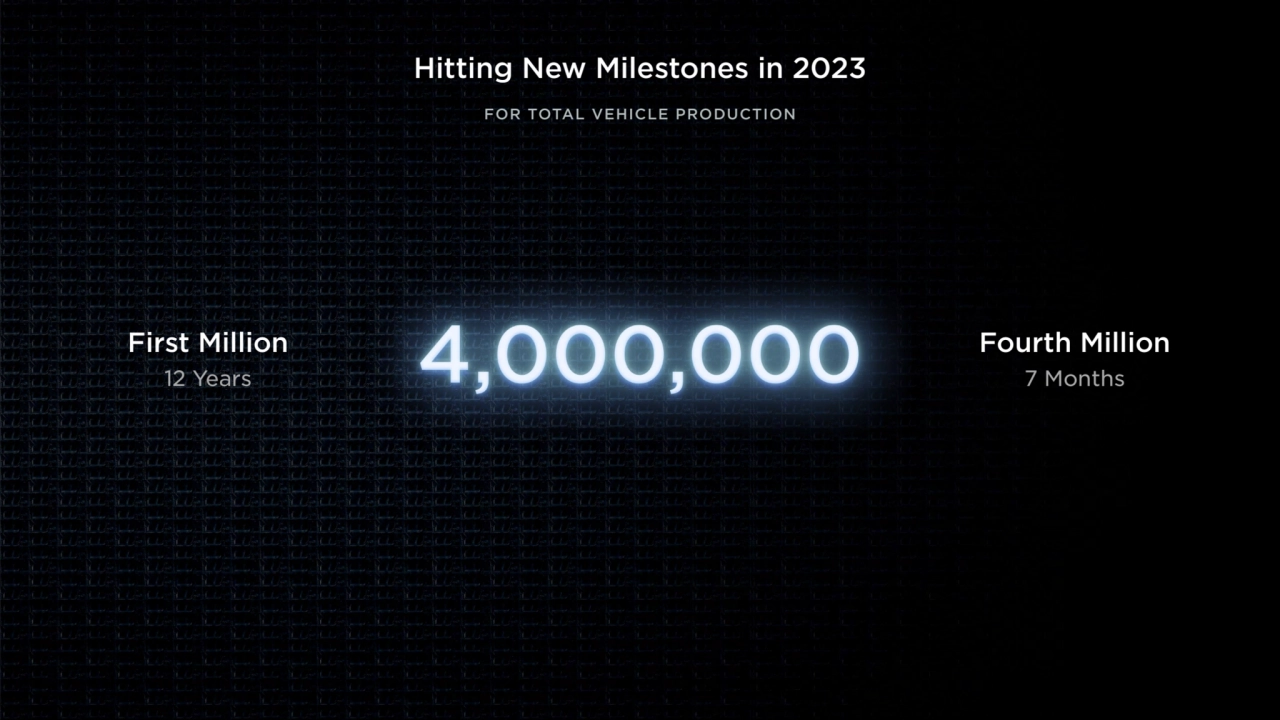
- 122. First Million 12 Years Hitting New Milestones in 2023 FOR TOTAL VEHICLE PRODUCTION Fourth Million 7 Months
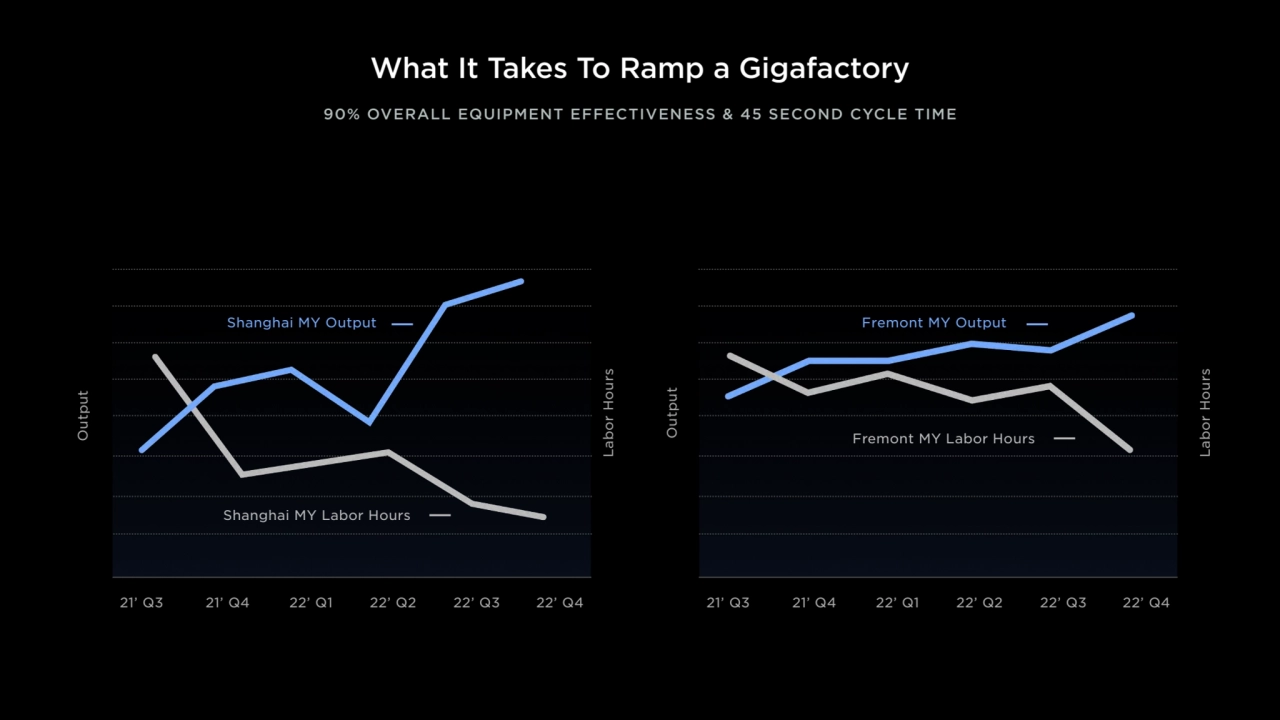
- 123. What It Takes To Ramp a Gigafactory 21’ Q3 21’ Q4 22’ Q3 22’ Q4 Output Output 22’ Q1 22’ Q2 21’ Q3 21’ Q4 22’ Q1 22’ Q2 22’ Q3 22’ Q4 Shanghai MY Output Shanghai MY Labor Hours Fremont MY Output Fremont MY Labor Hours Labor HoursLabor Hours 90% OVERALL EQUIPMENT EFFECTIVENESS & 45 SECOND CYCLE TIME
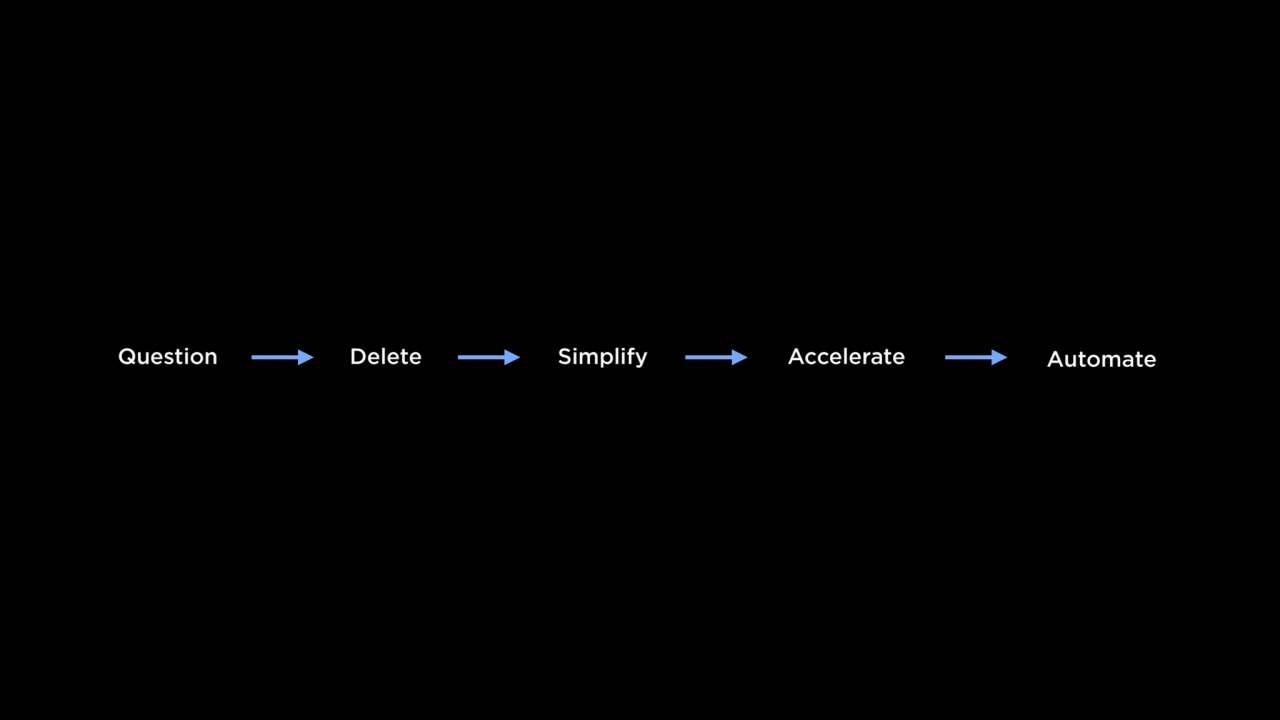
- 124. Question Delete Simplify Accelerate Automate
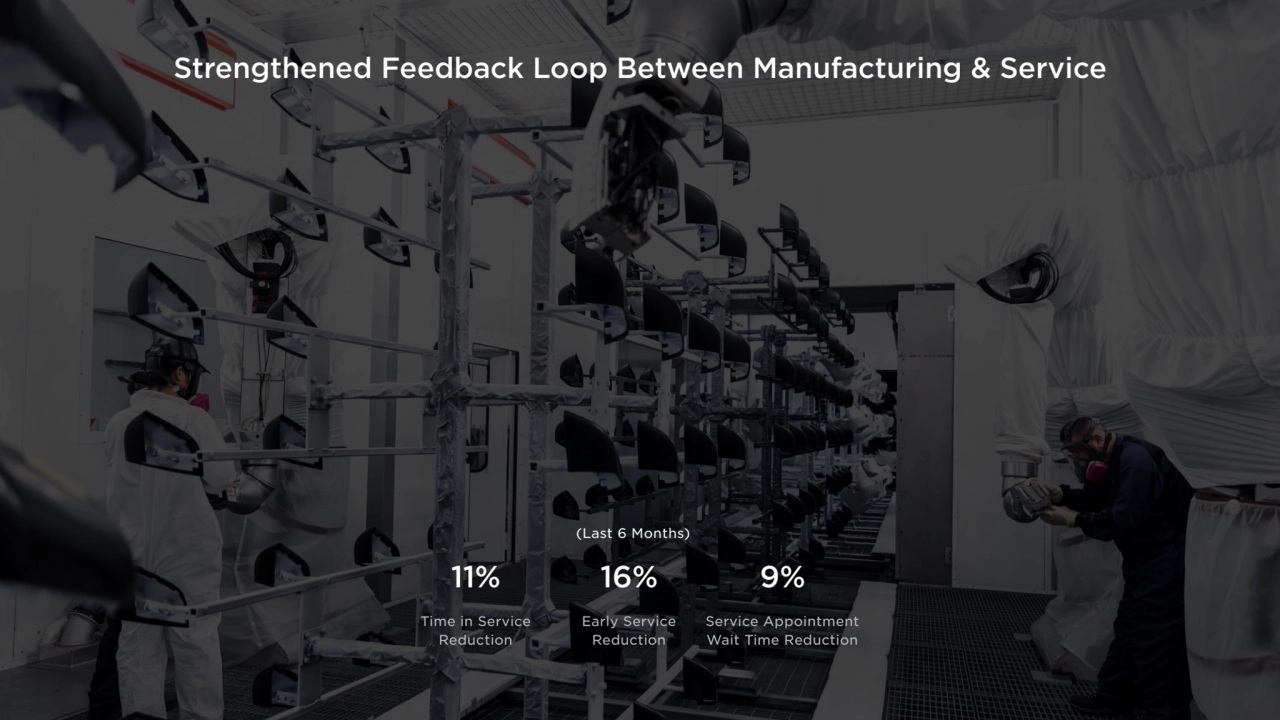
- 125. Remove the minus sign from in front of each number since it says reduction in the unit 16% Early Service Reduction Strengthened Feedback Loop Between Manufacturing & Service 9% Service Appointment Wait Time Reduction 11% Time in Service Reduction (Last 6 Months)
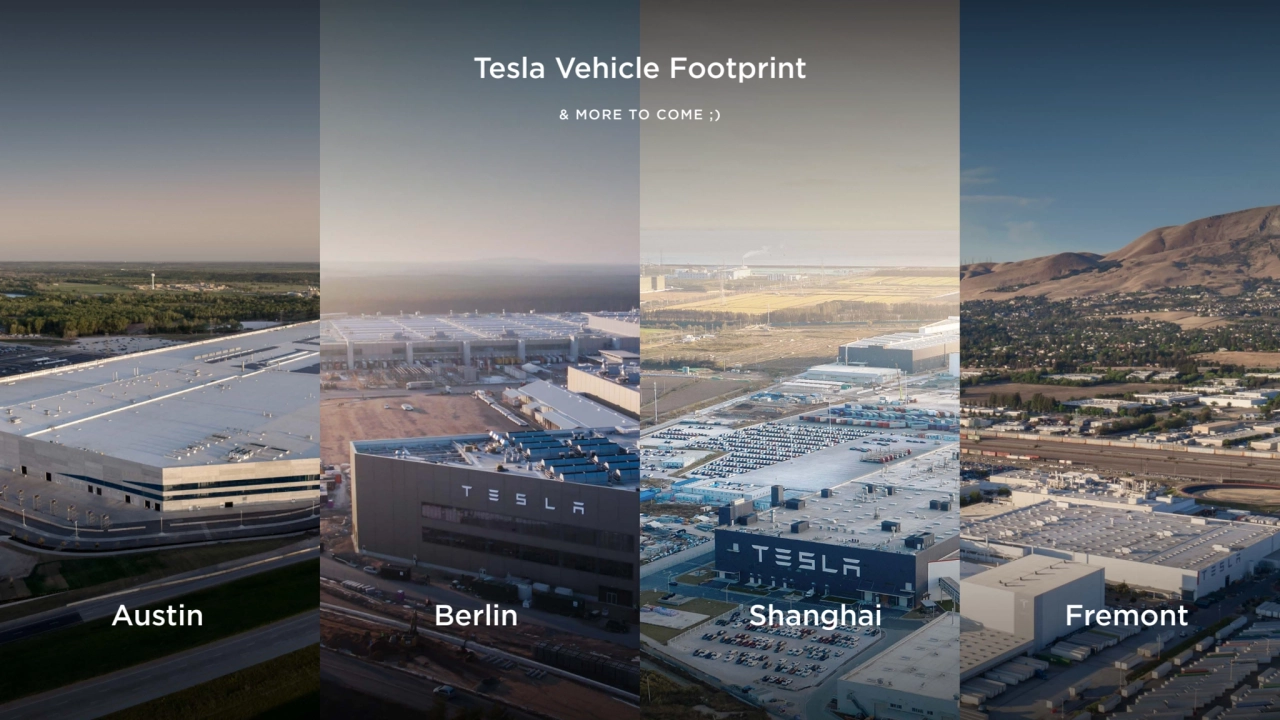
- 126. Tesla Vehicle Footprint & MORE TO COME ;) Austin Berlin Shanghai Fremont
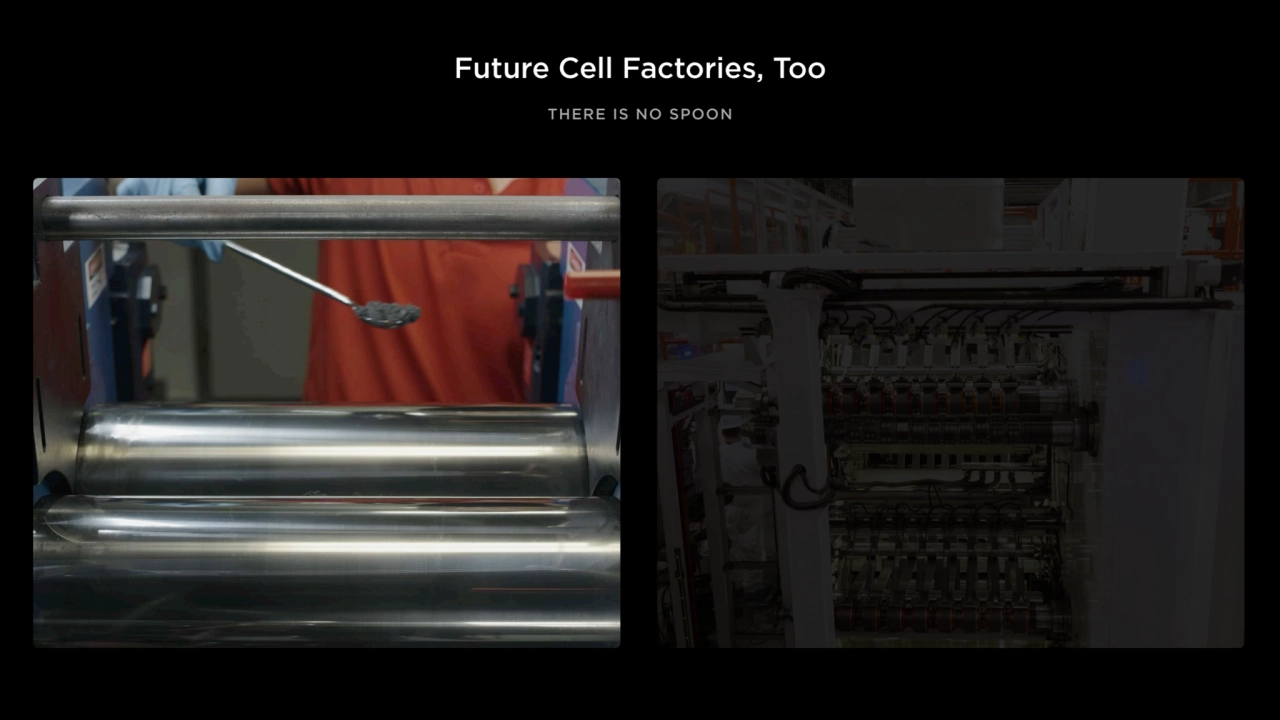
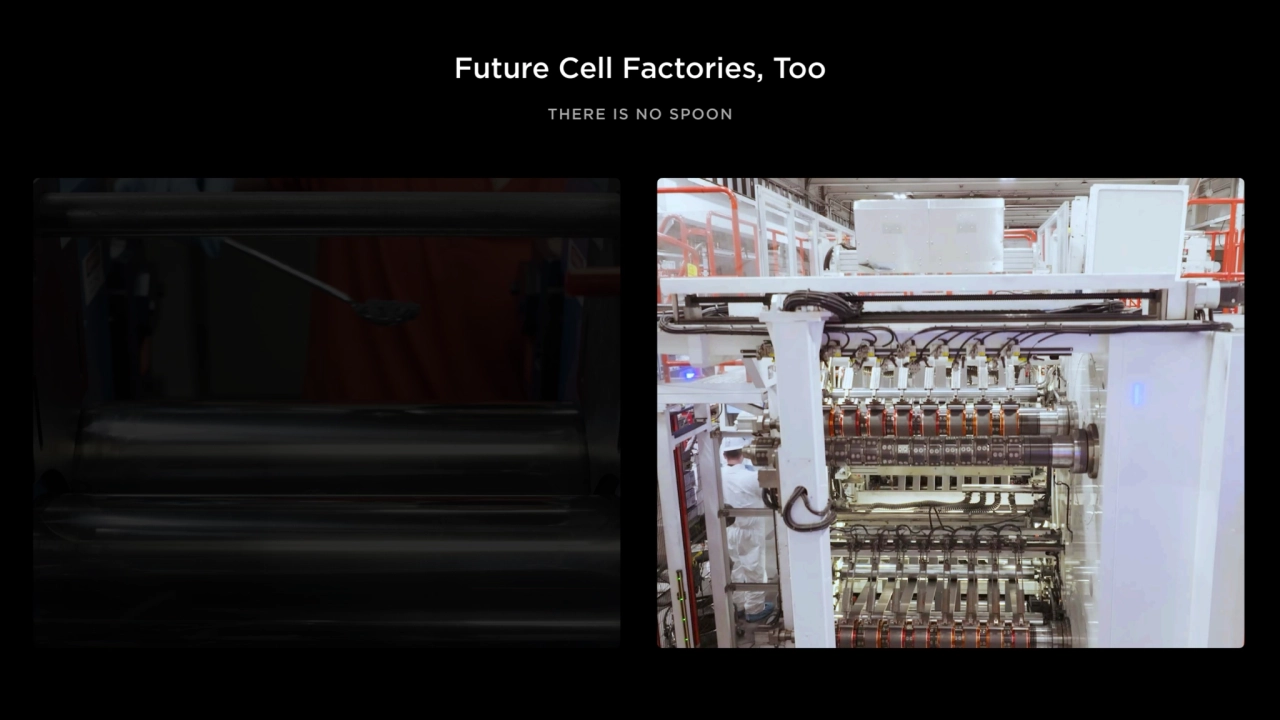
- 127. Future Cell Factories, Too There Is No Spoon THERE IS NO SPOON
- 128. There Is No Spoon THERE IS NO SPOON Future Cell Factories, Too
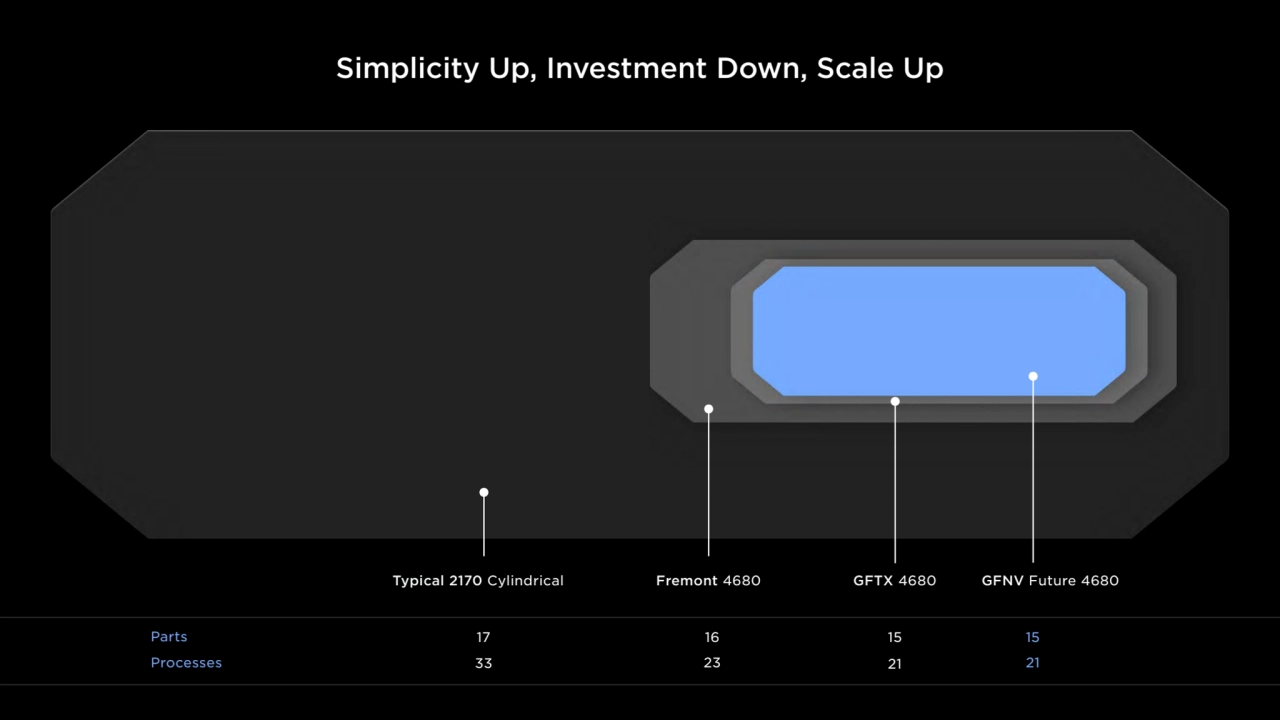
- 129. Simplicity Up, Investment Down, Scale Up Typical 2170 Cylindrical Fremont 4680 GFTX 4680 GFNV Future 4680 Parts Processes 17 16 15 33 23 21 15 21
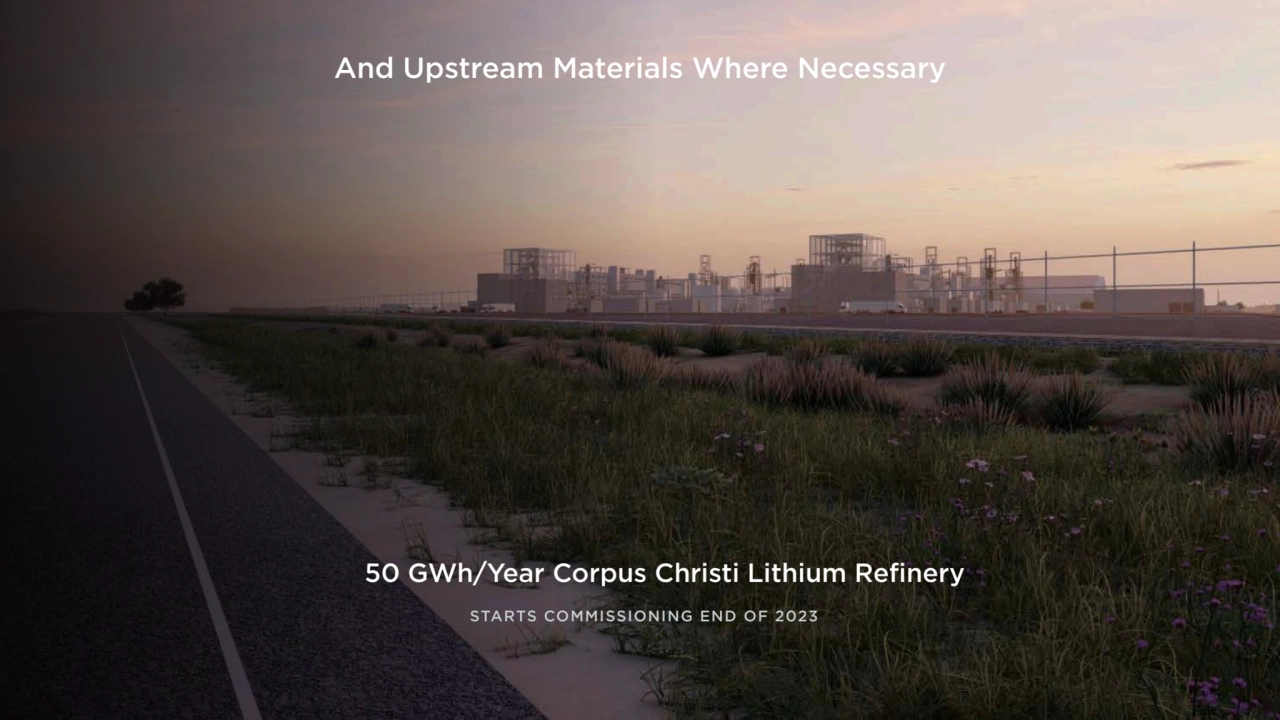
- 130. And Upstream Materials Where Necessary 50 GWh/Year Corpus Christi Lithium Refinery STARTS COMMISSIONING END OF 2023
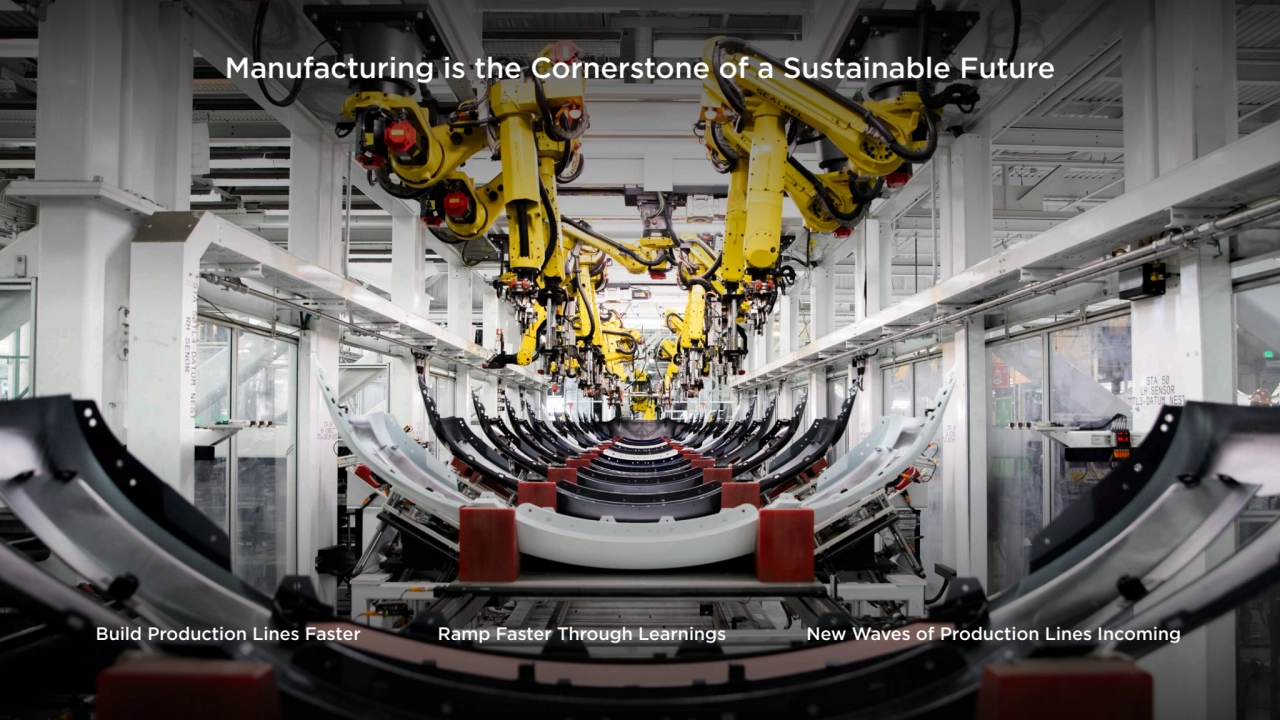
- 131. Manufacturing is the Cornerstone of a Sustainable Future Build Production Lines Faster Ramp Faster Through Learnings New Waves of Production Lines Incoming
- 132. 09 Energy Drew Baglino, Mike Snyder
- 133. Building Mission-Aligned Projects Globally for 10 Years
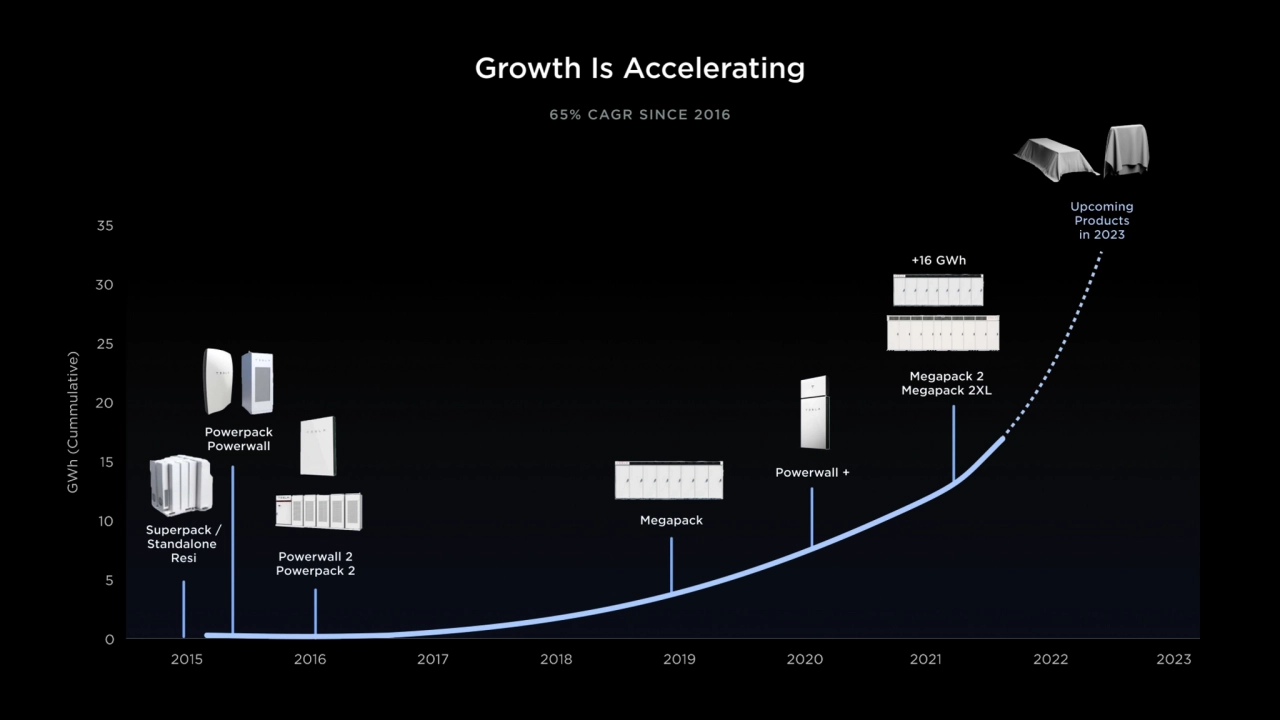
- 134. Growth Is Accelerating 65% CAGR SINCE 2016
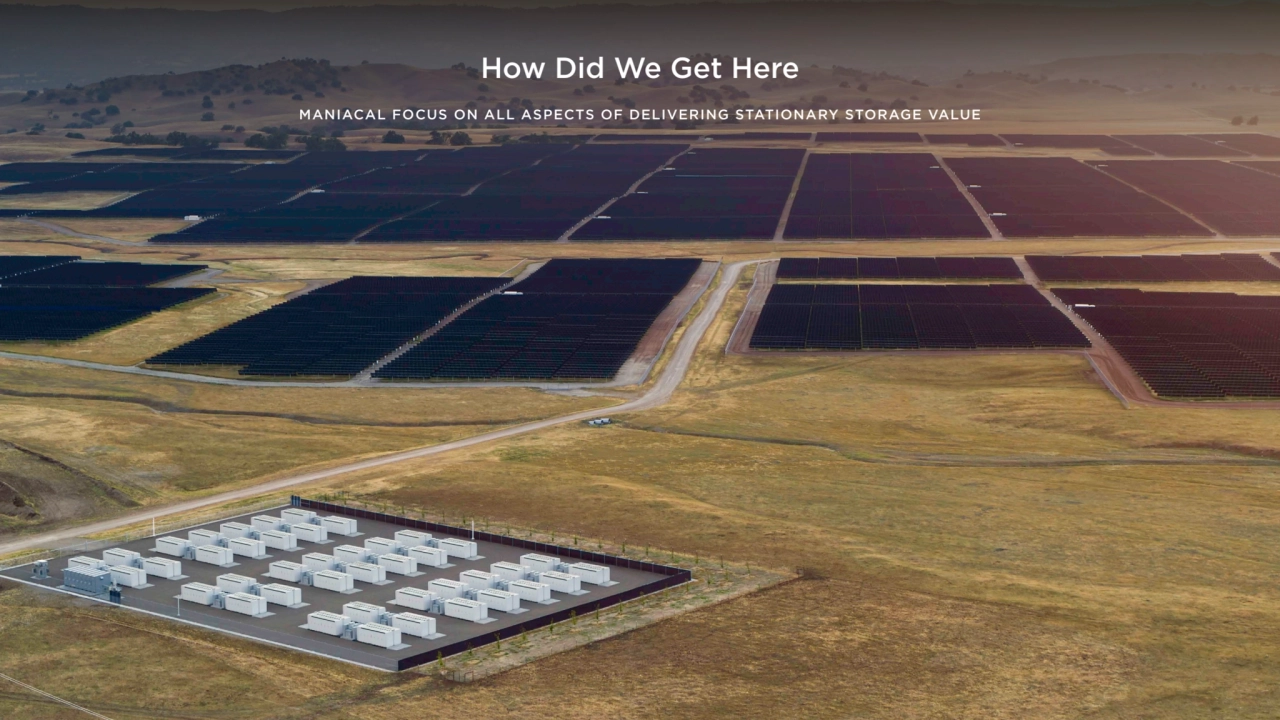
- 135. How Did We Get Here MANIACAL FOCUS ON ALL ASPECTS OF DELIVERING STATIONARY STORAGE VALUE
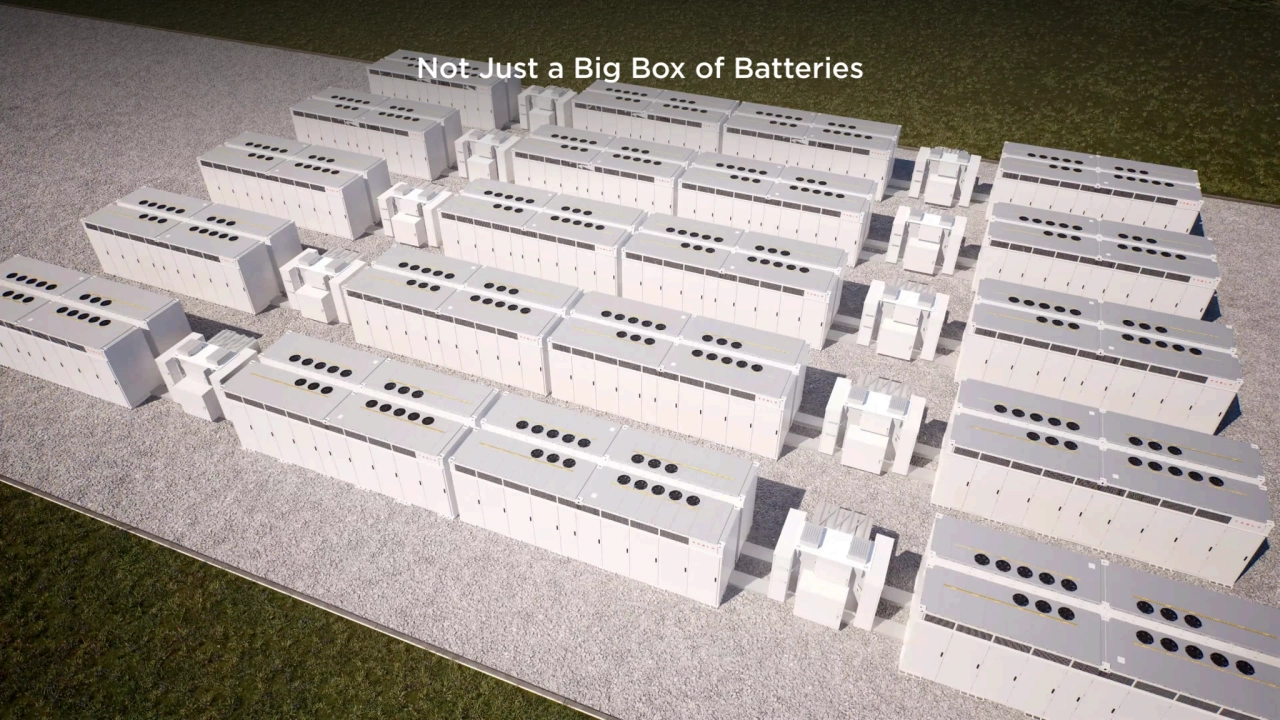
- 136. Not Just a Big Box of Batteries
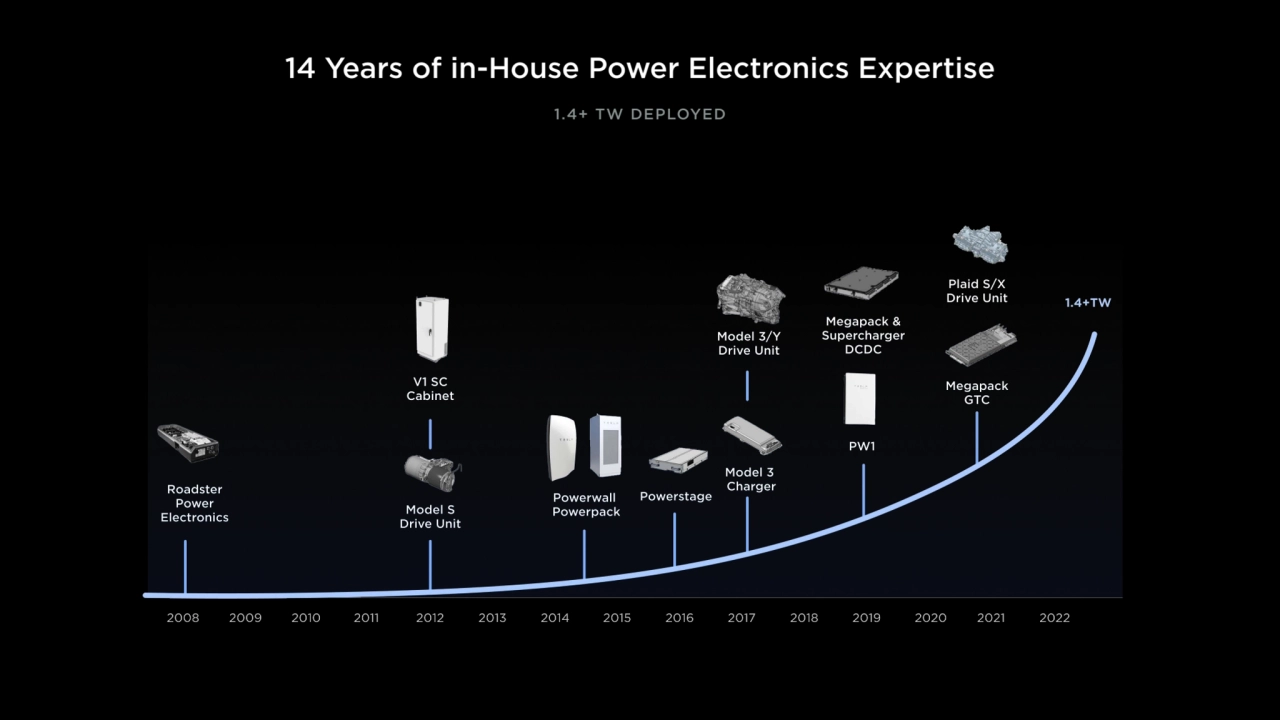
- 137. 14 Years of in-House Power Electronics Expertise 1.4+ TW DEPLOYED
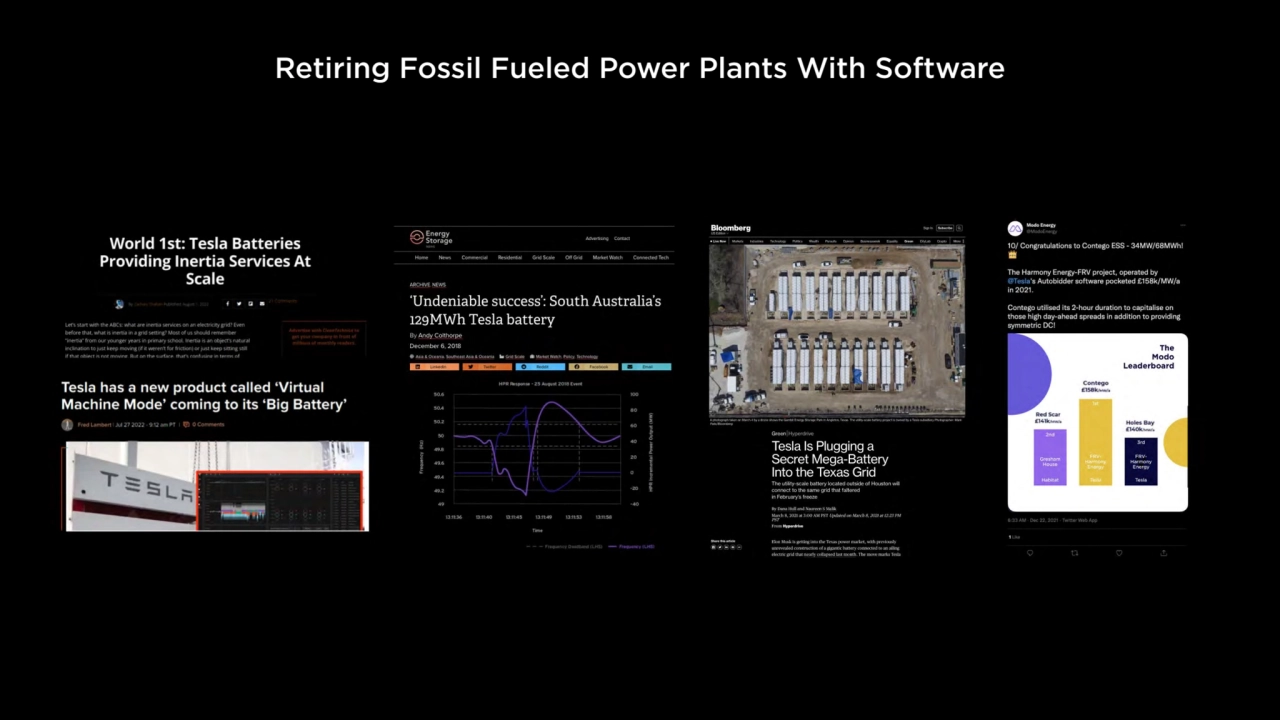
- 138. Retiring Fossil Fueled Power Plants With Software
- 139. How Did We Get Here RELENTLESS FOCUS ON SPEED OF EXECUTION
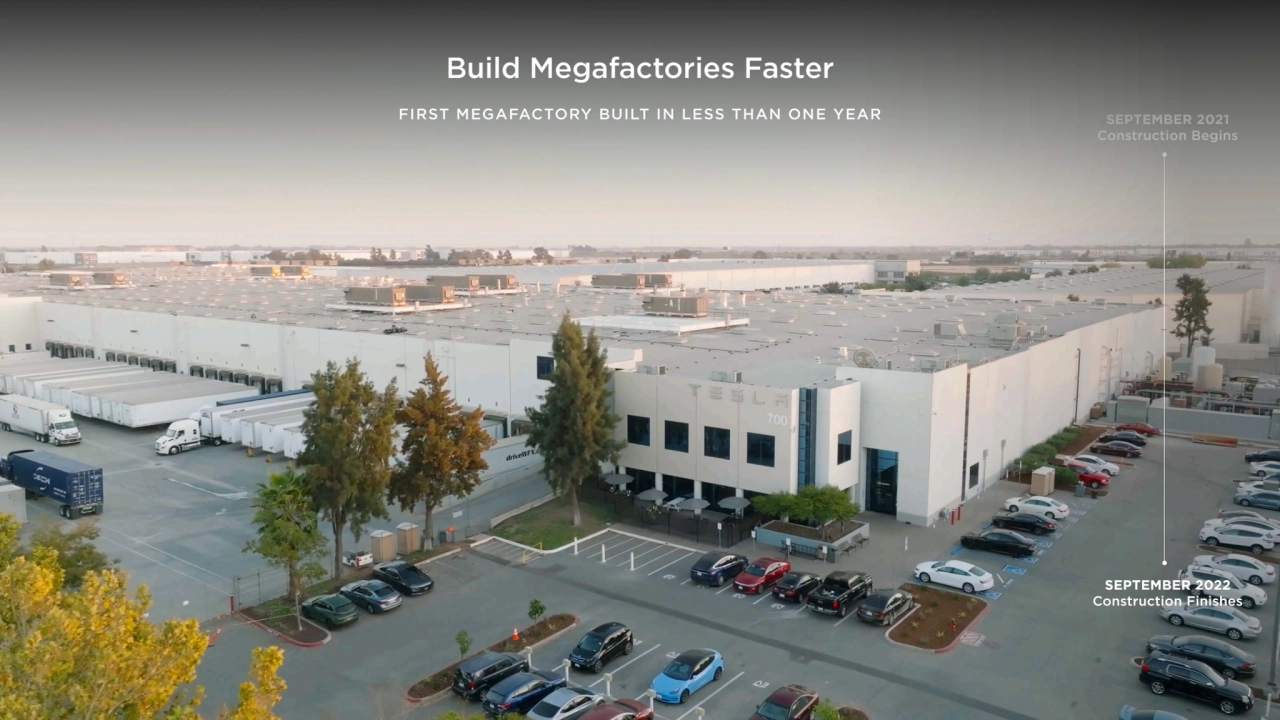
- 140. Build Megafactories Faster FIRST MEGAFACTORY BUILT IN LESS THAN ONE YEAR
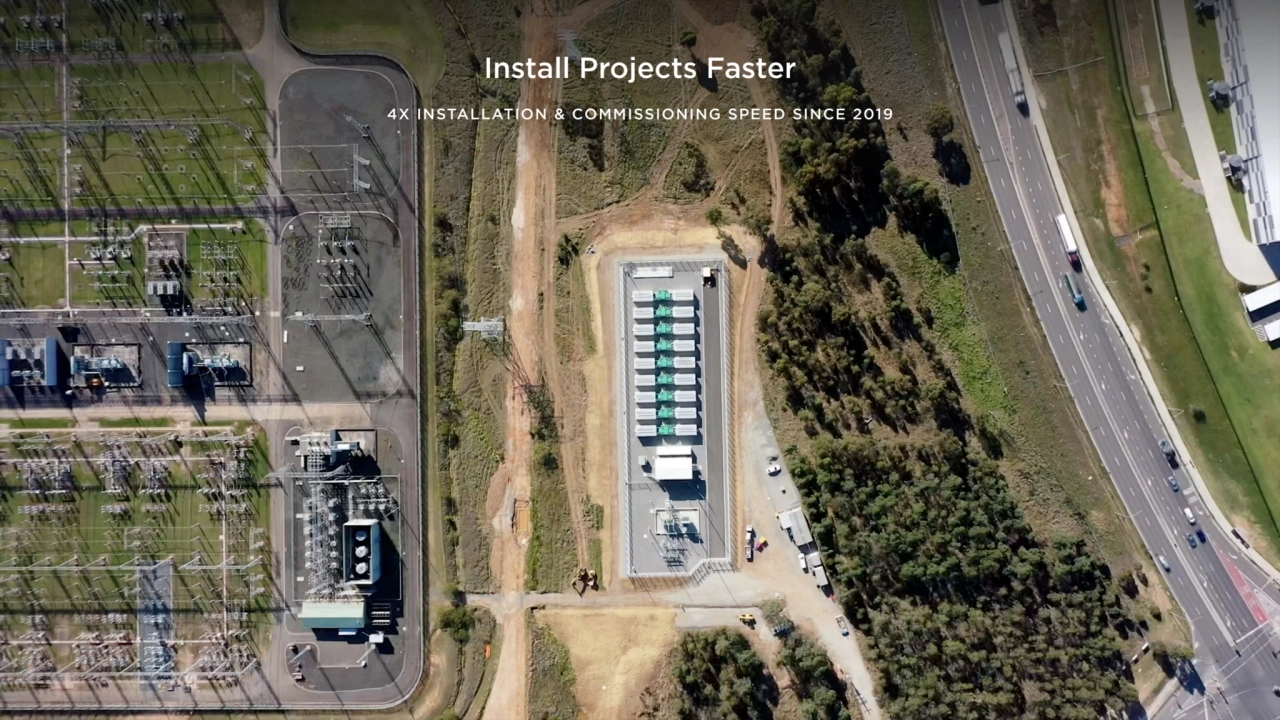
- 141. Install Projects Faster 4X INSTALLATION & COMMISSIONING SPEED SINCE 2019
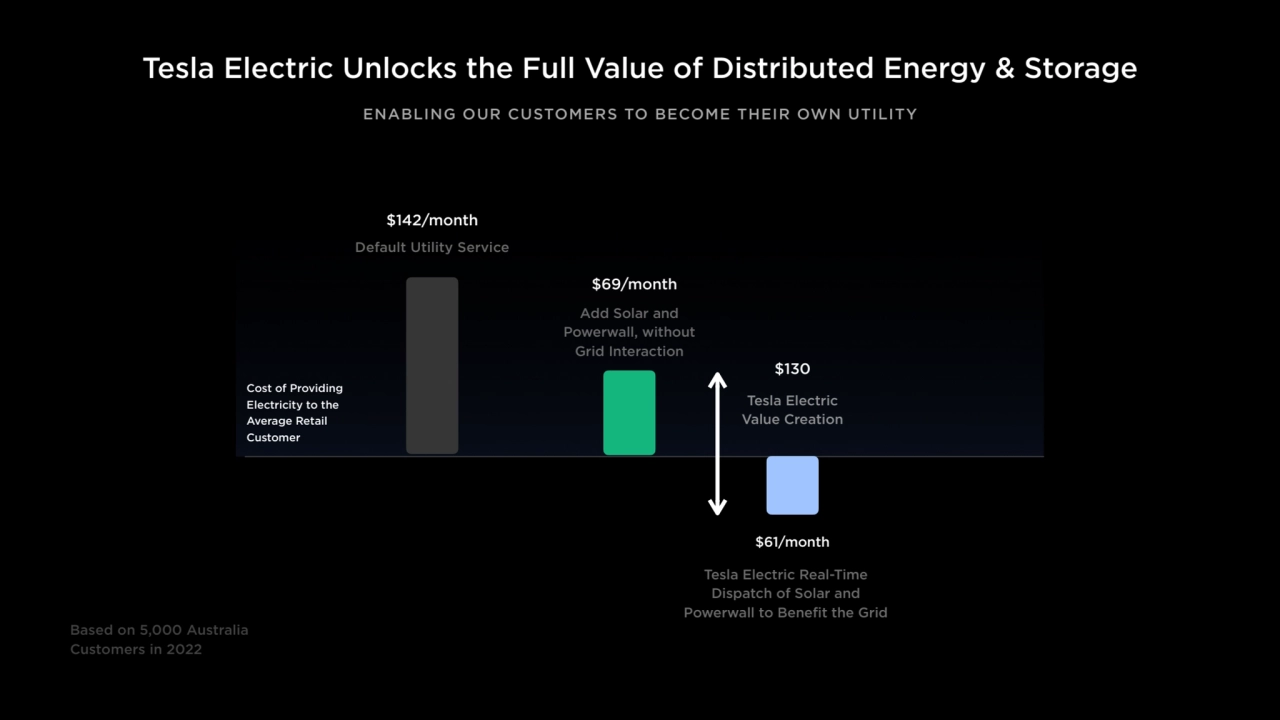
- 142. Tesla Electric Unlocks the Full Value of Distributed Energy & Storage Tesla Electric Value Creation $61/month Based on 5,000 Australia Customers in 2022 Add Solar and Powerwall, without Grid Interaction Default Utility Service $142/month $69/month Tesla Electric Real-Time Dispatch of Solar and Powerwall to Benefit the Grid Cost of Providing Electricity to the Average Retail Customer $130 ENABLING OUR CUSTOMERS TO BECOME THEIR OWN UTILITY
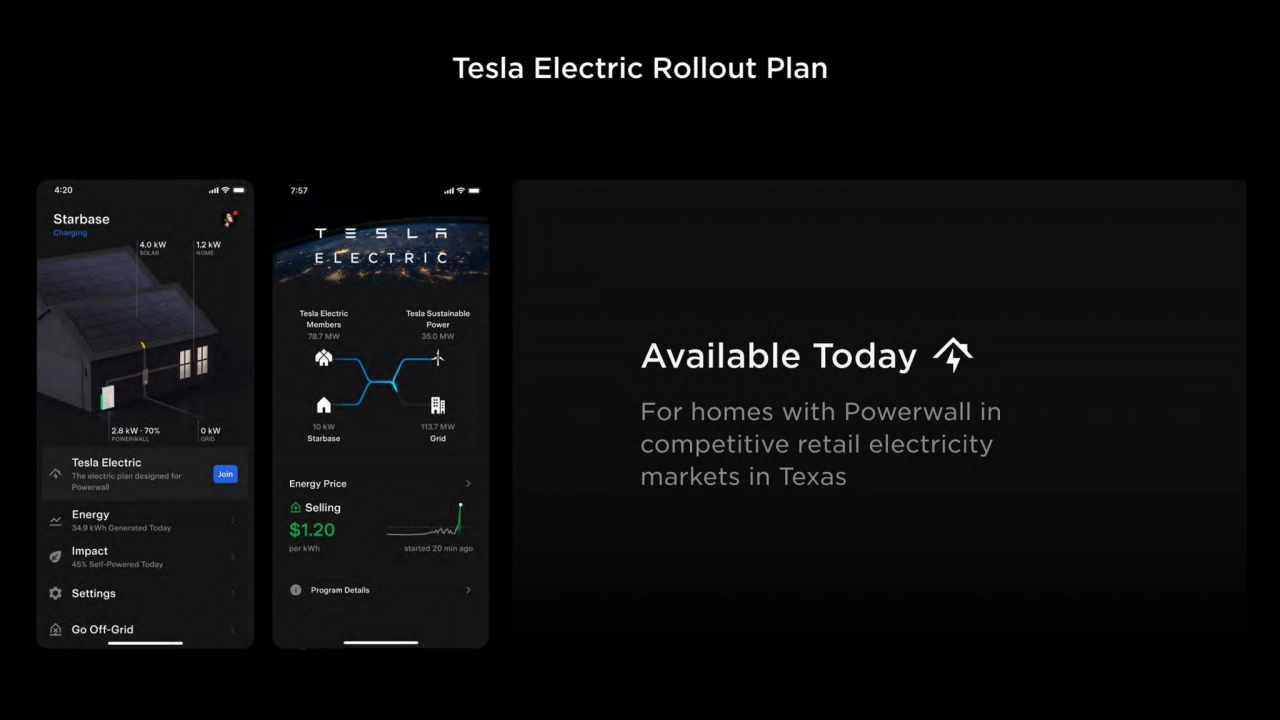
- 143. Tesla Electric Rollout Plan
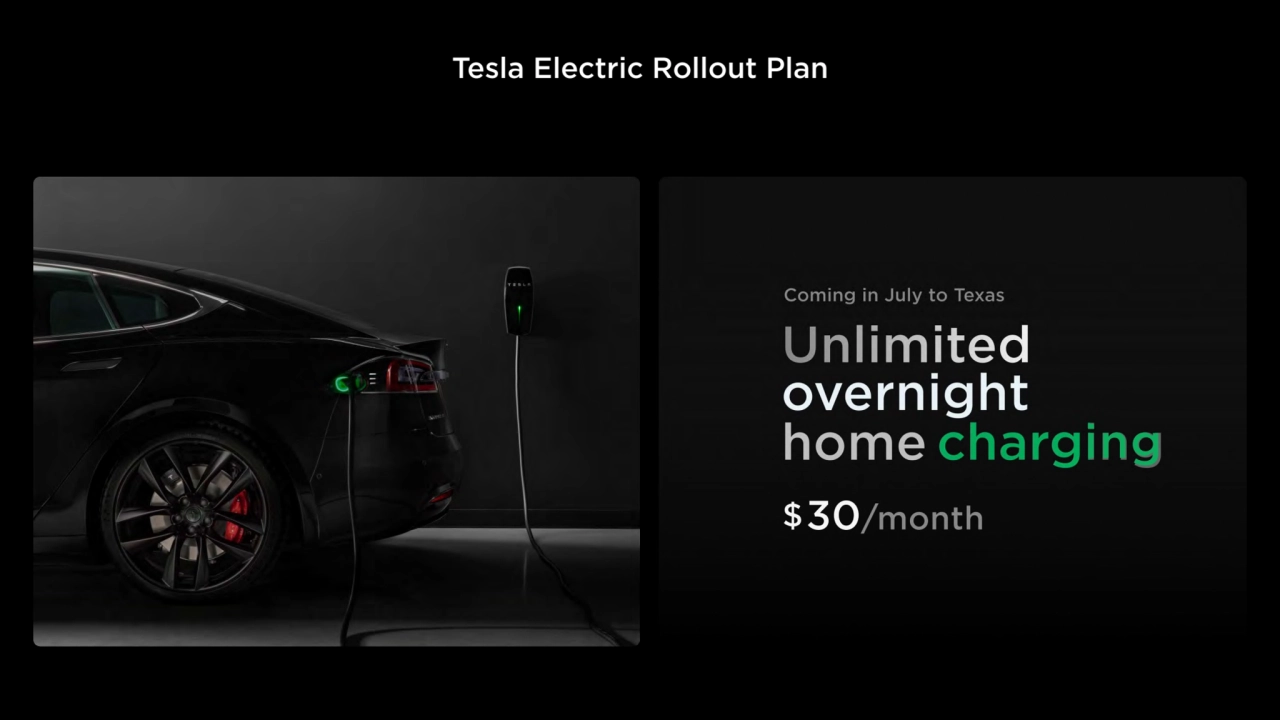
- 144. Tesla Electric Rollout Plan ing
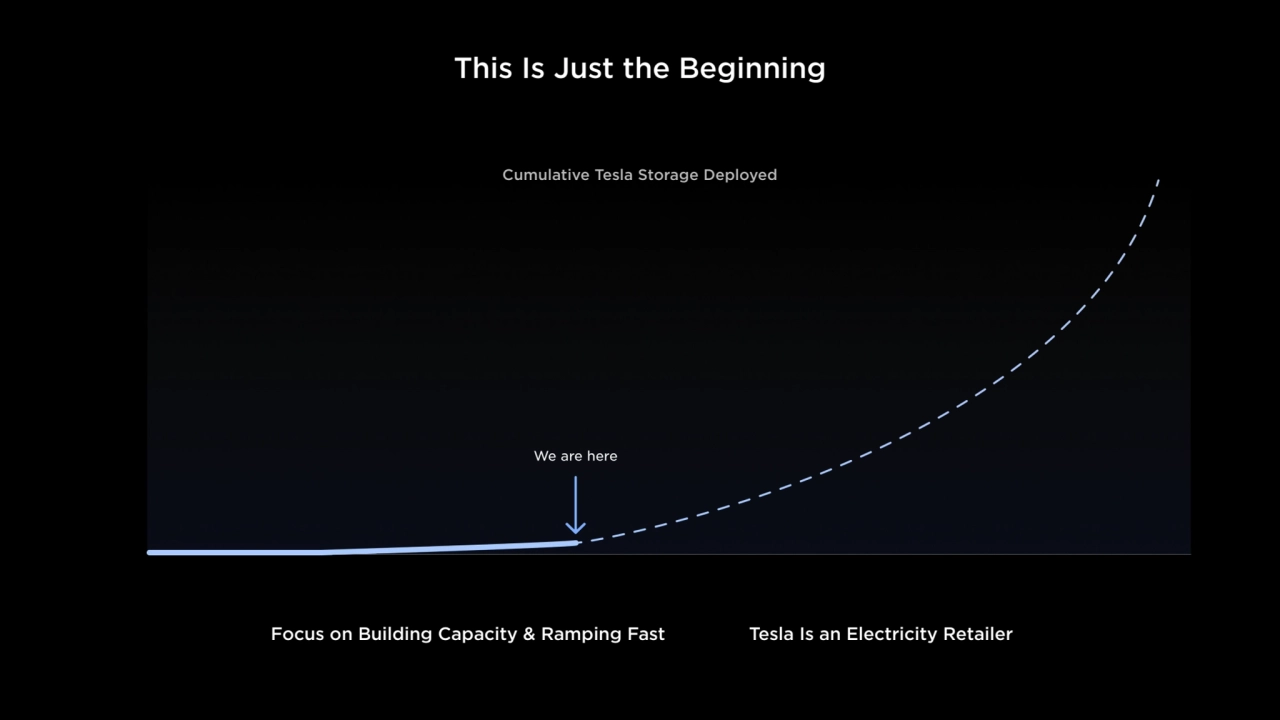
- 145. This Is Just the Beginning We are here Cumulative Tesla Storage Deployed Focus on Building Capacity & Ramping Fast Tesla Is an Electricity Retailer
- 146. Impact at Tesla
- 147. 01 Impact Laurie Shelby, Brandon Ehrhart
- 148. Who We Are
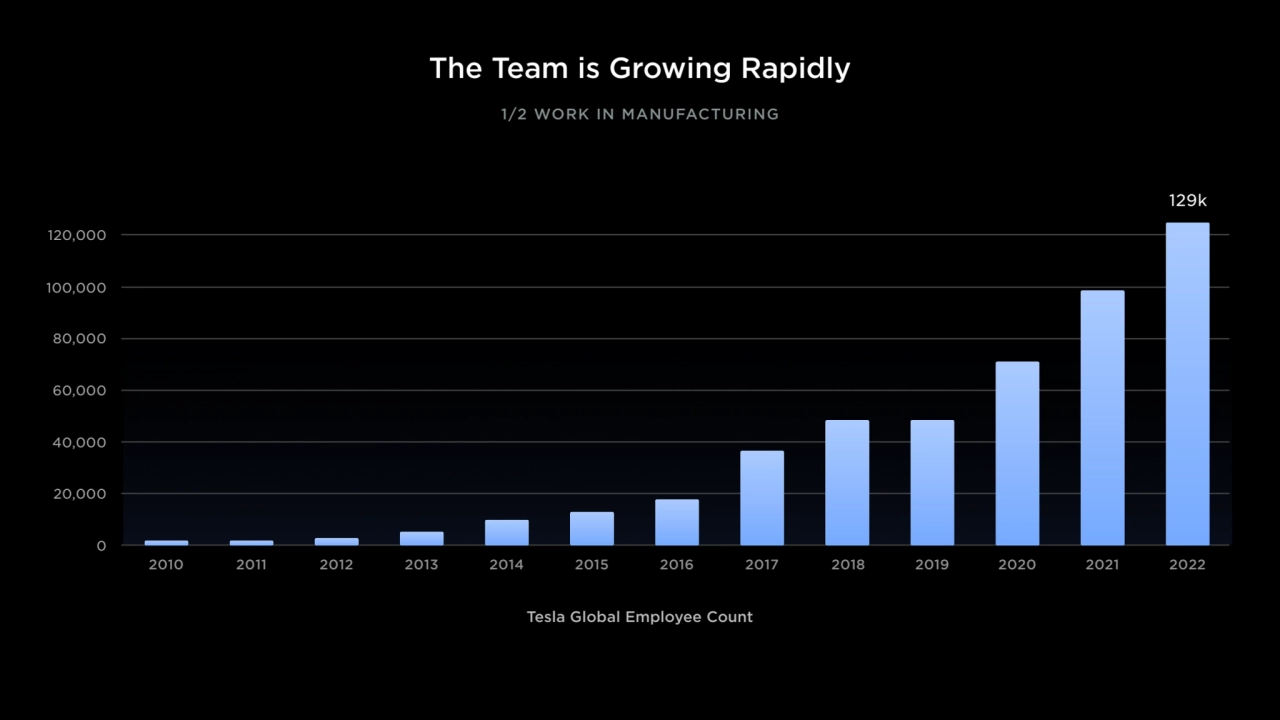
- 149. The Team is Growing Rapidly 0 20,000 2010 40,000 60,000 80,000 100,000 Tesla Global Employee Count 2011 2012 2013 2014 2015 2016 2017 2018 2019 2020 2021 2022 129k 1/2 WORK IN MANUFACTURING 120,000
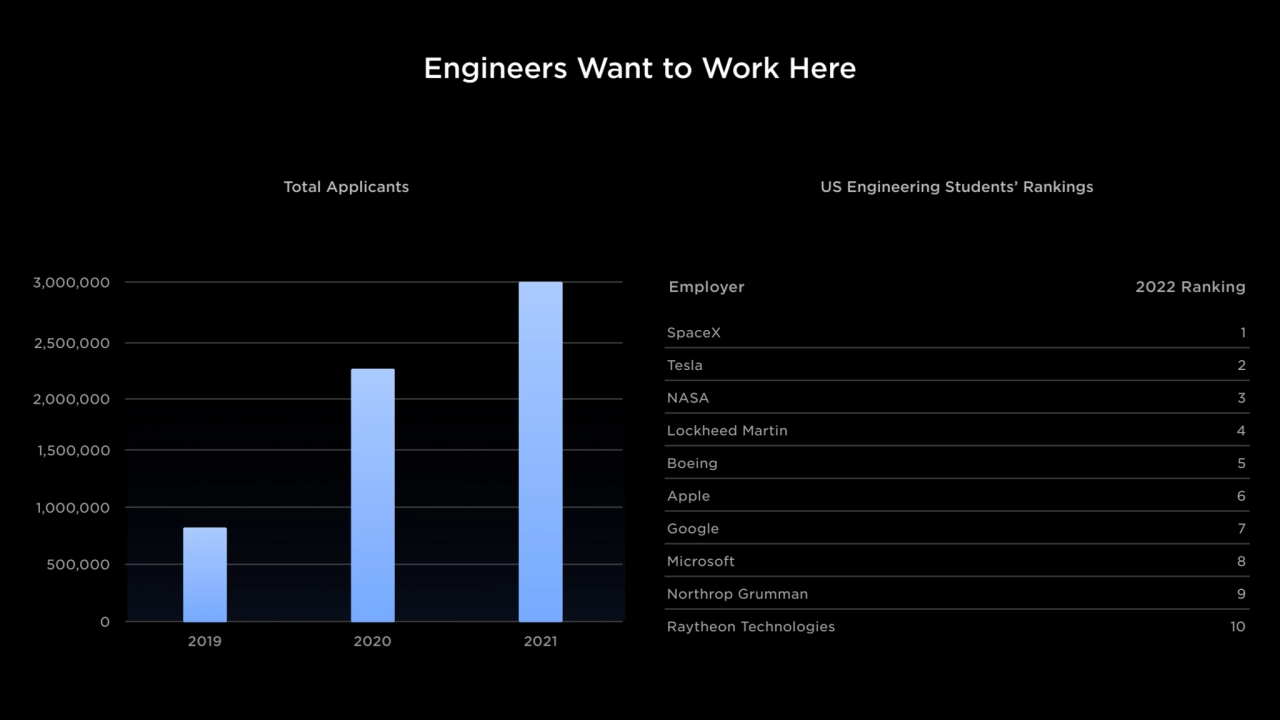
- 150. Engineers Want to Work Here Total Applicants US Engineering Students’ Rankings 0 500,000 2019 1,000,000 1,500,000 2,000,000 2,500,000 2020 2021 3,000,000 Employer 2022 Ranking SpaceX Tesla NASA Lockheed Martin Boeing Apple Google Microsoft Northrop Grumman Raytheon Technologies 1 2 3 4 5 6 7 8 9 10
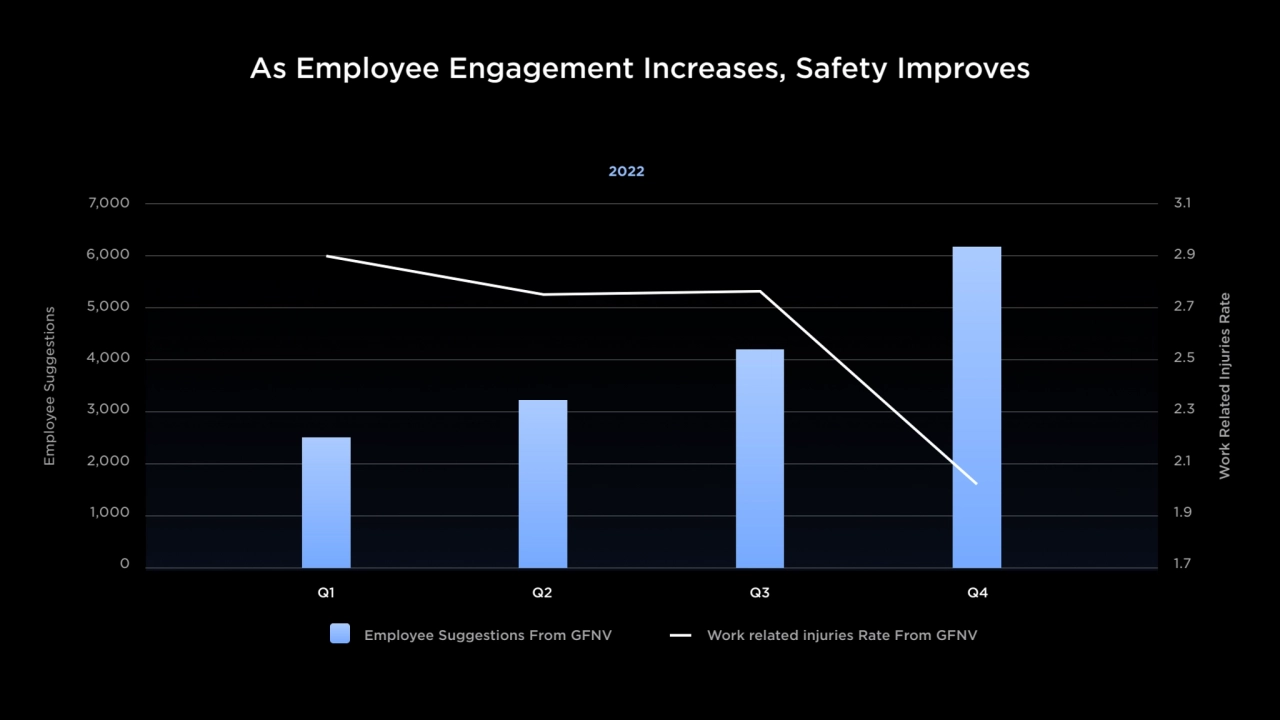
- 151. As Employee Engagement Increases, Safety Improves Employee Suggestions From GFNV Work Related Injuries Rate Employee Suggestions Q1 Q2 Q3 Q4 0 2,000 3,000 4,000 5,000 6,000 7,000 1,000 1.7 2.1 2.3 2.5 2.7 2.9 3.1 1.9 Work related injuries Rate From GFNV 2022
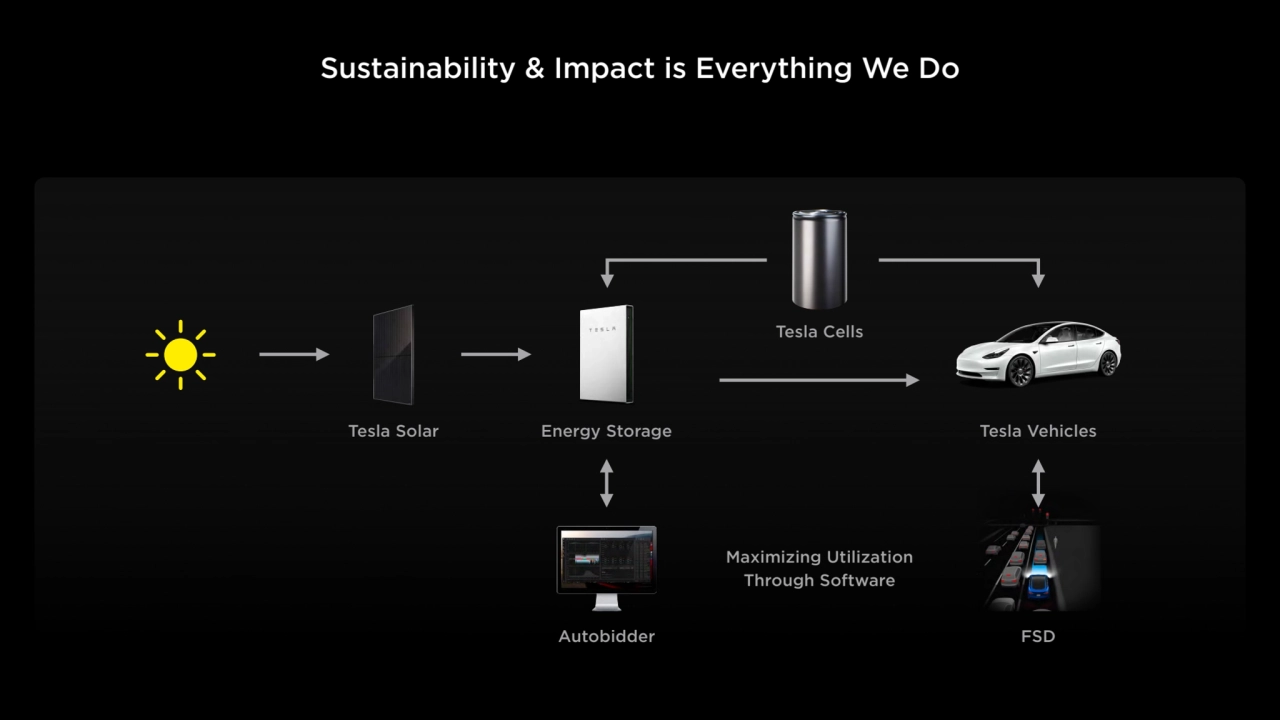
- 152. Tesla Solar Energy Storage Autobidder Tesla Cells Tesla Vehicles FSD Maximizing Utilization Through Software Sustainability & Impact is Everything We Do
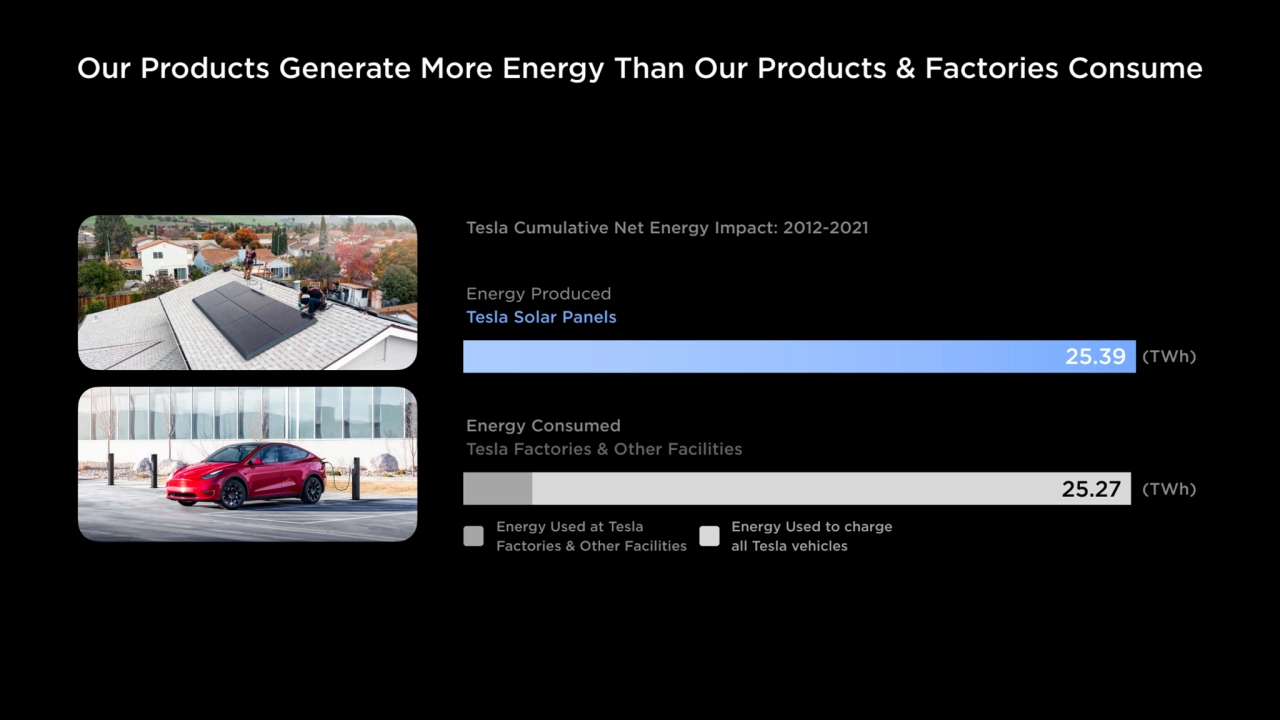
- 153. Our Products Generate More Energy Than Our Products & Factories Consume Tesla Cumulative Net Energy Impact: 2012-2021 Energy Produced Tesla Solar Panels Energy Consumed Tesla Factories & Other Facilities 25.39 25.27 Energy Used at Tesla Factories & Other Facilities Energy Used to charge all Tesla vehicles (TWh) (TWh)
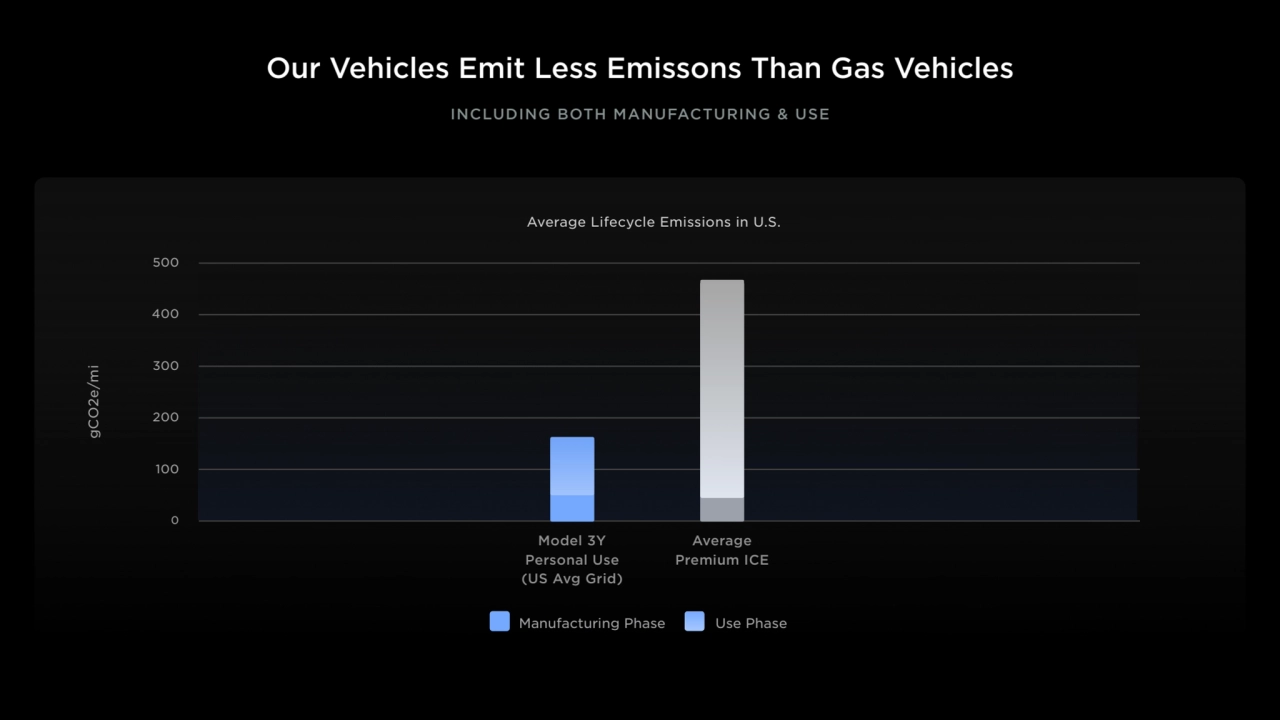
- 154. Our Vehicles Emit Less Emissons Than Gas Vehicles 0 100 Model 3Y Personal Use (US Avg Grid) 200 300 400 500 Average Premium ICE Average Lifecycle Emissions in U.S. gCO2e/mi Manufacturing Phase Use Phase INCLUDING BOTH MANUFACTURING & USE
- 155. 02 Financials Zach Kirkhorn
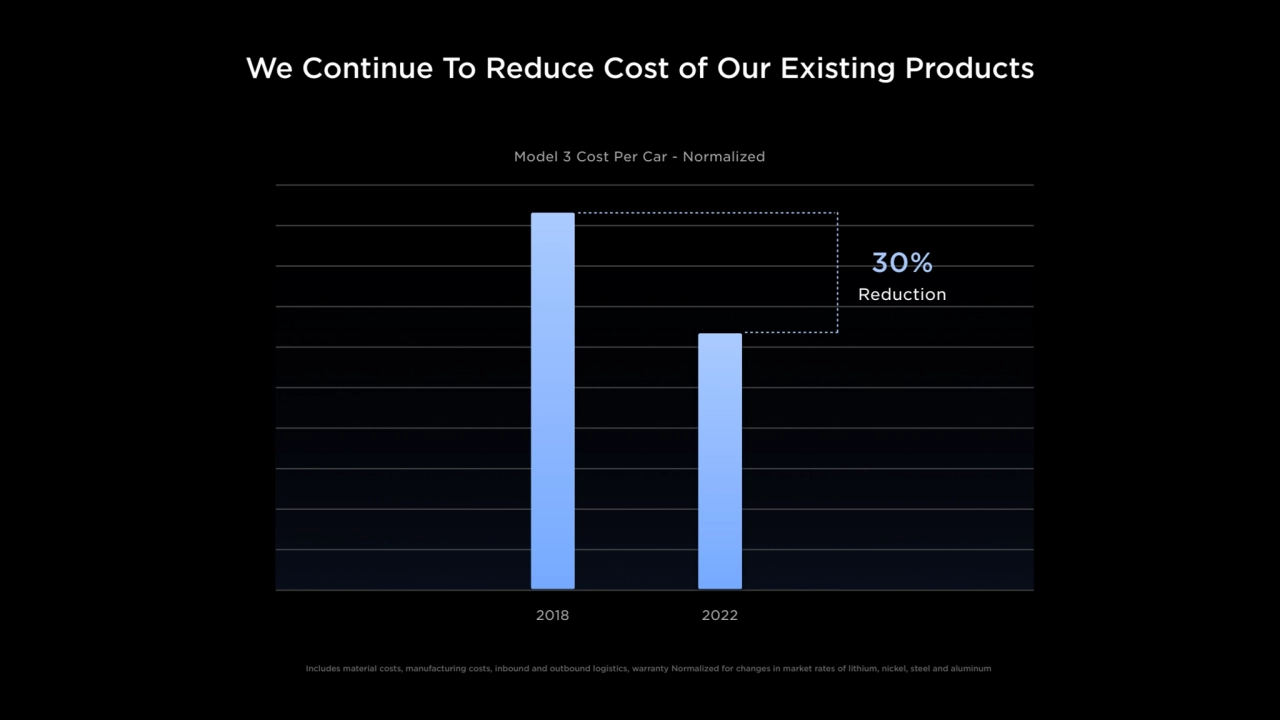
- 156. We Continue To Reduce Cost of Our Existing Products 2018 2022 Includes material costs, manufacturing costs, inbound and outbound logistics, warranty Normalized for changes in market rates of lithium, nickel, steel and aluminum Model 3 Cost Per Car - Normalized 30% Reduction
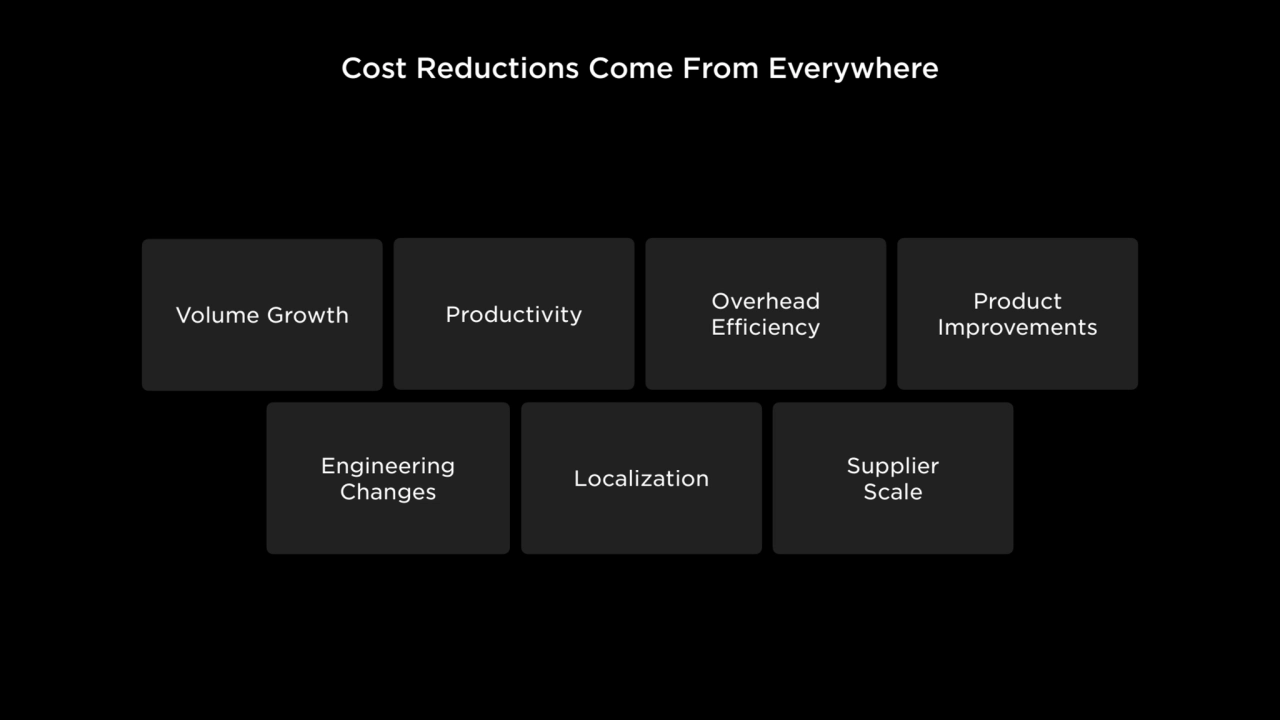
- 157. Cost Reductions Come From Everywhere Volume Growth Productivity Overhead Efficiency Product Improvements Localization Engineering Changes Supplier Scale
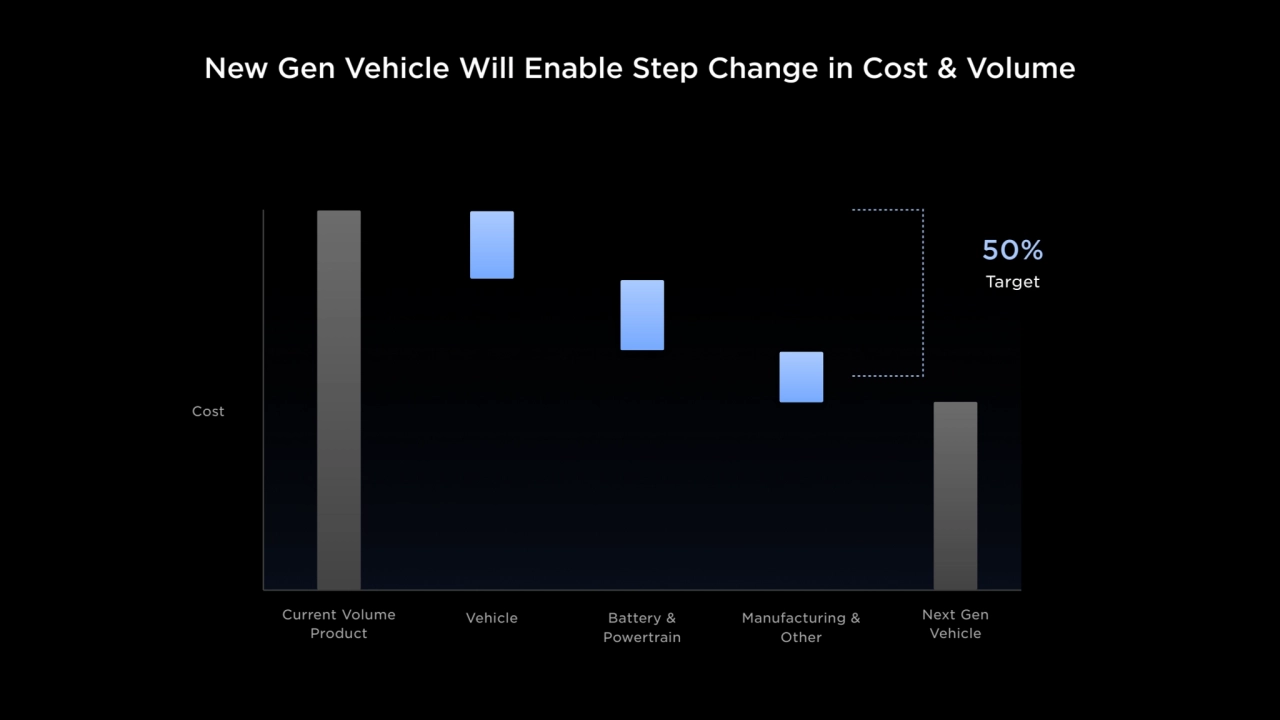
- 158. New Gen Vehicle Will Enable Step Change in Cost & Volume Current Volume Product Vehicle Battery & Powertrain Manufacturing & Other Next Gen Vehicle Cost 50% Target
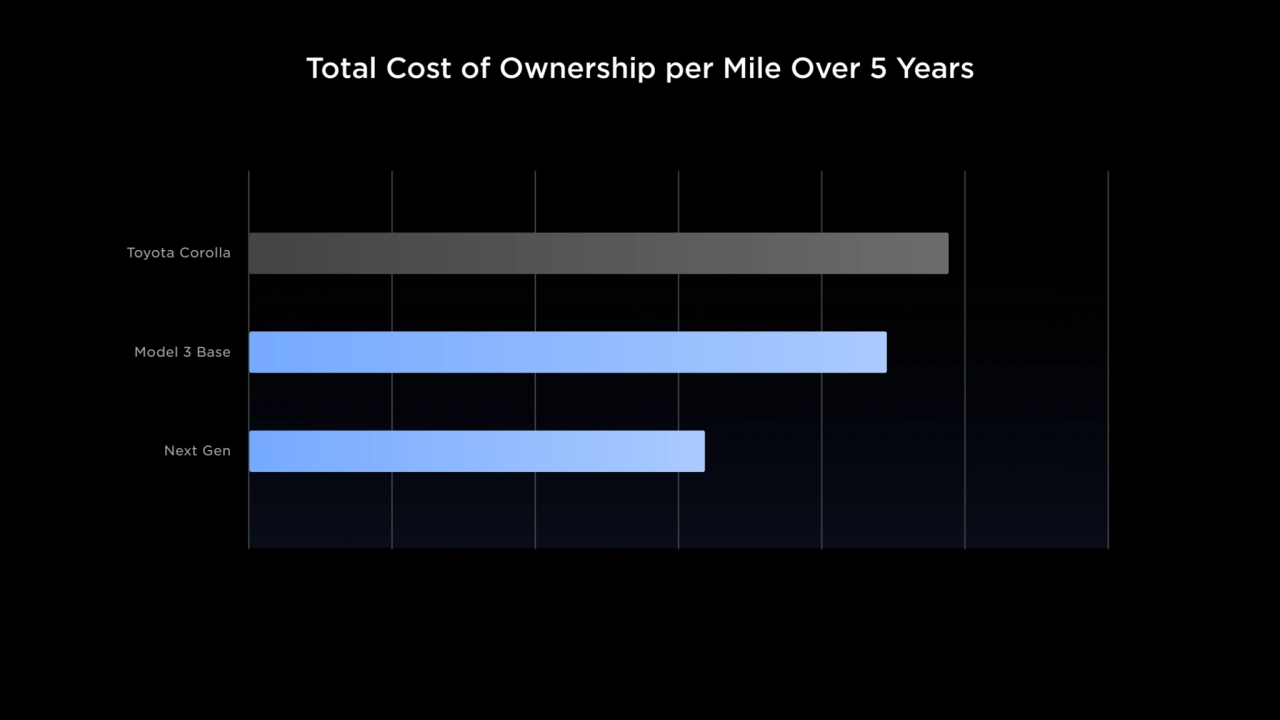
- 159. Total Cost of Ownership per Mile Over 5 Years Next Gen Model 3 Base Toyota Corolla
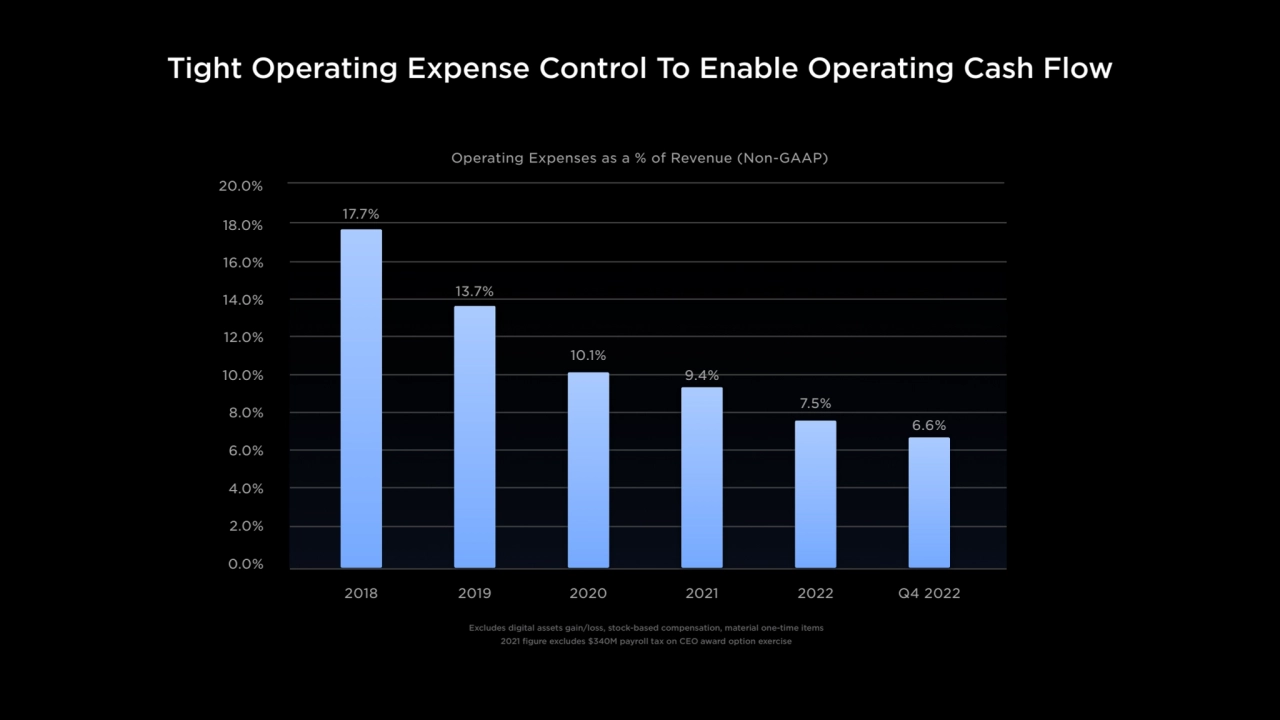
- 160. Tight Operating Expense Control To Enable Operating Cash Flow Operating Expenses as a % of Revenue (Non-GAAP) 2018 2019 2020 2021 2022 Q4 2022 0.0% 2.0% 4.0% 6.0% 8.0% 10.0% 12.0% 14.0% 16.0% 18.0% 20.0% 17.7% 13.7% 6.6% 7.5% 9.4% 10.1% Excludes digital assets gain/loss, stock-based compensation, material one-time items 2021 figure excludes $340M payroll tax on CEO award option exercise
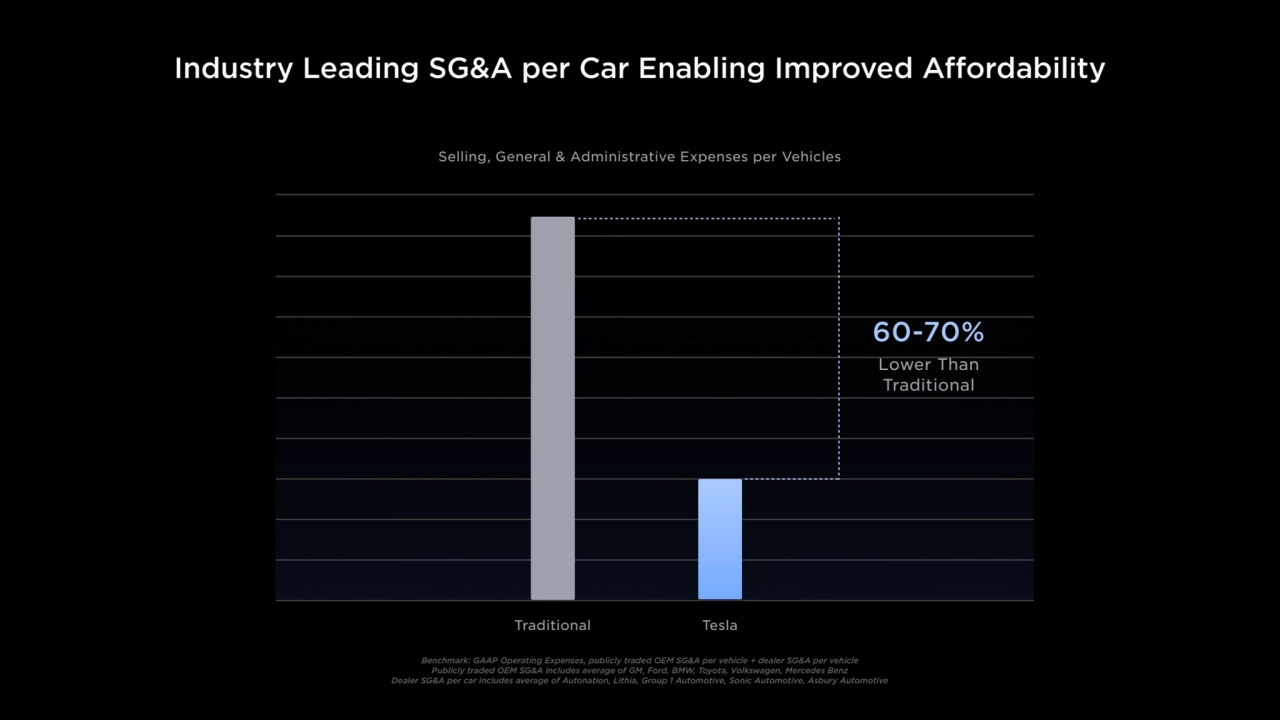
- 161. Industry Leading SG&A per Car Enabling Improved Affordability Traditional Tesla Selling, General & Administrative Expenses per Vehicles 60-70% Lower Than Traditional Benchmark: GAAP Operating Expenses, publicly traded OEM SG&A per vehicle + dealer SG&A per vehicle Publicly traded OEM SG&A includes average of GM, Ford, BMW, Toyota, Volkswagen, Mercedes Benz Dealer SG&A per car includes average of Autonation, Lithia, Group 1 Automotive, Sonic Automotive, Asbury Automotive
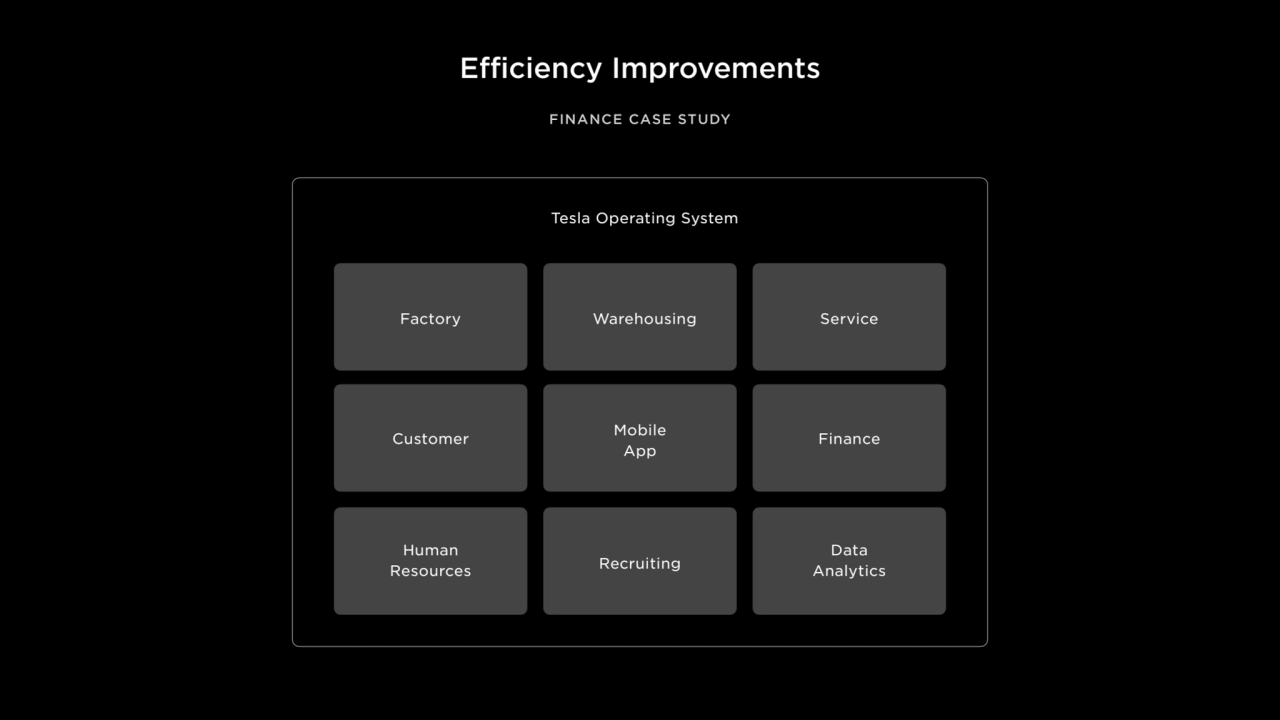
- 162. Efficiency Improvements FINANCE CASE STUDY Factory Warehousing Service Customer Mobile App Finance Human Resources Recruiting Data Analytics Tesla Operating System
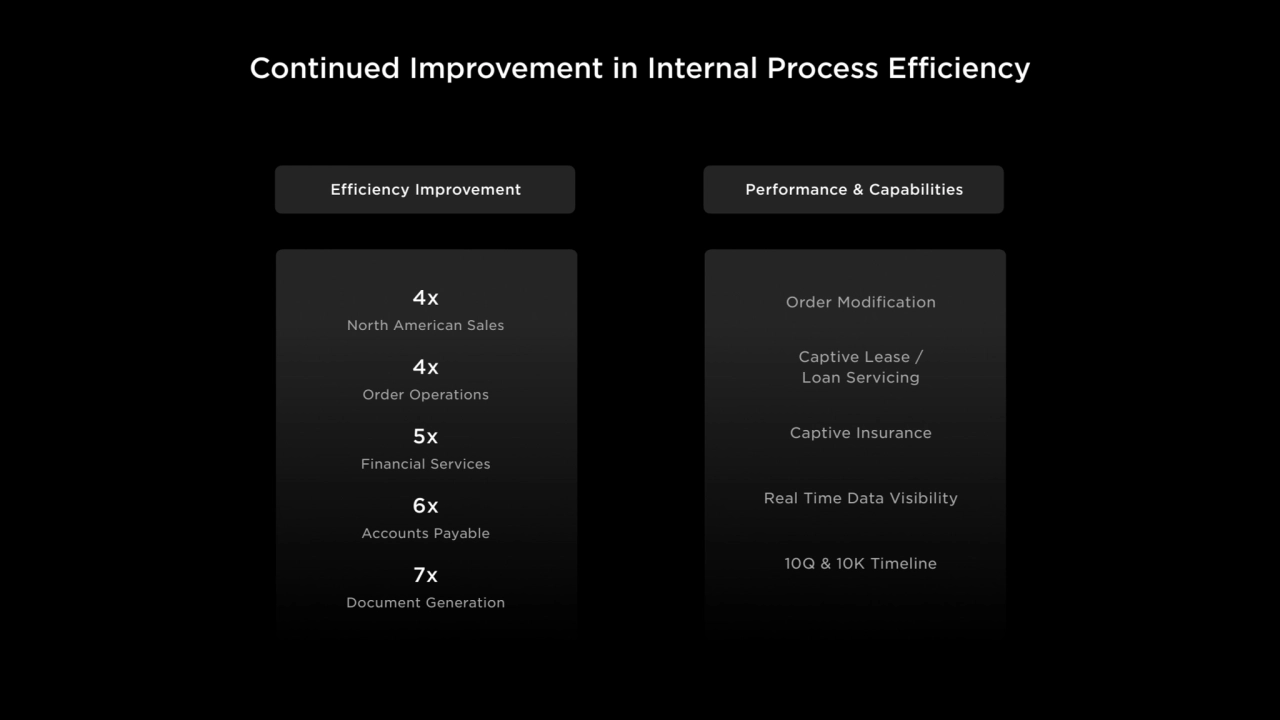
- 163. Continued Improvement in Internal Process Efficiency Efficiency Improvement Performance & Capabilities Order Modification Captive Lease / Loan Servicing Captive Insurance Real Time Data Visibility 10Q & 10K Timeline North American Sales 4x Order Operations 4x Financial Services 5x Accounts Payable 6x Document Generation 7x
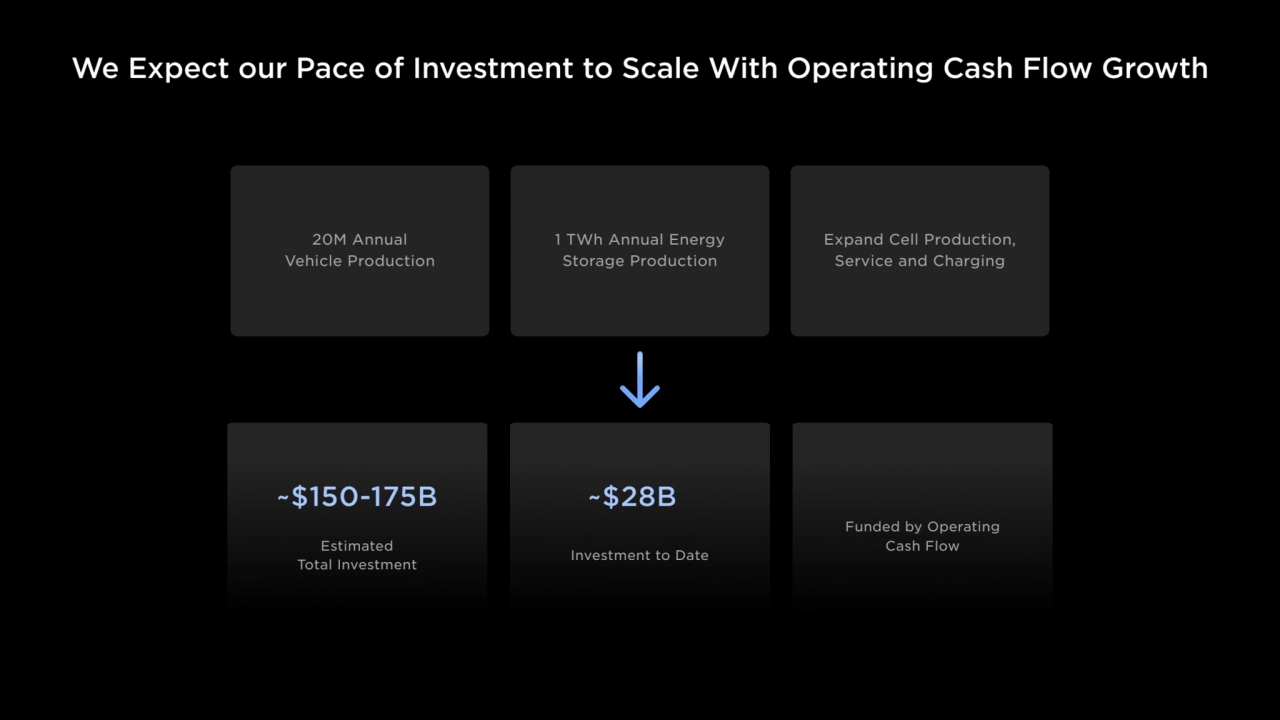
- 164. We Expect our Pace of Investment to Scale With Operating Cash Flow Growth 1 TWh Annual Energy Storage Production Estimated Total Investment Investment to Date Funded by Operating Cash Flow ~$150-175B ~$28B 20M Annual Vehicle Production Expand Cell Production, Service and Charging
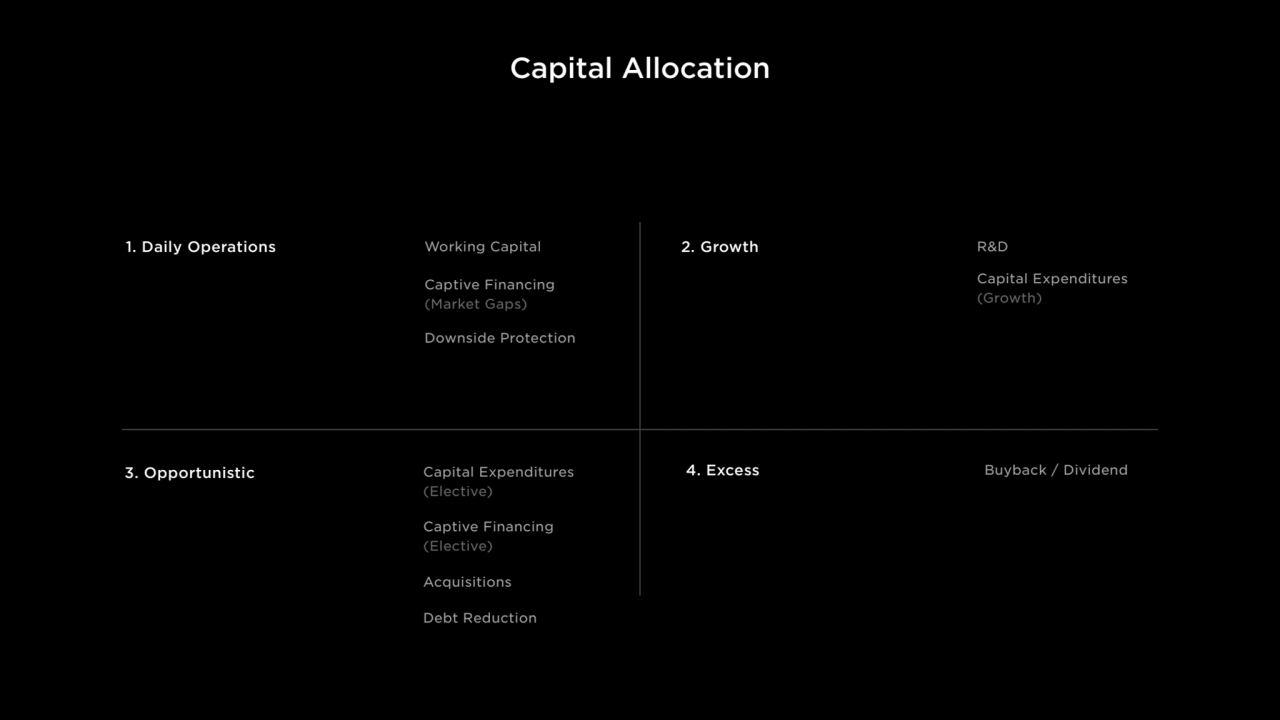
- 165. Capital Allocation 1. Daily Operations 2. Growth 3. Opportunistic 4. Excess Working Capital Captive Financing (Market Gaps) Downside Protection R&D Capital Expenditures (Growth) Capital Expenditures (Elective) Captive Financing (Elective) Acquisitions Debt Reduction Buyback / Dividend
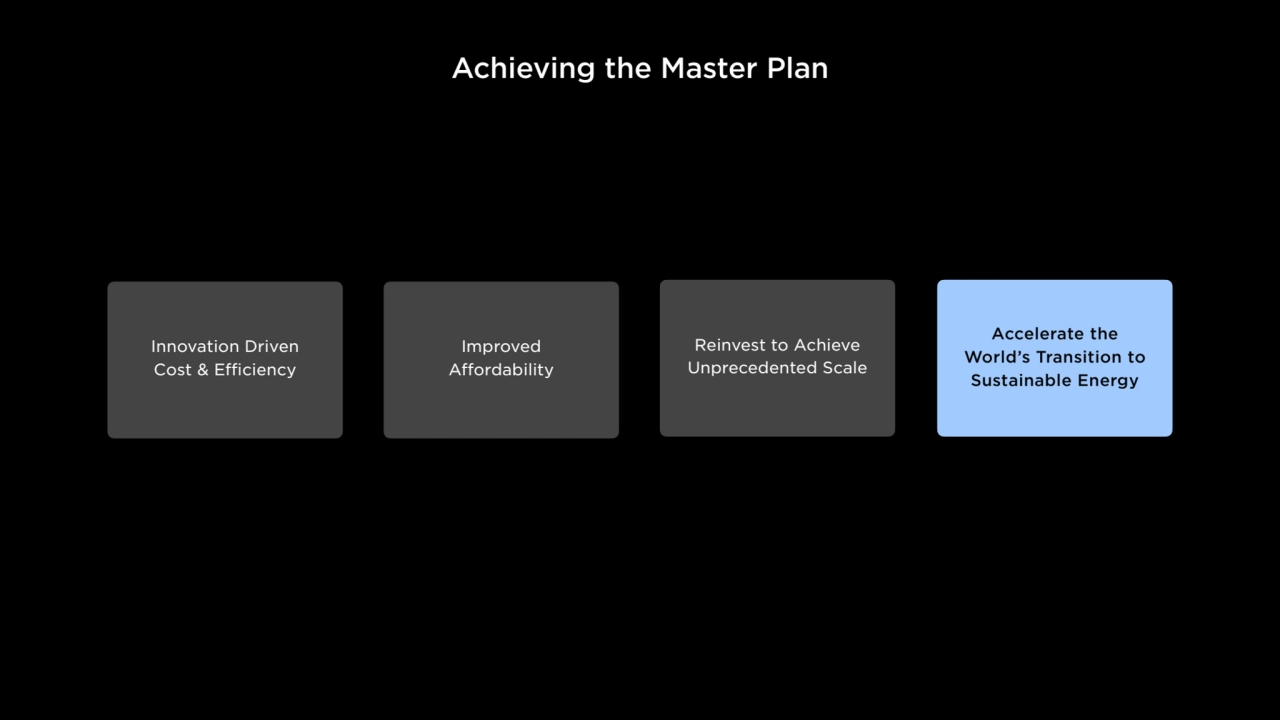
- 166. Accelerate the World’s Transition to Sustainable Energy Reinvest to Achieve Unprecedented Scale Improved Affordability Innovation Driven Cost & Efficiency Achieving the Master Plan
- 167. Gigafactory Mexico MANUFACTURING NEXT GEN VEHICLE
- 168. Q&A