Tripadvisor: Q2 FY 2025 Investor Update
 AI Summary
Key Insights
- [object Object]
- [object Object]
- [object Object]
- [object Object]
- [object Object]


![Trip planning the core pillar of engagement
Product, data and technology are enablers of our strategy
Brand
Drive more member
benefits
Differentiated app
experience
Fuel diverse
monetization paths
through seamless
bookings
Deliver world-class
guidance through
authentic traveler
content
Deepen engagement by
empowering travelers
with planning products
Expand our two-track
marketplace model
• Accelerate experiences
• Hotel and other partners
• Guidance-led experience
• Booking capabilities
• Rewarding most engaged travelers
• Ability to earn and redeem rewards
across bookings
[Brand]
We’re almost there! One
moment while we transfer
you to [Brand] to review
your selections and
complete your purchase
17](https://d2z384uprhdr6y.cloudfront.net/RzCx5_G10GWlGsuq0O6kwGRzcAtuotSg5CF81kRPVjA/rt:fill/q:100/w:1280/h:0/gravity:sm/czM6Ly9qYXVudC1wcm9kdWN0aW9uLXVwbG9hZHMvMjAyNS8wOC8xMi80MjdmMDQ3OC0xZDc3LTRmMGQtYjFiMy1hYmI3OWYxOTEwNTcvc2xpZGVfMTctbC53ZWJw.webp)

Tripadvisor: Q2 FY 2025 Investor Update
- 1. Tripadvisor Q2 FY 2025 Investor Presentation August 2025
- 2. Safe Harbor Statement Forward-Looking Statements. Our presentation today, including the slides contained herein, contains "forward-looking statements" within the meaning of the Private Securities Litigation Reform Act of 1995. These statements are not historical facts or guarantees of future performance and are based on management's assumptions and expectations, which are inherently subject to difficult to predict uncertainties, risks and changes in circumstances. The use of words such as "intends,” “expects,” “may,” “believes,” “should,” “seeks,” “intends,” “plans,” “potential,” “will,” “projects,” “estimates,” “anticipates,” or similar expressions generally identify forward-looking statements. However, these words are not the exclusive means of identifying such statements, and any statements that refer to expectations, beliefs, plans, predictions, projections, forecasts, objectives, assumptions, models, illustrations, profiles or other characterizations of future events or circumstances are forward-looking statements, including without limitation statements relating to future revenues, expenses, margins, performance, profitability, cash flows, net income/(loss), earnings per share, growth rates and other measures of results of operations (such as adjusted EBITDA) and future growth prospects for Tripadvisor’s business. Actual results and the timing and outcome of events may differ materially from those expressed or implied in the forward-looking statements for a variety of reasons, including, among others, those discussed in the “Risk Factors” section of our Annual Report on Form 10-K. Except as required by law, we undertake no obligation to update any forward-looking or other statements in this presentation, whether as a result of new information, future events or otherwise. Investors are cautioned not to place undue reliance on forward-looking statements. Non-GAAP Measures. This presentation also includes discussion of both GAAP and non-GAAP financial measures. Important information regarding Tripadvisor’s definitions and use of these measures, as well as reconciliations of the non-GAAP financial measure to the most directly comparable GAAP financial measure are included in the earnings release reporting our second quarter 2025 financial results, which are available on the Investor Relations section of our website at ir.tripadvisor.com, and in the “Appendix” section of this document. These non-GAAP measures are intended to supplement, and are not a substitute for comparable GAAP measures. Investors are urged to consider carefully the comparable GAAP measures and reconciliations. Industry / Market Data. Industry and market data used in this presentation have been obtained from industry publications and sources as well as from research reports prepared for other purposes. We have not independently verified the data obtained from these sources and cannot assure you of the data’s accuracy or completeness. 2
- 3. The world’s most trusted source for travel and experiences
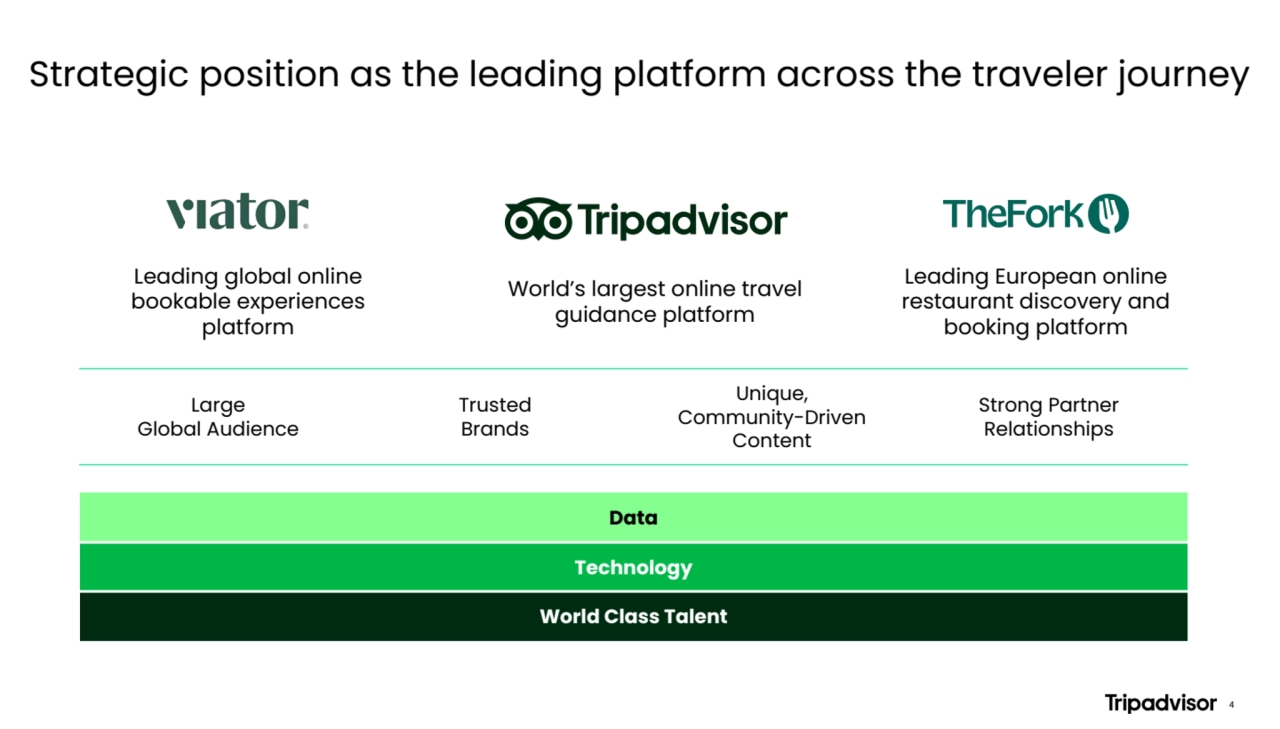
- 4. Leading global online bookable experiences platform Strategic position as the leading platform across the traveler journey World’s largest online travel guidance platform Leading European online restaurant discovery and booking platform Large Global Audience Trusted Brands Unique, Community-Driven Content Strong Partner Relationships Data Technology World Class Talent 4
- 5. Financial Highlights
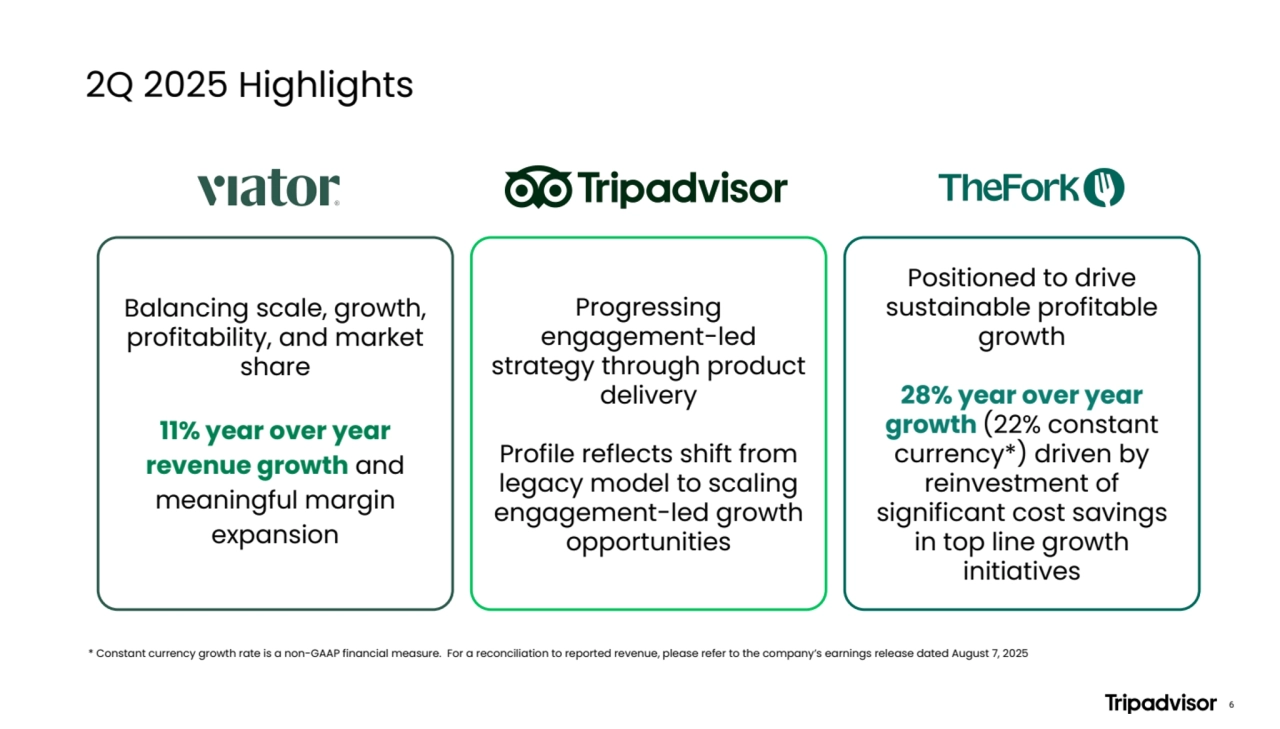
- 6. 2Q 2025 Highlights * Constant currency growth rate is a non-GAAP financial measure. For a reconciliation to reported revenue, please refer to the company’s earnings release dated August 7, 2025 6 Progressing engagement-led strategy through product delivery Profile reflects shift from legacy model to scaling engagement-led growth opportunities Balancing scale, growth, profitability, and market share 11% year over year revenue growth and meaningful margin expansion Positioned to drive sustainable profitable growth 28% year over year growth (22% constant currency*) driven by reinvestment of significant cost savings in top line growth initiatives
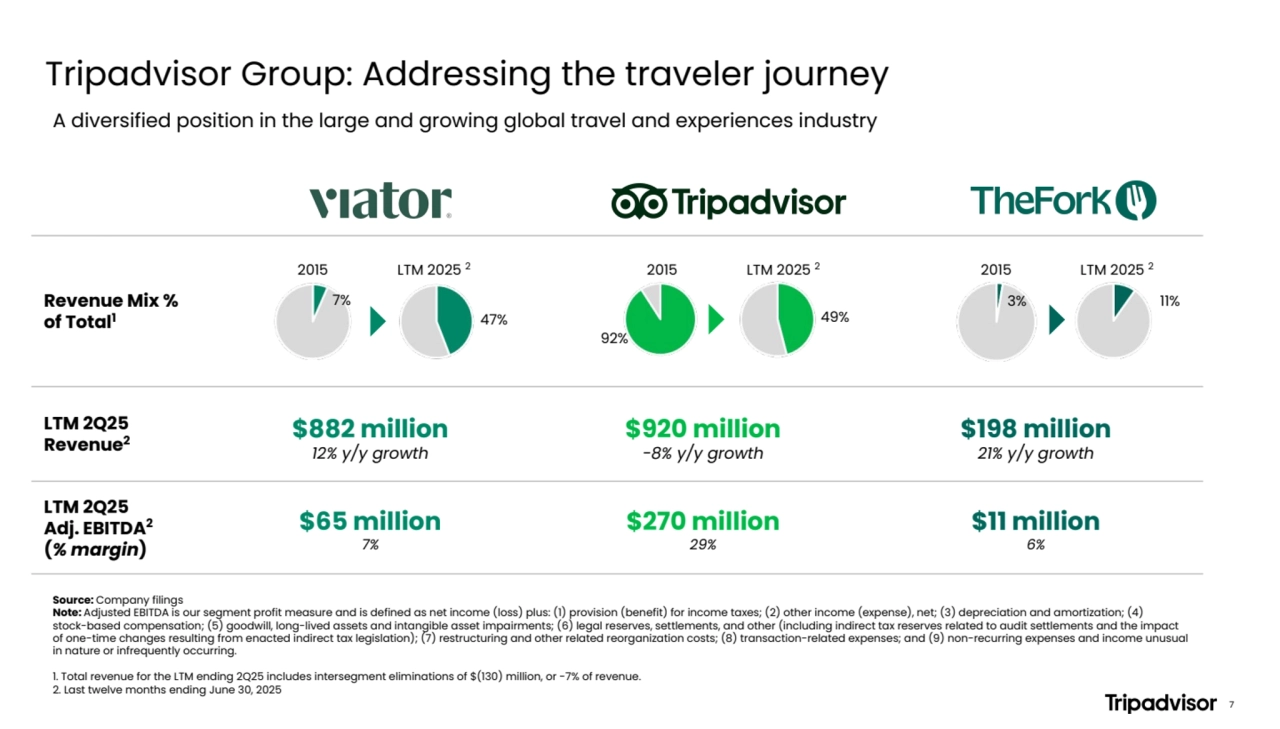
- 7. Revenue Mix % of Total1 LTM 2Q25 Revenue2 $882 million 12% y/y growth $920 million -8% y/y growth $198 million 21% y/y growth LTM 2Q25 Adj. EBITDA2 (% margin) $65 million 7% $270 million 29% $11 million 6% Tripadvisor Group: Addressing the traveler journey Source: Company filings Note: Adjusted EBITDA is our segment profit measure and is defined as net income (loss) plus: (1) provision (benefit) for income taxes; (2) other income (expense), net; (3) depreciation and amortization; (4) stock-based compensation; (5) goodwill, long-lived assets and intangible asset impairments; (6) legal reserves, settlements, and other (including indirect tax reserves related to audit settlements and the impact of one-time changes resulting from enacted indirect tax legislation); (7) restructuring and other related reorganization costs; (8) transaction-related expenses; and (9) non-recurring expenses and income unusual in nature or infrequently occurring. 1. Total revenue for the LTM ending 2Q25 includes intersegment eliminations of $(130) million, or -7% of revenue. 2. Last twelve months ending June 30, 2025 2015 3% 11% A diversified position in the large and growing global travel and experiences industry 2015 7% 47% LTM 2025 2 LTM 2025 2LTM 2025 22015 92% 49% 7
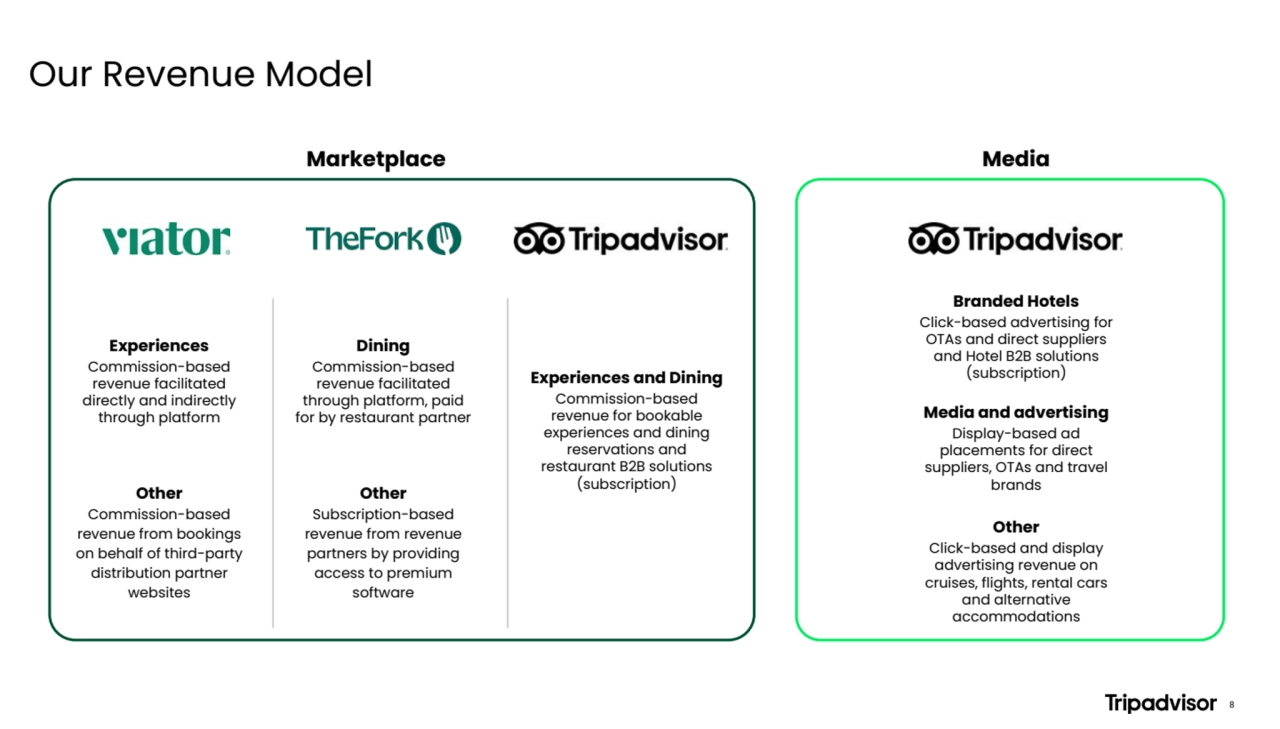
- 8. Our Revenue Model 8 Marketplace Media Experiences and Dining Commission-based revenue for bookable experiences and dining reservations and restaurant B2B solutions (subscription) Experiences Commission-based revenue facilitated directly and indirectly through platform Dining Commission-based revenue facilitated through platform, paid for by restaurant partner Other Commission-based revenue from bookings on behalf of third-party distribution partner websites Other Subscription-based revenue from revenue partners by providing access to premium software Branded Hotels Click-based advertising for OTAs and direct suppliers and Hotel B2B solutions (subscription) Media and advertising Display-based ad placements for direct suppliers, OTAs and travel brands Other Click-based and display advertising revenue on cruises, flights, rental cars and alternative accommodations
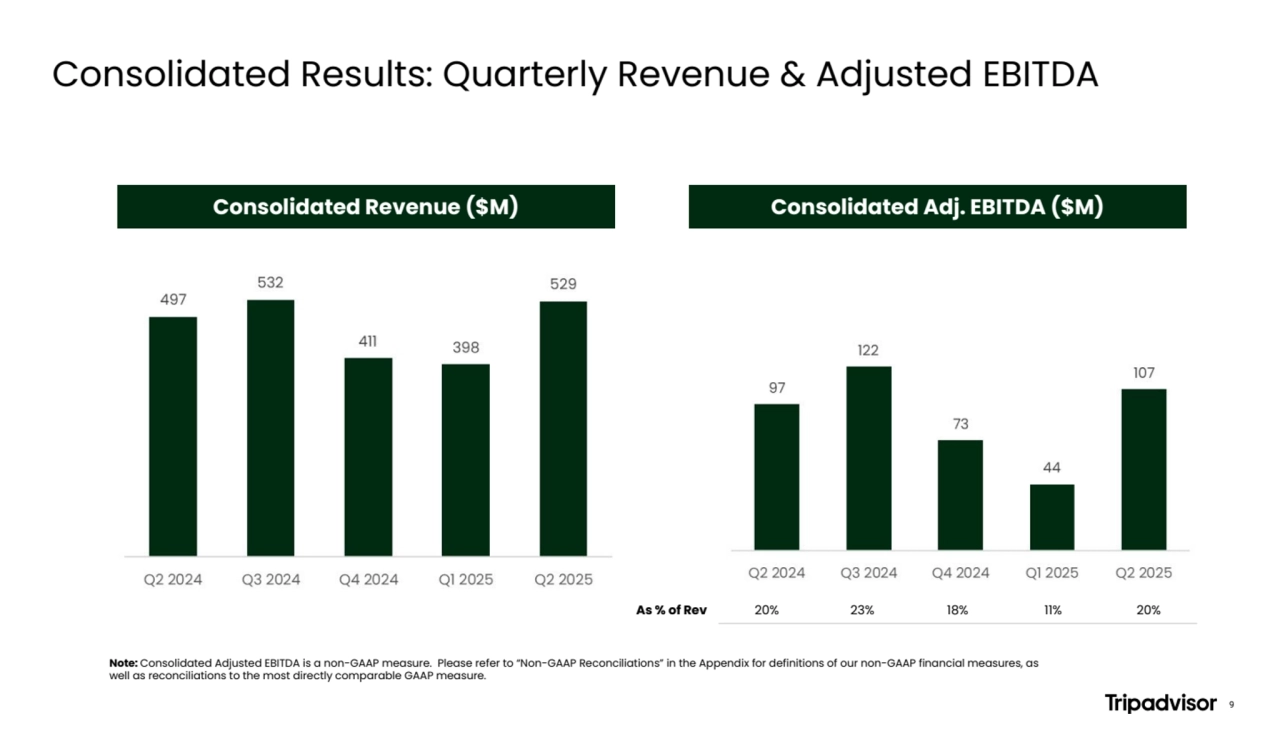
- 9. Consolidated Adj. EBITDA ($M) Consolidated Results: Quarterly Revenue & Adjusted EBITDA As % of Rev 20% 23% 18% 11% 20% Consolidated Revenue ($M) Note: Consolidated Adjusted EBITDA is a non-GAAP measure. Please refer to “Non-GAAP Reconciliations” in the Appendix for definitions of our non-GAAP financial measures, as well as reconciliations to the most directly comparable GAAP measure. 9
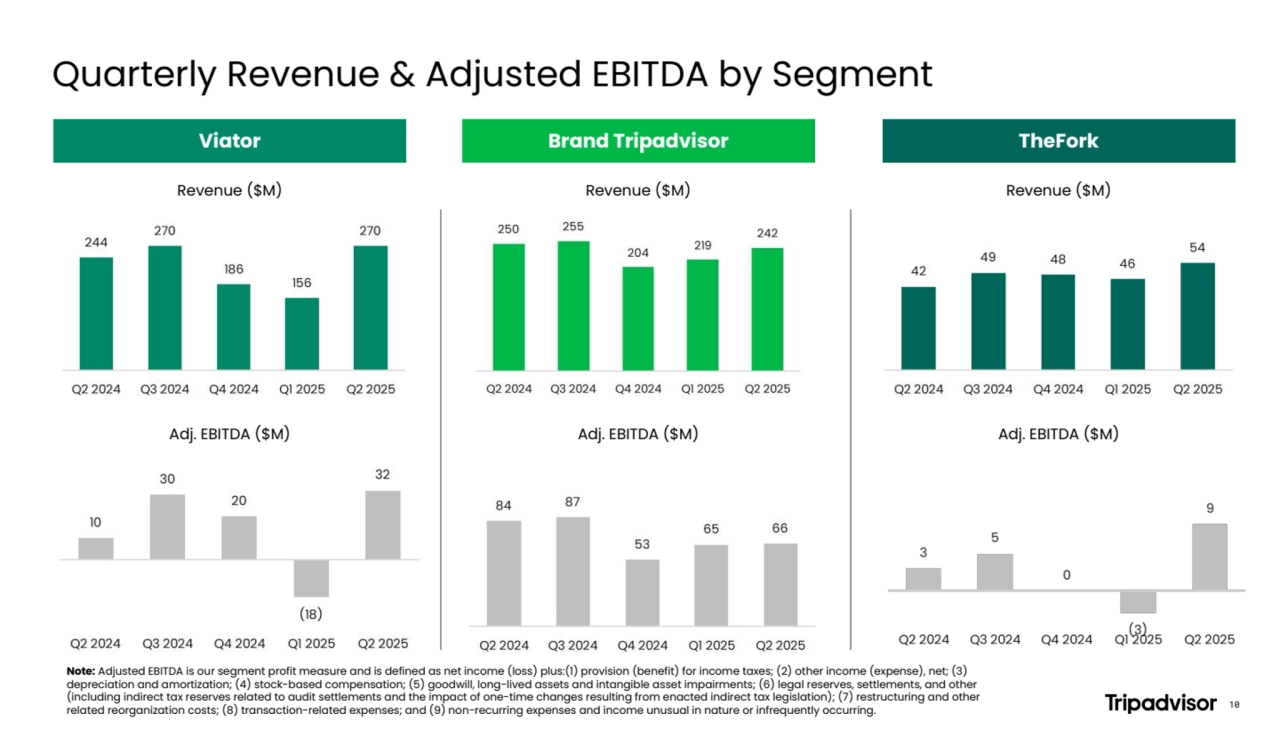
- 10. Quarterly Revenue & Adjusted EBITDA by Segment TheFork Revenue ($M) Adj. EBITDA ($M) Note: Adjusted EBITDA is our segment profit measure and is defined as net income (loss) plus:(1) provision (benefit) for income taxes; (2) other income (expense), net; (3) depreciation and amortization; (4) stock-based compensation; (5) goodwill, long-lived assets and intangible asset impairments; (6) legal reserves, settlements, and other (including indirect tax reserves related to audit settlements and the impact of one-time changes resulting from enacted indirect tax legislation); (7) restructuring and other related reorganization costs; (8) transaction-related expenses; and (9) non-recurring expenses and income unusual in nature or infrequently occurring. 10 Brand Tripadvisor Revenue ($M) Adj. EBITDA ($M) Viator Revenue ($M) Adj. EBITDA ($M)
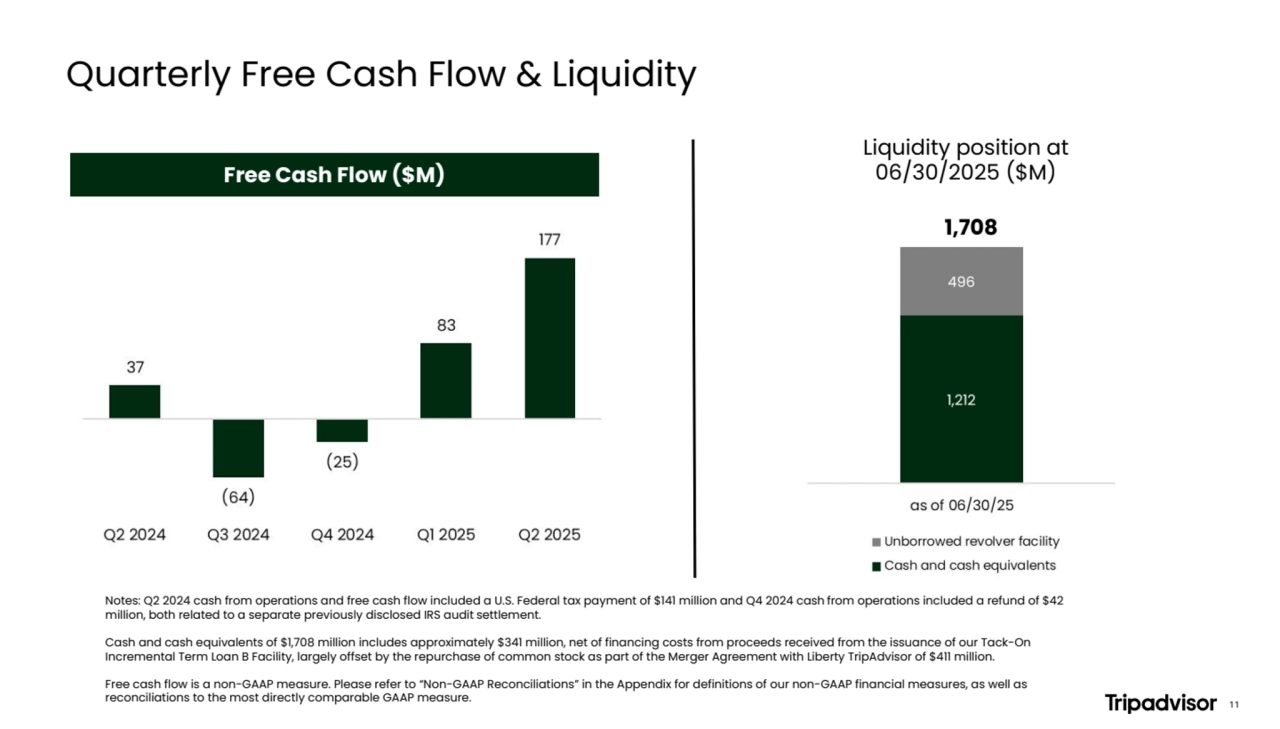
- 11. Quarterly Free Cash Flow & Liquidity Liquidity position at 06/30/2025 ($M) 1,708 Notes: Q2 2024 cash from operations and free cash flow included a U.S. Federal tax payment of $141 million and Q4 2024 cash from operations included a refund of $42 million, both related to a separate previously disclosed IRS audit settlement. Cash and cash equivalents of $1,708 million includes approximately $341 million, net of financing costs from proceeds received from the issuance of our Tack-On Incremental Term Loan B Facility, largely offset by the repurchase of common stock as part of the Merger Agreement with Liberty TripAdvisor of $411 million. Free cash flow is a non-GAAP measure. Please refer to “Non-GAAP Reconciliations” in the Appendix for definitions of our non-GAAP financial measures, as well as reconciliations to the most directly comparable GAAP measure. Free Cash Flow ($M) 11
- 12. Segment Level Overview
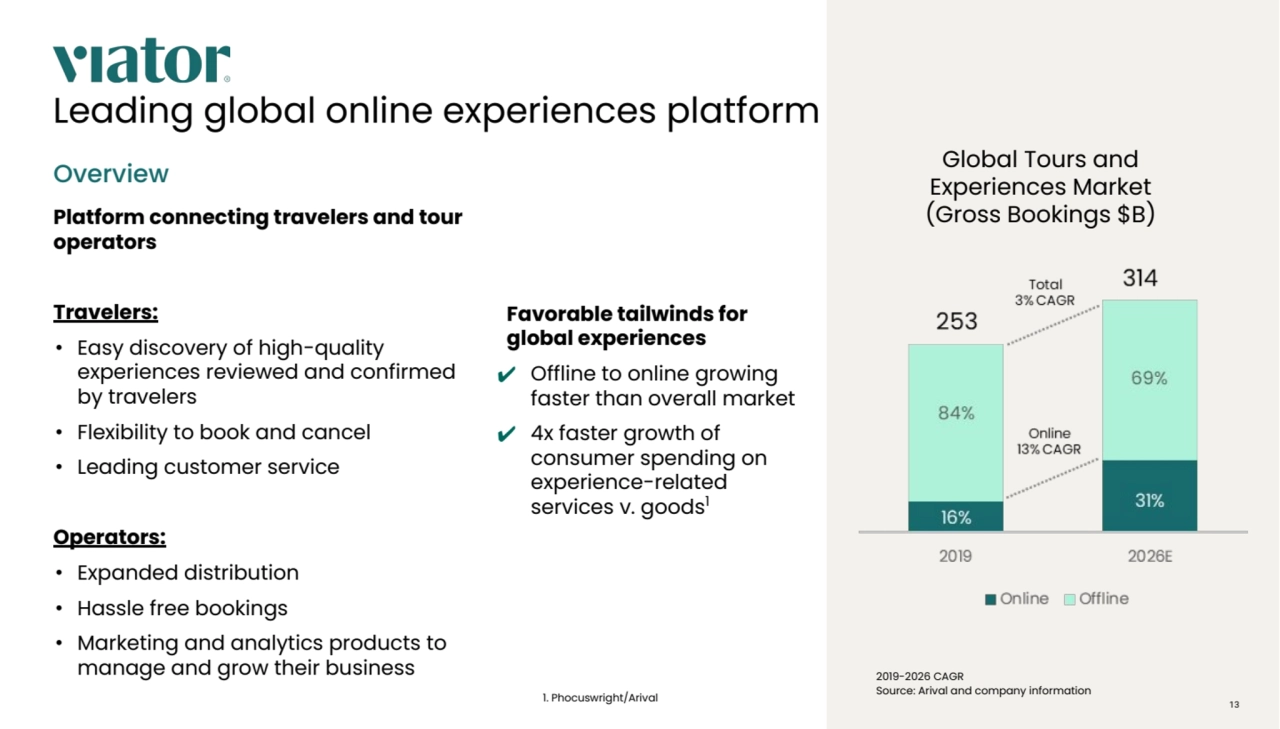
- 13. Overview Platform connecting travelers and tour operators Travelers: • Easy discovery of high-quality experiences reviewed and confirmed by travelers • Flexibility to book and cancel • Leading customer service Operators: • Expanded distribution • Hassle free bookings • Marketing and analytics products to manage and grow their business Leading global online experiences platform Favorable tailwinds for global experiences ✔ Offline to online growing faster than overall market ✔ 4x faster growth of consumer spending on experience-related services v. goods1 1. Phocuswright/Arival Global Tours and Experiences Market (Gross Bookings $B) 2019-2026 CAGR Source: Arival and company information 13
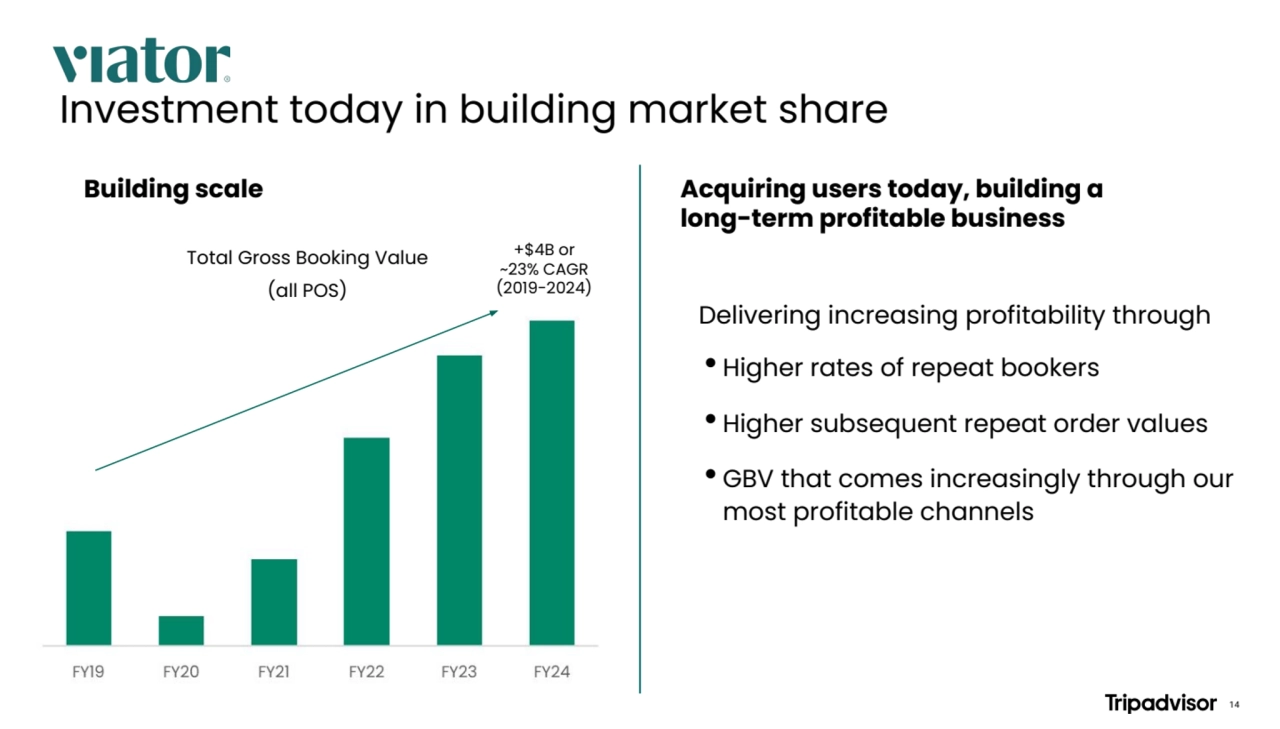
- 14. Investment today in building market share Building scale Delivering increasing profitability through • Higher rates of repeat bookers • Higher subsequent repeat order values • GBV that comes increasingly through our most profitable channels Total Gross Booking Value (all POS) +$4B or ~23% CAGR (2019-2024) Acquiring users today, building a long-term profitable business 14
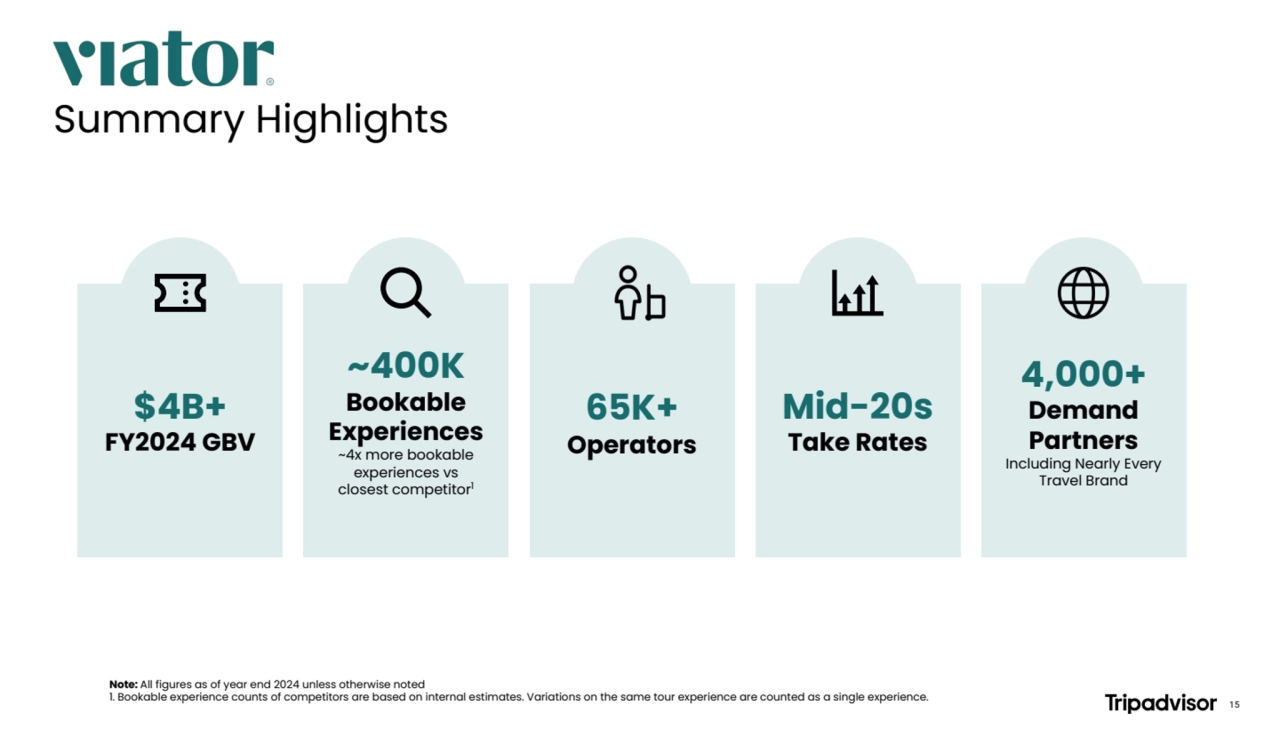
- 15. $4B+ FY2024 GBV ~400K Bookable Experiences ~4x more bookable experiences vs closest competitor1 65K+ Operators Mid-20s Take Rates 4,000+ Demand Partners Including Nearly Every Travel Brand Note: All figures as of year end 2024 unless otherwise noted 1. Bookable experience counts of competitors are based on internal estimates. Variations on the same tour experience are counted as a single experience. Summary Highlights 15
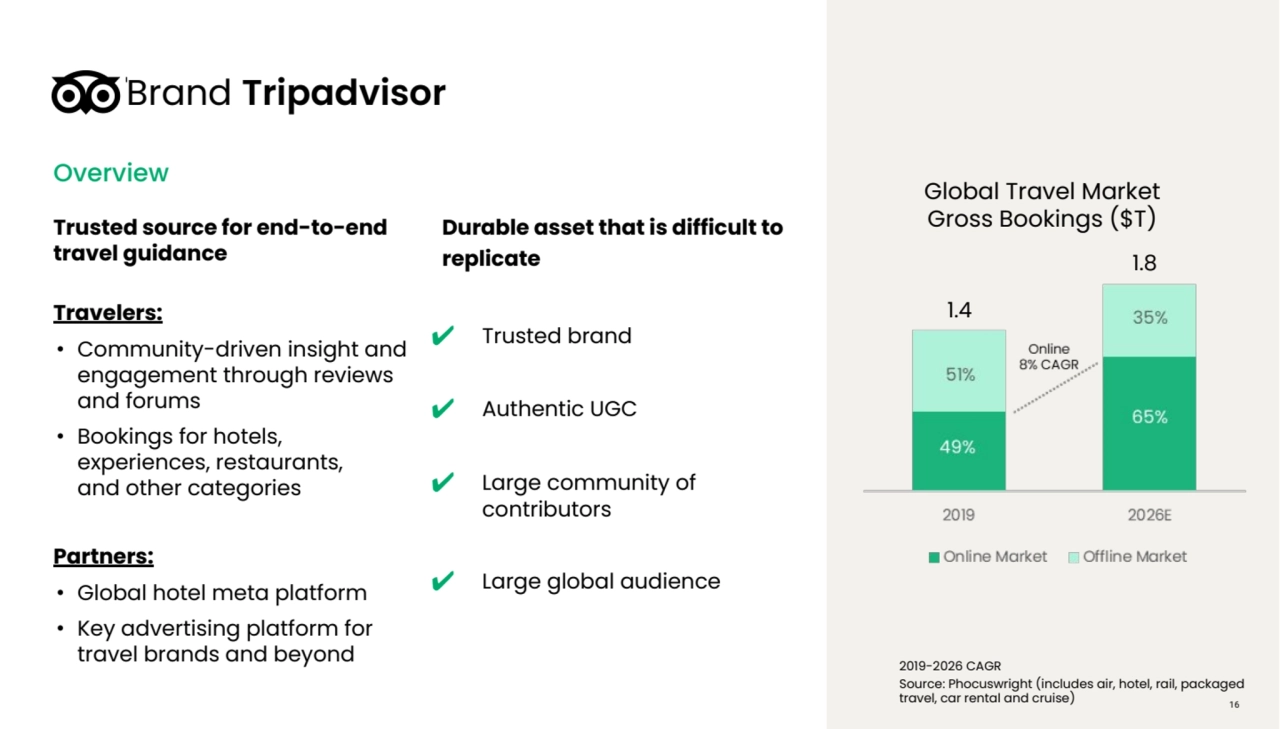
- 16. Brand Tripadvisor Trusted source for end-to-end travel guidance Travelers: • Community-driven insight and engagement through reviews and forums • Bookings for hotels, experiences, restaurants, and other categories Partners: • Global hotel meta platform • Key advertising platform for travel brands and beyond Overview Durable asset that is difficult to replicate ✔ Trusted brand ✔ Authentic UGC ✔ Large community of contributors ✔ Large global audience 2019-2026 CAGR Source: Phocuswright (includes air, hotel, rail, packaged travel, car rental and cruise) Global Travel Market Gross Bookings ($T) 1.4 1.8 16
- 17. Trip planning the core pillar of engagement Product, data and technology are enablers of our strategy Brand Drive more member benefits Differentiated app experience Fuel diverse monetization paths through seamless bookings Deliver world-class guidance through authentic traveler content Deepen engagement by empowering travelers with planning products Expand our two-track marketplace model • Accelerate experiences • Hotel and other partners • Guidance-led experience • Booking capabilities • Rewarding most engaged travelers • Ability to earn and redeem rewards across bookings [Brand] We’re almost there! One moment while we transfer you to [Brand] to review your selections and complete your purchase 17
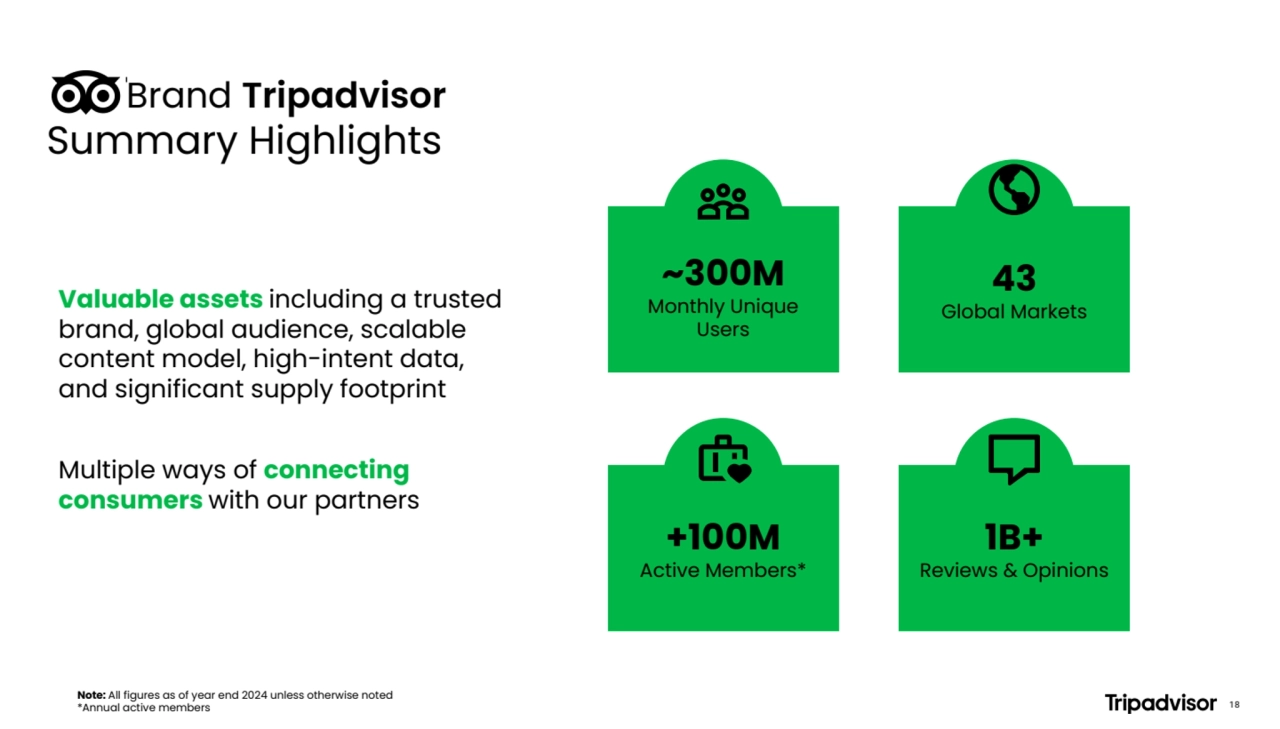
- 18. Note: All figures as of year end 2024 unless otherwise noted *Annual active members Summary Highlights Valuable assets including a trusted brand, global audience, scalable content model, high-intent data, and significant supply footprint Multiple ways of connecting consumers with our partners ~300M Monthly Unique Users +100M Active Members* 1B+ Reviews & Opinions Brand Tripadvisor 18 43 Global Markets
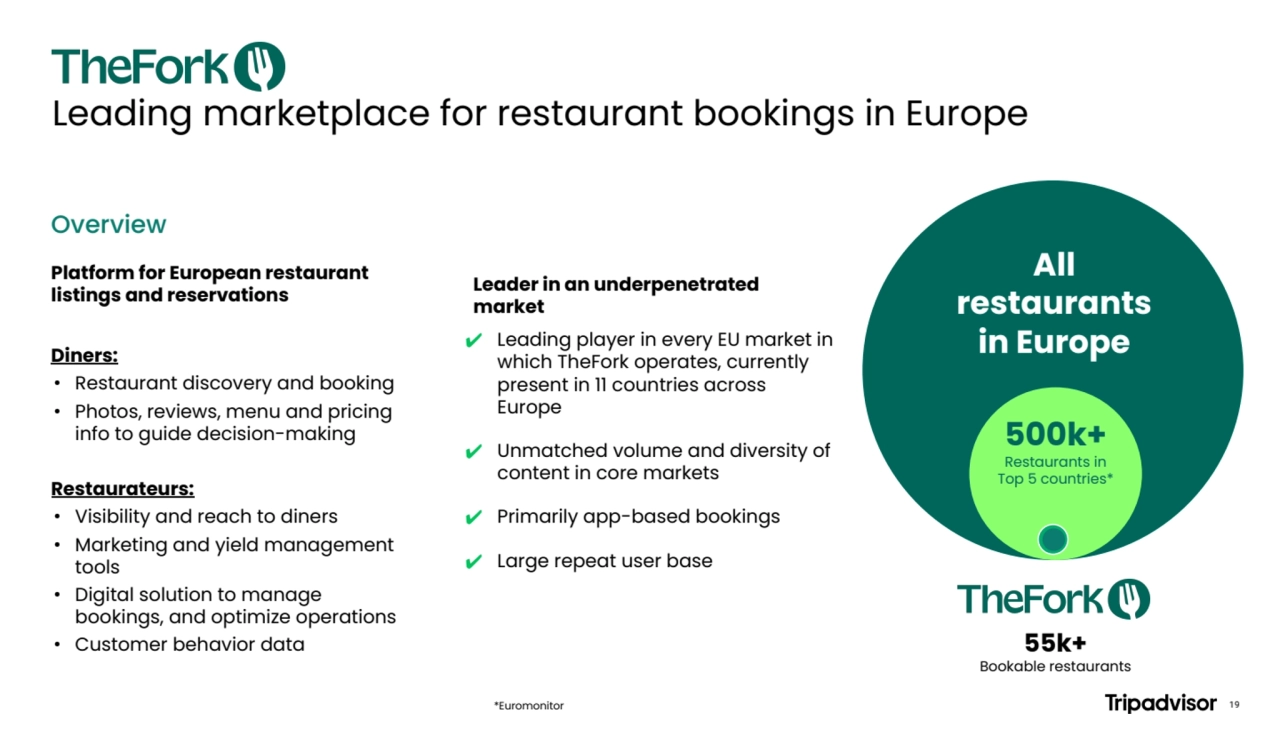
- 19. Overview Platform for European restaurant listings and reservations Diners: • Restaurant discovery and booking • Photos, reviews, menu and pricing info to guide decision-making Restaurateurs: • Visibility and reach to diners • Marketing and yield management tools • Digital solution to manage bookings, and optimize operations • Customer behavior data Leading marketplace for restaurant bookings in Europe 500k+ Restaurants in Top 5 countries* All restaurants in Europe 55k+ Bookable restaurants Leader in an underpenetrated market ✔ Leading player in every EU market in which TheFork operates, currently present in 11 countries across Europe ✔ Unmatched volume and diversity of content in core markets ✔ Primarily app-based bookings ✔ Large repeat user base *Euromonitor 19
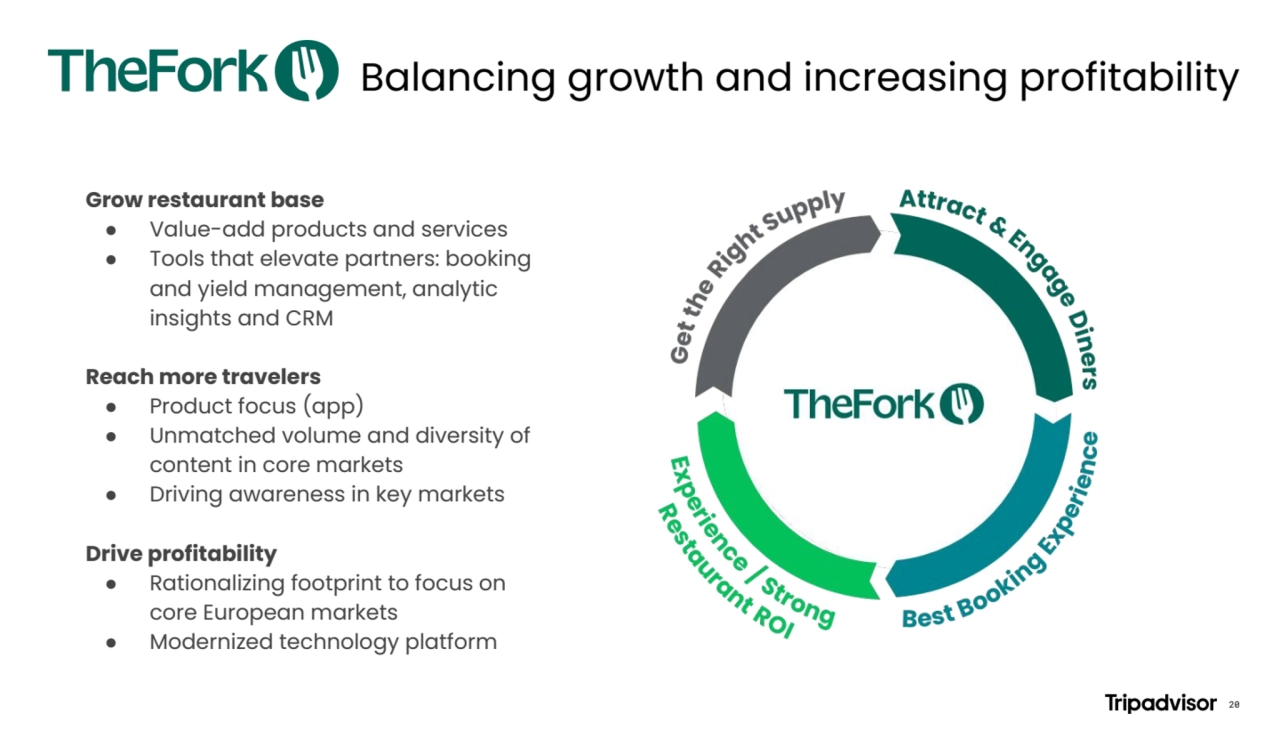
- 20. Balancing growth and increasing profitability Grow restaurant base ● Value-add products and services ● Tools that elevate partners: booking and yield management, analytic insights and CRM Reach more travelers ● Product focus (app) ● Unmatched volume and diversity of content in core markets ● Driving awareness in key markets Drive profitability ● Rationalizing footprint to focus on core European markets ● Modernized technology platform 20
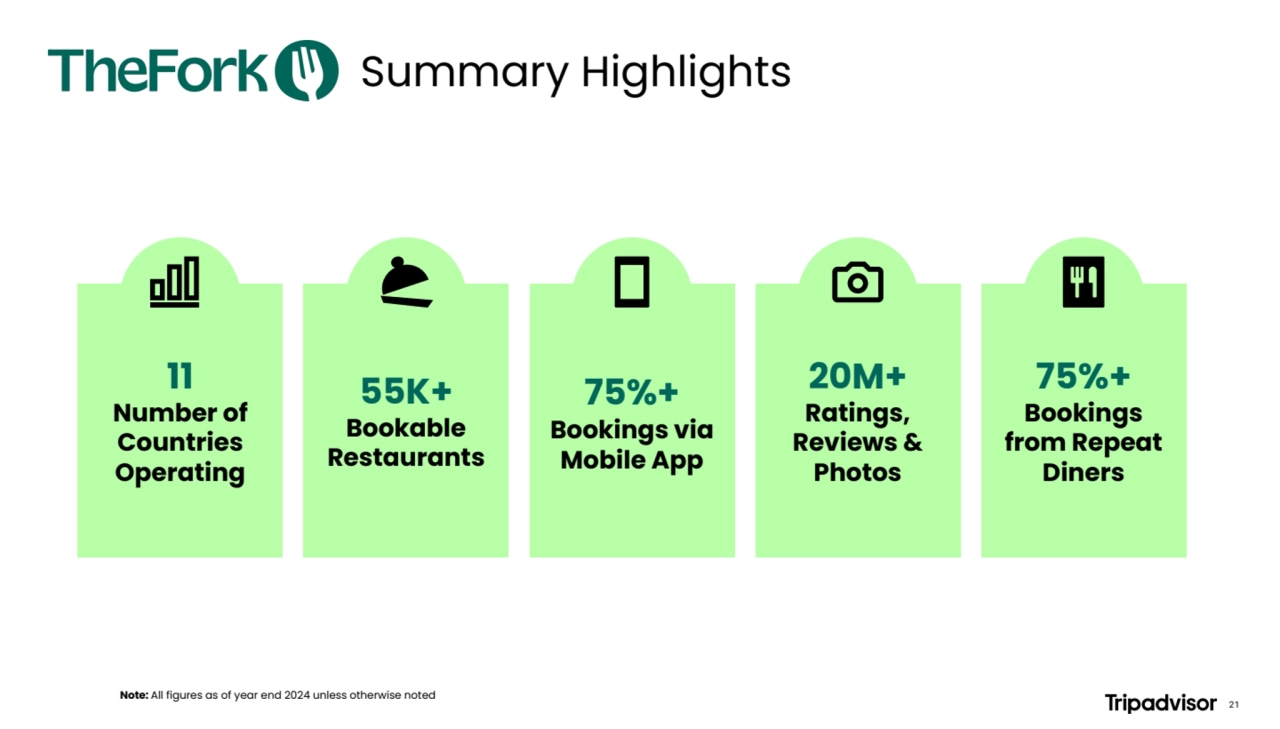
- 21. Summary Highlights Note: All figures as of year end 2024 unless otherwise noted 11 Number of Countries Operating 55K+ Bookable Restaurants 20M+ Ratings, Reviews & Photos 75%+ Bookings via Mobile App 75%+ Bookings from Repeat Diners 21
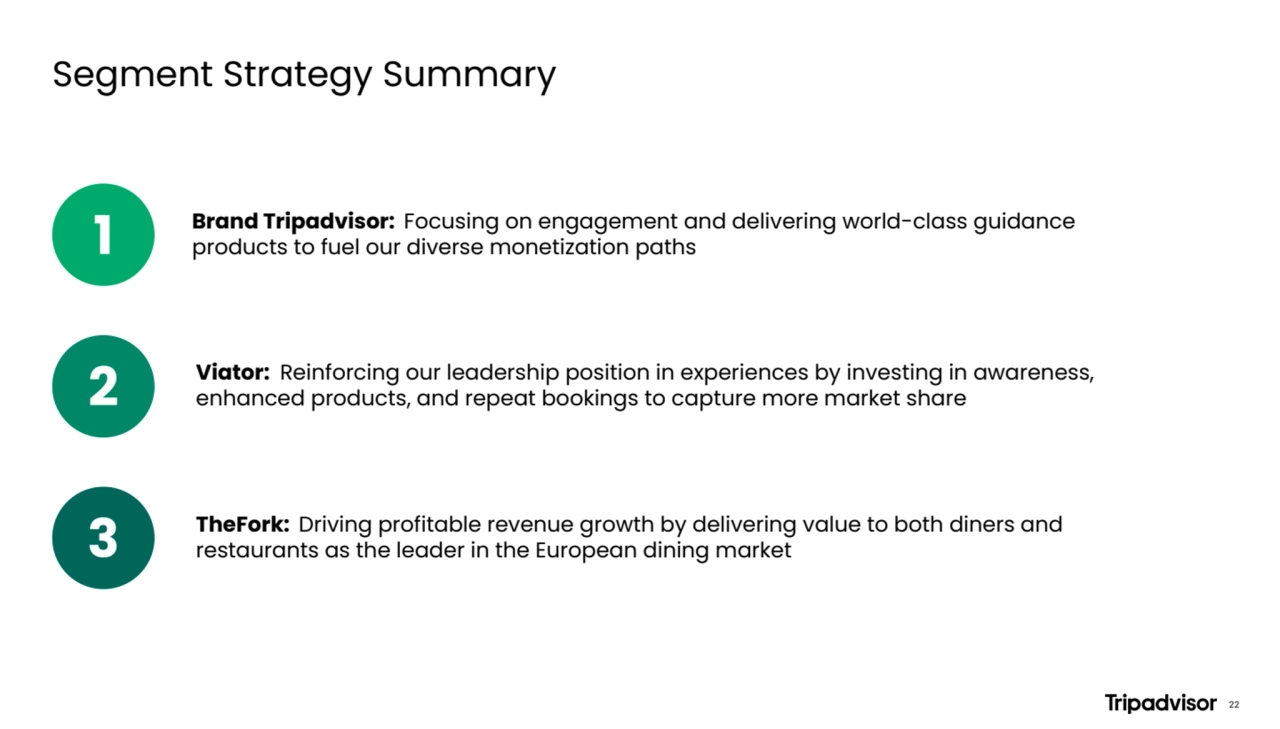
- 22. Segment Strategy Summary 1 2 3 Brand Tripadvisor: Focusing on engagement and delivering world-class guidance products to fuel our diverse monetization paths Viator: Reinforcing our leadership position in experiences by investing in awareness, enhanced products, and repeat bookings to capture more market share TheFork: Driving profitable revenue growth by delivering value to both diners and restaurants as the leader in the European dining market 22
- 23. Thank You
- 24. Appendix 24
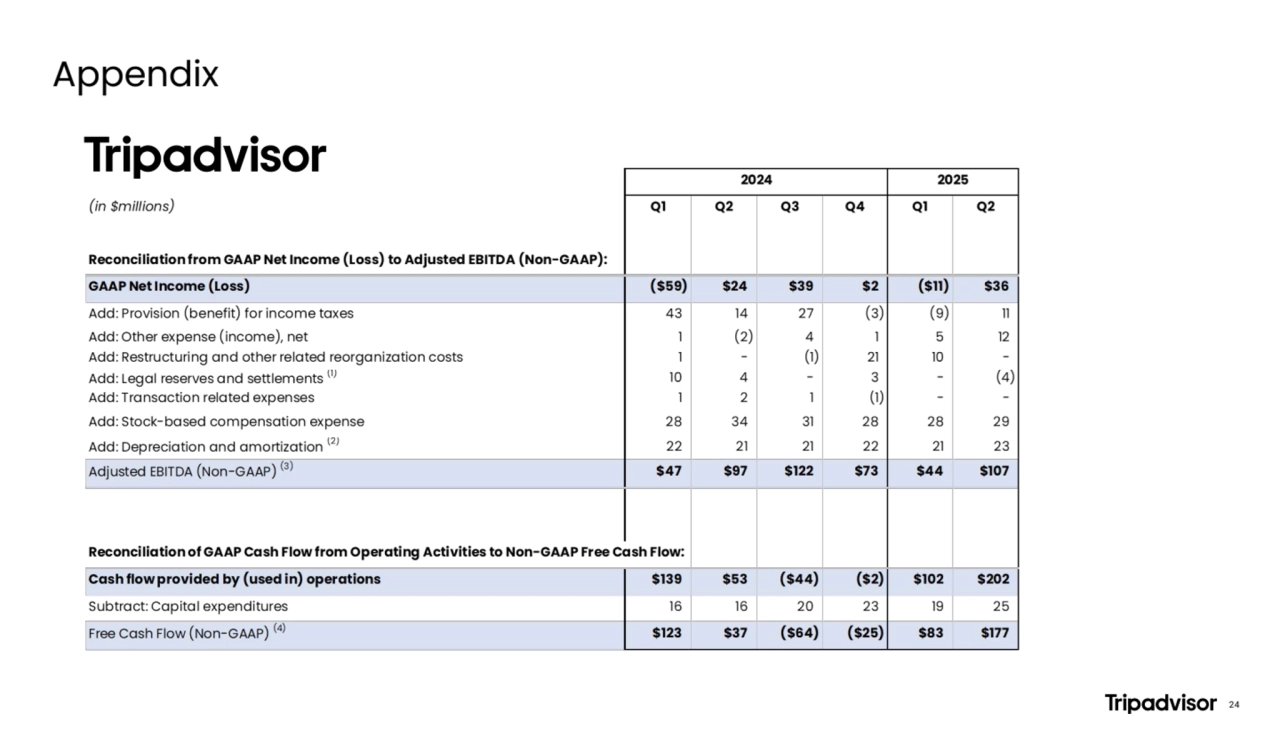
- 25. The Company believes that non-GAAP financial measures provide investors with useful supplemental information about the financial performance of our business, enables comparison of financial results between periods where certain items may vary independent of business performance, and allow for greater transparency with respect to key metrics used by management in operating and analyzing our business. (1) Includes a one-time charge of $4 million during the second quarter of 2024, resulting from enacted tax legislation in Canada during June 2024 related to digital services taxes, which required retrospective application back to January 1, 2022. This amount represents the one-time retrospective liability for the periods prior to April 1, 2024, while all prospective periods are included within Adjusted EBITDA. In addition, this amount includes an estimated accrual for the potential settlement of a regulatory related matter of $10 million, expensed during the first quarter of 2024, which was reduced by $4 million during the second quarter of 2025. (2) Depreciation and amortization. Includes capitalized website development amortization. (3) Adjusted EBITDA. A non-GAAP measure which is defined as net income (loss) plus: (1) provision (benefit) for income taxes; (2) other income (expense), net; (3) depreciation and amortization; (4) stock-based compensation; (5) goodwill, intangible asset, and long-lived asset impairments; (6) legal reserves, settlements and other, including indirect tax reserves related to audit settlements and the impact of one-time changes resulting from enacted indirect tax legislation; (7) restructuring and other related reorganization costs; (8) transaction related expenses; and (9) non-recurring expenses and income unusual in nature or infrequently occurring. These items are excluded from our Adjusted EBITDA measure because these items are noncash in nature, or because the amount is not driven by core operating results and renders comparisons with prior periods less meaningful. (4) Free Cash Flow. A non-GAAP measure which is defined as net cash provided by operating activities less capital expenditures, which are purchases of property and equipment, including capitalization of website development costs. We believe this financial measure can provide useful supplemental information to help investors better understand underlying trends in our business, as it represents the operating cash flow that our operating businesses generate, less capital expenditures but before taking into account other cash movements that are not directly tied to the core operations of our businesses, such as financing activities, foreign exchange or certain investing activities. Free Cash Flow has certain limitations in that it does not represent the total increase or decrease in the cash balance for the period, nor does it represent the residual cash flow for discretionary expenditures. Therefore, it is important to evaluate Free Cash Flow along with the unaudited condensed consolidated statements of cash flows. We use the operating metric described below to assist us in measuring our operations performance, identifying trends, formulating projections and making strategic decisions for the Viator segment. We are not aware of any uniform standards for calculating this metric, which may hinder comparability with other companies that may calculate similarly titled metrics in a different way. Management believes it is useful to monitor this metric together and not individually as it does not make business decisions based upon any single metric. We regularly review our processes and may adjust how we calculate this metric to improve its accuracy. We make this key metric available to investors because we believe it is useful both because it allows for greater transparency with respect to key metrics used by management in its financial and operational decision-making, and because it may be used to help analyze the health of our business. This metric should not be considered as an alternative to any measure of financial performance calculated in accordance with GAAP. Gross Booking Value (“GBV”) represents the total dollar value of experience bookings powered by the Viator platform in a given period prior to any adjustments such as date changes, refunds or cancellations. GBV is an operational measure that provides an indication of total engagement and economic activity driven by our platform in a given period by all marketplace constituents (travelers, experience operators, and partners). Management uses GBV for operational decision-making purposes to monitor the growth, scale, and reach of its online marketplace as well as assess the health of its global ecosystem. Accordingly, management does not consider GBV to be an indicator of revenue or any other financial statement measure. Appendix 25