Twilio Q2 2025 Earnings Results
 AI Summary
Key Insights
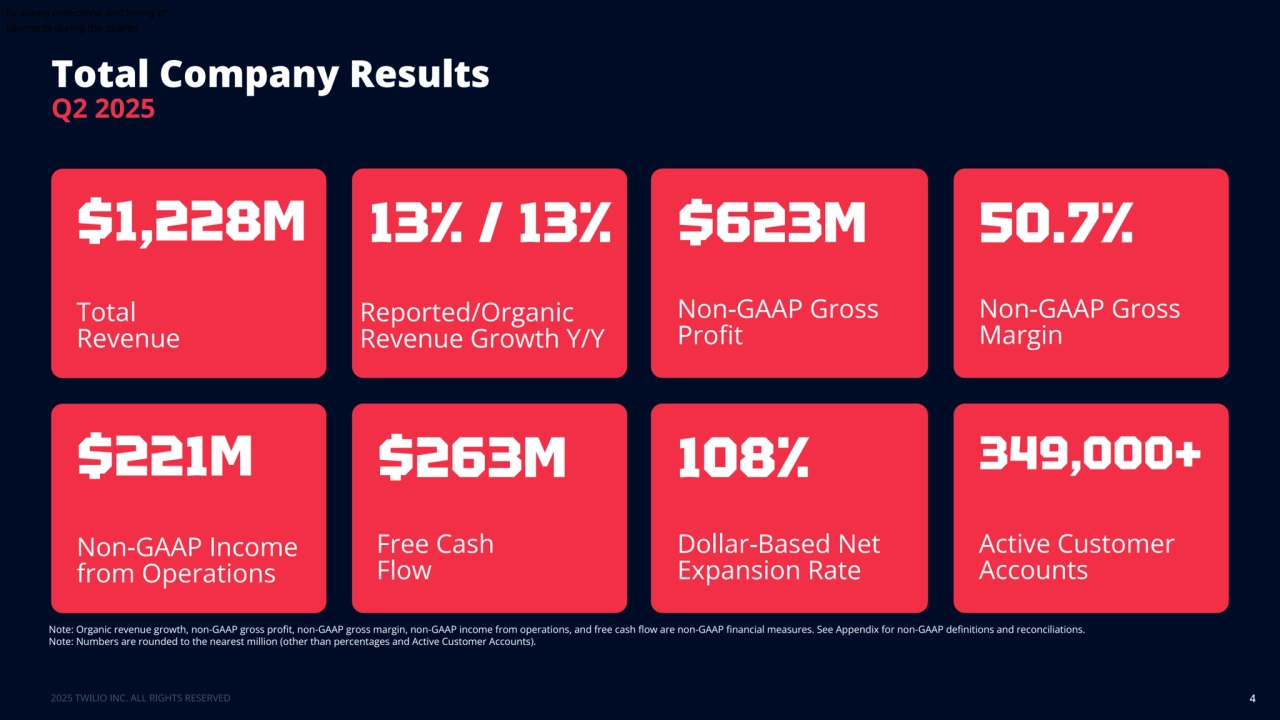
- 💰 Total Revenue and Growth: Twilio reports $1.228B in total revenue with 13% year-over-year growth.
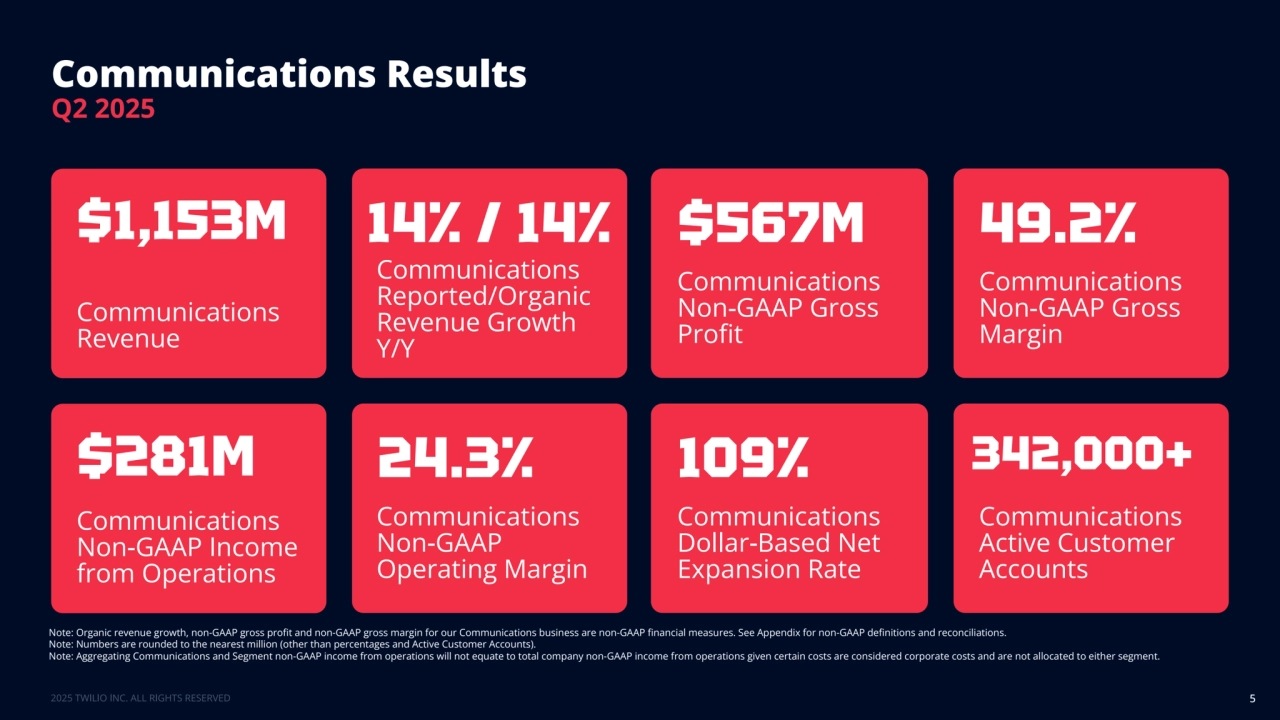
- 📞 Communications Segment: $1.153M in revenue for the Communications segment, growing at 14% Y/Y.
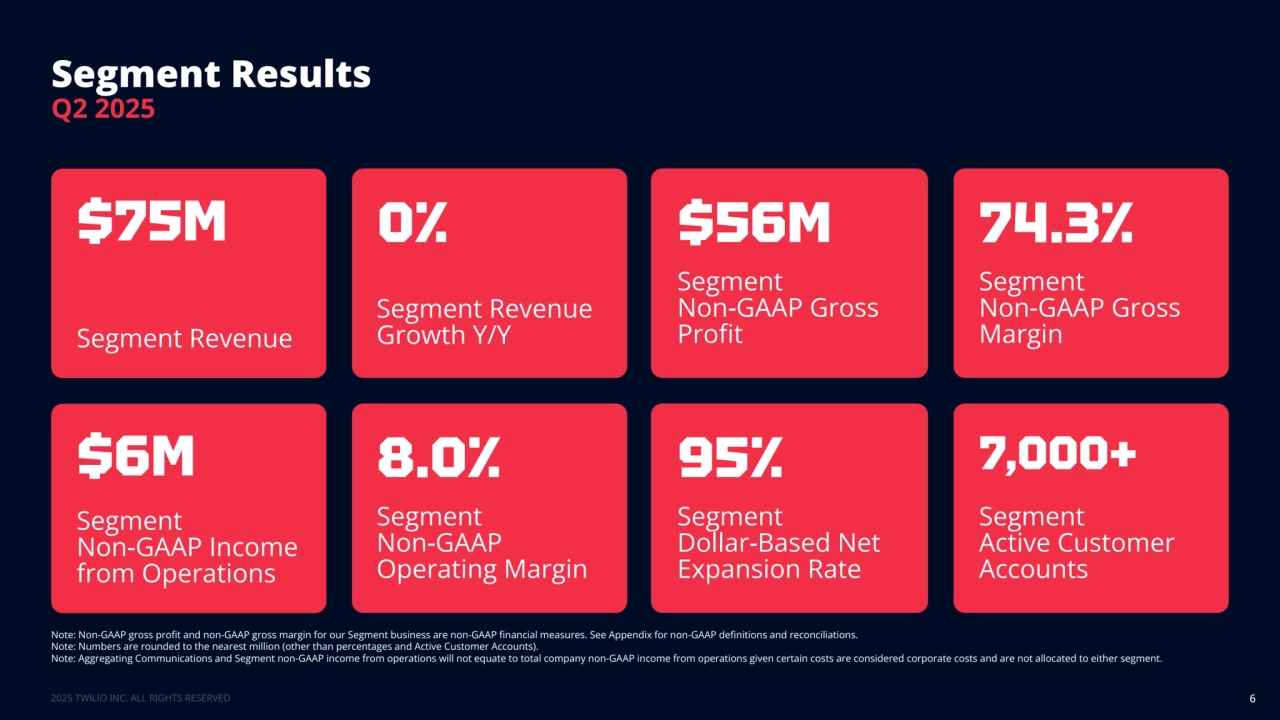
- 🤝 Segment Results: Segment revenue is $75M, but experiencing 0% growth Y/Y.
- 📊 2025 Guidance: Q3 revenue projected between $1.245B and $1.255B; Full-year revenue growth projected to be 10-11%.
- 🏆 Customer Wins: Highlights customer wins for both the Communications and Segment divisions, including expansions and new deals with leading companies.


Twilio Q2 2025 Earnings Results
- 1. Q2 2025 Earnings Results August 7, 2025 1
- 2. Legal Disclaimer 2 This presentation and the accompanying conference call contain forward-looking statements within the meaning of the federal securities laws, including statements about our future performance and goals. These statements involve substantial risks and uncertainties as further described in the Appendix, as well as in our most recent periodic reports filed with the SEC, including our Annual Report on Form 10-K and subsequent Quarterly Reports on Form 10-Q, which are available on our website and at sec.gov. This presentation and the accompanying conference call also contain operating metrics, including Active Customer Accounts and Dollar-Based Net Expansion Rate. We rely on assumptions to calculate these metrics, they are calculated using internal company data that has not been independently verified, and they are not based on any standardized industry methodology. More information about these operating metrics can be found in the Appendix. This presentation and the accompanying conference call also contain non-GAAP financial measures. The non-GAAP financial measures, including non-GAAP gross profit, non-GAAP gross margin, non-GAAP income (loss) from operations, non-GAAP operating margin, non-GAAP net income (loss) per share attributable to common stockholders, diluted (which we refer to as non-GAAP diluted earnings per share), organic revenue, organic revenue growth, free cash flow and free cash flow margin, are presented for supplemental informational purposes only and should not be considered a substitute for financial information presented in accordance with GAAP. More information about and definitions of these non-GAAP financial measures, and reconciliations to their most directly comparable GAAP measures, can be found in the Appendix.
- 3. Financial Overview 3
- 4. 4 Total Company Results Note: Organic revenue growth, non-GAAP gross profit, non-GAAP gross margin, non-GAAP income from operations, and free cash flow are non-GAAP financial measures. See Appendix for non-GAAP definitions and reconciliations. Note: Numbers are rounded to the nearest million (other than percentages and Active Customer Accounts). Total Revenue $1,228M Reported/Organic Revenue Growth Y/Y 13% / 13% Non-GAAP Gross Profit $623M Non-GAAP Gross Margin 50.7% Non-GAAP Income from Operations $221M Free Cash Flow $263M Dollar-Based Net Expansion Rate 108% Active Customer Accounts 349,000+ Q2 2025 by strong collections and timing of payments during the quarter.
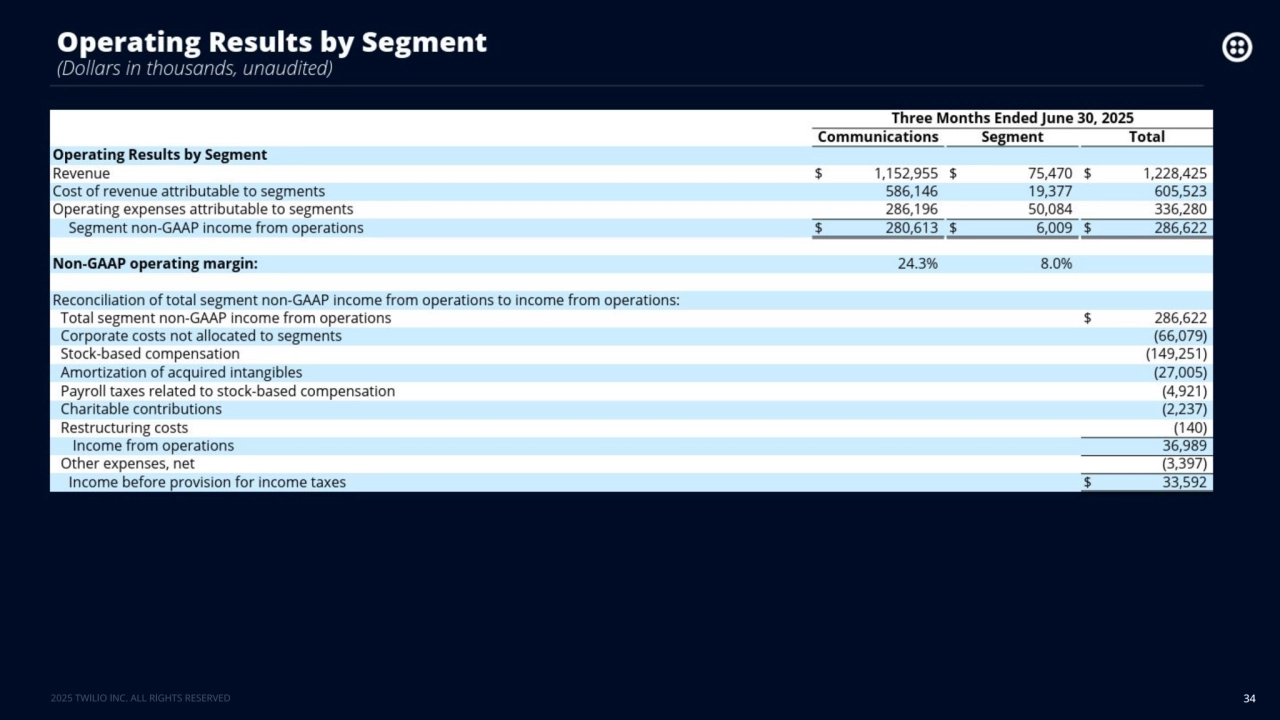
- 5. 5 Communications Results Note: Organic revenue growth, non-GAAP gross profit and non-GAAP gross margin for our Communications business are non-GAAP financial measures. See Appendix for non-GAAP definitions and reconciliations. Note: Numbers are rounded to the nearest million (other than percentages and Active Customer Accounts). Note: Aggregating Communications and Segment non-GAAP income from operations will not equate to total company non-GAAP income from operations given certain costs are considered corporate costs and are not allocated to either segment. Communications Revenue $1,153M Communications Reported/Organic Revenue Growth Y/Y 14% / 14% Communications Non-GAAP Gross Profit $567M Communications Non-GAAP Gross Margin 49.2% Communications Non-GAAP Income from Operations $281M Communications Non-GAAP Operating Margin 24.3% Communications Dollar-Based Net Expansion Rate 109% Communications Active Customer Accounts 342,000+ Q2 2025
- 6. 6 Segment Results Note: Non-GAAP gross profit and non-GAAP gross margin for our Segment business are non-GAAP financial measures. See Appendix for non-GAAP definitions and reconciliations. Note: Numbers are rounded to the nearest million (other than percentages and Active Customer Accounts). Note: Aggregating Communications and Segment non-GAAP income from operations will not equate to total company non-GAAP income from operations given certain costs are considered corporate costs and are not allocated to either segment. Segment Revenue $75M Segment Revenue Growth Y/Y 0% Segment Non-GAAP Gross Profit $56M Segment Non-GAAP Gross Margin 74.3% Segment Non-GAAP Income from Operations $6M Segment Non-GAAP Operating Margin 8.0% Segment Dollar-Based Net Expansion Rate 95% Segment Active Customer Accounts 7,000+ Q2 2025
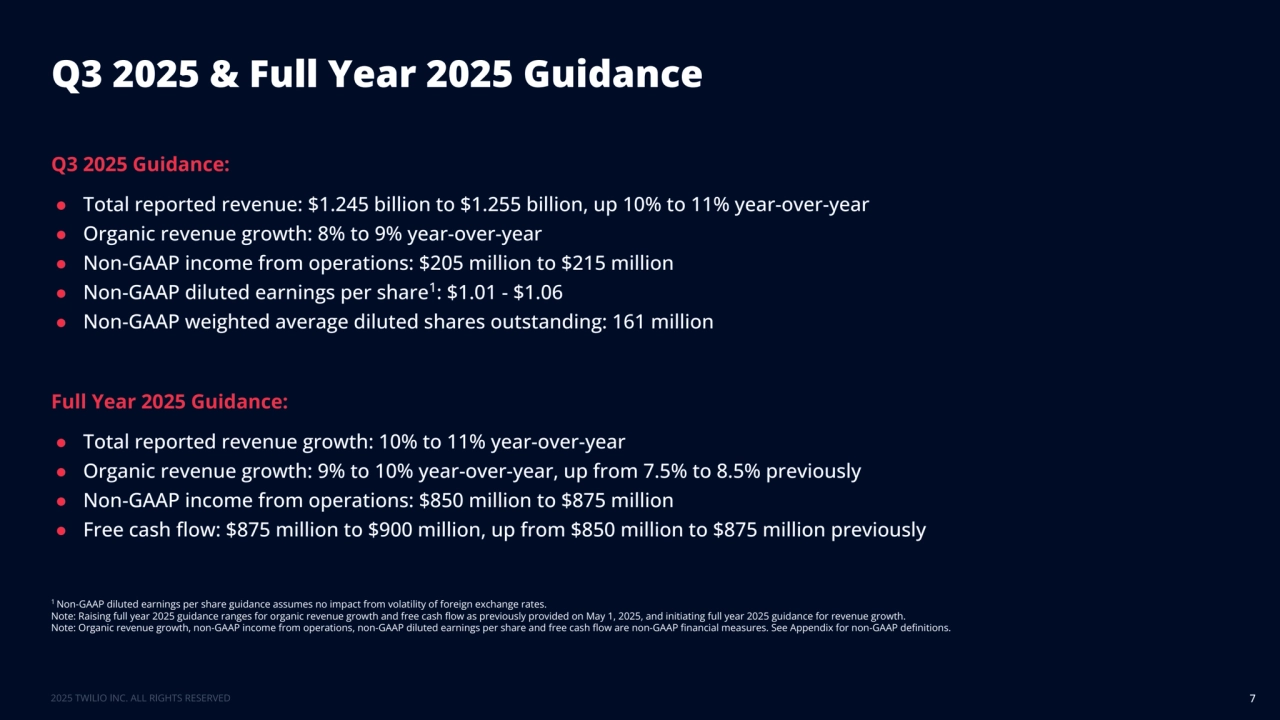
- 7. Q3 2025 Guidance: ● Total reported revenue: $1.245 billion to $1.255 billion, up 10% to 11% year-over-year ● Organic revenue growth: 8% to 9% year-over-year ● Non-GAAP income from operations: $205 million to $215 million ● Non-GAAP diluted earnings per share1: $1.01 - $1.06 ● Non-GAAP weighted average diluted shares outstanding: 161 million Full Year 2025 Guidance: ● Total reported revenue growth: 10% to 11% year-over-year ● Organic revenue growth: 9% to 10% year-over-year, up from 7.5% to 8.5% previously ● Non-GAAP income from operations: $850 million to $875 million ● Free cash flow: $875 million to $900 million, up from $850 million to $875 million previously Q3 2025 & Full Year 2025 Guidance 7 1 Non-GAAP diluted earnings per share guidance assumes no impact from volatility of foreign exchange rates. Note: Raising full year 2025 guidance ranges for organic revenue growth and free cash flow as previously provided on May 1, 2025, and initiating full year 2025 guidance for revenue growth. Note: Organic revenue growth, non-GAAP income from operations, non-GAAP diluted earnings per share and free cash flow are non-GAAP financial measures. See Appendix for non-GAAP definitions.
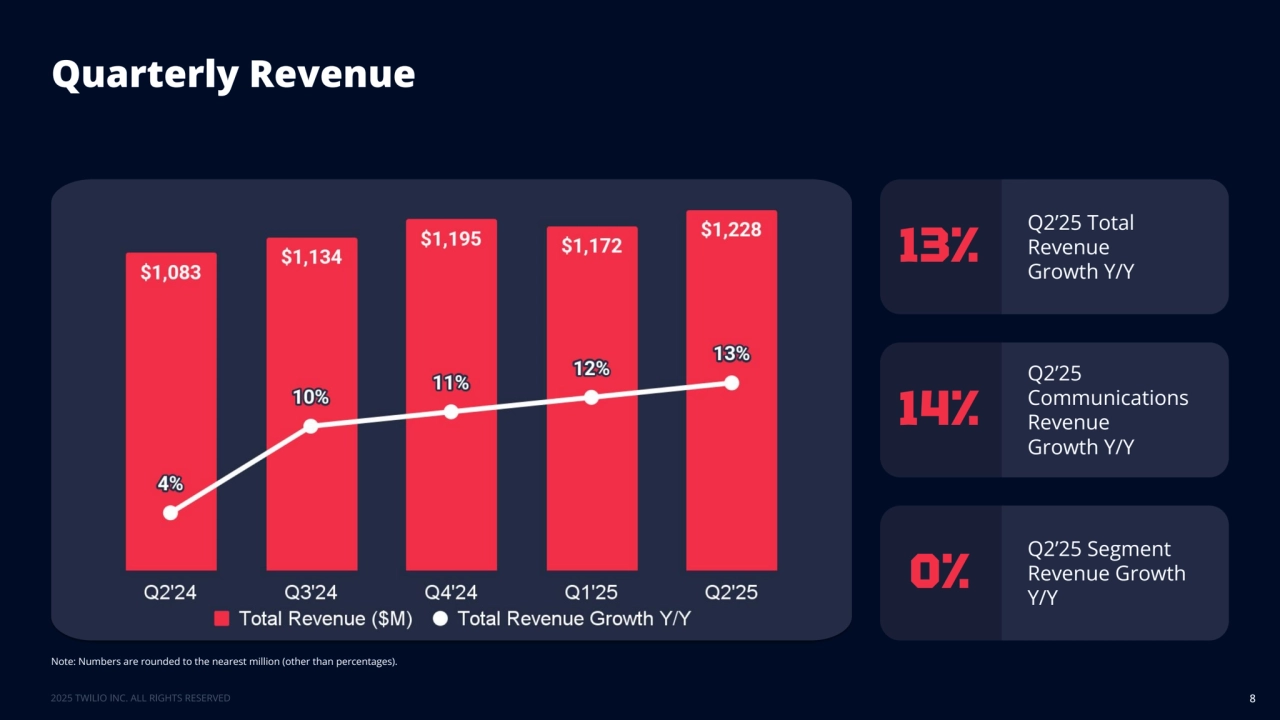
- 8. Quarterly Revenue 8 Q2’25 Segment Revenue Growth Y/Y 0% Note: Numbers are rounded to the nearest million (other than percentages). 14% Q2’25 Communications Revenue Growth Y/Y Q2’25 Total Revenue Growth Y/Y 13%
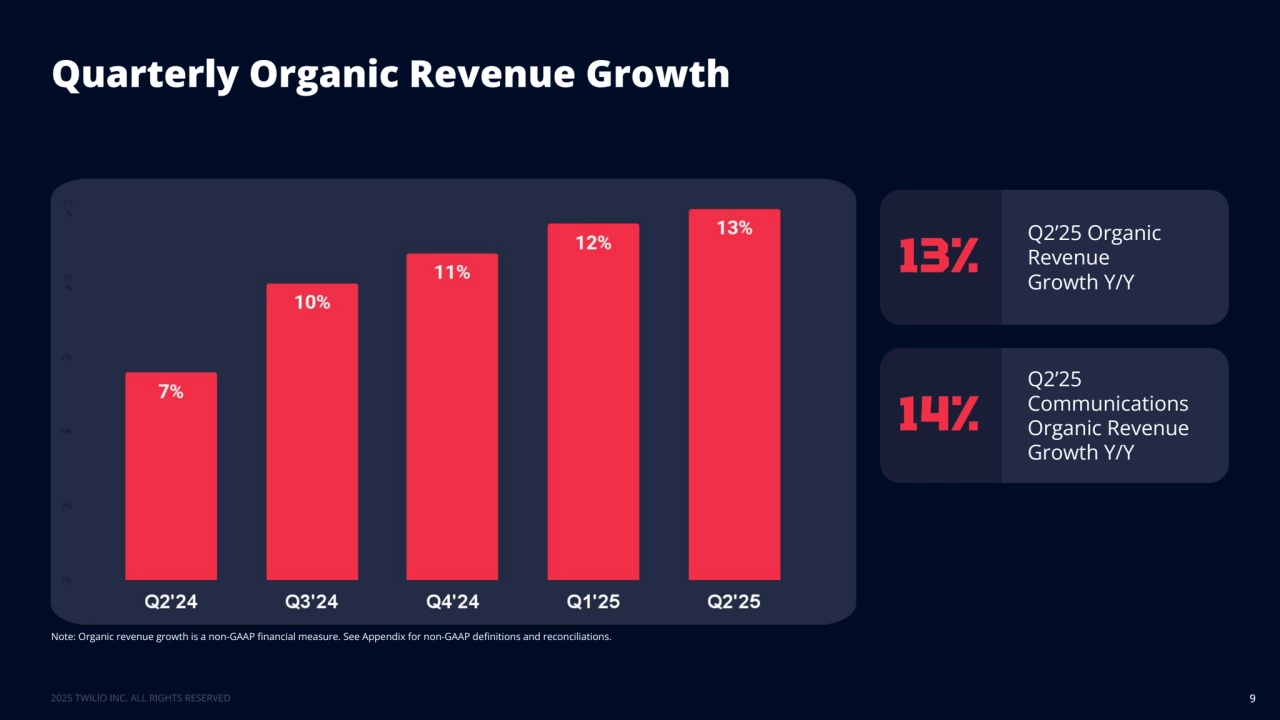
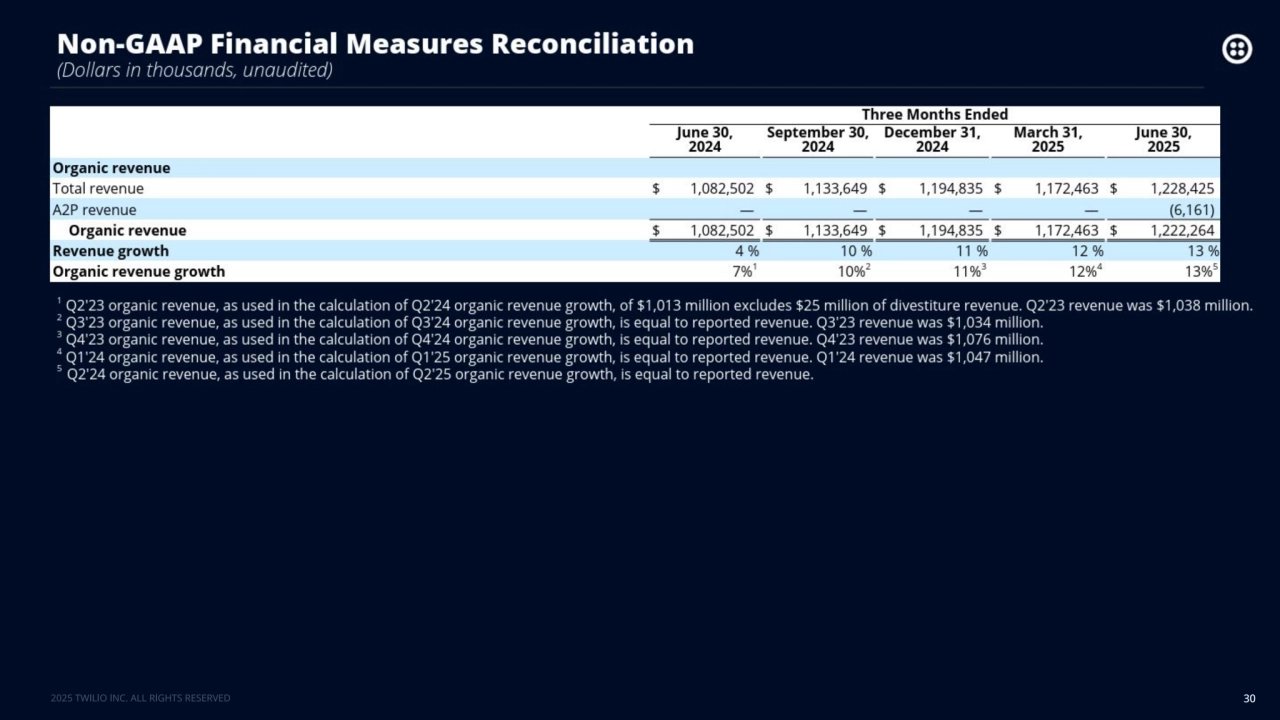
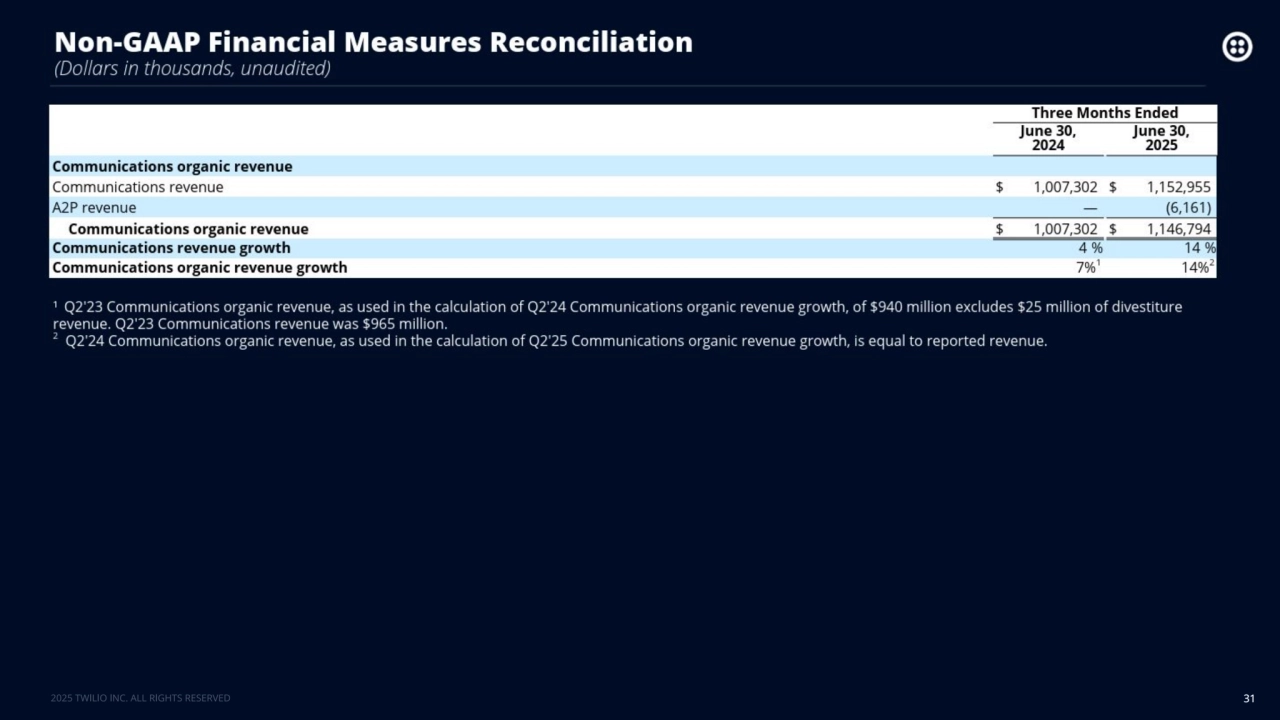
- 9. Quarterly Organic Revenue Growth 9 Note: Organic revenue growth is a non-GAAP financial measure. See Appendix for non-GAAP definitions and reconciliations. Q2’25 Organic Revenue Growth Y/Y 13% Q2’25 Communications Organic Revenue Growth Y/Y 14%
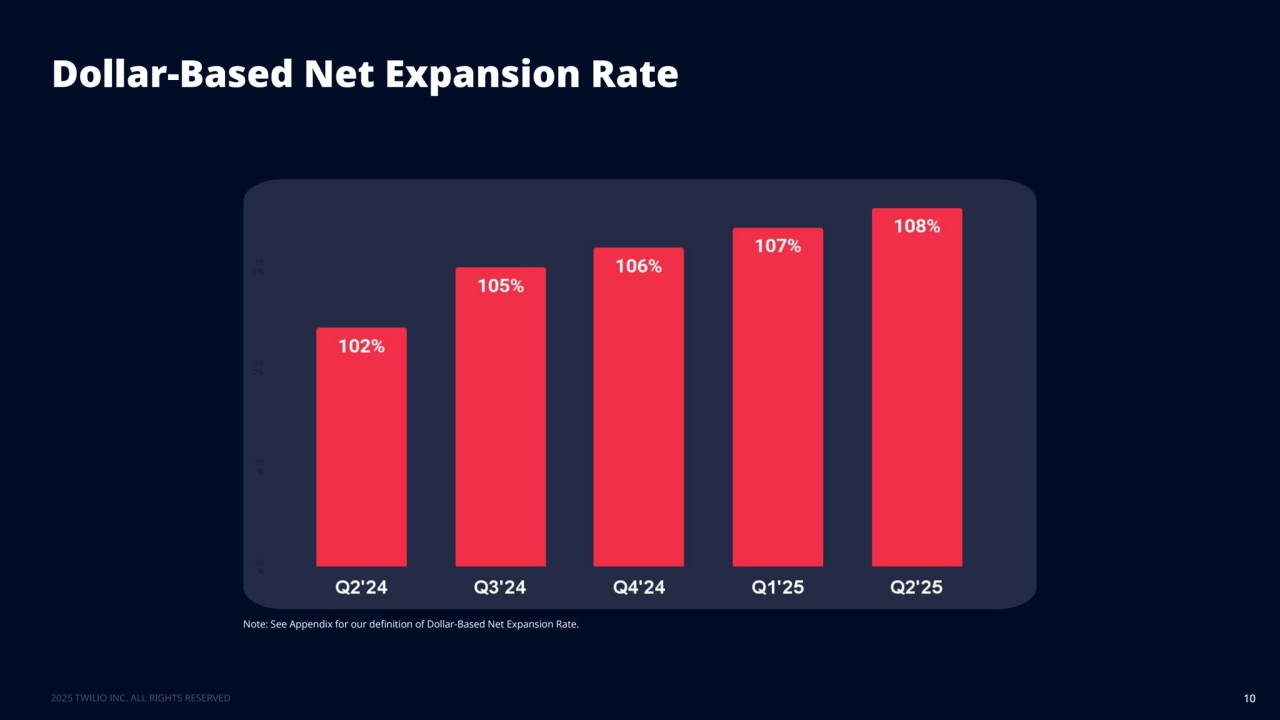
- 10. Dollar-Based Net Expansion Rate 10 Note: See Appendix for our definition of Dollar-Based Net Expansion Rate.
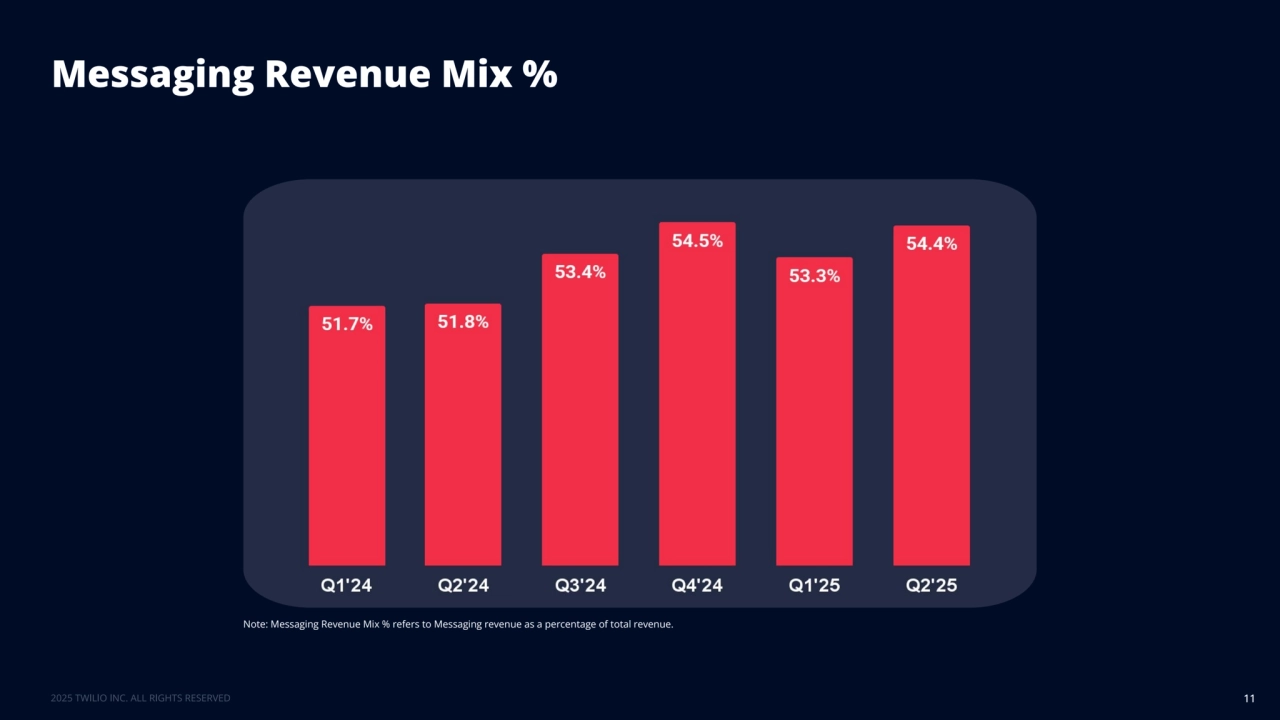
- 11. Messaging Revenue Mix % 11 Note: Messaging Revenue Mix % refers to Messaging revenue as a percentage of total revenue.
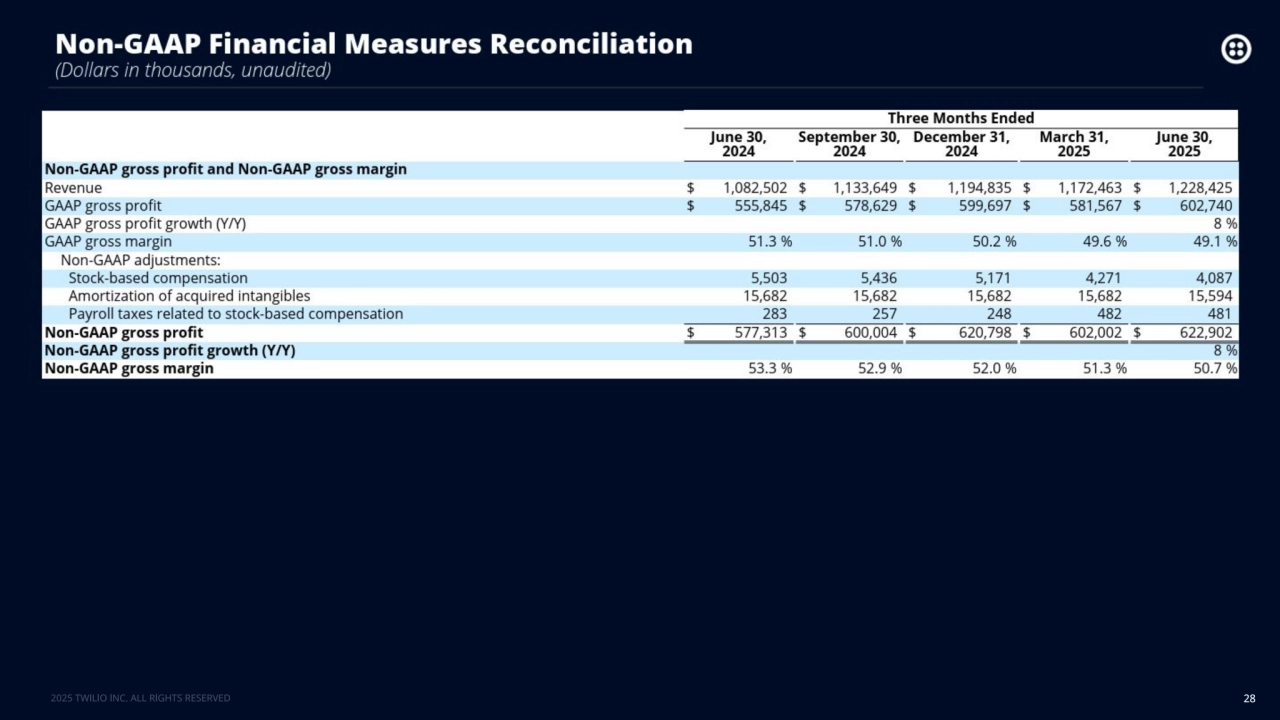
- 12. Non-GAAP Gross Profit 12 Note: Non-GAAP gross profit and non-GAAP gross margin are non-GAAP financial measures. See Appendix for non-GAAP definitions and reconciliations. Q2’25 Non-GAAP 51% Gross Margin Q2’25 Non-GAAP Gross Profit Growth Y/Y 8%
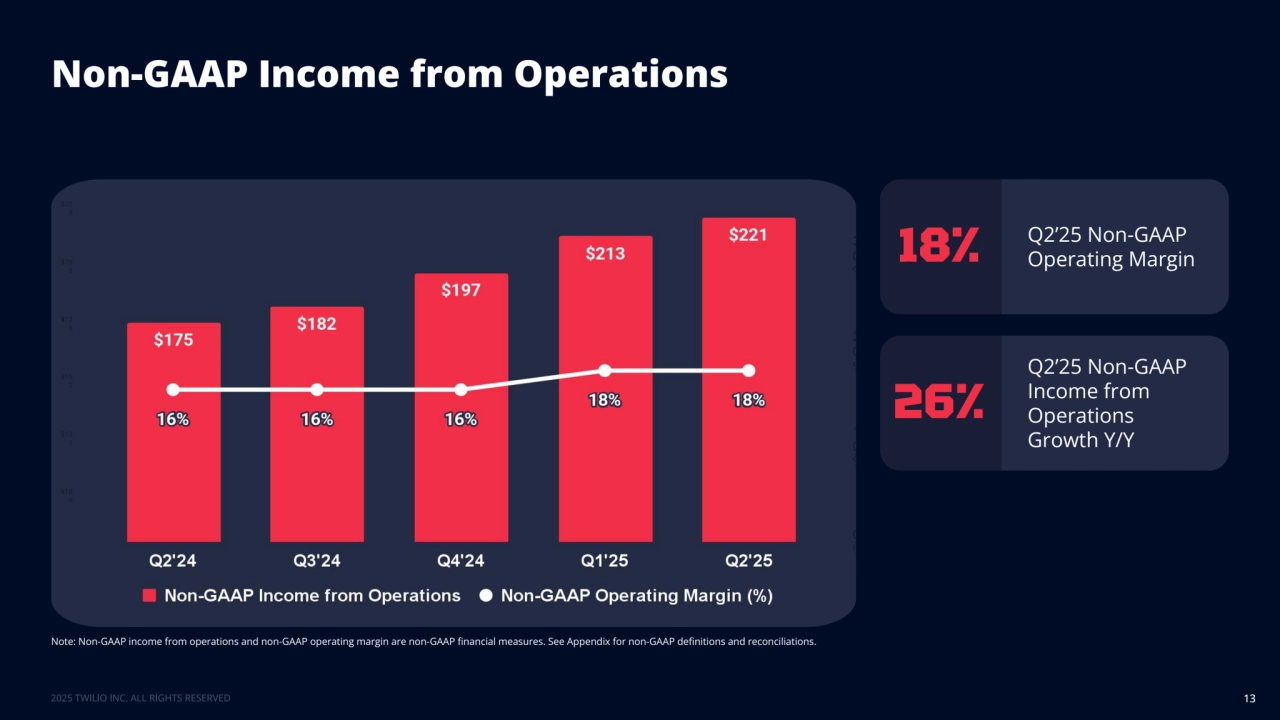
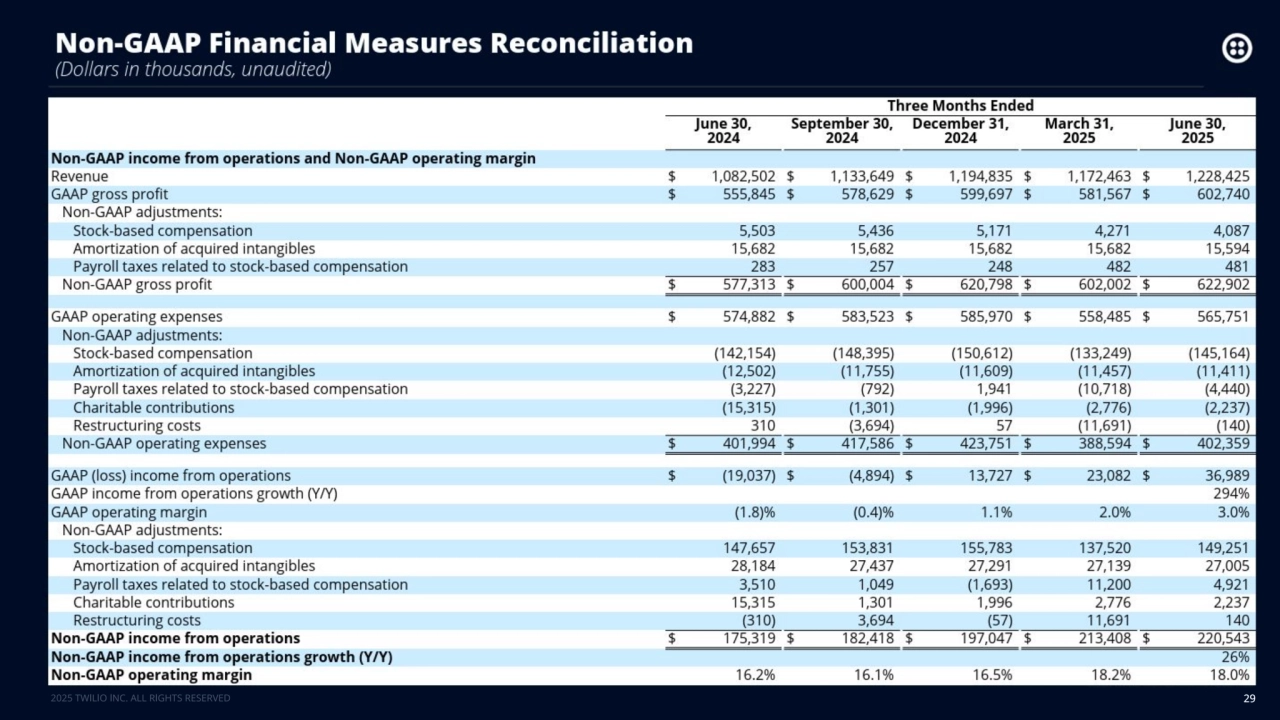
- 13. Non-GAAP Income from Operations 13 Note: Non-GAAP income from operations and non-GAAP operating margin are non-GAAP financial measures. See Appendix for non-GAAP definitions and reconciliations. Q2’25 Non-GAAP 18% Operating Margin Q2’25 Non-GAAP Income from Operations Growth Y/Y 26%
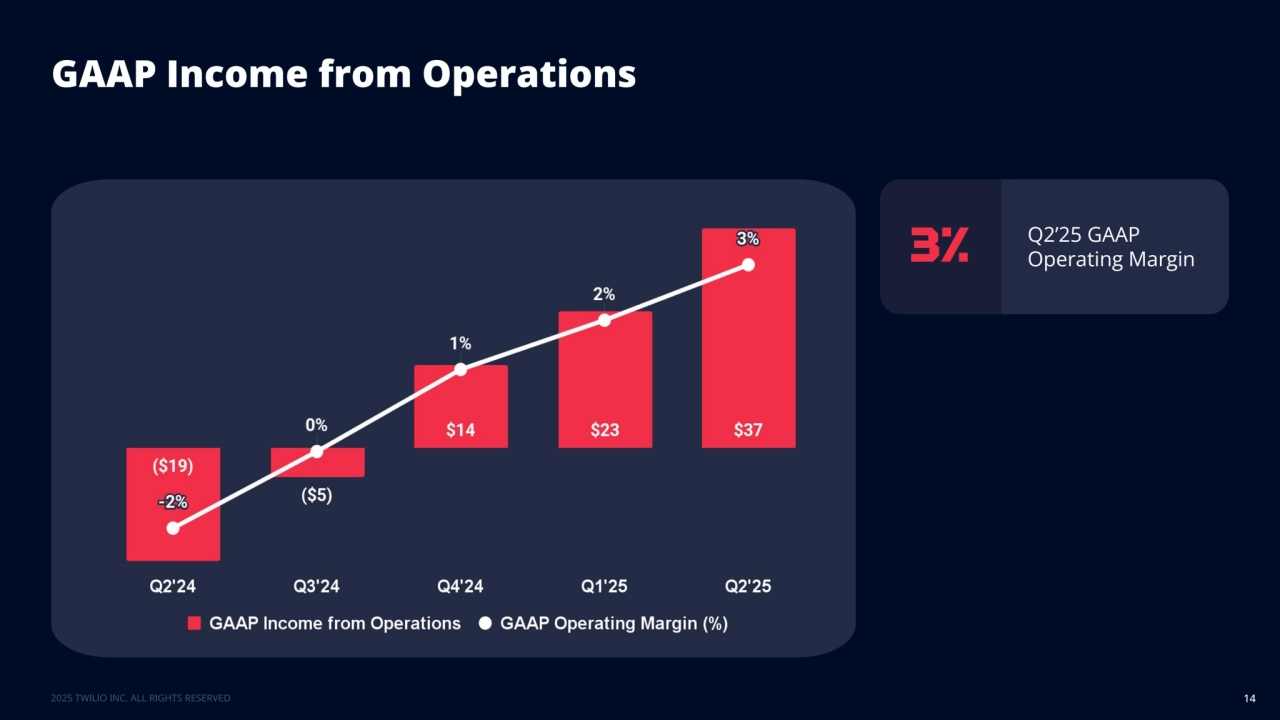
- 14. GAAP Income from Operations 14 Q2’25 GAAP 3% Operating Margin
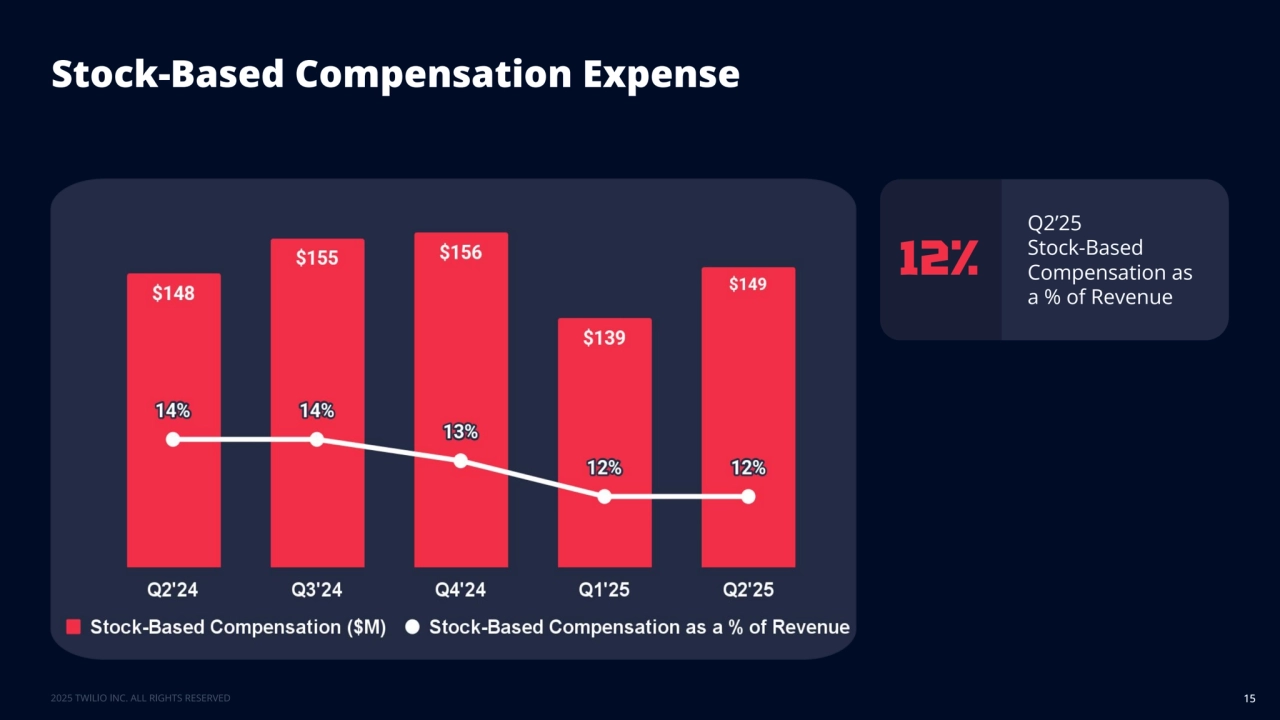
- 15. Stock-Based Compensation Expense 15 Q2’25 Stock-Based Compensation as a % of Revenue 12%
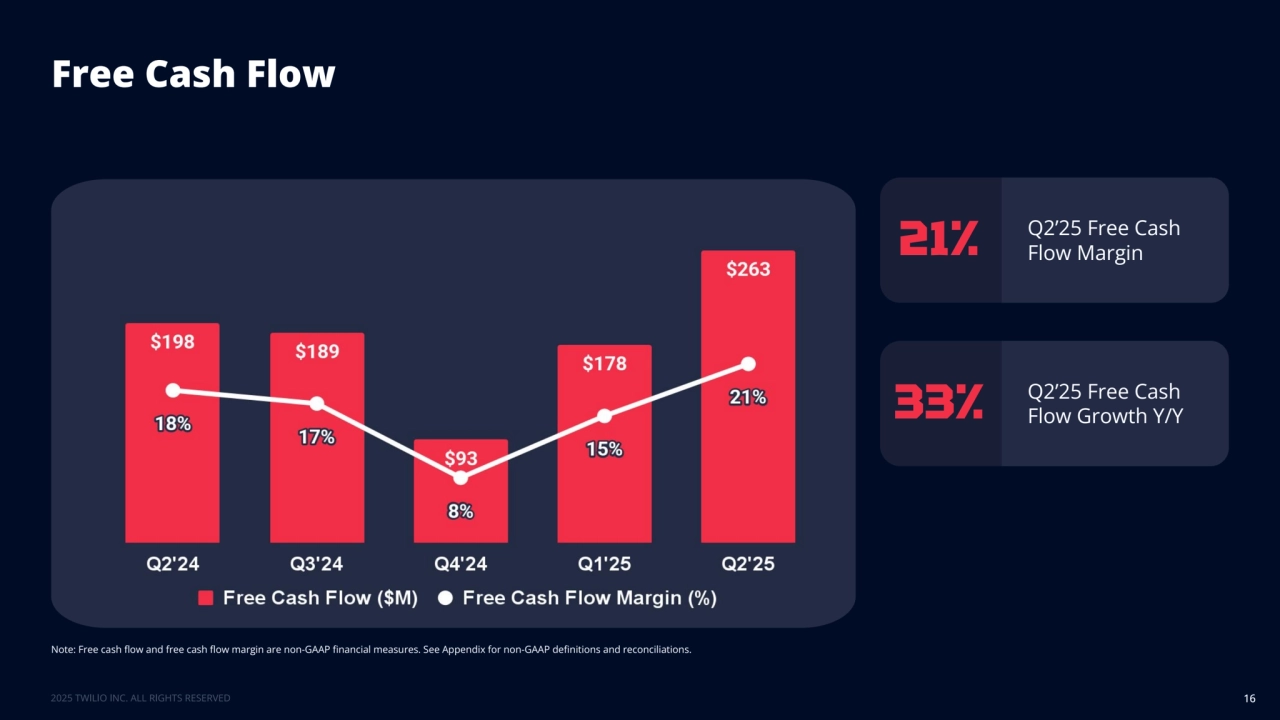
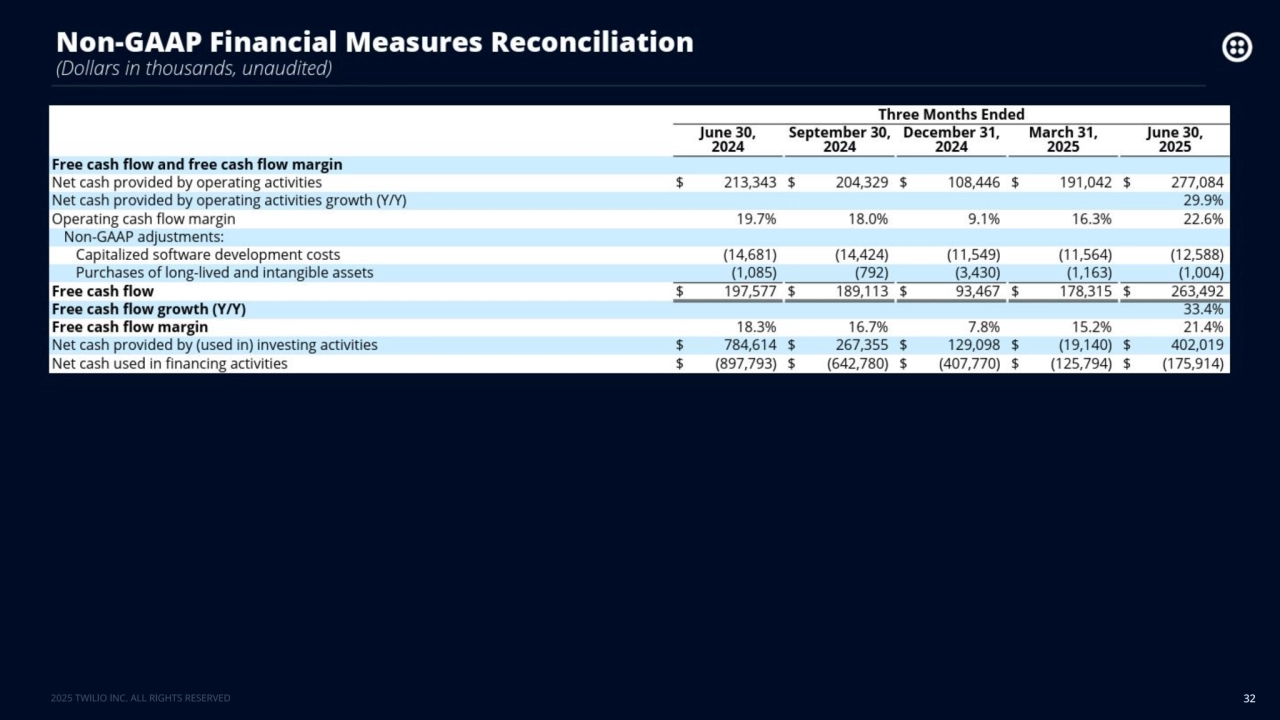
- 16. Free Cash Flow 16 Note: Free cash flow and free cash flow margin are non-GAAP financial measures. See Appendix for non-GAAP definitions and reconciliations. Q2’25 Free Cash 21% Flow Margin Q2’25 Free Cash 33% Flow Growth Y/Y
- 17. Q2 2025: Representative Customer Wins 17
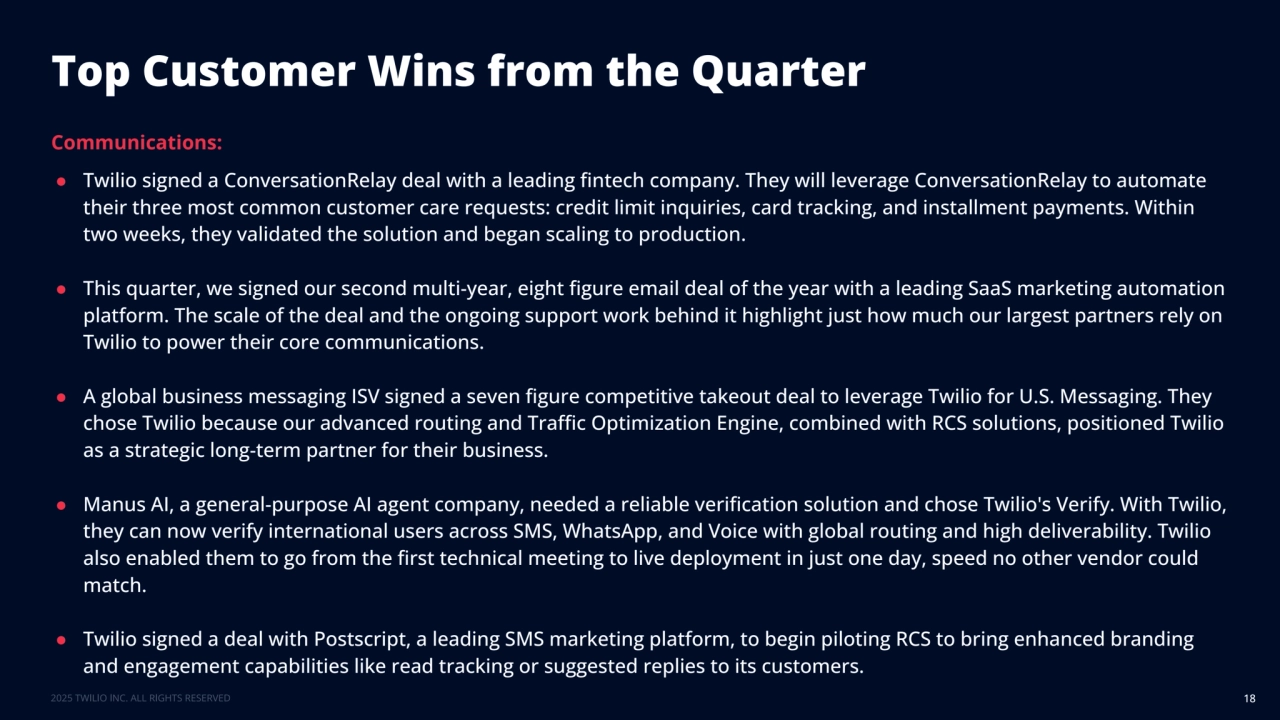
- 18. Communications: ● Twilio signed a ConversationRelay deal with a leading fintech company. They will leverage ConversationRelay to automate their three most common customer care requests: credit limit inquiries, card tracking, and installment payments. Within two weeks, they validated the solution and began scaling to production. ● This quarter, we signed our second multi-year, eight figure email deal of the year with a leading SaaS marketing automation platform. The scale of the deal and the ongoing support work behind it highlight just how much our largest partners rely on Twilio to power their core communications. ● A global business messaging ISV signed a seven figure competitive takeout deal to leverage Twilio for U.S. Messaging. They chose Twilio because our advanced routing and Traffic Optimization Engine, combined with RCS solutions, positioned Twilio as a strategic long-term partner for their business. ● Manus AI, a general-purpose AI agent company, needed a reliable verification solution and chose Twilio's Verify. With Twilio, they can now verify international users across SMS, WhatsApp, and Voice with global routing and high deliverability. Twilio also enabled them to go from the first technical meeting to live deployment in just one day, speed no other vendor could match. ● Twilio signed a deal with Postscript, a leading SMS marketing platform, to begin piloting RCS to bring enhanced branding and engagement capabilities like read tracking or suggested replies to its customers. Top Customer Wins from the Quarter 18
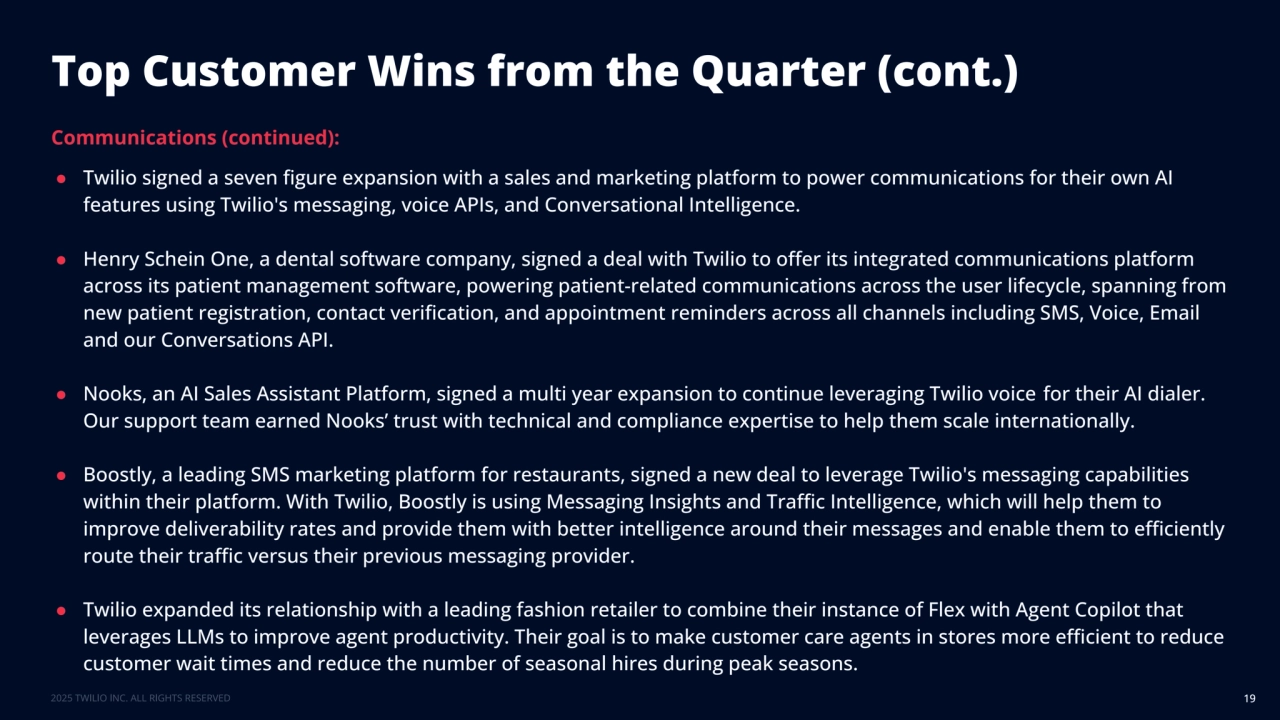
- 19. Top Customer Wins from the Quarter (cont.) 19 Communications (continued): ● Twilio signed a seven figure expansion with a sales and marketing platform to power communications for their own AI features using Twilio's messaging, voice APIs, and Conversational Intelligence. ● Henry Schein One, a dental software company, signed a deal with Twilio to offer its integrated communications platform across its patient management software, powering patient-related communications across the user lifecycle, spanning from new patient registration, contact verification, and appointment reminders across all channels including SMS, Voice, Email and our Conversations API. ● Nooks, an AI Sales Assistant Platform, signed a multi year expansion to continue leveraging Twilio voice for their AI dialer. Our support team earned Nooks’ trust with technical and compliance expertise to help them scale internationally. ● Boostly, a leading SMS marketing platform for restaurants, signed a new deal to leverage Twilio's messaging capabilities within their platform. With Twilio, Boostly is using Messaging Insights and Traffic Intelligence, which will help them to improve deliverability rates and provide them with better intelligence around their messages and enable them to efficiently route their traffic versus their previous messaging provider. ● Twilio expanded its relationship with a leading fashion retailer to combine their instance of Flex with Agent Copilot that leverages LLMs to improve agent productivity. Their goal is to make customer care agents in stores more efficient to reduce customer wait times and reduce the number of seasonal hires during peak seasons.
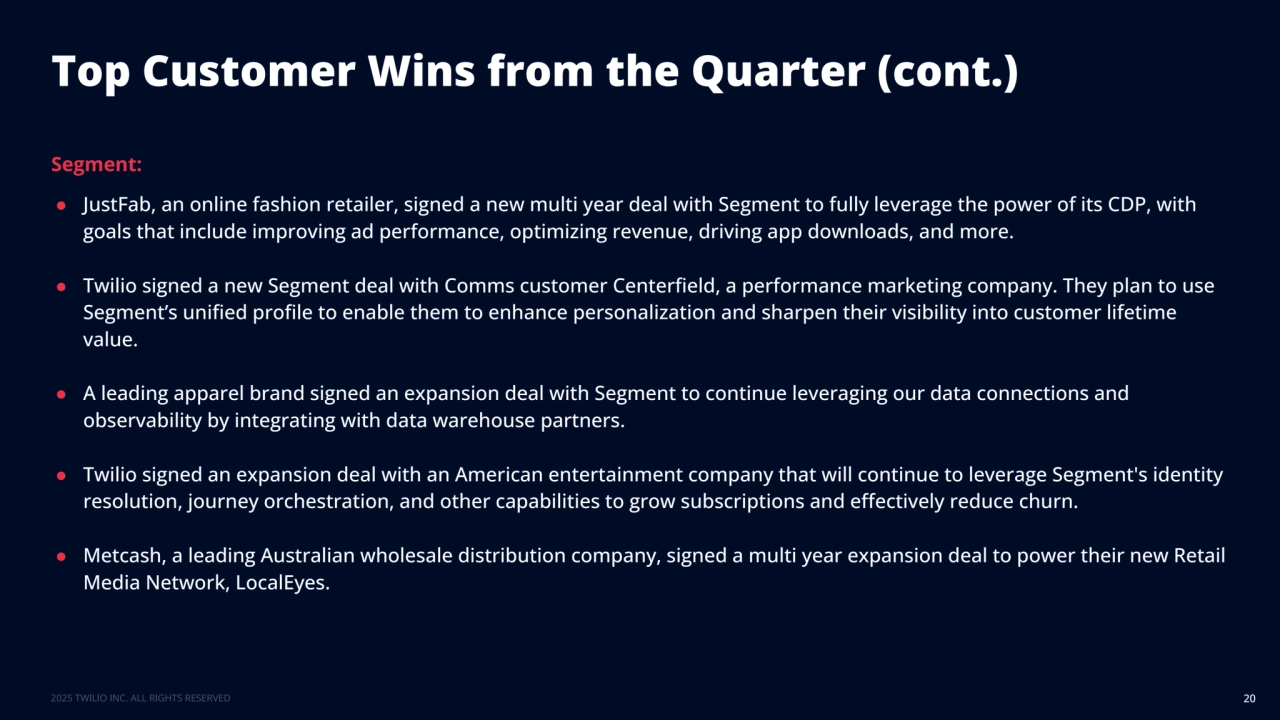
- 20. Top Customer Wins from the Quarter (cont.) 20 Segment: ● JustFab, an online fashion retailer, signed a new multi year deal with Segment to fully leverage the power of its CDP, with goals that include improving ad performance, optimizing revenue, driving app downloads, and more. ● Twilio signed a new Segment deal with Comms customer Centerfield, a performance marketing company. They plan to use Segment’s unified profile to enable them to enhance personalization and sharpen their visibility into customer lifetime value. ● A leading apparel brand signed an expansion deal with Segment to continue leveraging our data connections and observability by integrating with data warehouse partners. ● Twilio signed an expansion deal with an American entertainment company that will continue to leverage Segment's identity resolution, journey orchestration, and other capabilities to grow subscriptions and effectively reduce churn. ● Metcash, a leading Australian wholesale distribution company, signed a multi year expansion deal to power their new Retail Media Network, LocalEyes.
- 21. THANK YOU 21
- 22. Appendix 22
- 23. Forward-Looking Statements 23 This presentation and the accompanying conference call contain forward-looking statements within the meaning of the federal securities laws. Forward-looking statements generally relate to future events or our future financial or operating performance. In some cases, you can identify forward-looking statements because they contain words such as “may,” “can,” “will,” “would,” “should,” “expects,” “plans,” “anticipates,” “could,” “intends,” “target,” “projects,” “contemplates,” “believes,” “estimates,” “predicts,” “forecasts,” “potential” or “continue” or the negative of these words or other similar terms or expressions that concern our expectations, strategy, plans or intentions. Forward-looking statements contained in this presentation and the accompanying conference call include, but are not limited to, statements about: our future financial and operating performance, including our expected financial and operating results, guidance and targets, including the assumptions underlying such guidance and targets; our anticipated strategies and business plans and our ability to successfully execute them; our ability to drive growth, profitability, free cash flow and stockholder returns and increase our market share; the timing of future investments or expenses; our expectations regarding carrier fees and the impact of such fees on our financial and operating results; our expectations regarding our gross margin, price and cost actions, product mix and growth in higher-margin products; our expectations regarding capital returns to shareholders, including share repurchases; our expectations regarding our relationships with ISVs, partners and resellers; our expectations regarding our self-service, cross-sell and upsell efforts; our ability to expand into new and existing markets, including international markets; the development, release and adoption of our products (and the timing thereof), including related to AI and machine learning; the effects of our go-to-market efforts to drive profitable growth and capture market share; our strategy for streamlining and adding value to the customer experience; our ability to deliver on our product roadmap and our focus on innovation; our expectations regarding disclosure of results by business unit; and our expectations regarding the macroeconomic environment and the impact of global economic, political and industry conditions on our business, customers and partners. You should not rely upon forward-looking statements as predictions of future events. The outcome of the events described in these forward-looking statements is subject to known and unknown risks, uncertainties, and other factors that may cause our actual results, performance, or achievements to differ materially from those described in the forward-looking statements, including, among other things: our ability to attract and retain customers and expand their usage of our platform; our ability to realize the anticipated benefits of changes to our operating model and organizational structure; our ability to successfully implement our cost-saving initiatives and to capture expected efficiencies; our ability to form and expand partnerships; our ability to successfully enter into new markets and manage our international expansion; the impact of macroeconomic and political conditions and market volatility; our ability to compete effectively in intensely competitive markets; our financial performance, including expectations regarding our results of operations and the assumptions underlying such expectations, and ability to achieve and sustain profitability; our ability to manage changes in network service provider fees and optimize our network service provider coverage and connectivity; and our ability to comply with modified or new industry standards, laws and regulations applying to our business, and increased costs associated with regulatory compliance. The forward-looking statements contained in this presentation and the accompanying conference call are also subject to additional risks, uncertainties, and factors, including those more fully described in our most recent filings with the Securities and Exchange Commission, including our Annual Report on Form 10-K and subsequent Quarterly Reports on Form 10-Q. Should any of these risks materialize, or should our assumptions prove to be incorrect, actual financial results could differ materially from our projections or those implied by these forward-looking statements. Moreover, we operate in a very competitive and rapidly changing environment, and new risks and uncertainties may emerge that could have an impact on the forward-looking statements contained in this presentation and the accompanying conference call. All forward-looking statements contained in this presentation and the accompanying conference call represent our management’s beliefs and assumptions only as of the date such statements are made and we do not assume any obligation to update any forward-looking statements to reflect events or circumstances occurring after the date on which the statements were made, or to reflect new information or the occurrence of unanticipated events, except as required by law.
- 24. Operating Metrics 24 We review a number of operational and financial metrics, including Active Customer Accounts and Dollar-Based Net Expansion Rate, to evaluate our business, measure our performance, identify trends affecting our business, formulate business plans and make strategic decisions. These metrics are not based on any standardized industry methodology and are not necessarily calculated in the same manner or comparable to similarly titled measures presented by other companies. Similarly, these metrics may differ from estimates published by third parties or from similarly titled metrics of our competitors due to differences in methodology. The numbers that we use to calculate Active Customer Accounts and Dollar-Based Net Expansion Rate are based on internal data. While these numbers are based on what we believe to be reasonable judgments and estimates for the applicable period of measurement, there are inherent challenges in measuring usage. We regularly review and may adjust our processes for calculating our internal metrics to improve their accuracy. If investors or analysts do not perceive our metrics to be accurate representations of our business, or if we discover material inaccuracies in our metrics, our reputation, business, results of operations, and financial condition would be harmed. Active Customer Accounts. We define an Active Customer Account at the end of any period as an individual account, as identified by a unique account identifier, for which we have recognized at least $5 of revenue in the last month of the period. A single organization may constitute multiple unique Active Customer Accounts if it has multiple account identifiers, each of which is treated as a separate Active Customer Account. Active Customer Accounts excludes customer accounts from Zipwhip, Inc. (“Zipwhip”). Communications Active Customer Accounts and Segment Active Customer Accounts are calculated using the same methodology, but using only revenue recognized from accounts in the respective segment. The number of consolidated and Communications Active Customer Accounts is rounded down to the nearest thousand. The number of Segment Active Customer Accounts is rounded down to the nearest hundred. Our business and customer relationships have grown since we began reporting the number of Active Customer Accounts using the above definition, which is anchored to a minimum $5 monthly revenue figure. We have a large number of Active Customer Accounts with relatively low individual spend that in the aggregate do not drive a significant portion of our revenue. Due to this dynamic, we believe that the number of Active Customer Accounts, as currently defined, is less informative now as an indicator of the growth of our business and future revenue trends than it has been in prior periods.
- 25. Operating Metrics 25 Dollar-Based Net Expansion Rate. Our Dollar-Based Net Expansion Rate compares the total revenue from all Active Customer Accounts and customer accounts from Zipwhip in a quarter to the same quarter in the prior year. To calculate the Dollar-Based Net Expansion Rate, we first identify the cohort of Active Customer Accounts and customer accounts from Zipwhip that were Active Customer Accounts or customer accounts from Zipwhip in the same quarter of the prior year. The Dollar-Based Net Expansion Rate is the quotient obtained by dividing the revenue generated from that cohort in a quarter, by the revenue generated from that same cohort in the corresponding quarter in the prior year. When we calculate Dollar-Based Net Expansion Rate for periods longer than one quarter, we use the average of the applicable quarterly Dollar-Based Net Expansion Rates for each of the quarters in such period. Revenue from acquisitions does not impact the Dollar-Based Net Expansion Rate calculation until the quarter following the one-year anniversary of the applicable acquisition, unless the acquisition closing date is the first day of a quarter. Revenue from divestitures does not impact the Dollar-Based Net Expansion Rate calculation beginning in the quarter the divestiture closed, unless the divestiture closing date is the last day of a quarter. Communications Dollar-Based Net Expansion Rate and Segment Dollar-Based Net Expansion Rate are calculated using the same methodology, but using only revenue attributable to the respective segment and Active Customer Accounts and customer accounts from Zipwhip for that respective segment. We believe that measuring Dollar-Based Net Expansion Rate, on an aggregate basis and at the segment level, provides an important indication of the performance of our efforts to increase revenue from existing customers. Our ability to drive growth and generate incremental revenue depends, in part, on our ability to maintain and grow our relationships with existing Active Customer Accounts and to increase their use of the platform. An important way in which we have historically tracked performance in this area is by measuring the Dollar-Based Net Expansion Rate for Active Customer Accounts. Our Dollar-Based Net Expansion Rate increases when such Active Customer Accounts increase their usage of a product, extend their usage of a product to new applications or adopt a new product. Our Dollar-Based Net Expansion Rate decreases when such Active Customer Accounts cease or reduce their usage of a product or when we lower usage prices on a product. As our customers grow their businesses and extend the use of our platform, they sometimes create multiple customer accounts with us for operational or other reasons. As such, when we identify a significant customer organization (defined as a single customer organization generating more than 1% of revenue in a quarterly reporting period) that has created a new Active Customer Account, this new Active Customer Account is tied to, and revenue from this new Active Customer Account is included with, the original Active Customer Account for the purposes of calculating this metric.
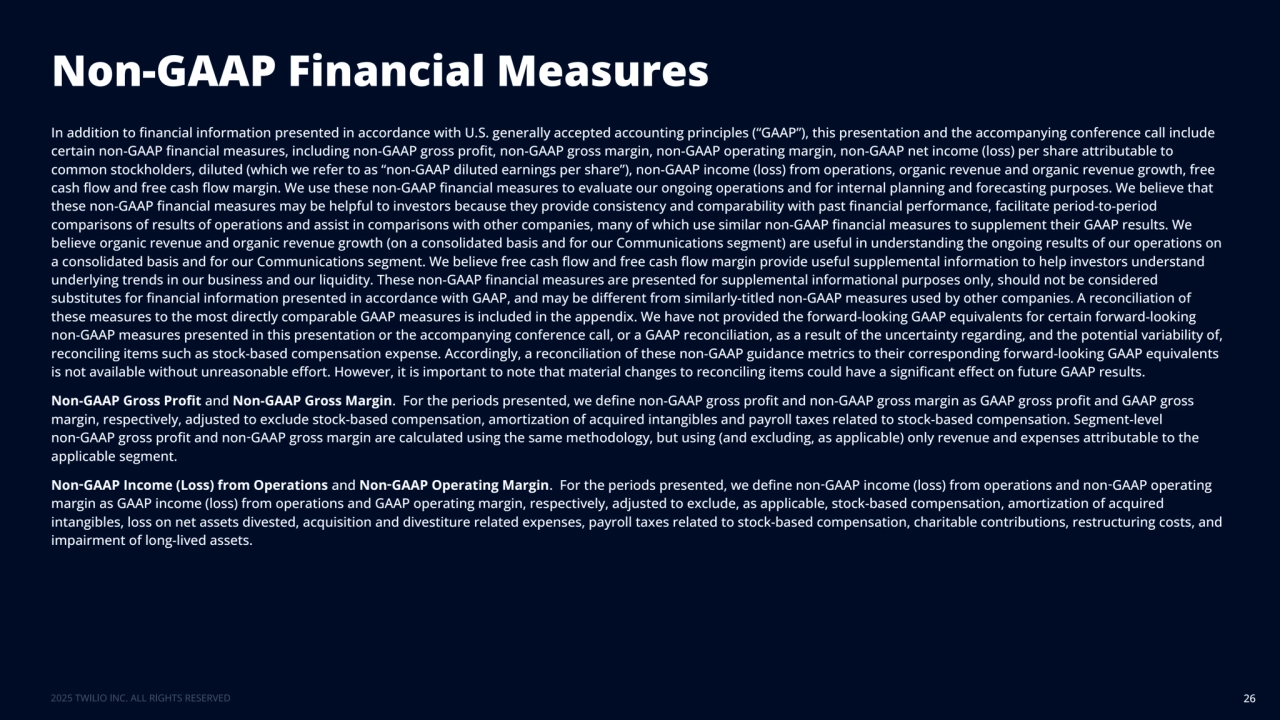
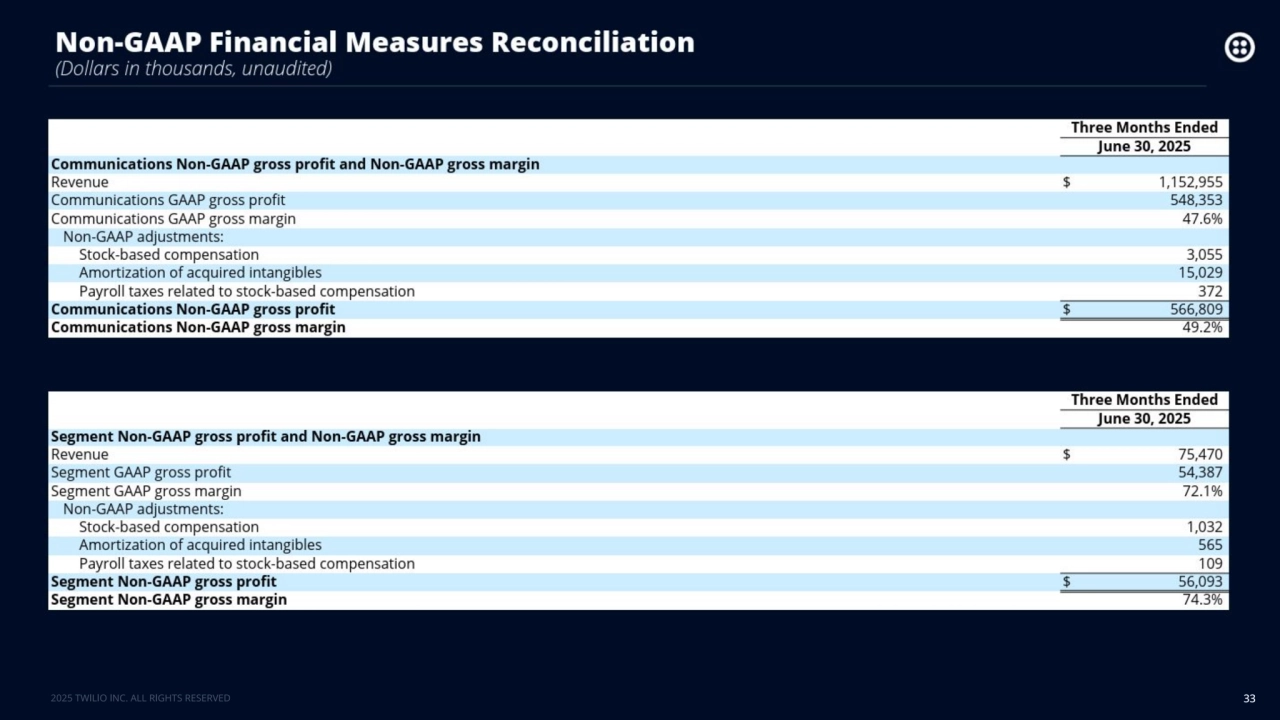
- 26. Non-GAAP Financial Measures 26 In addition to financial information presented in accordance with U.S. generally accepted accounting principles (“GAAP”), this presentation and the accompanying conference call include certain non-GAAP financial measures, including non-GAAP gross profit, non-GAAP gross margin, non-GAAP operating margin, non-GAAP net income (loss) per share attributable to common stockholders, diluted (which we refer to as “non-GAAP diluted earnings per share”), non-GAAP income (loss) from operations, organic revenue and organic revenue growth, free cash flow and free cash flow margin. We use these non-GAAP financial measures to evaluate our ongoing operations and for internal planning and forecasting purposes. We believe that these non-GAAP financial measures may be helpful to investors because they provide consistency and comparability with past financial performance, facilitate period-to-period comparisons of results of operations and assist in comparisons with other companies, many of which use similar non-GAAP financial measures to supplement their GAAP results. We believe organic revenue and organic revenue growth (on a consolidated basis and for our Communications segment) are useful in understanding the ongoing results of our operations on a consolidated basis and for our Communications segment. We believe free cash flow and free cash flow margin provide useful supplemental information to help investors understand underlying trends in our business and our liquidity. These non-GAAP financial measures are presented for supplemental informational purposes only, should not be considered substitutes for financial information presented in accordance with GAAP, and may be different from similarly-titled non-GAAP measures used by other companies. A reconciliation of these measures to the most directly comparable GAAP measures is included in the appendix. We have not provided the forward-looking GAAP equivalents for certain forward-looking non-GAAP measures presented in this presentation or the accompanying conference call, or a GAAP reconciliation, as a result of the uncertainty regarding, and the potential variability of, reconciling items such as stock-based compensation expense. Accordingly, a reconciliation of these non-GAAP guidance metrics to their corresponding forward-looking GAAP equivalents is not available without unreasonable effort. However, it is important to note that material changes to reconciling items could have a significant effect on future GAAP results. Non-GAAP Gross Profit and Non-GAAP Gross Margin. For the periods presented, we define non-GAAP gross profit and non-GAAP gross margin as GAAP gross profit and GAAP gross margin, respectively, adjusted to exclude stock-based compensation, amortization of acquired intangibles and payroll taxes related to stock-based compensation. Segment-level non‑GAAP gross profit and non‑GAAP gross margin are calculated using the same methodology, but using (and excluding, as applicable) only revenue and expenses attributable to the applicable segment. Non‑GAAP Income (Loss) from Operations and Non‑GAAP Operating Margin. For the periods presented, we define non‑GAAP income (loss) from operations and non‑GAAP operating margin as GAAP income (loss) from operations and GAAP operating margin, respectively, adjusted to exclude, as applicable, stock-based compensation, amortization of acquired intangibles, loss on net assets divested, acquisition and divestiture related expenses, payroll taxes related to stock-based compensation, charitable contributions, restructuring costs, and impairment of long-lived assets.
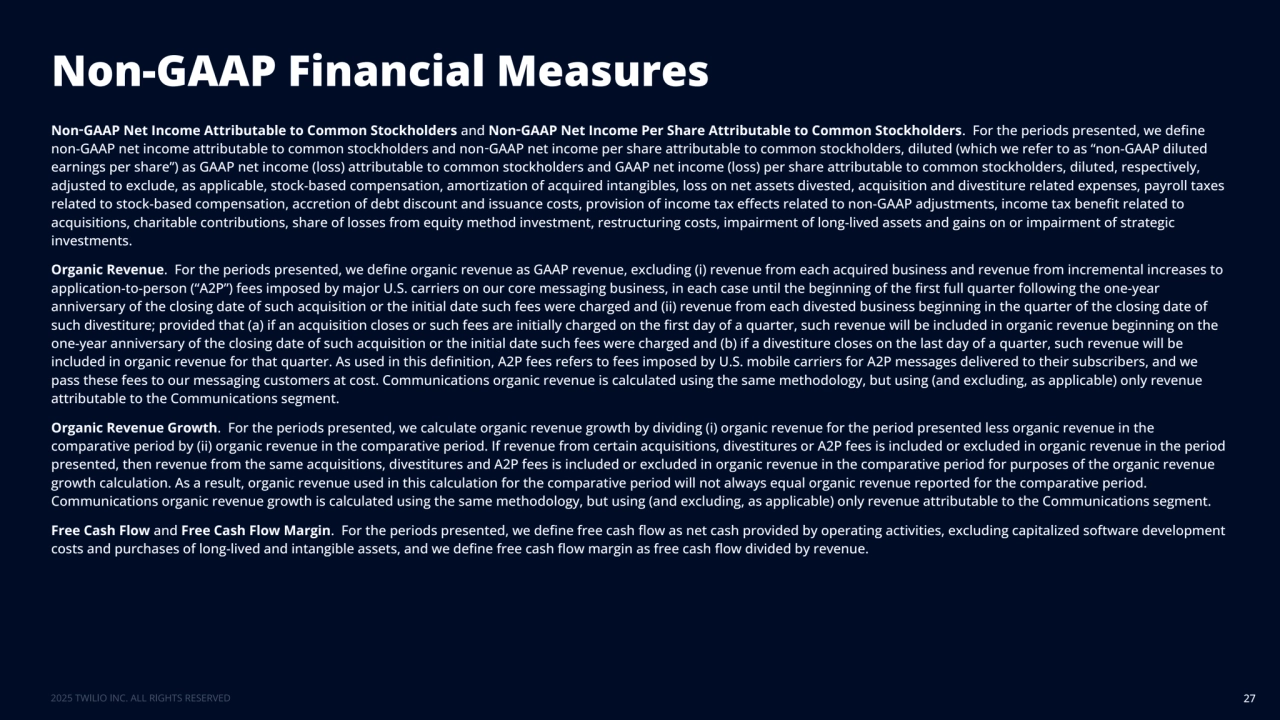
- 27. Non-GAAP Financial Measures 27 Non‑GAAP Net Income Attributable to Common Stockholders and Non‑GAAP Net Income Per Share Attributable to Common Stockholders. For the periods presented, we define non-GAAP net income attributable to common stockholders and non‑GAAP net income per share attributable to common stockholders, diluted (which we refer to as “non-GAAP diluted earnings per share”) as GAAP net income (loss) attributable to common stockholders and GAAP net income (loss) per share attributable to common stockholders, diluted, respectively, adjusted to exclude, as applicable, stock-based compensation, amortization of acquired intangibles, loss on net assets divested, acquisition and divestiture related expenses, payroll taxes related to stock-based compensation, accretion of debt discount and issuance costs, provision of income tax effects related to non-GAAP adjustments, income tax benefit related to acquisitions, charitable contributions, share of losses from equity method investment, restructuring costs, impairment of long-lived assets and gains on or impairment of strategic investments. Organic Revenue. For the periods presented, we define organic revenue as GAAP revenue, excluding (i) revenue from each acquired business and revenue from incremental increases to application-to-person (“A2P”) fees imposed by major U.S. carriers on our core messaging business, in each case until the beginning of the first full quarter following the one-year anniversary of the closing date of such acquisition or the initial date such fees were charged and (ii) revenue from each divested business beginning in the quarter of the closing date of such divestiture; provided that (a) if an acquisition closes or such fees are initially charged on the first day of a quarter, such revenue will be included in organic revenue beginning on the one-year anniversary of the closing date of such acquisition or the initial date such fees were charged and (b) if a divestiture closes on the last day of a quarter, such revenue will be included in organic revenue for that quarter. As used in this definition, A2P fees refers to fees imposed by U.S. mobile carriers for A2P messages delivered to their subscribers, and we pass these fees to our messaging customers at cost. Communications organic revenue is calculated using the same methodology, but using (and excluding, as applicable) only revenue attributable to the Communications segment. Organic Revenue Growth. For the periods presented, we calculate organic revenue growth by dividing (i) organic revenue for the period presented less organic revenue in the comparative period by (ii) organic revenue in the comparative period. If revenue from certain acquisitions, divestitures or A2P fees is included or excluded in organic revenue in the period presented, then revenue from the same acquisitions, divestitures and A2P fees is included or excluded in organic revenue in the comparative period for purposes of the organic revenue growth calculation. As a result, organic revenue used in this calculation for the comparative period will not always equal organic revenue reported for the comparative period. Communications organic revenue growth is calculated using the same methodology, but using (and excluding, as applicable) only revenue attributable to the Communications segment. Free Cash Flow and Free Cash Flow Margin. For the periods presented, we define free cash flow as net cash provided by operating activities, excluding capitalized software development costs and purchases of long-lived and intangible assets, and we define free cash flow margin as free cash flow divided by revenue.
- 28. 28
- 29. 29
- 30. 30
- 31. 31
- 32. 32
- 33. 33
- 34. 34