Understanding China's Trade Tariffs and Duties
 AI Summary
Key Insights
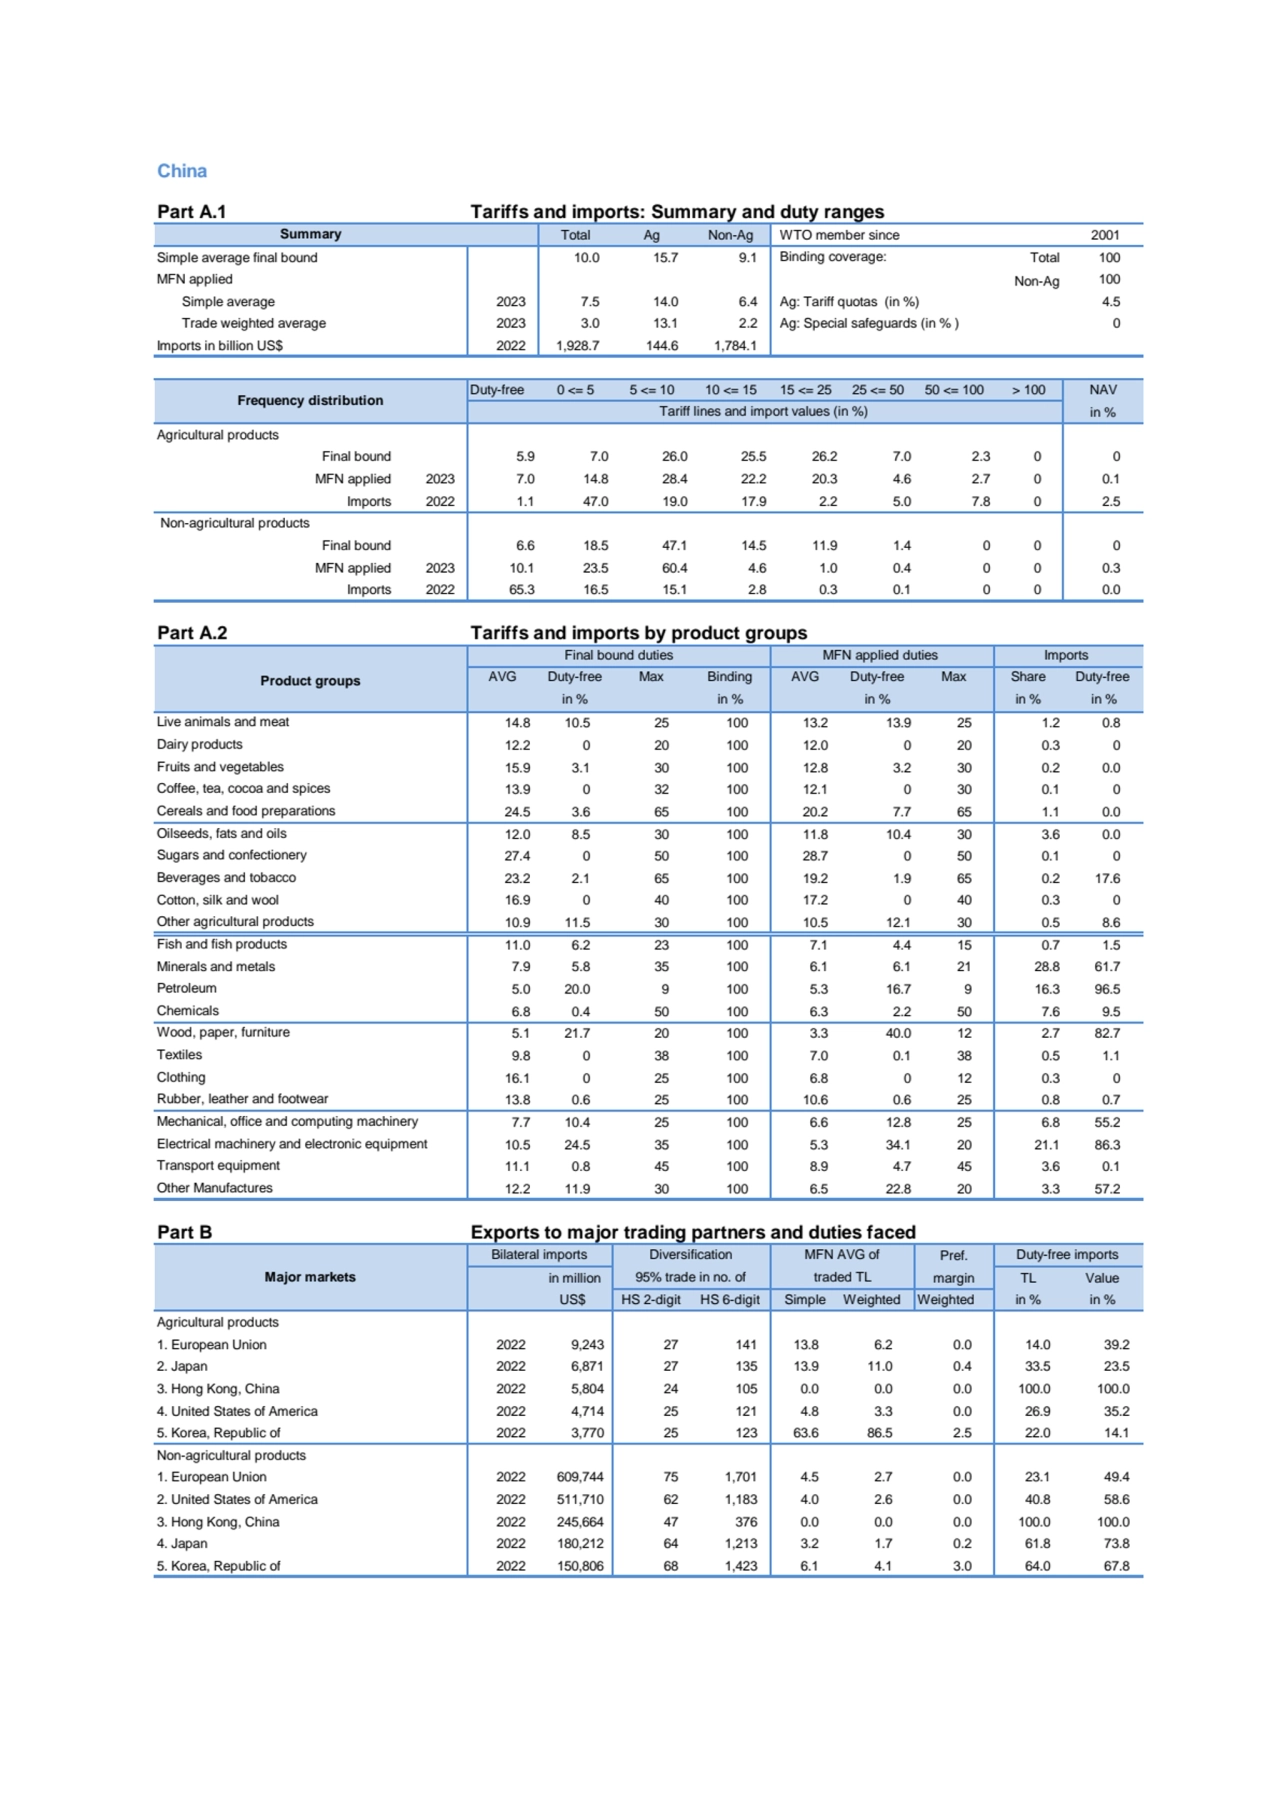
- China's average final bound tariff is 10.0%, with agriculture at 15.7% and non-agriculture at 9.1%.
- MFN applied tariffs in 2023 show simple averages of 7.5% overall, 14.0% for agriculture, and 6.4% for non-agriculture.
- Frequency distribution of tariff lines and import values are broken down into duty ranges for both agricultural and non-agricultural products.
- Tariffs and imports vary significantly by product group, with details on average duties, maximum duties, binding coverage, and import shares.
- Exports to major trading partners, including the EU, USA, Japan, and Korea, and duty-free imports are specified, including the percentage of duty-free imports.
Understanding China's Trade Tariffs and Duties
- 1. China Part A.1 Tariffs and imports: Summary and duty ranges Total Ag Non-Ag WTO member since 2001 Simple average final bound 10.0 15.7 9.1 Total 100 MFN applied Non-Ag 100 Simple average 2023 7.5 14.0 6.4 Ag: Tariff quotas (in %) 4.5 Trade weighted average 2023 3.0 13.1 2.2 Ag: Special safeguards (in % ) 0 Imports in billion US$ 2022 1,928.7 144.6 1,784.1 Duty-free 0 <= 5 5 <= 10 10 <= 15 15 <= 25 25 <= 50 50 <= 100 > 100 NAV in % Agricultural products Final bound 5.9 7.0 26.0 25.5 26.2 7.0 2.3 0 0 MFN applied 2023 7.0 14.8 28.4 22.2 20.3 4.6 2.7 0 0.1 Imports 2022 1.1 47.0 19.0 17.9 2.2 5.0 7.8 0 2.5 Non-agricultural products Final bound 6.6 18.5 47.1 14.5 11.9 1.4 0 0 0 MFN applied 2023 10.1 23.5 60.4 4.6 1.0 0.4 0 0 0.3 Imports 2022 65.3 16.5 15.1 2.8 0.3 0.1 0 0 0.0 Part A.2 Tariffs and imports by product groups AVG Duty-free Max Binding AVG Duty-free Max Share Duty-free in % in % in % in % in % 14.8 10.5 25 100 13.2 13.9 25 1.2 0.8 12.2 0 20 100 12.0 0 20 0.3 0 15.9 3.1 30 100 12.8 3.2 30 0.2 0.0 13.9 0 32 100 12.1 0 30 0.1 0 24.5 3.6 65 100 20.2 7.7 65 1.1 0.0 12.0 8.5 30 100 11.8 10.4 30 3.6 0.0 27.4 0 50 100 28.7 0 50 0.1 0 23.2 2.1 65 100 19.2 1.9 65 0.2 17.6 16.9 0 40 100 17.2 0 40 0.3 0 10.9 11.5 30 100 10.5 12.1 30 0.5 8.6 11.0 6.2 23 100 7.1 4.4 15 0.7 1.5 7.9 5.8 35 100 6.1 6.1 21 28.8 61.7 5.0 20.0 9 100 5.3 16.7 9 16.3 96.5 6.8 0.4 50 100 6.3 2.2 50 7.6 9.5 5.1 21.7 20 100 3.3 40.0 12 2.7 82.7 9.8 0 38 100 7.0 0.1 38 0.5 1.1 16.1 0 25 100 6.8 0 12 0.3 0 13.8 0.6 25 100 10.6 0.6 25 0.8 0.7 7.7 10.4 25 100 6.6 12.8 25 6.8 55.2 10.5 24.5 35 100 5.3 34.1 20 21.1 86.3 11.1 0.8 45 100 8.9 4.7 45 3.6 0.1 12.2 11.9 30 100 6.5 22.8 20 3.3 57.2 Part B Exports to major trading partners and duties faced Pref. in million margin TL Value US$ HS 2-digit HS 6-digit Simple Weighted Weighted in % in % Agricultural products 1. European Union 2022 9,243 27 141 13.8 6.2 0.0 14.0 39.2 2. Japan 2022 6,871 27 135 13.9 11.0 0.4 33.5 23.5 3. Hong Kong, China 2022 5,804 24 105 0.0 0.0 0.0 100.0 100.0 4. United States of America 2022 4,714 25 121 4.8 3.3 0.0 26.9 35.2 5. Korea, Republic of 2022 3,770 25 123 63.6 86.5 2.5 22.0 14.1 Non-agricultural products 1. European Union 2022 609,744 75 1,701 4.5 2.7 0.0 23.1 49.4 2. United States of America 2022 511,710 62 1,183 4.0 2.6 0.0 40.8 58.6 3. Hong Kong, China 2022 245,664 47 376 0.0 0.0 0.0 100.0 100.0 4. Japan 2022 180,212 64 1,213 3.2 1.7 0.2 61.8 73.8 5. Korea, Republic of 2022 150,806 68 1,423 6.1 4.1 3.0 64.0 67.8 Duty-free imports Mechanical, office and computing machinery Electrical machinery and electronic equipment Transport equipment Other Manufactures Final bound duties Minerals and metals Cotton, silk and wool Beverages and tobacco Fish and fish products Rubber, leather and footwear Tariff lines and import values (in %) Fruits and vegetables Coffee, tea, cocoa and spices Cereals and food preparations Other agricultural products Dairy products Product groups Live animals and meat MFN applied duties Imports Summary Diversification 95% trade in no. of traded TL MFN AVG of Petroleum Chemicals Wood, paper, furniture Binding coverage: Frequency distribution Major markets Bilateral imports Oilseeds, fats and oils Sugars and confectionery Textiles Clothing