VC Fund Example Portfolio Model v1.0.pdf
 AI Summary
Key Insights
- The document outlines the performance of a venture capital fund with a fund size of $20,000,000, invested across 40 companies.
- It details the capital deployment strategy, including the 1st check budget ($500,000) and percentage allocations for different stages (Series A).
- The model analyzes the portfolio's exit outcomes, categorizing investments by loss (0-1X), acquihire (1-5X), small win (5-10X), medium win (10-20X), big win (20-50X), and unicorn (50-100X+).
- The analysis includes key metrics such as average exit value, average equity, return value, and fund multiple for each exit category.
- The document concludes with the total return ($48,362,500), gross profit ($28,362,500), carry ($5,672,500), and net cash back to LPs ($42,690,000), providing an overview of the fund's financial performance.
Loading...
Loading...
Loading...
Loading...
Loading...
Loading...
VC Fund Example Portfolio Model v1.0.pdf
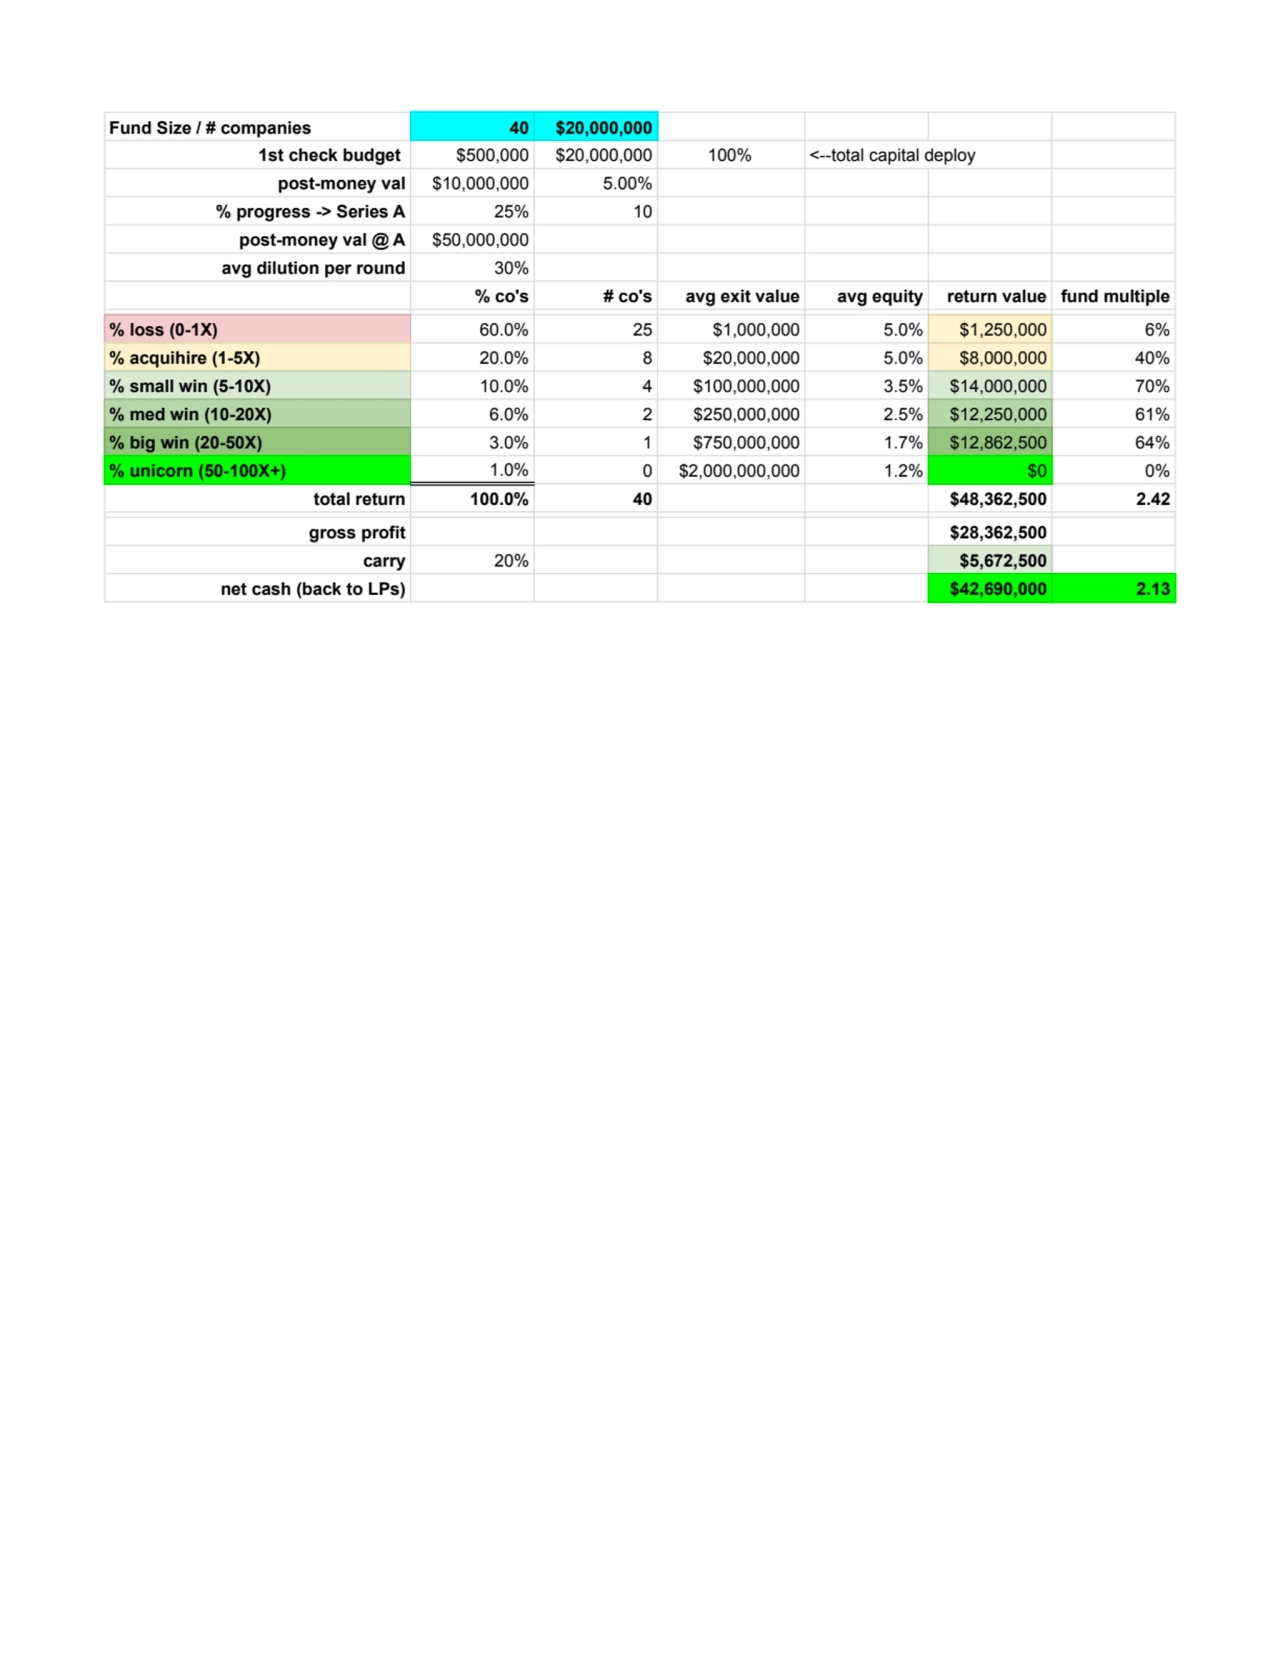
- 1. Fund Size / # companies 40 $20,000,000 1st check budget $500,000 $20,000,000 100% <--total capital deploy post-money val $10,000,000 5.00% % progress -> Series A 25% 10 post-money val @ A $50,000,000 avg dilution per round 30% % co's # co's avg exit value avg equity return value fund multiple % loss (0-1X) 60.0% 25 $1,000,000 5.0% $1,250,000 6% % acquihire (1-5X) 20.0% 8 $20,000,000 5.0% $8,000,000 40% % small win (5-10X) 10.0% 4 $100,000,000 3.5% $14,000,000 70% % med win (10-20X) 6.0% 2 $250,000,000 2.5% $12,250,000 61% % big win (20-50X) 3.0% 1 $750,000,000 1.7% $12,862,500 64% % unicorn (50-100X+) 1.0% 0 $2,000,000,000 1.2% $0 0% total return 100.0% 40 $48,362,500 2.42 gross profit $28,362,500 carry 20% $5,672,500 net cash (back to LPs) $42,690,000 2.13
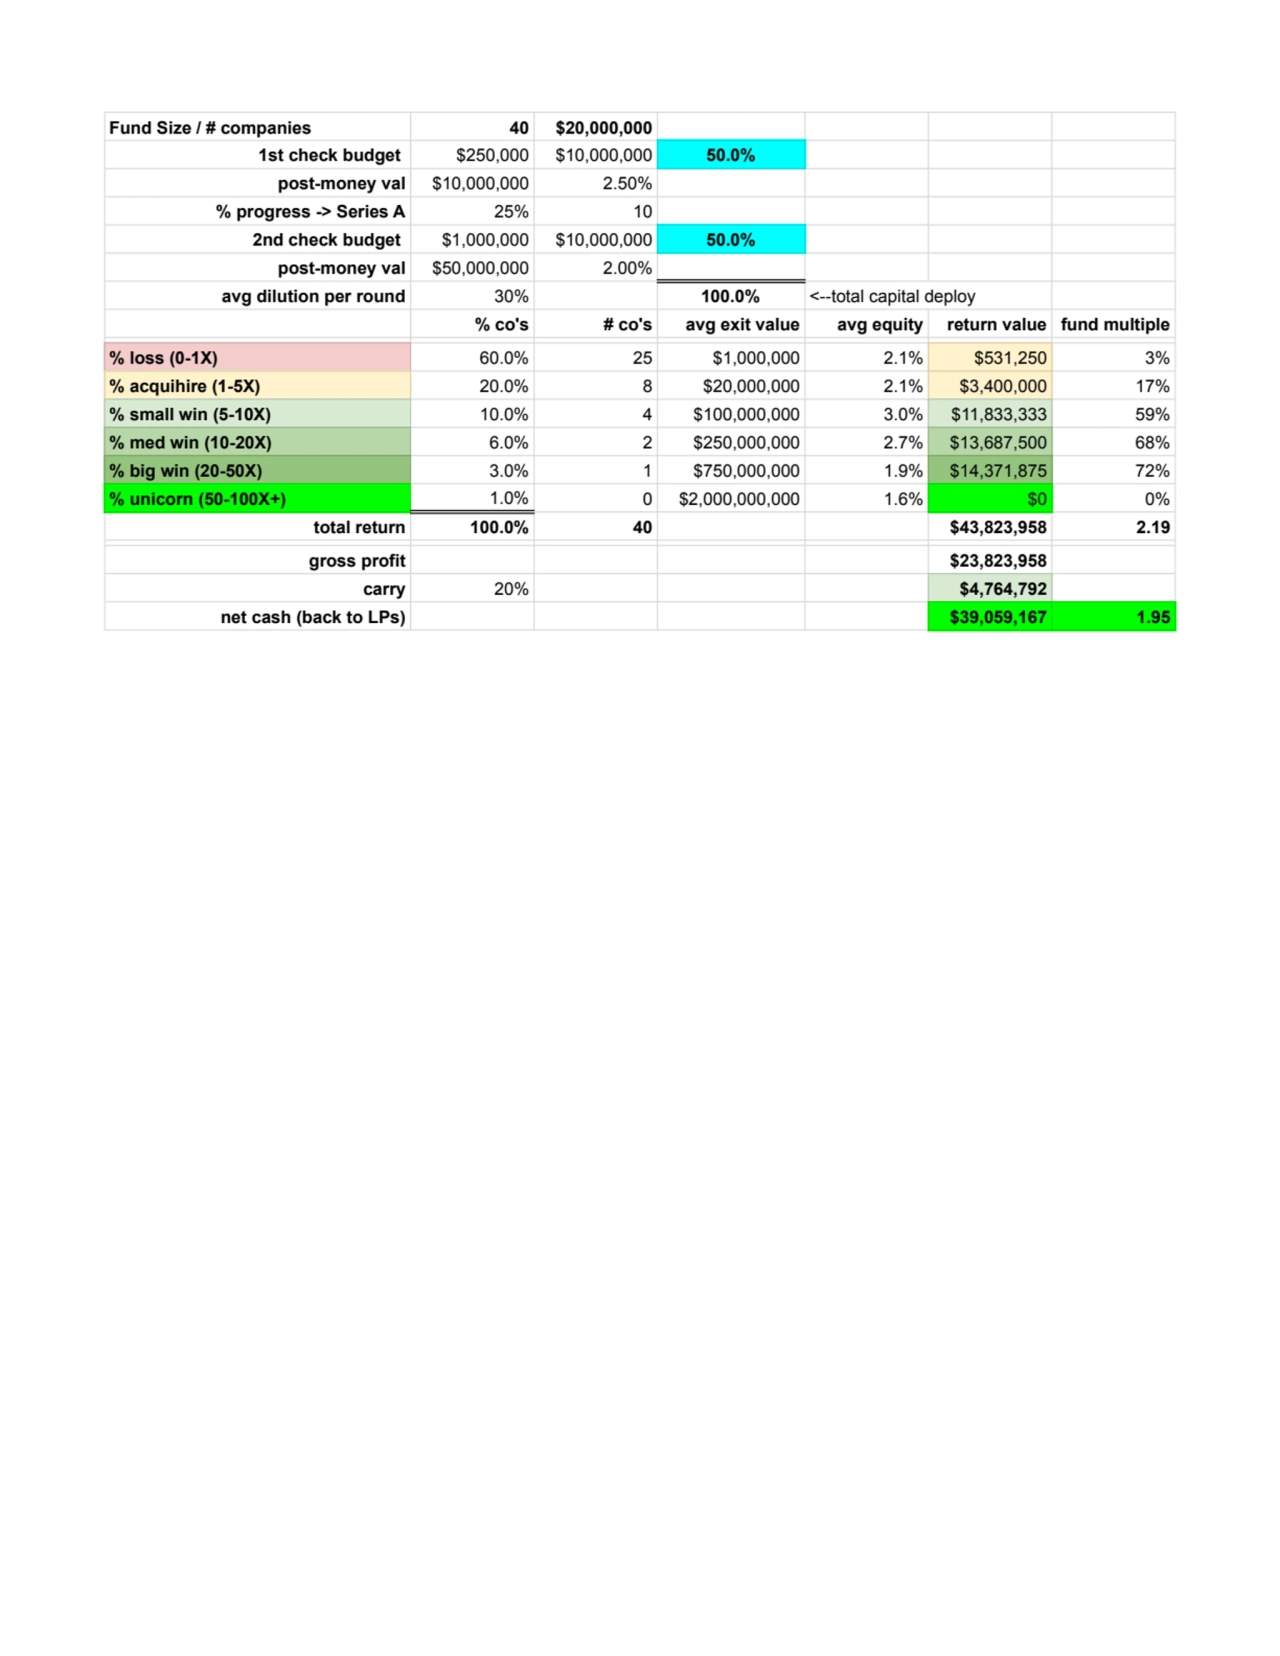
- 2. Fund Size / # companies 40 $20,000,000 1st check budget $250,000 $10,000,000 50.0% post-money val $10,000,000 2.50% % progress -> Series A 25% 10 2nd check budget $1,000,000 $10,000,000 50.0% post-money val $50,000,000 2.00% avg dilution per round 30% 100.0% <--total capital deploy % co's # co's avg exit value avg equity return value fund multiple % loss (0-1X) 60.0% 25 $1,000,000 2.1% $531,250 3% % acquihire (1-5X) 20.0% 8 $20,000,000 2.1% $3,400,000 17% % small win (5-10X) 10.0% 4 $100,000,000 3.0% $11,833,333 59% % med win (10-20X) 6.0% 2 $250,000,000 2.7% $13,687,500 68% % big win (20-50X) 3.0% 1 $750,000,000 1.9% $14,371,875 72% % unicorn (50-100X+) 1.0% 0 $2,000,000,000 1.6% $0 0% total return 100.0% 40 $43,823,958 2.19 gross profit $23,823,958 carry 20% $4,764,792 net cash (back to LPs) $39,059,167 1.95
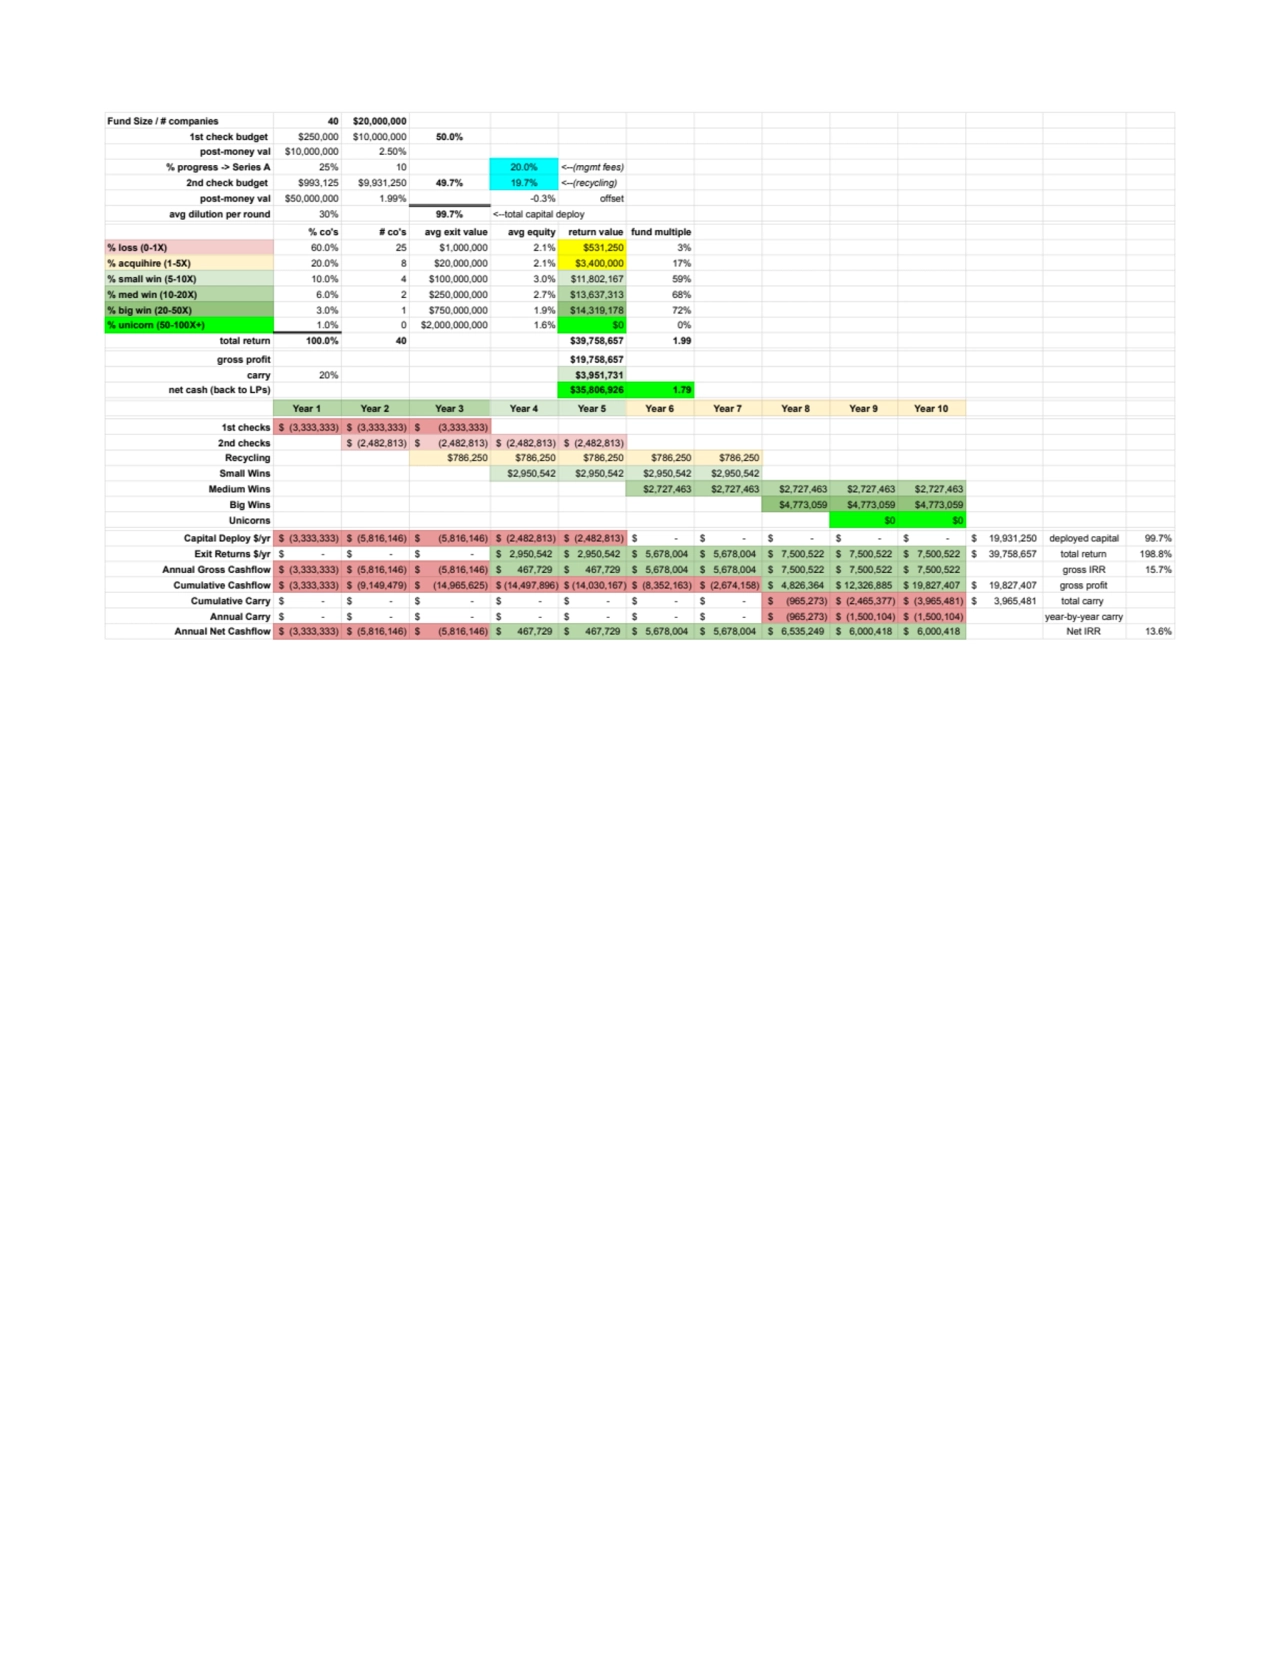
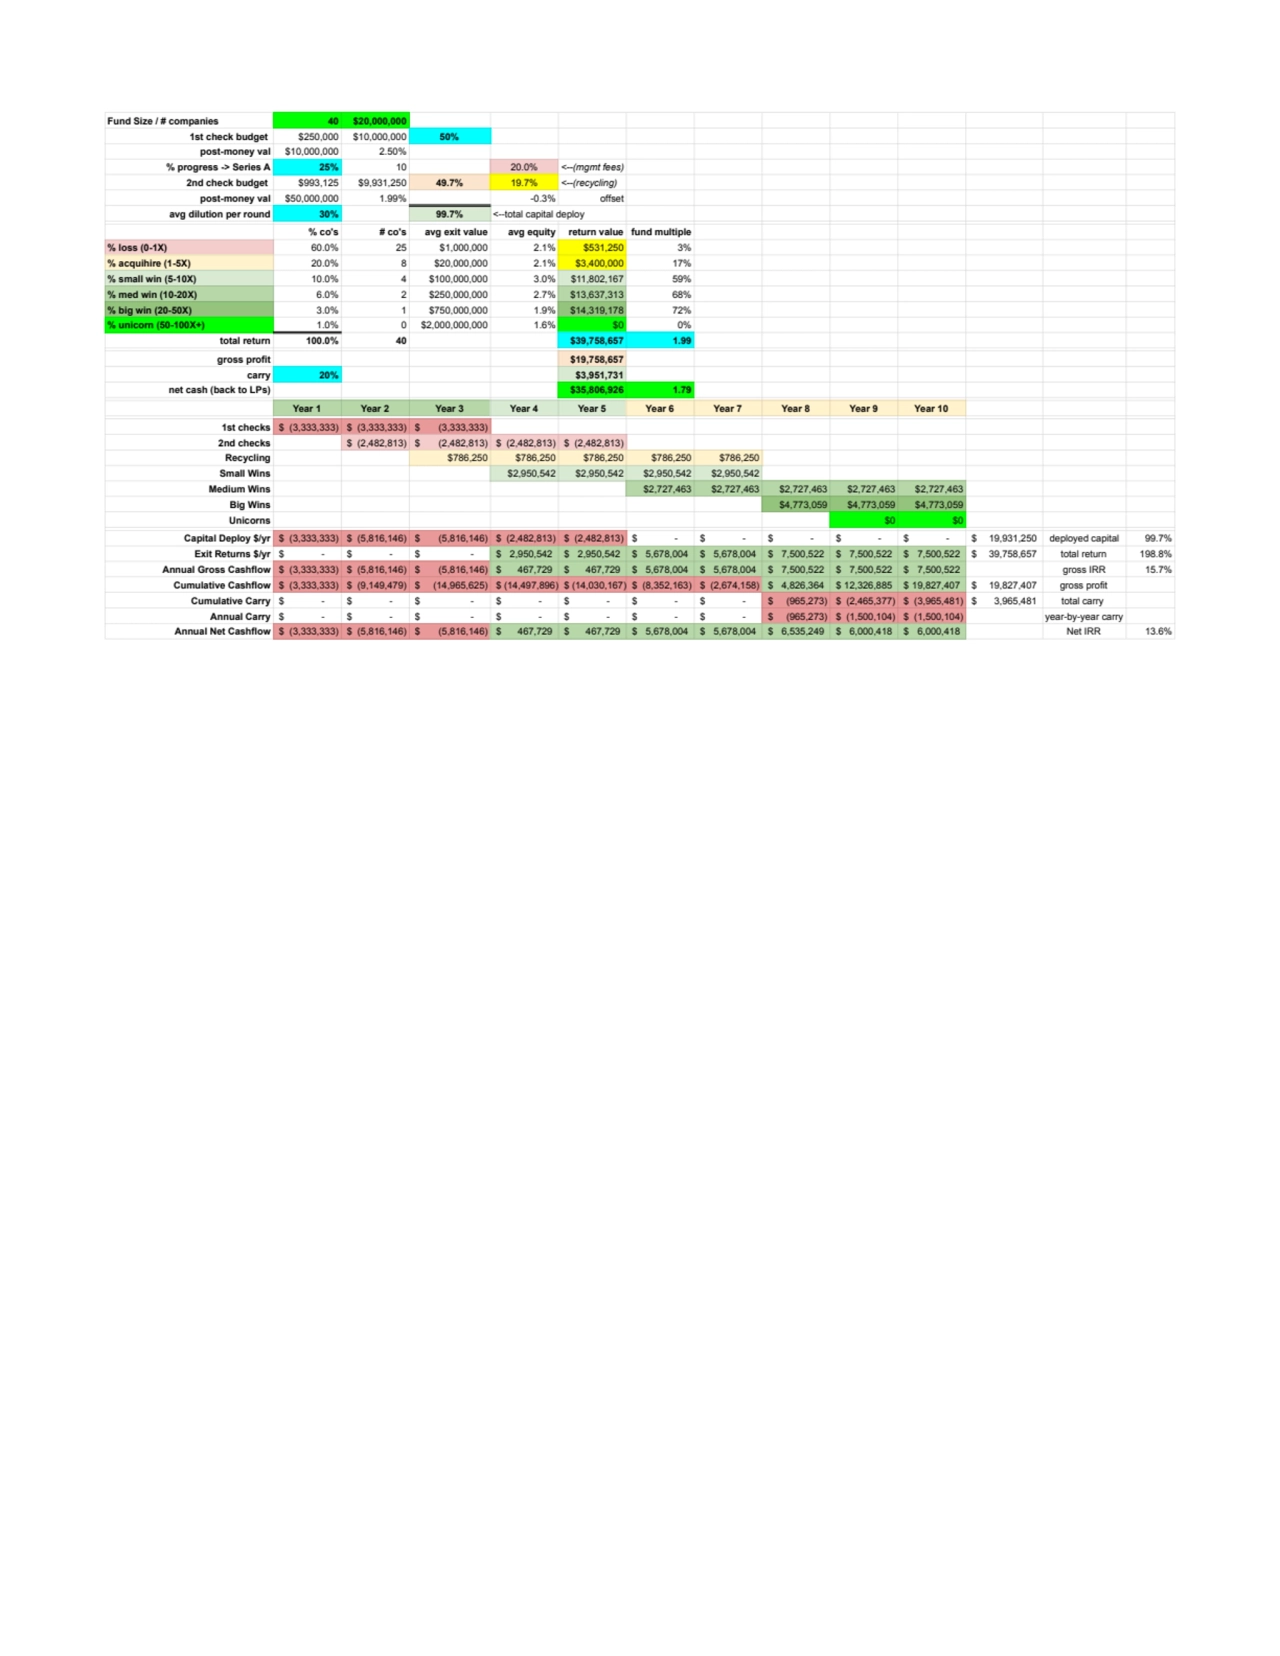
- 3. Fund Size / # companies 40 $20,000,000 1st check budget $250,000 $10,000,000 50.0% post-money val $10,000,000 2.50% % progress -> Series A 25% 10 20.0% <--(mgmt fees) 2nd check budget $993,125 $9,931,250 49.7% 19.7% <--(recycling) post-money val $50,000,000 1.99% -0.3% offset avg dilution per round 30% 99.7% <--total capital deploy % co's # co's avg exit value avg equity return value fund multiple % loss (0-1X) 60.0% 25 $1,000,000 2.1% $531,250 3% % acquihire (1-5X) 20.0% 8 $20,000,000 2.1% $3,400,000 17% % small win (5-10X) 10.0% 4 $100,000,000 3.0% $11,802,167 59% % med win (10-20X) 6.0% 2 $250,000,000 2.7% $13,637,313 68% % big win (20-50X) 3.0% 1 $750,000,000 1.9% $14,319,178 72% % unicorn (50-100X+) 1.0% 0 $2,000,000,000 1.6% $0 0% total return 100.0% 40 $39,758,657 1.99 gross profit $19,758,657 carry 20% $3,951,731 net cash (back to LPs) $35,806,926 1.79 Year 1 Year 2 Year 3 Year 4 Year 5 Year 6 Year 7 Year 8 Year 9 Year 10 1st checks ($ (3,333,333) ($ (3,333,333) ($ (3,333,333) 2nd checks ($ (2,482,813) ($ (2,482,813) ($ (2,482,813) ($ (2,482,813) Recycling $786,250 $786,250 $786,250 $786,250 $786,250 Small Wins $2,950,542 $2,950,542 $2,950,542 $2,950,542 Medium Wins $2,727,463 $2,727,463 $2,727,463 $2,727,463 $2,727,463 Big Wins $4,773,059 $4,773,059 $4,773,059 Unicorns $0 $0 Capital Deploy $/yr ($ (3,333,333) ($ (5,816,146) ($ (5,816,146) ($ (2,482,813) ($ (2,482,813) ($ - ) ($ - ) ($ - ) ($ - ) ($ - ) ($ 19,931,250) deployed capital 99.7% Exit Returns $/yr ($ - ) ($ - ) ($ - ) ($ 2,950,542) ($ 2,950,542) ($ 5,678,004) ($ 5,678,004) ($ 7,500,522) ($ 7,500,522) ($ 7,500,522) ($ 39,758,657) total return 198.8% Annual Gross Cashflow ($ (3,333,333) ($ (5,816,146) ($ (5,816,146) ($ 467,729) ($ 467,729) ($ 5,678,004) ($ 5,678,004) ($ 7,500,522) ($ 7,500,522) ($ 7,500,522) gross IRR 15.7% Cumulative Cashflow ($ (3,333,333) ($ (9,149,479) ($ (14,965,625) ($ (14,497,896) ($ (14,030,167) ($ (8,352,163) ($ (2,674,158) ($ 4,826,364) ($ 12,326,885) ($ 19,827,407) ($ 19,827,407) gross profit Cumulative Carry ($ - ) ($ - ) ($ - ) ($ - ) ($ - ) ($ - ) ($ - ) ($ (965,273) ($ (2,465,377) ($ (3,965,481) ($ 3,965,481) total carry Annual Carry ($ - ) ($ - ) ($ - ) ($ - ) ($ - ) ($ - ) ($ - ) ($ (965,273) ($ (1,500,104) ($ (1,500,104) year-by-year carry Annual Net Cashflow ($ (3,333,333) ($ (5,816,146) ($ (5,816,146) ($ 467,729) ($ 467,729) ($ 5,678,004) ($ 5,678,004) ($ 6,535,249) ($ 6,000,418) ($ 6,000,418) Net IRR 13.6%
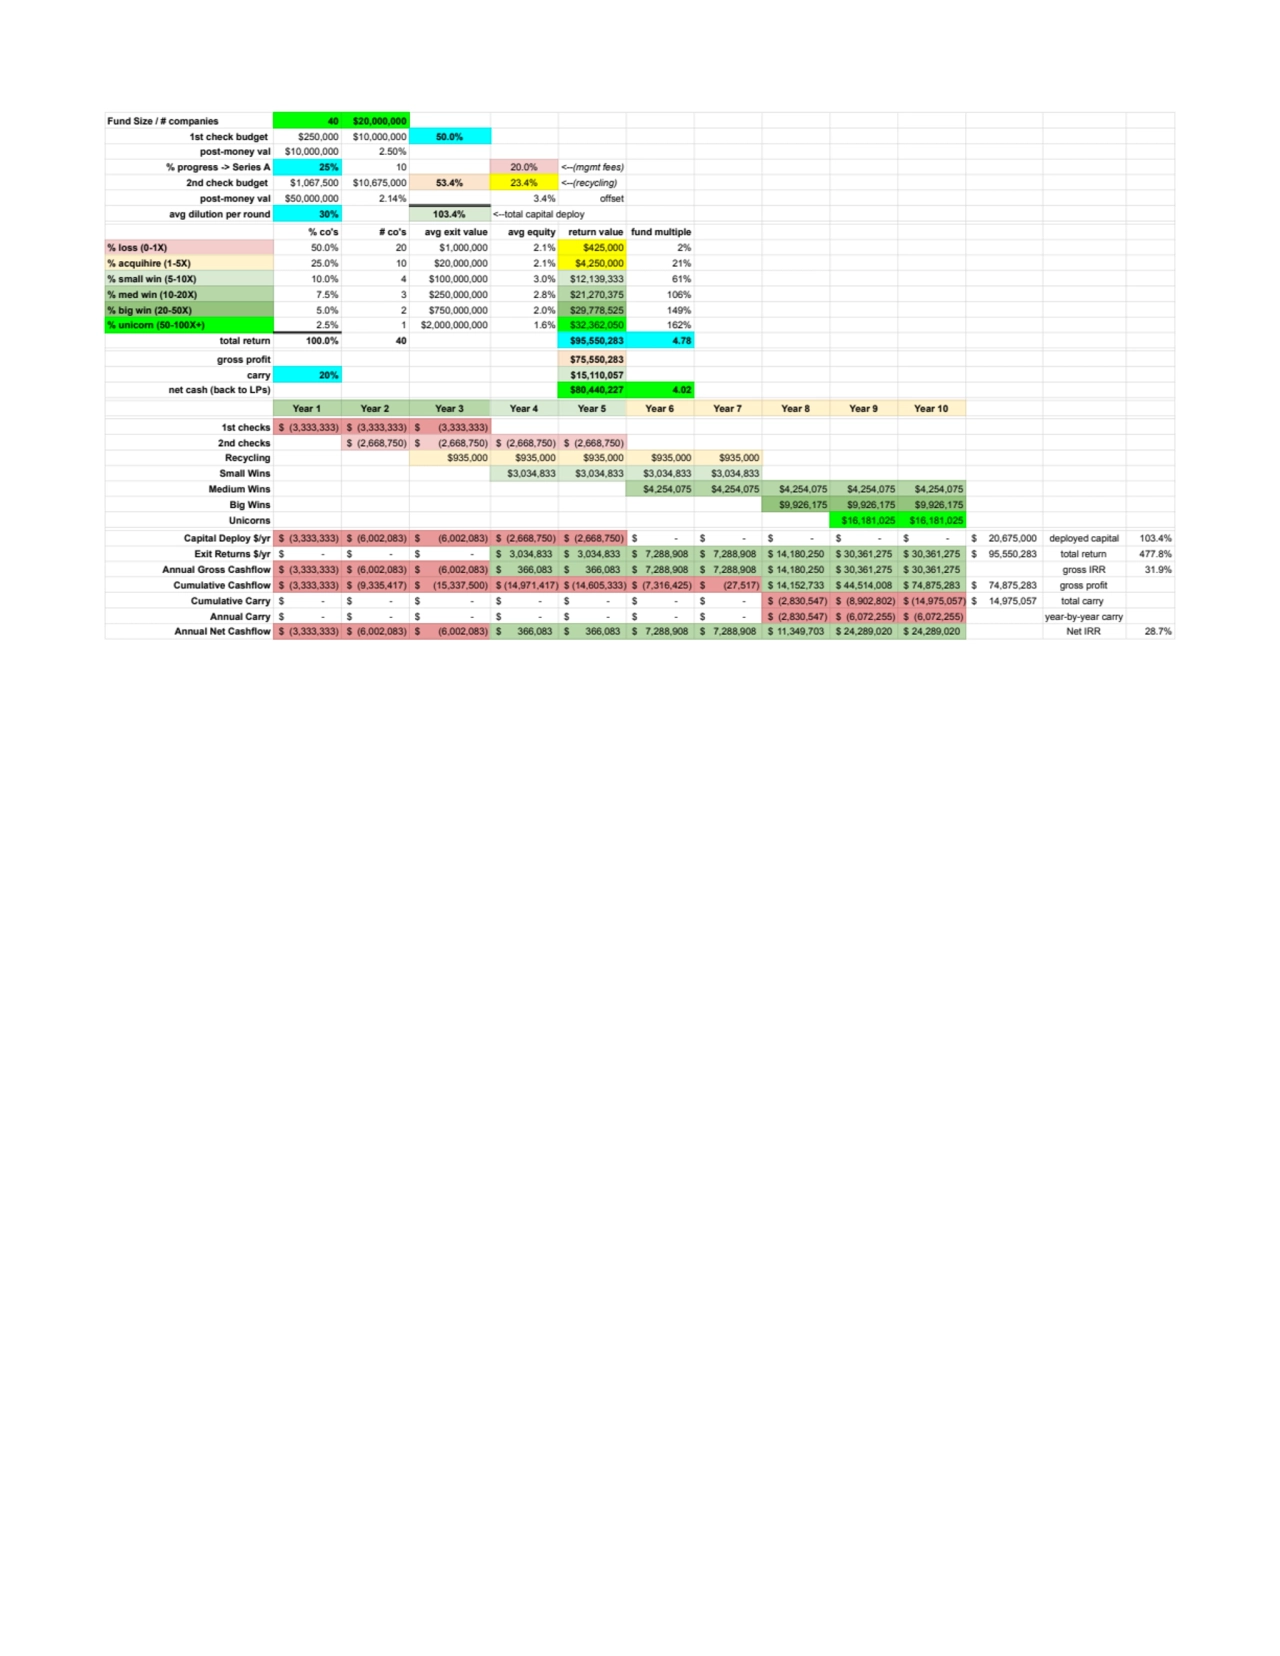
- 4. Fund Size / # companies 40 $20,000,000 1st check budget $250,000 $10,000,000 50.0% post-money val $10,000,000 2.50% % progress -> Series A 25% 10 20.0% <--(mgmt fees) 2nd check budget $1,067,500 $10,675,000 53.4% 23.4% <--(recycling) post-money val $50,000,000 2.14% 3.4% offset avg dilution per round 30% 103.4% <--total capital deploy % co's # co's avg exit value avg equity return value fund multiple % loss (0-1X) 50.0% 20 $1,000,000 2.1% $425,000 2% % acquihire (1-5X) 25.0% 10 $20,000,000 2.1% $4,250,000 21% % small win (5-10X) 10.0% 4 $100,000,000 3.0% $12,139,333 61% % med win (10-20X) 7.5% 3 $250,000,000 2.8% $21,270,375 106% % big win (20-50X) 5.0% 2 $750,000,000 2.0% $29,778,525 149% % unicorn (50-100X+) 2.5% 1 $2,000,000,000 1.6% $32,362,050 162% total return 100.0% 40 $95,550,283 4.78 gross profit $75,550,283 carry 20% $15,110,057 net cash (back to LPs) $80,440,227 4.02 Year 1 Year 2 Year 3 Year 4 Year 5 Year 6 Year 7 Year 8 Year 9 Year 10 1st checks ($ (3,333,333) ($ (3,333,333) ($ (3,333,333) 2nd checks ($ (2,668,750) ($ (2,668,750) ($ (2,668,750) ($ (2,668,750) Recycling $935,000 $935,000 $935,000 $935,000 $935,000 Small Wins $3,034,833 $3,034,833 $3,034,833 $3,034,833 Medium Wins $4,254,075 $4,254,075 $4,254,075 $4,254,075 $4,254,075 Big Wins $9,926,175 $9,926,175 $9,926,175 Unicorns $16,181,025 $16,181,025 Capital Deploy $/yr ($ (3,333,333) ($ (6,002,083) ($ (6,002,083) ($ (2,668,750) ($ (2,668,750) ($ - ) ($ - ) ($ - ) ($ - ) ($ - ) ($ 20,675,000) deployed capital 103.4% Exit Returns $/yr ($ - ) ($ - ) ($ - ) ($ 3,034,833) ($ 3,034,833) ($ 7,288,908) ($ 7,288,908) ($ 14,180,250) ($ 30,361,275) ($ 30,361,275) ($ 95,550,283) total return 477.8% Annual Gross Cashflow ($ (3,333,333) ($ (6,002,083) ($ (6,002,083) ($ 366,083) ($ 366,083) ($ 7,288,908) ($ 7,288,908) ($ 14,180,250) ($ 30,361,275) ($ 30,361,275) gross IRR 31.9% Cumulative Cashflow ($ (3,333,333) ($ (9,335,417) ($ (15,337,500) ($ (14,971,417) ($ (14,605,333) ($ (7,316,425) ($ (27,517) ($ 14,152,733) ($ 44,514,008) ($ 74,875,283) ($ 74,875,283) gross profit Cumulative Carry ($ - ) ($ - ) ($ - ) ($ - ) ($ - ) ($ - ) ($ - ) ($ (2,830,547) ($ (8,902,802) ($ (14,975,057) ($ 14,975,057) total carry Annual Carry ($ - ) ($ - ) ($ - ) ($ - ) ($ - ) ($ - ) ($ - ) ($ (2,830,547) ($ (6,072,255) ($ (6,072,255) year-by-year carry Annual Net Cashflow ($ (3,333,333) ($ (6,002,083) ($ (6,002,083) ($ 366,083) ($ 366,083) ($ 7,288,908) ($ 7,288,908) ($ 11,349,703) ($ 24,289,020) ($ 24,289,020) Net IRR 28.7%
- 5. Fund Size / # companies 40 $20,000,000 1st check budget $250,000 $10,000,000 50% post-money val $10,000,000 2.50% % progress -> Series A 25% 10 20.0% <--(mgmt fees) 2nd check budget $993,125 $9,931,250 49.7% 19.7% <--(recycling) post-money val $50,000,000 1.99% -0.3% offset avg dilution per round 30% 99.7% <--total capital deploy % co's # co's avg exit value avg equity return value fund multiple % loss (0-1X) 60.0% 25 $1,000,000 2.1% $531,250 3% % acquihire (1-5X) 20.0% 8 $20,000,000 2.1% $3,400,000 17% % small win (5-10X) 10.0% 4 $100,000,000 3.0% $11,802,167 59% % med win (10-20X) 6.0% 2 $250,000,000 2.7% $13,637,313 68% % big win (20-50X) 3.0% 1 $750,000,000 1.9% $14,319,178 72% % unicorn (50-100X+) 1.0% 0 $2,000,000,000 1.6% $0 0% total return 100.0% 40 $39,758,657 1.99 gross profit $19,758,657 carry 20% $3,951,731 net cash (back to LPs) $35,806,926 1.79 Year 1 Year 2 Year 3 Year 4 Year 5 Year 6 Year 7 Year 8 Year 9 Year 10 1st checks ($ (3,333,333) ($ (3,333,333) ($ (3,333,333) 2nd checks ($ (2,482,813) ($ (2,482,813) ($ (2,482,813) ($ (2,482,813) Recycling $786,250 $786,250 $786,250 $786,250 $786,250 Small Wins $2,950,542 $2,950,542 $2,950,542 $2,950,542 Medium Wins $2,727,463 $2,727,463 $2,727,463 $2,727,463 $2,727,463 Big Wins $4,773,059 $4,773,059 $4,773,059 Unicorns $0 $0 Capital Deploy $/yr ($ (3,333,333) ($ (5,816,146) ($ (5,816,146) ($ (2,482,813) ($ (2,482,813) ($ - ) ($ - ) ($ - ) ($ - ) ($ - ) ($ 19,931,250) deployed capital 99.7% Exit Returns $/yr ($ - ) ($ - ) ($ - ) ($ 2,950,542) ($ 2,950,542) ($ 5,678,004) ($ 5,678,004) ($ 7,500,522) ($ 7,500,522) ($ 7,500,522) ($ 39,758,657) total return 198.8% Annual Gross Cashflow ($ (3,333,333) ($ (5,816,146) ($ (5,816,146) ($ 467,729) ($ 467,729) ($ 5,678,004) ($ 5,678,004) ($ 7,500,522) ($ 7,500,522) ($ 7,500,522) gross IRR 15.7% Cumulative Cashflow ($ (3,333,333) ($ (9,149,479) ($ (14,965,625) ($ (14,497,896) ($ (14,030,167) ($ (8,352,163) ($ (2,674,158) ($ 4,826,364) ($ 12,326,885) ($ 19,827,407) ($ 19,827,407) gross profit Cumulative Carry ($ - ) ($ - ) ($ - ) ($ - ) ($ - ) ($ - ) ($ - ) ($ (965,273) ($ (2,465,377) ($ (3,965,481) ($ 3,965,481) total carry Annual Carry ($ - ) ($ - ) ($ - ) ($ - ) ($ - ) ($ - ) ($ - ) ($ (965,273) ($ (1,500,104) ($ (1,500,104) year-by-year carry Annual Net Cashflow ($ (3,333,333) ($ (5,816,146) ($ (5,816,146) ($ 467,729) ($ 467,729) ($ 5,678,004) ($ 5,678,004) ($ 6,535,249) ($ 6,000,418) ($ 6,000,418) Net IRR 13.6%
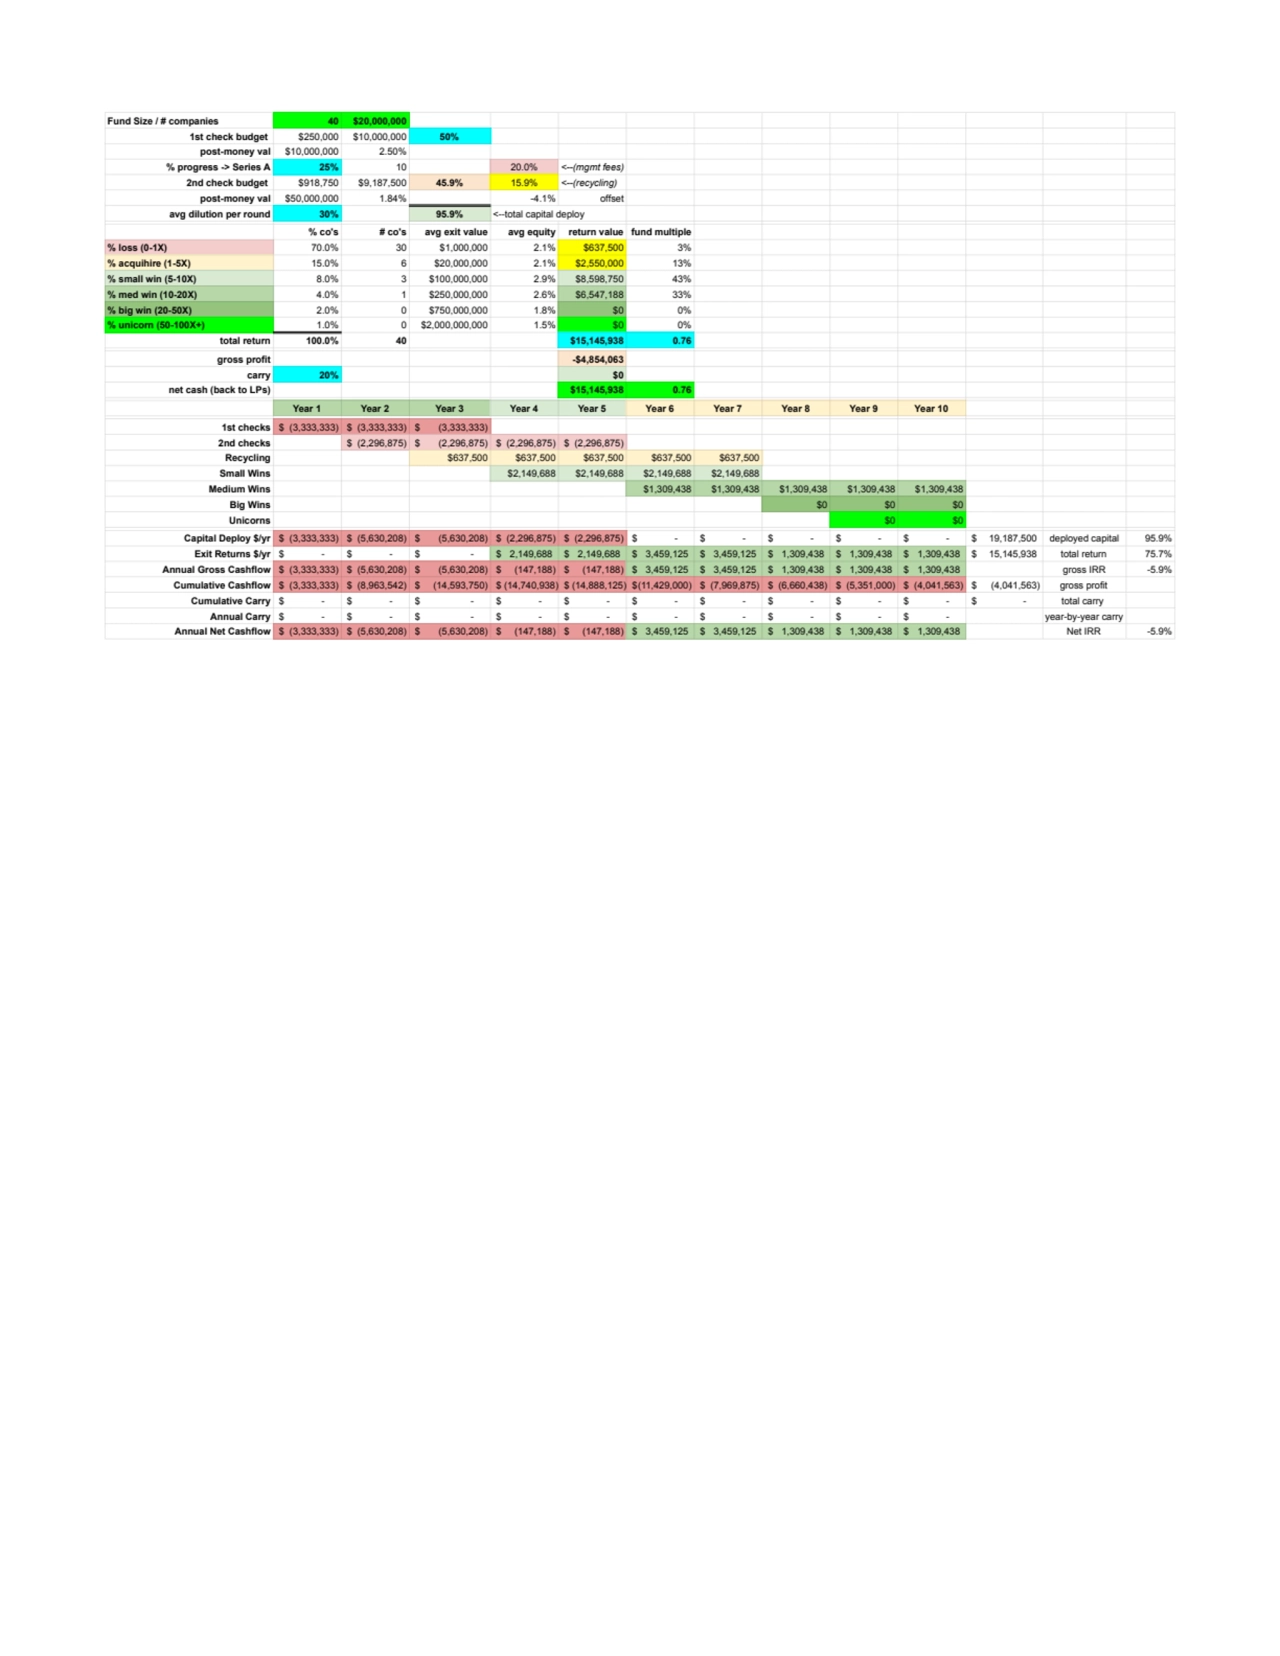
- 6. Fund Size / # companies 40 $20,000,000 1st check budget $250,000 $10,000,000 50% post-money val $10,000,000 2.50% % progress -> Series A 25% 10 20.0% <--(mgmt fees) 2nd check budget $918,750 $9,187,500 45.9% 15.9% <--(recycling) post-money val $50,000,000 1.84% -4.1% offset avg dilution per round 30% 95.9% <--total capital deploy % co's # co's avg exit value avg equity return value fund multiple % loss (0-1X) 70.0% 30 $1,000,000 2.1% $637,500 3% % acquihire (1-5X) 15.0% 6 $20,000,000 2.1% $2,550,000 13% % small win (5-10X) 8.0% 3 $100,000,000 2.9% $8,598,750 43% % med win (10-20X) 4.0% 1 $250,000,000 2.6% $6,547,188 33% % big win (20-50X) 2.0% 0 $750,000,000 1.8% $0 0% % unicorn (50-100X+) 1.0% 0 $2,000,000,000 1.5% $0 0% total return 100.0% 40 $15,145,938 0.76 gross profit -$4,854,063 carry 20% $0 net cash (back to LPs) $15,145,938 0.76 Year 1 Year 2 Year 3 Year 4 Year 5 Year 6 Year 7 Year 8 Year 9 Year 10 1st checks ($ (3,333,333) ($ (3,333,333) ($ (3,333,333) 2nd checks ($ (2,296,875) ($ (2,296,875) ($ (2,296,875) ($ (2,296,875) Recycling $637,500 $637,500 $637,500 $637,500 $637,500 Small Wins $2,149,688 $2,149,688 $2,149,688 $2,149,688 Medium Wins $1,309,438 $1,309,438 $1,309,438 $1,309,438 $1,309,438 Big Wins $0 $0 $0 Unicorns $0 $0 Capital Deploy $/yr ($ (3,333,333) ($ (5,630,208) ($ (5,630,208) ($ (2,296,875) ($ (2,296,875) ($ - ) ($ - ) ($ - ) ($ - ) ($ - ) ($ 19,187,500) deployed capital 95.9% Exit Returns $/yr ($ - ) ($ - ) ($ - ) ($ 2,149,688) ($ 2,149,688) ($ 3,459,125) ($ 3,459,125) ($ 1,309,438) ($ 1,309,438) ($ 1,309,438) ($ 15,145,938) total return 75.7% Annual Gross Cashflow ($ (3,333,333) ($ (5,630,208) ($ (5,630,208) ($ (147,188) ($ (147,188) ($ 3,459,125) ($ 3,459,125) ($ 1,309,438) ($ 1,309,438) ($ 1,309,438) gross IRR -5.9% Cumulative Cashflow ($ (3,333,333) ($ (8,963,542) ($ (14,593,750) ($ (14,740,938) ($ (14,888,125) ($(11,429,000) ($ (7,969,875) ($ (6,660,438) ($ (5,351,000) ($ (4,041,563) ($ (4,041,563) gross profit Cumulative Carry ($ - ) ($ - ) ($ - ) ($ - ) ($ - ) ($ - ) ($ - ) ($ - ) ($ - ) ($ - ) ($ - ) total carry Annual Carry ($ - ) ($ - ) ($ - ) ($ - ) ($ - ) ($ - ) ($ - ) ($ - ) ($ - ) ($ - ) year-by-year carry Annual Net Cashflow ($ (3,333,333) ($ (5,630,208) ($ (5,630,208) ($ (147,188) ($ (147,188) ($ 3,459,125) ($ 3,459,125) ($ 1,309,438) ($ 1,309,438) ($ 1,309,438) Net IRR -5.9%