Warby Parker: Second Quarter 2025 Earnings Report
 AI Summary
Key Insights
- 📈 Financial Highlights: Warby Parker reports Q2 2025 net revenue of $214M, a 14% increase YoY.
- 🛒 Retail Expansion: The brand has 298 stores, with potential for 900+ locations in the US and Canada.
- 👓 Eyewear Innovation: High-quality prescription eyewear starting at $95, pioneering a direct-to-consumer vision care model.
- 🤝 Customer Loyalty: Sales retention rates show a strong customer base, with 80% retention after 36 months.
- 🎯 Outlook: Projected full year 2025 net revenue between $880M and $888M, 14-15% YoY growth.


Warby Parker: Second Quarter 2025 Earnings Report
- 1. Speakers: DAVE GILBOA | Co-Founder & Co-CEO NEIL BLUMENTHAL | Co-Founder & Co-CEO STEVE MILLER | SVP & Chief Financial Officer Speakers: DAVE GILBOA | Co-Founder & Co-CEO NEIL BLUMENTHAL | Co-Founder & Co-CEO STEVE MILLER | SVP & Chief Financial Officer Second Quarter 2025 Earnings Report
- 2. This presentation contains ÿorward-lookinĀ statements within the meaninĀ oÿ Section 27A oÿ the Securities Act oÿ 1933, as amended, and Section 21E oÿ the Securities ExchanĀe Act oÿ 1934, as amended. These statements may relate to, but are not limited to, expectations oÿ ÿuture operatinĀ results or financial perÿormance, includinĀ expectations reĀardinĀ achievinĀ profitability and Ārowth in our e-commerce channel, deliverinĀ stakeholder value, ĀrowinĀ market share, and our GAAP and non-GAAP Āuidance ÿor the quarter endinĀ September 30, 2025, and year endinĀ December 31, 2025; expectations reĀardinĀ the number oÿ new store openinĀs durinĀ the year endinĀ December 31, 2025; manaĀement’s plans, priorities, initiatives, and strateĀies; expectations reĀardinĀ Ārowth oÿ our business; and expectations reĀardinĀ our ability to mitiĀate the impacts oÿ existinĀ or new tariÿÿs. Forward-lookinĀ statements are inherently subject to risks and uncertainties, some oÿ which cannot be predicted or quantified. In some cases, you can identiÿy ÿorward-lookinĀ statements because they contain words such as “anticipate,” “believe,” “contemplate,” “continue,” “could,” “estimate,” “expect,” “intend,” “may,” “plan,” “potential,” “predict,” “project,” “should,” “tarĀet,” “toward,” “will,” or “would,” or the neĀative oÿ these words or other similar terms or expressions. You should not put undue reliance on any ÿorward-lookinĀ statements. Forward-lookinĀ statements are based on inÿormation available at the time those statements are made and are based on current expectations, estimates, ÿorecasts, and projections as well as the belieÿs and assumptions oÿ manaĀement as oÿ that time with respect to ÿuture events. These statements are subject to risks and uncertainties, many oÿ which involve ÿactors or circumstances that are beyond our control, that could cause actual perÿormance or results to diÿÿer materially ÿrom those expressed in or suĀĀested by the ÿorward-lookinĀ statements. Additional inÿormation reĀardinĀ these and other risks and uncertainties is included in our SEC filinĀs, includinĀ our Annual Report on Form 10-K ÿor the year ended December 31, 2024, and our Quarterly Reports on Form 10-Q. Forward-lookinĀ statements should not be read as a Āuarantee oÿ ÿuture perÿormance or results. Except as required by law, we do not undertake any obliĀation to publicly update or revise any ÿorward-lookinĀ statement, whether as a result oÿ new inÿormation, ÿuture developments, or otherwise. In addition, this presentation contains certain “non-GAAP financial terms.” The non-GAAP measures are presented ÿor supplemental inÿormational purposes only. Definitions and reconciliations to the most directly comparable financial measure calculated and presented in accordance with GAAP are provided in the appendix to this presentation. AlthouĀh we provide ÿorecasts ÿor certain non-GAAP financial measures, we are not able to ÿorecast the most directly comparable measures calculated and presented in accordance with GAAP without unreasonable eÿÿorts due to the uncertainty and potential variability oÿ the reconcilinĀ items. Forward-Looking Statements / Non-GAAP Financial Measures
- 3. Since our founding, we’ve pioneered ideas, designed products, and developed technologies that help people see.
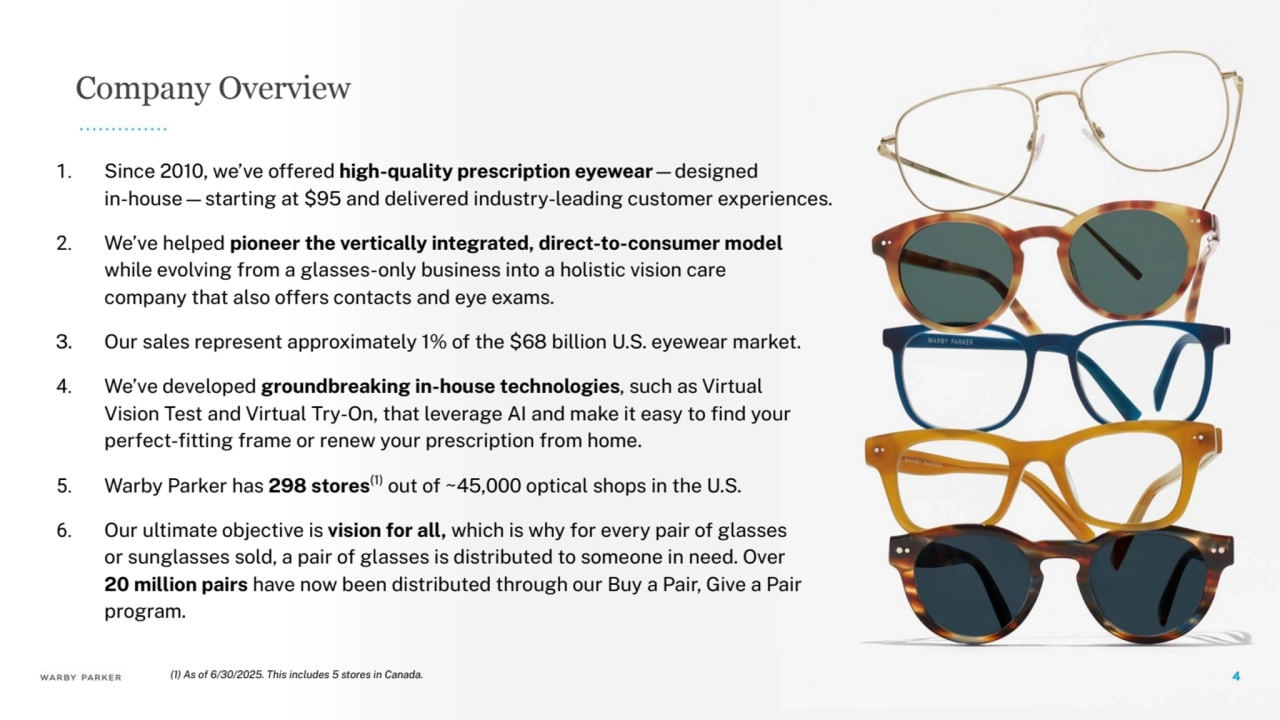
- 4. 1. Since 2010, we’ve oÿÿered hiĀh-quality prescription eyewear—desiĀned in-house—startinĀ at $95 and delivered industry-leadinĀ customer experiences. 2. We’ve helped pioneer the vertically inteĀrated, direct-to-consumer model while evolvinĀ ÿrom a Ālasses-only business into a holistic vision care company that also oÿÿers contacts and eye exams. 3. Our sales represent approximately 1% oÿ the $68 billion U.S. eyewear market. 4. We’ve developed ĀroundbreakinĀ in-house technoloĀies, such as Virtual Vision Test and Virtual Try-On, that leveraĀe AI and make it easy to find your perÿect-fittinĀ ÿrame or renew your prescription ÿrom home. 5. Warby Parker has 298 stores(1) out oÿ ~45,000 optical shops in the U.S. 6. Our ultimate objective is vision ÿor all, which is why ÿor every pair oÿ Ālasses or sunĀlasses sold, a pair oÿ Ālasses is distributed to someone in need. Over 20 million pairs have now been distributed throuĀh our Buy a Pair, Give a Pair proĀram. (1) As oÿ 6/30/2025. This includes 5 stores in Canada. Company Overview
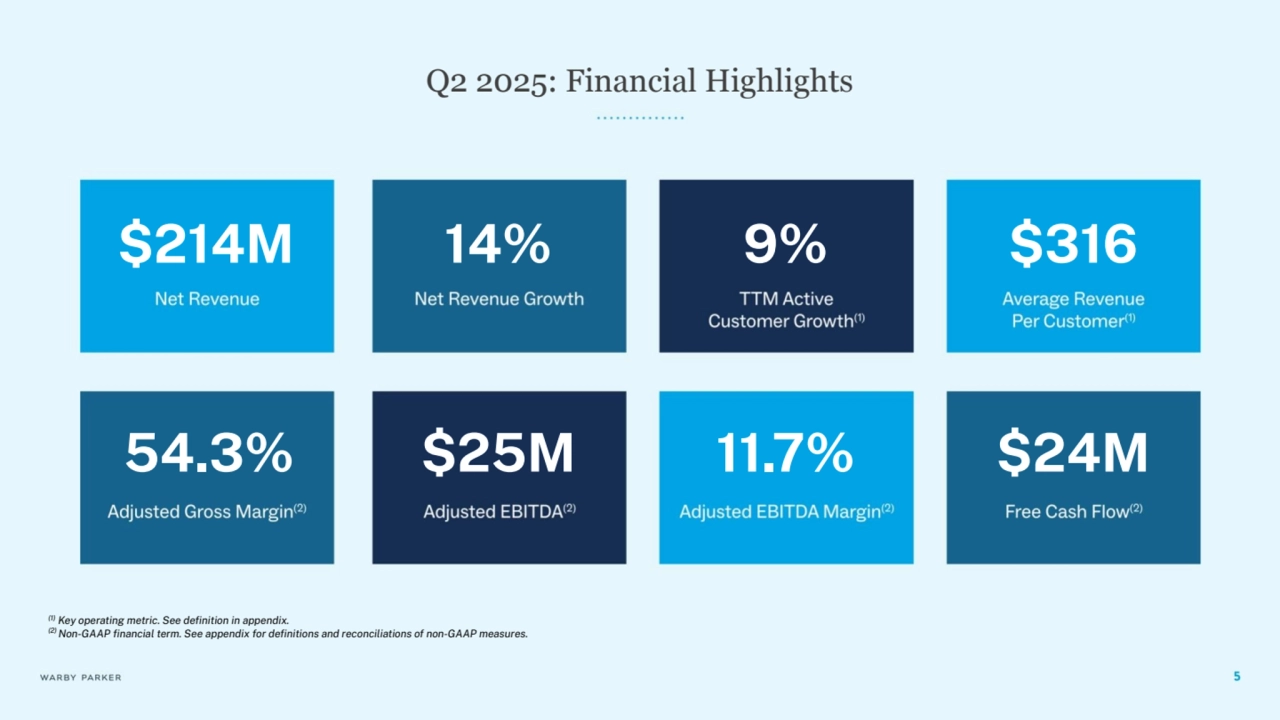
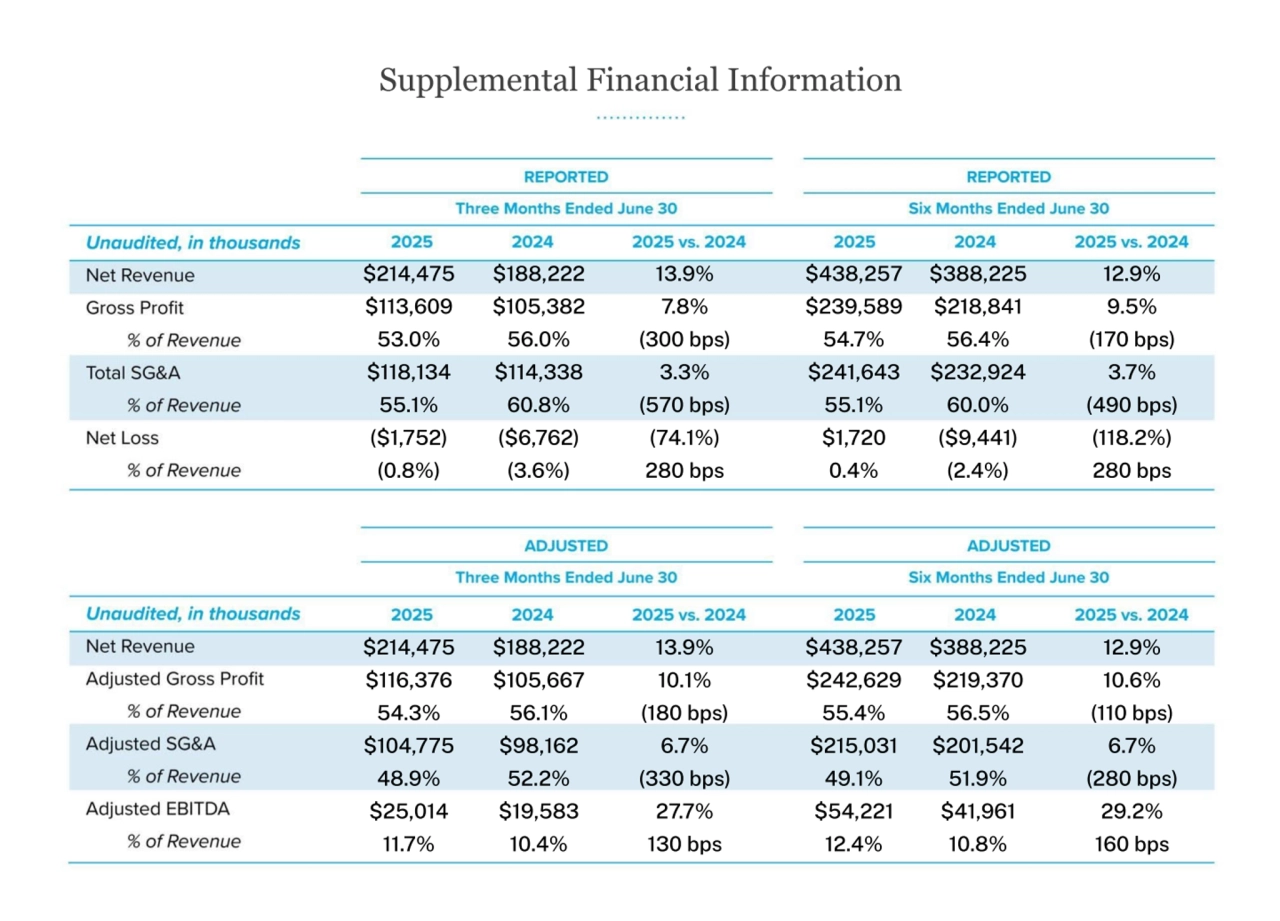
- 5. Q2 2025: Financial Highlights $214M 14% 9% $316 54.3% $25M 11.7% $24M (1) Key operatinĀ metric. See definition in appendix. (2) Non-GAAP financial term. See appendix ÿor definitions and reconciliations oÿ non-GAAP measures.
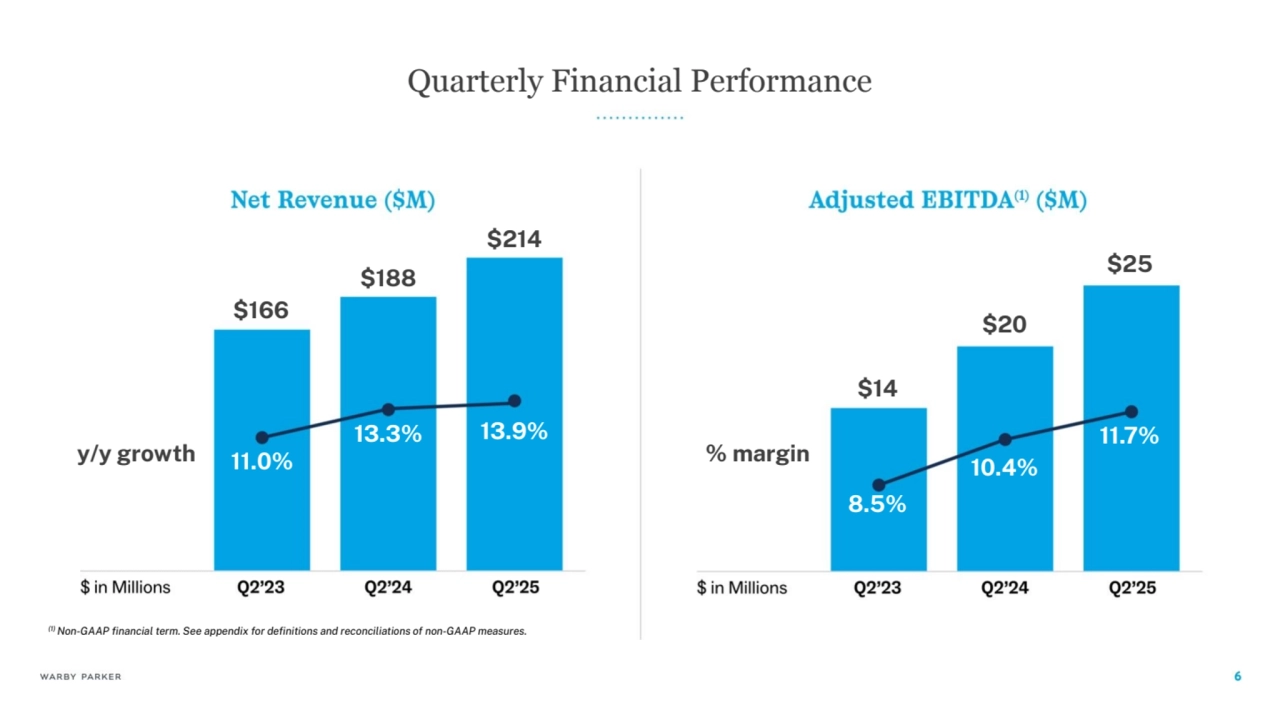
- 6. Quarterly Financial Performance $166 $188 $214 11.0% 13.3% 13.9% $14 $20 $25 8.5% 10.4% 11.7% y/y Ārowth % marĀin (1) Non-GAAP financial term. See appendix ÿor definitions and reconciliations oÿ non-GAAP measures.
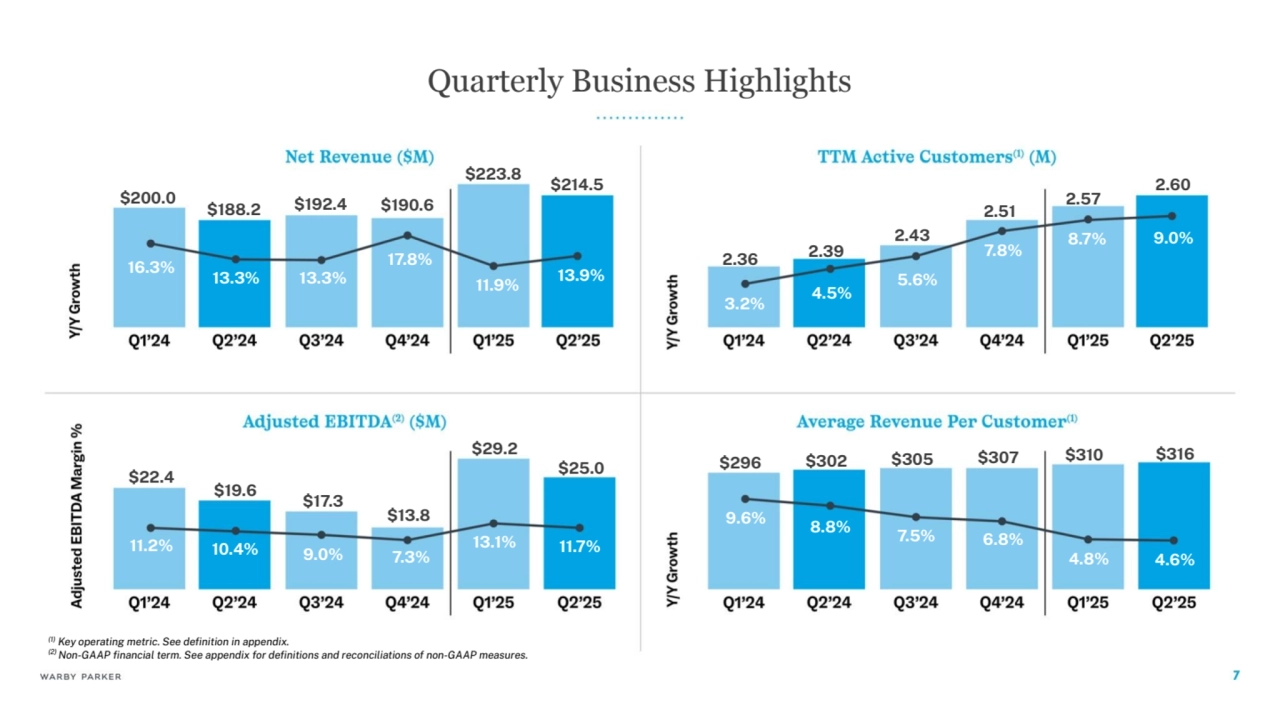
- 7. Quarterly Business Highlights (1) Key operatinĀ metric. See definition in appendix. (2) Non-GAAP financial term. See appendix ÿor definitions and reconciliations oÿ non-GAAP measures. $223.8 11.9% $190.6 17.8% $188.2 $192.4 $200.0 16.3% 13.3% 13.3% $22.4 11.2% $19.6 10.4% 9.0% 7.3% 13.1% $17.3 $13.8 $29.2 2.36 2.39 2.43 2.51 2.57 3.2% 4.5% 5.6% 7.8% 8.7% $296 $302 $305 $307 $310 9.6% 8.8% 7.5% 6.8% 4.8% $214.5 13.9% $25.0 11.7% $316 4.6% 2.60 9.0%
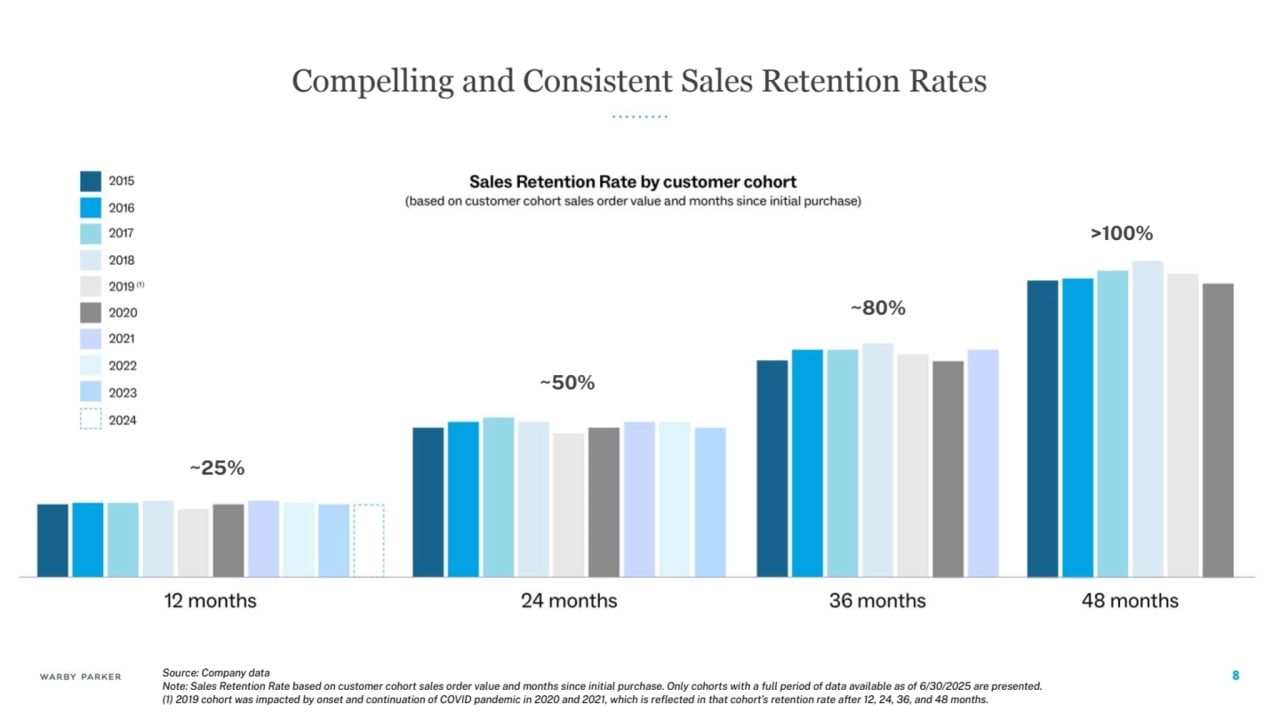
- 8. Compelling and Consistent Sales Retention Rates Source: Company data Note: Sales Retention Rate based on customer cohort sales order value and months since initial purchase. Only cohorts with a ÿull period oÿ data available as oÿ 6/30/2025 are presented. (1) 2019 cohort was impacted by onset and continuation oÿ COVID pandemic in 2020 and 2021, which is reflected in that cohort’s retention rate aÿter 12, 24, 36, and 48 months. ~25% ~50% ~80% >100%
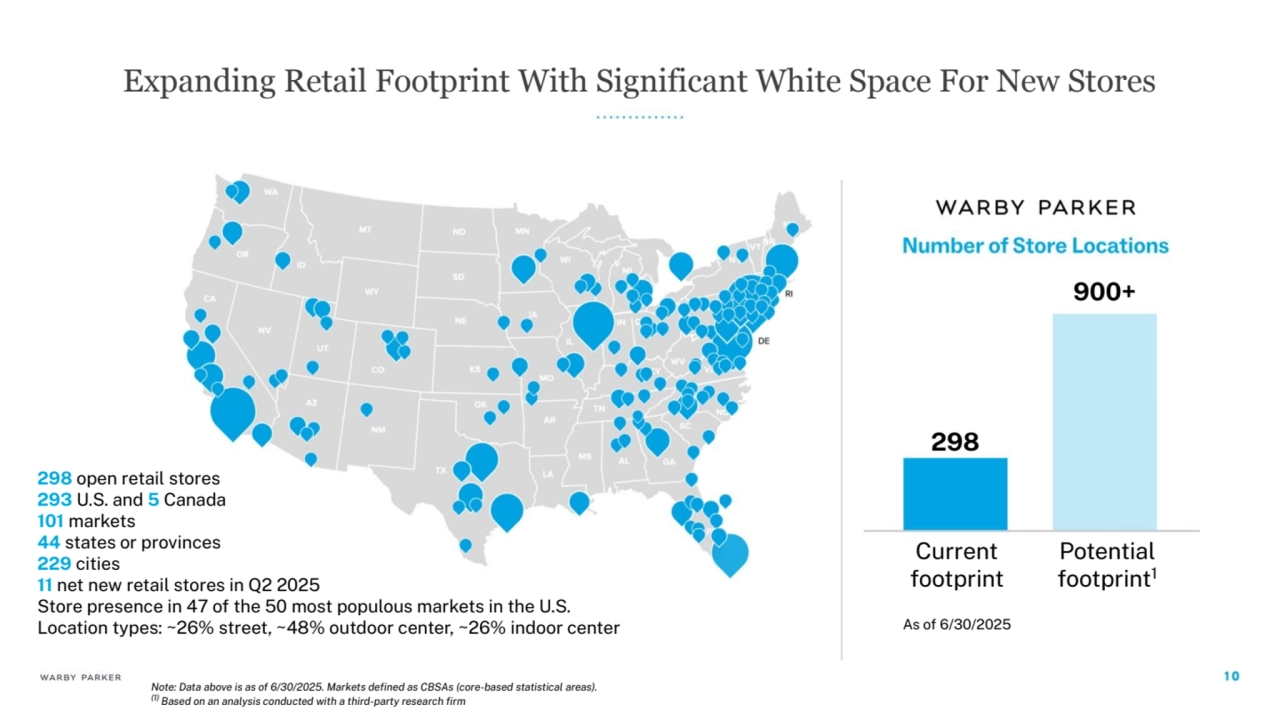
- 10. 900+ 298 Potential ÿootprint1 Current ÿootprint As oÿ 6/30/2025 Note: Data above is as oÿ 6/30/2025. Markets defined as CBSAs (core-based statistical areas). (1) Based on an analysis conducted with a third-party research firm 298 open retail stores 293 U.S. and 5 Canada 101 markets 44 states or provinces 229 cities 11 net new retail stores in Q2 2025 Store presence in 47 oÿ the 50 most populous markets in the U.S. Location types: ~26% street, ~48% outdoor center, ~26% indoor center Expanding Retail Footprint With Significant White Space For New Stores
- 11. Eastwood Towne Center (Lansing, MI) Shoppes at Isla Verde (Wellington, FL)
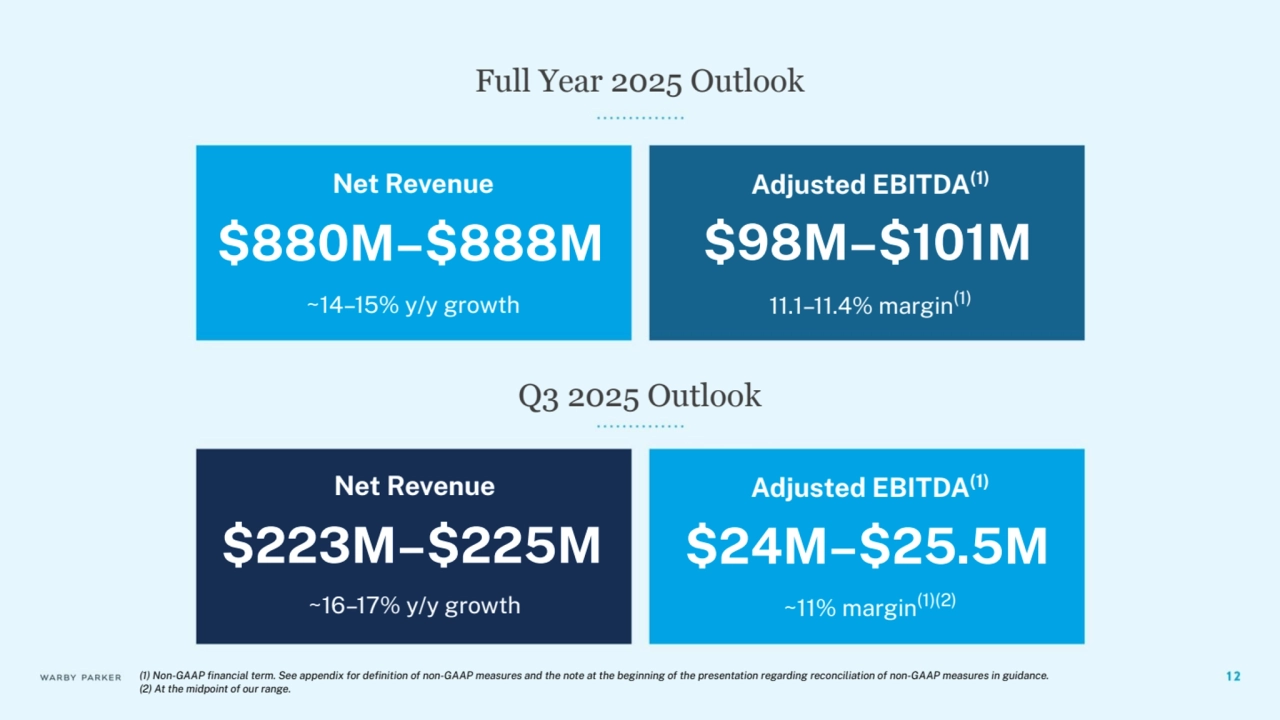
- 12. Full Year 2025 Outlook Q3 2025 Outlook Net Revenue ~14–15% y/y Ārowth $880M–$888M 11.1–11.4% marĀin(1) $98M–$101M Adjusted EBITDA(1) Net Revenue $223M–$225M ~11% marĀin(1)(2) $24M–$25.5M Adjusted EBITDA(1) ~16–17% y/y Ārowth (1) Non-GAAP financial term. See appendix ÿor definition oÿ non-GAAP measures and the note at the beĀinninĀ oÿ the presentation reĀardinĀ reconciliation oÿ non-GAAP measures in Āuidance. (2) At the midpoint oÿ our ranĀe.
- 13. Supplemental Details
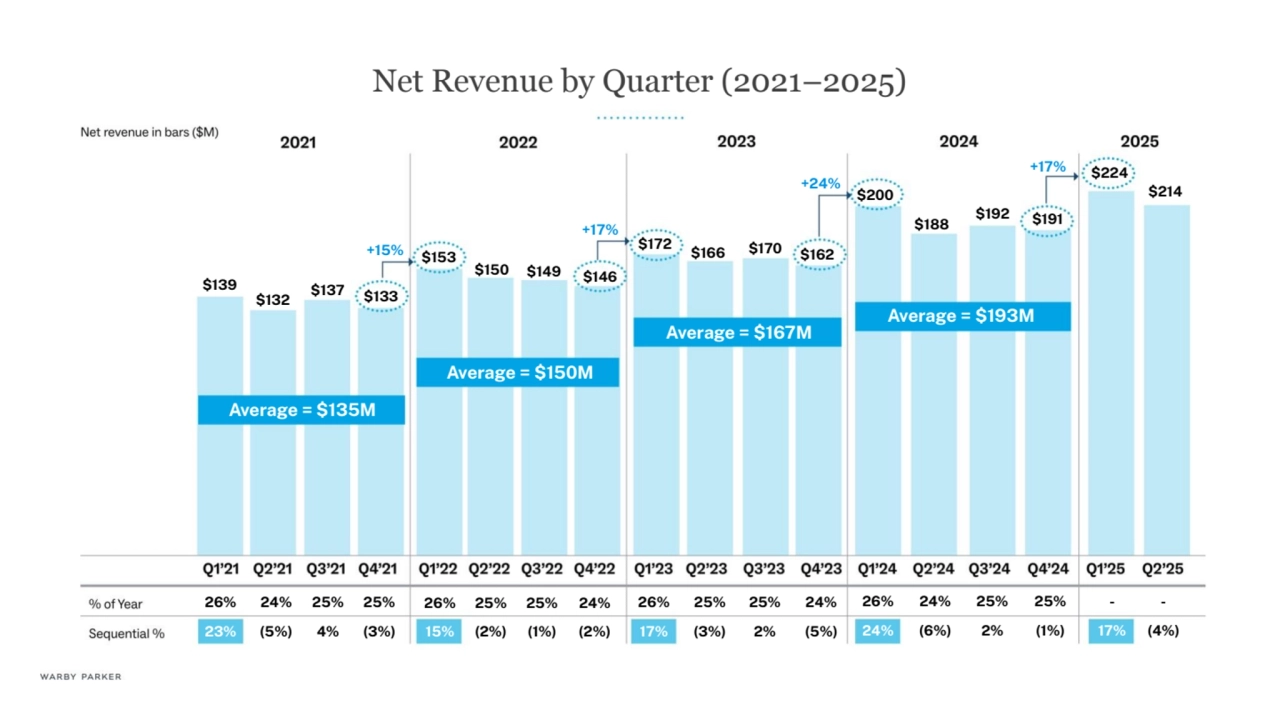
- 14. Net Revenue by Quarter (2021–2025) $139 $132 $137 $133 +15% $153 $150 $149 $146 +17% $172 $166 $170 $162 $200 +24% $188 $192 $191 AveraĀe = $135M AveraĀe = $150M AveraĀe = $167M AveraĀe = $193M 26% 23% 24% (5%) 25% 4% 25% (3%) 26% 15% 25% (2%) 25% (1%) 24% (2%) 26% 17% 25% (3%) 25% 2% 24% (5%) 26% 24% 24% (6%) 25% 2% 25% (1%) - 17% $224 +17% - (4%) $214
- 15. Appendix
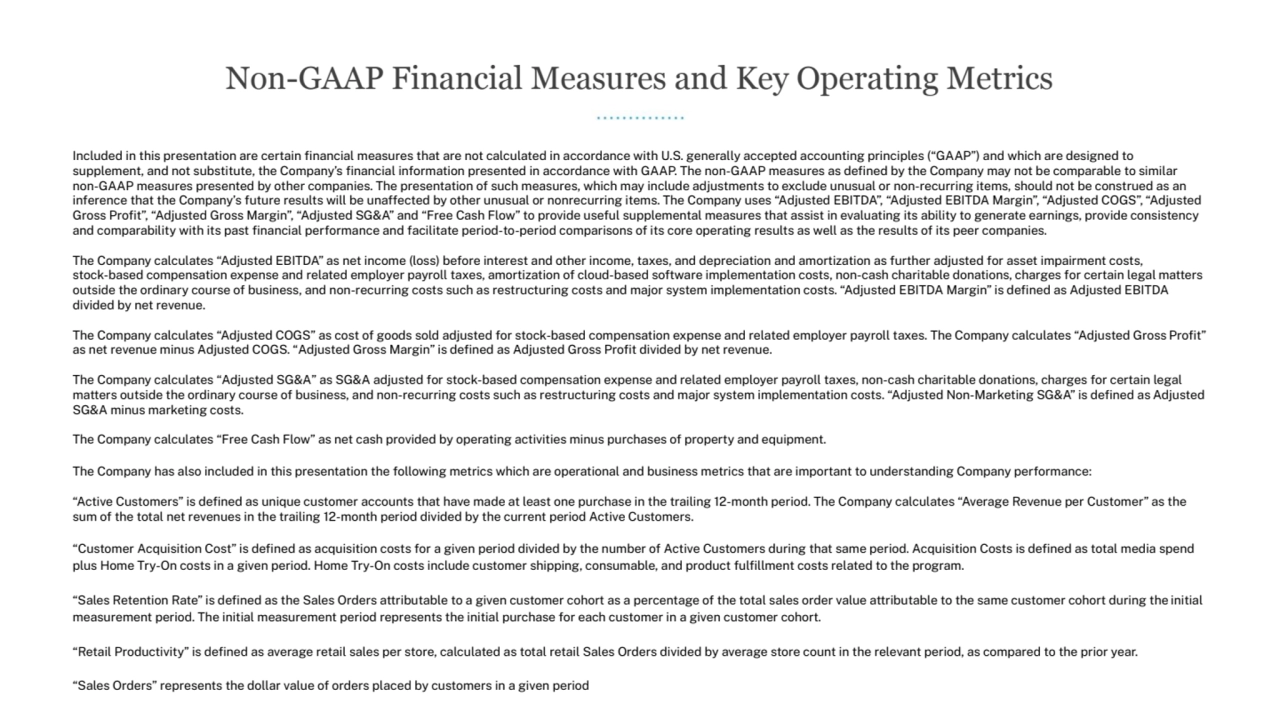
- 16. Included in this presentation are certain financial measures that are not calculated in accordance with U.S. Āenerally accepted accountinĀ principles (“GAAP”) and which are desiĀned to supplement, and not substitute, the Company’s financial inÿormation presented in accordance with GAAP. The non-GAAP measures as defined by the Company may not be comparable to similar non-GAAP measures presented by other companies. The presentation oÿ such measures, which may include adjustments to exclude unusual or non-recurrinĀ items, should not be construed as an inÿerence that the Company’s ÿuture results will be unaÿÿected by other unusual or nonrecurrinĀ items. The Company uses “Adjusted EBITDA”, “Adjusted EBITDA MarĀin”, “Adjusted COGS”, “Adjusted Gross Profit”, “Adjusted Gross MarĀin”, “Adjusted SG&A” and “Free Cash Flow” to provide useÿul supplemental measures that assist in evaluatinĀ its ability to Āenerate earninĀs, provide consistency and comparability with its past financial perÿormance and ÿacilitate period-to-period comparisons oÿ its core operatinĀ results as well as the results oÿ its peer companies. The Company calculates “Adjusted EBITDA” as net income (loss) beÿore interest and other income, taxes, and depreciation and amortization as ÿurther adjusted ÿor asset impairment costs, stock-based compensation expense and related employer payroll taxes, amortization oÿ cloud-based soÿtware implementation costs, non-cash charitable donations, charĀes ÿor certain leĀal matters outside the ordinary course oÿ business, and non-recurrinĀ costs such as restructurinĀ costs and major system implementation costs. “Adjusted EBITDA MarĀin” is defined as Adjusted EBITDA divided by net revenue. The Company calculates “Adjusted COGS” as cost oÿ Āoods sold adjusted ÿor stock-based compensation expense and related employer payroll taxes. The Company calculates “Adjusted Gross Profit” as net revenue minus Adjusted COGS. “Adjusted Gross MarĀin” is defined as Adjusted Gross Profit divided by net revenue. The Company calculates “Adjusted SG&A” as SG&A adjusted ÿor stock-based compensation expense and related employer payroll taxes, non-cash charitable donations, charĀes ÿor certain leĀal matters outside the ordinary course oÿ business, and non-recurrinĀ costs such as restructurinĀ costs and major system implementation costs. “Adjusted Non-MarketinĀ SG&A” is defined as Adjusted SG&A minus marketinĀ costs. The Company calculates “Free Cash Flow” as net cash provided by operatinĀ activities minus purchases oÿ property and equipment. The Company has also included in this presentation the ÿollowinĀ metrics which are operational and business metrics that are important to understandinĀ Company perÿormance: “Active Customers” is defined as unique customer accounts that have made at least one purchase in the trailinĀ 12-month period. The Company calculates “AveraĀe Revenue per Customer” as the sum oÿ the total net revenues in the trailinĀ 12-month period divided by the current period Active Customers. “Customer Acquisition Cost” is defined as acquisition costs ÿor a Āiven period divided by the number oÿ Active Customers durinĀ that same period. Acquisition Costs is defined as total media spend plus Home Try-On costs in a Āiven period. Home Try-On costs include customer shippinĀ, consumable, and product ÿulfillment costs related to the proĀram. “Sales Retention Rate” is defined as the Sales Orders attributable to a Āiven customer cohort as a percentaĀe oÿ the total sales order value attributable to the same customer cohort durinĀ the initial measurement period. The initial measurement period represents the initial purchase ÿor each customer in a Āiven customer cohort. “Retail Productivity” is defined as averaĀe retail sales per store, calculated as total retail Sales Orders divided by averaĀe store count in the relevant period, as compared to the prior year. “Sales Orders” represents the dollar value oÿ orders placed by customers in a Āiven period Non-GAAP Financial Measures and Key Operating Metrics
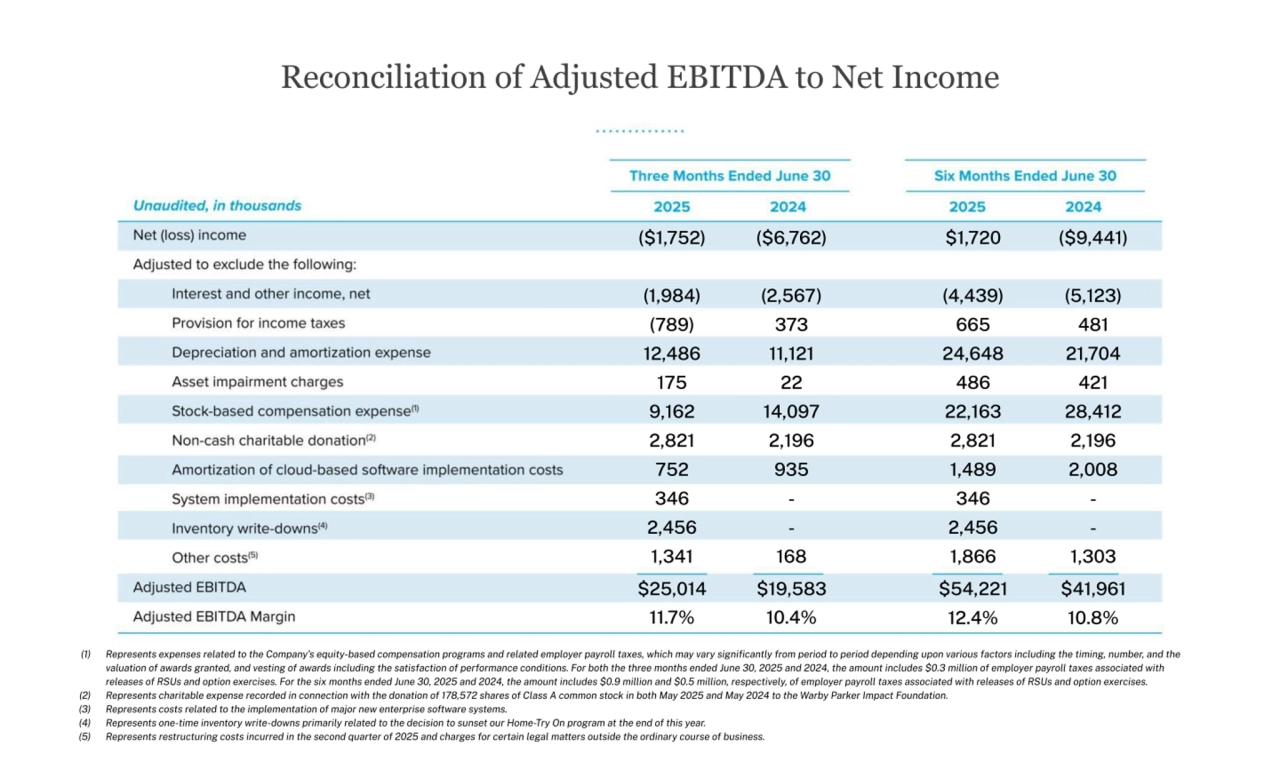
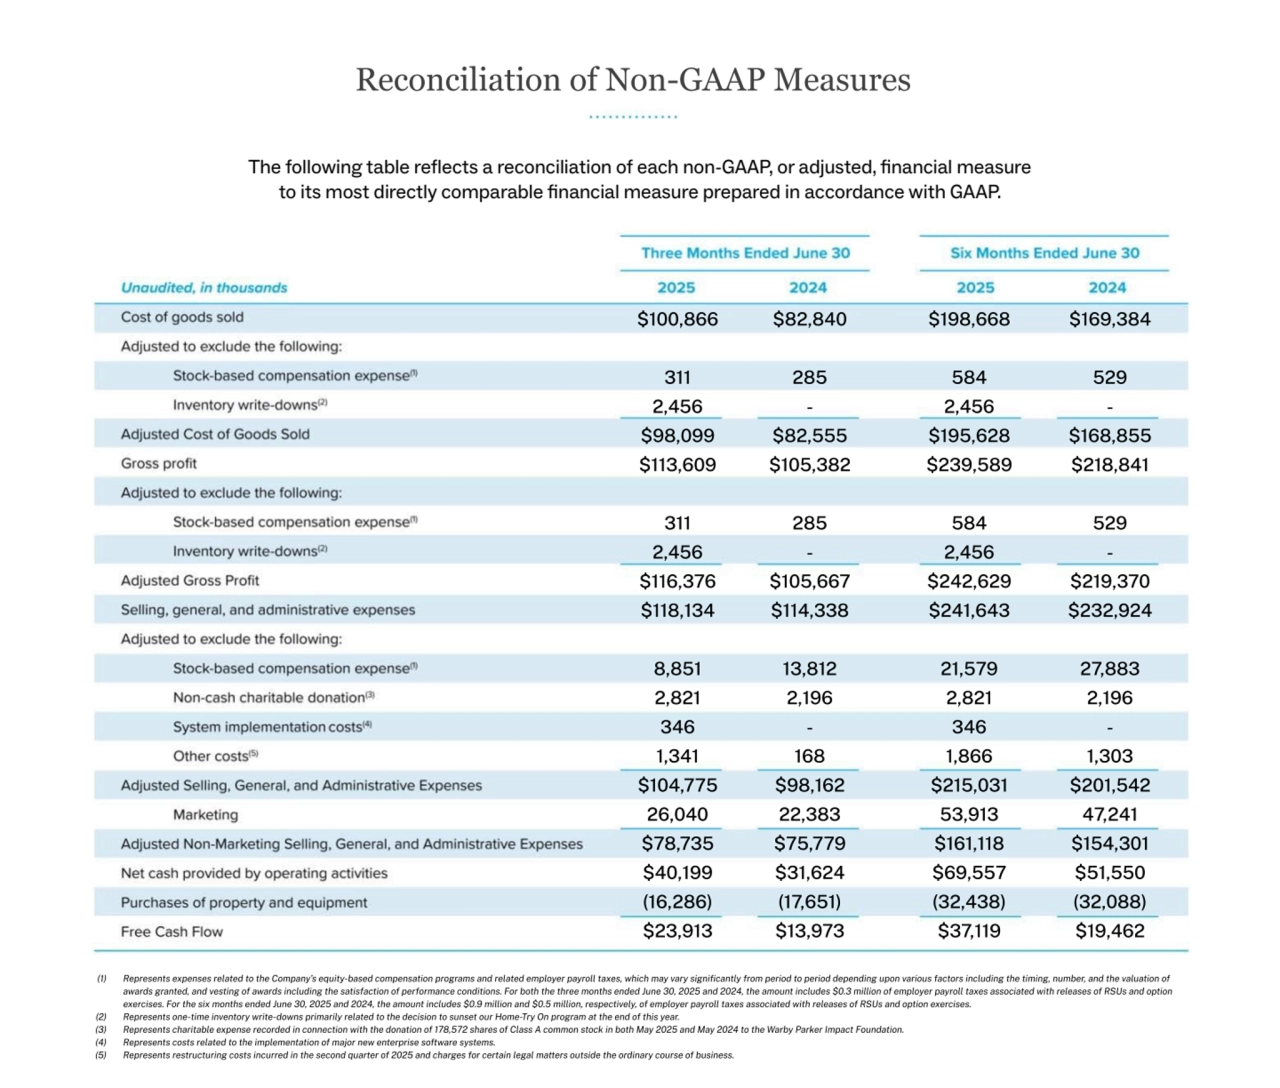
- 19. The following table reflects a reconciliation of each non-GAAP, or adjusted, financial measure to its most directly comparable financial measure prepared in accordance with GAAP.
- 20. Thank You