Calumet: Second Quarter 2025 Financial Results
 AI Summary
Key Insights
- 📈 Financial Overview: Calumet presents its Second Quarter 2025 Financial Results, highlighting key financial figures and performance metrics.
- ⚙️ Strategic Milestones: The company details significant operational achievements and strategic initiatives undertaken during the quarter.
- 🌱 Regulatory Landscape: An analysis of supportive regulatory developments and their potential impact on Calumet's business segments is included.
- 💰 Deleveraging Focus: Emphasis is placed on the company's strategies for deleveraging and creating value through cash flow management and balance sheet improvements.
- 📊 Segment Performance: A breakdown of performance across different business segments, including Specialty Products and Solutions, Performance Brands, and Montana/Renewables, with adjusted EBITDA figures.


Calumet: Second Quarter 2025 Financial Results
- 1. August 8, 2025 Second Quarter 2025 Financial Results
- 2. 2 Forward-Looking Statements This Presentation has been prepared by Calumet, Inc. (the “Company,” “Calumet,” "we," "our" or like terms) as of August 8, 2025. The information in this Presentation includes certain “forward-looking statements.” These statements can be identified by the use of forward-looking terminology including “may,” “intend,” “believe,” “expect,” “anticipate,” “estimate,” “forecast,” “outlook,” “continue” or other similar words. The statements discussed in this Presentation that are not purely historical data are forward-looking statements. These forward-looking statements discuss future expectations or state other “forward-looking” information and involve risks and uncertainties. When considering forward-looking statements, you should keep in mind the risk factors and other cautionary statements included in our most recent Annual Report on Form 10-K and our other filings with the SEC. The risk factors and other factors noted in our most recent Annual Report on Form 10-K and other filings with the SEC could cause our actual results to differ materially from those contained in any forward-looking statement. Our forward-looking statements are not guarantees of future performance, and actual results and future performance may differ materially from those suggested in any forward-looking statement. All subsequent written and oral forward-looking statements attributable to us or to persons acting on our behalf are expressly qualified in their entirety by the foregoing. Existing and prospective investors are cautioned not to place undue reliance on such forward-looking statements, which speak only as of the date of this Presentation. We undertake no obligation to publicly update or revise any forward-looking statements after the date they are made, whether as a result of new information, future events or otherwise. Non-GAAP Financial Measures Adjusted EBITDA, Adjusted EBITDA with Tax Attributes and net recourse debt are non-GAAP financial measures provided in this Presentation. Reconciliations to the most comparable GAAP financial measures are included in the Appendix to this Presentation. These non-GAAP financial measures are not defined by GAAP and should not be considered in isolation or as an alternative to net income (loss), net cash from operations or other financial measures prepared in accordance with GAAP. CAUTIONARY STATEMENTS
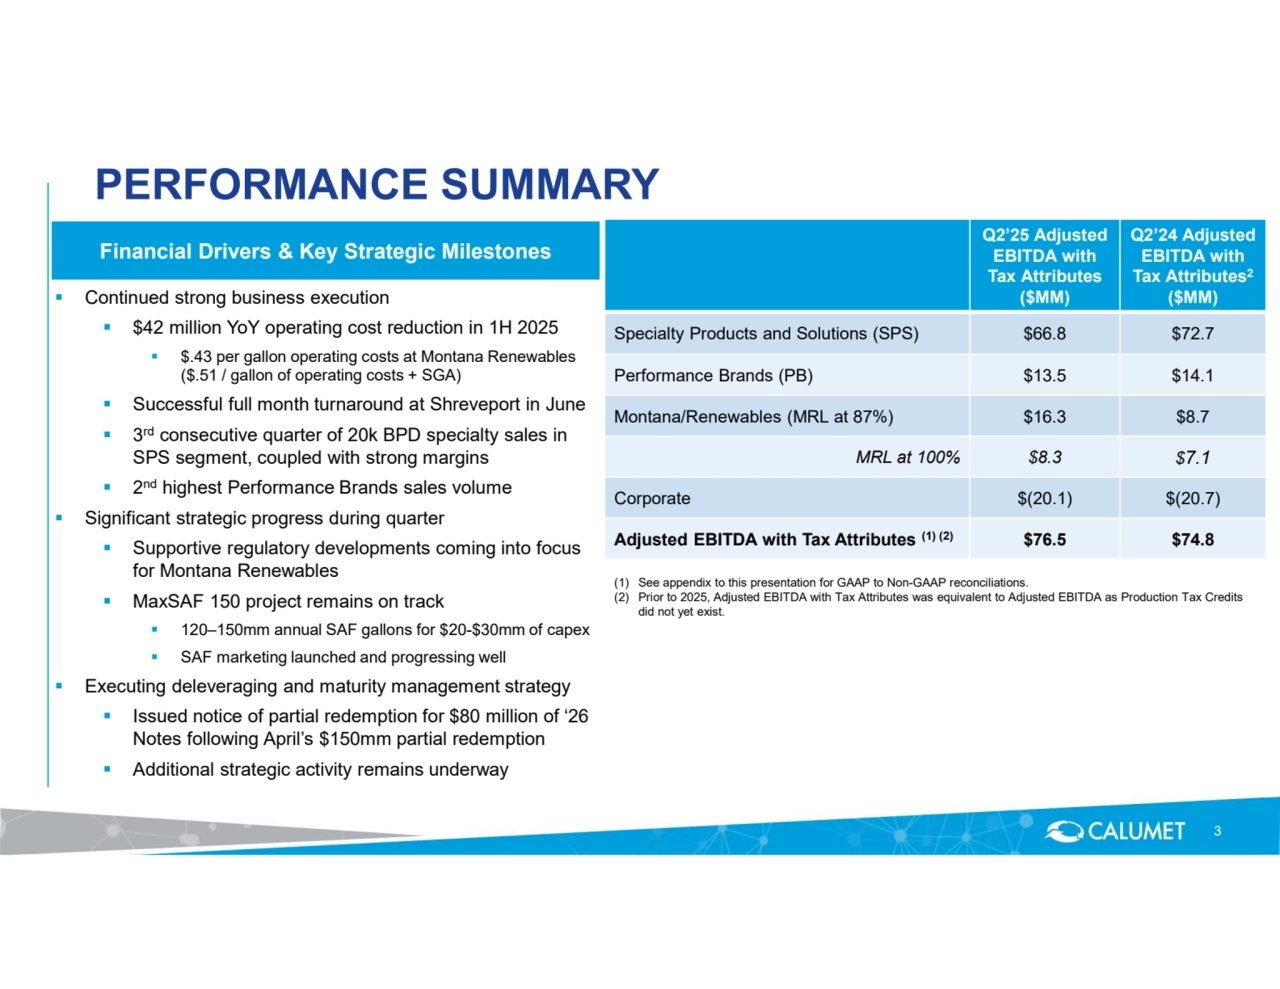
- 3. Continued strong business execution $42 million YoY operating cost reduction in 1H 2025 $.43 per gallon operating costs at Montana Renewables ($.51 / gallon of operating costs + SGA) Successful full month turnaround at Shreveport in June 3 rd consecutive quarter of 20k BPD specialty sales in SPS segment, coupled with strong margins 2 nd highest Performance Brands sales volume Significant strategic progress during quarter Supportive regulatory developments coming into focus for Montana Renewables MaxSAF 150 project remains on track 120–150mm annual SAF gallons for $20-$30mm of capex SAF marketing launched and progressing well Executing deleveraging and maturity management strategy Issued notice of partial redemption for $80 million of ‘26 Notes following April’s $150mm partial redemption Additional strategic activity remains underway PERFORMANCE SUMMARY Financial Drivers & Key Strategic Milestones (1) See appendix to this presentation for GAAP to Non-GAAP reconciliations. (2) Prior to 2025, Adjusted EBITDA with Tax Attributes was equivalent to Adjusted EBITDA as Production Tax Credits did not yet exist. Q2’24 Adjusted EBITDA with Tax Attributes2 ($MM) Q2’25 Adjusted EBITDA with Tax Attributes ($MM) Specialty Products and Solutions (SPS) $66.8 $72.7 Performance Brands (PB) $13.5 $14.1 Montana/Renewables (MRL at 87%) $16.3 $8.7 MRL at 100% $8.3 $7.1 Corporate $(20.1) $(20.7) Adjusted EBITDA with Tax Attributes $76.5 $74.8 (1) (2) 3
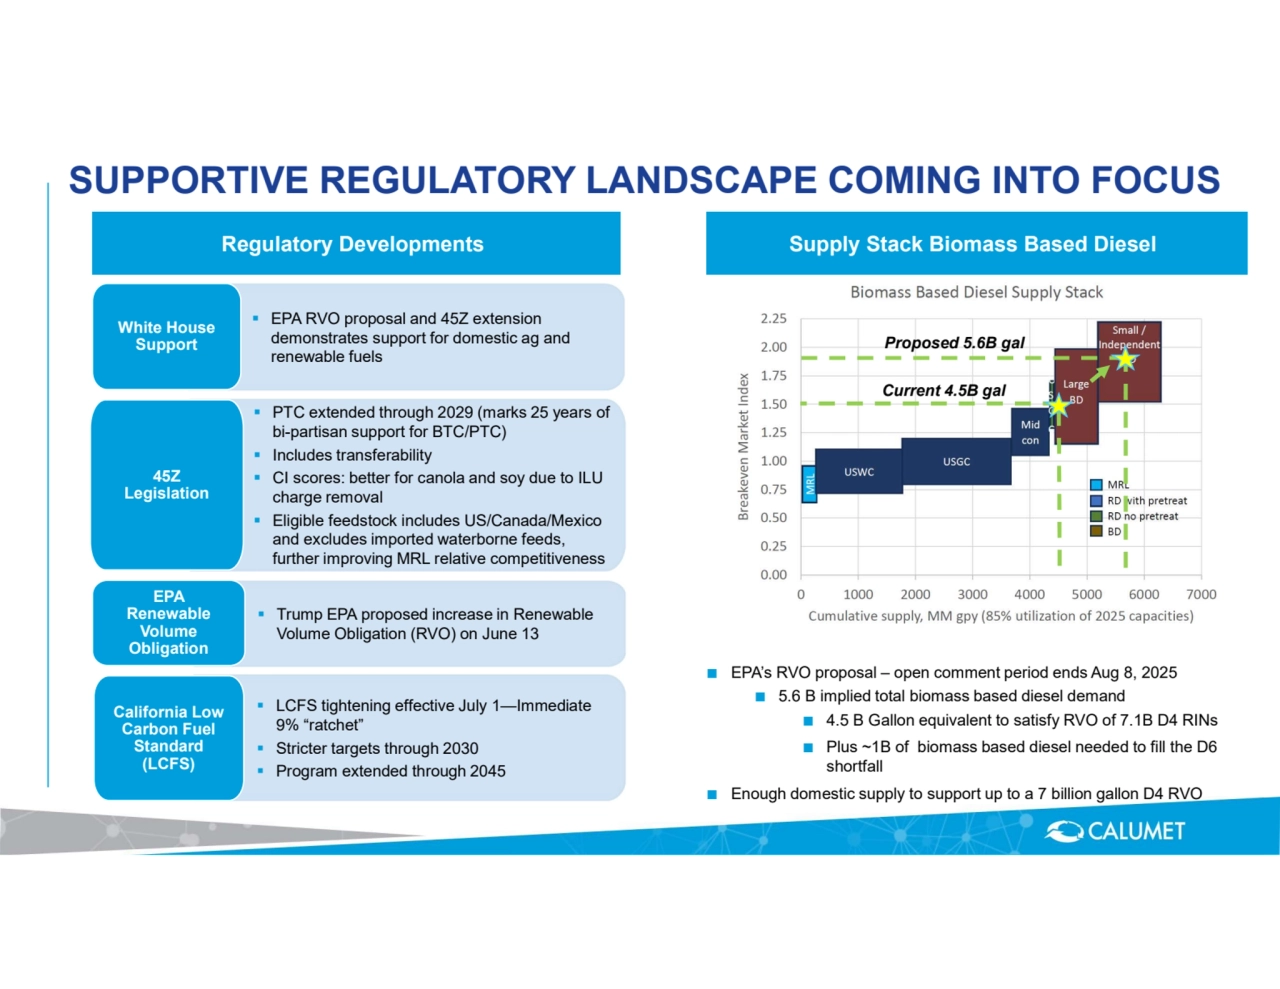
- 4. SUPPORTIVE REGULATORY LANDSCAPE COMING INTO FOCUS Supply Stack Biomass Based Diesel ■ EPA’s RVO proposal – open comment period ends Aug 8, 2025 ■ 5.6 B implied total biomass based diesel demand ■ 4.5 B Gallon equivalent to satisfy RVO of 7.1B D4 RINs ■ Plus ~1B of biomass based diesel needed to fill the D6 shortfall ■ Enough domestic supply to support up to a 7 billion gallon D4 RVO Regulatory Developments PTC extended through 2029 (marks 25 years of bi-partisan support for BTC/PTC) Includes transferability CI scores: better for canola and soy due to ILU charge removal Eligible feedstock includes US/Canada/Mexico and excludes imported waterborne feeds, further improving MRL relative competitiveness 45Z Legislation Trump EPA proposed increase in Renewable Volume Obligation (RVO) on June 13 EPA Renewable Volume Obligation EPA RVO proposal and 45Z extension demonstrates support for domestic ag and renewable fuels White House Support LCFS tightening effective July 1—Immediate 9% “ratchet” Stricter targets through 2030 Program extended through 2045 California Low Carbon Fuel Standard (LCFS) Current 4.5B gal Proposed 5.6B gal
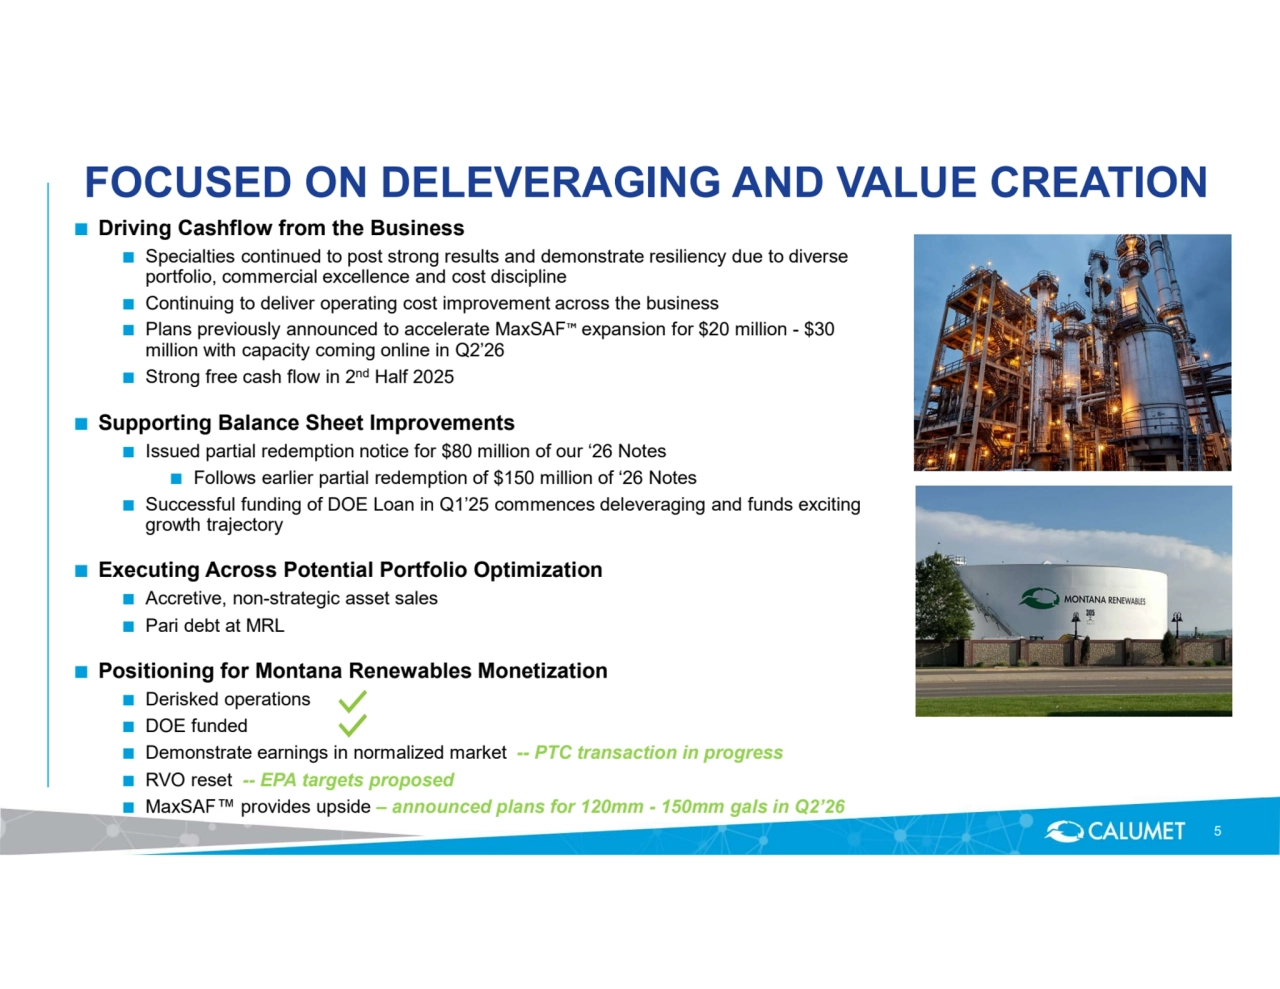
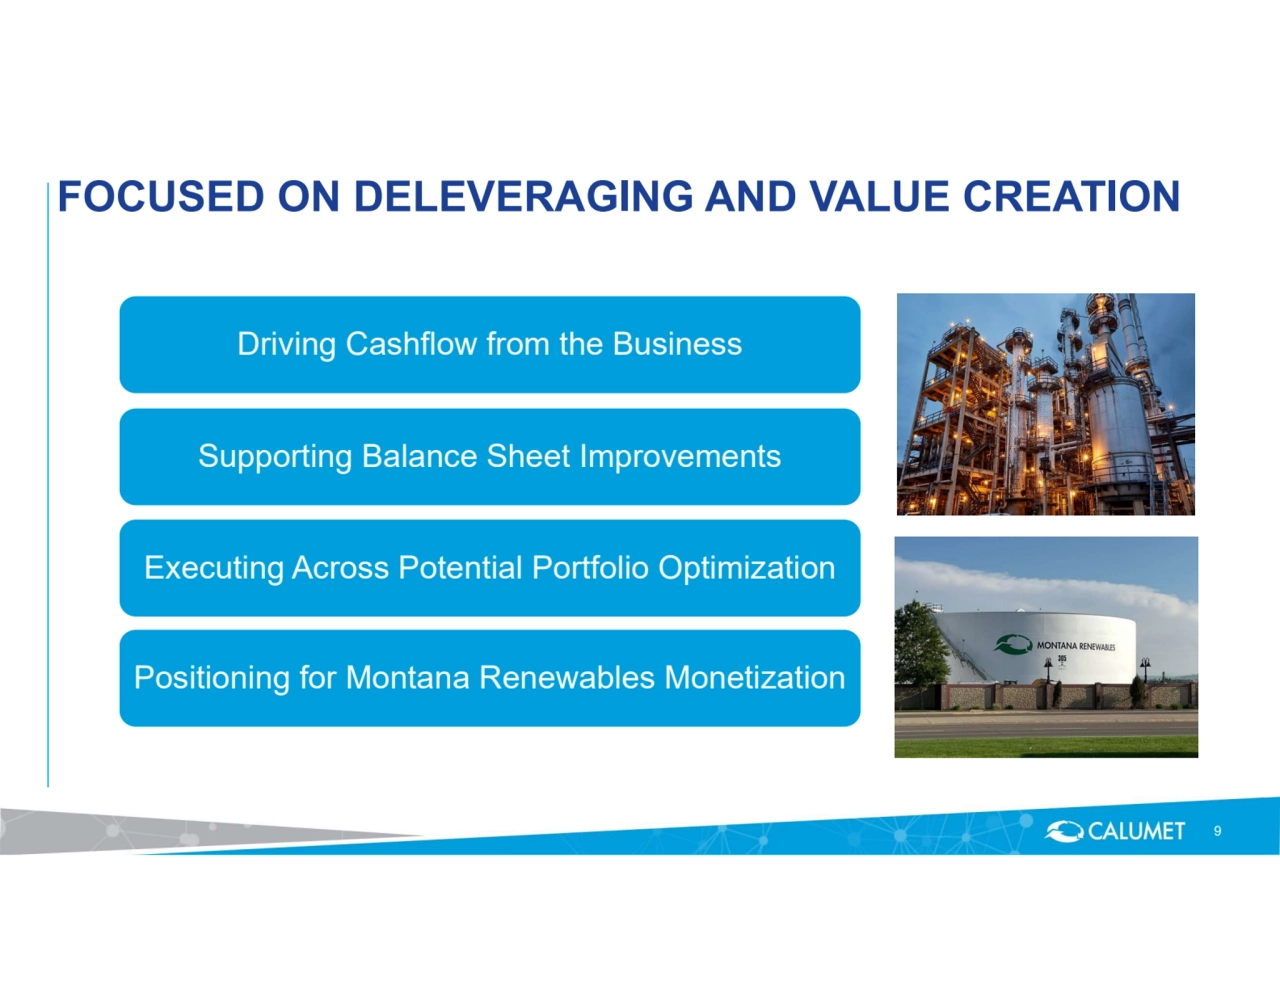
- 5. FOCUSED ON DELEVERAGING AND VALUE CREATION ■ Driving Cashflow from the Business ■ Specialties continued to post strong results and demonstrate resiliency due to diverse portfolio, commercial excellence and cost discipline ■ Continuing to deliver operating cost improvement across the business ■ Plans previously announced to accelerate MaxSAF expansion for $20 million - $30 million with capacity coming online in Q2’26 ■ Strong free cash flow in 2nd Half 2025 ■ Supporting Balance Sheet Improvements ■ Issued partial redemption notice for $80 million of our ‘26 Notes ■ Follows earlier partial redemption of $150 million of ‘26 Notes ■ Successful funding of DOE Loan in Q1’25 commences deleveraging and funds exciting growth trajectory ■ Executing Across Potential Portfolio Optimization ■ Accretive, non-strategic asset sales ■ Pari debt at MRL ■ Positioning for Montana Renewables Monetization ■ Derisked operations ■ DOE funded ■ Demonstrate earnings in normalized market -- PTC transaction in progress ■ RVO reset -- EPA targets proposed ■ MaxSAF provides upside – announced plans for 120mm - 150mm gals in Q2’26 5
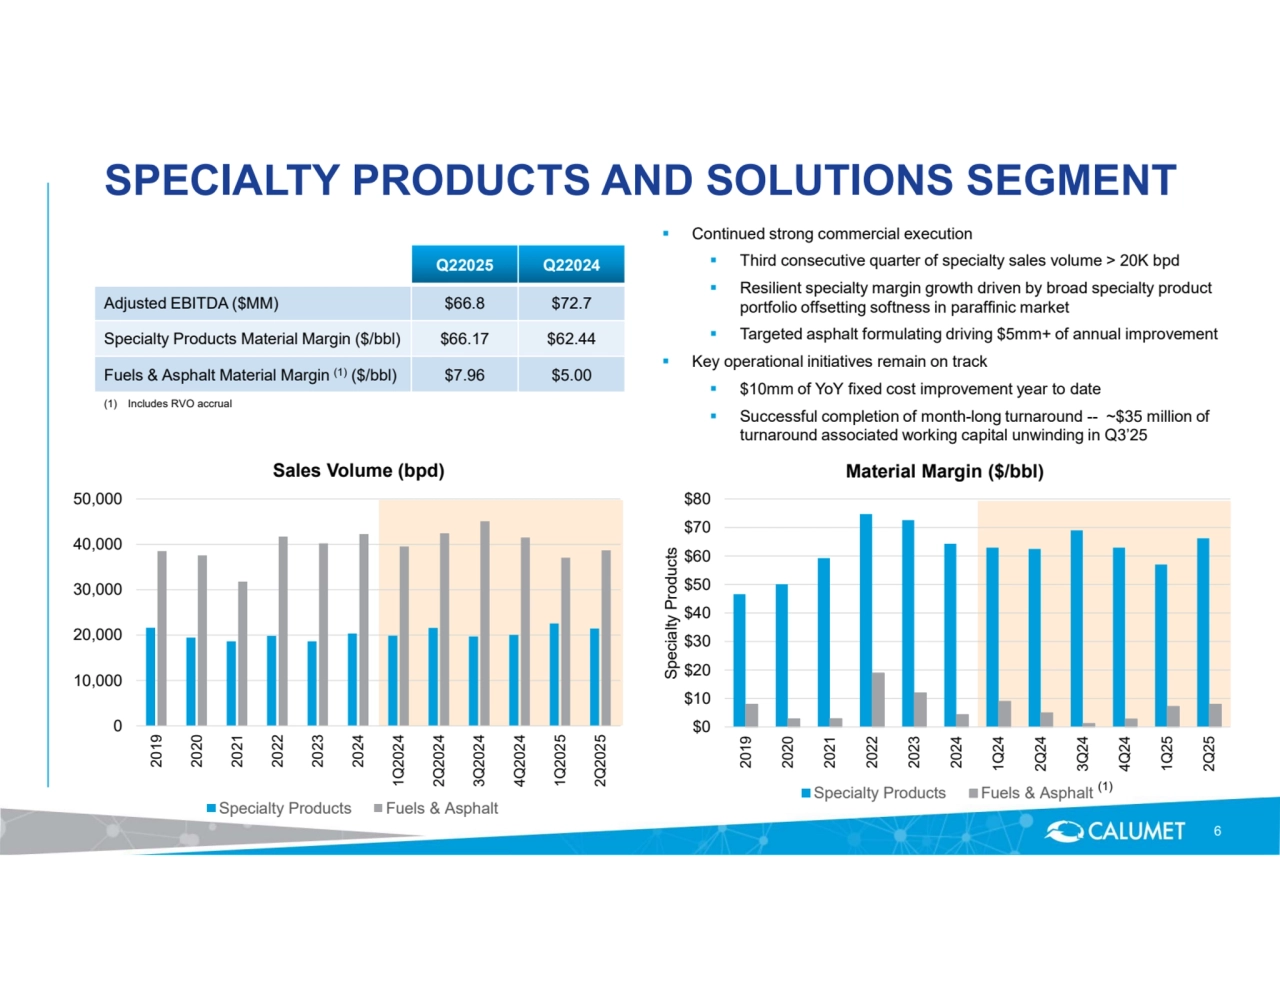
- 6. $0 $10 $20 $30 $40 $50 $60 $70 $80 2019 2020 2021 2022 2023 2024 1Q24 2Q24 3Q24 4Q24 1Q25 2Q25 Specialty Products Material Margin ($/bbl) Specialty Products Fuels & Asphalt 0 10,000 20,000 30,000 40,000 50,000 2019 2020 2021 2022 2023 2024 1Q2024 2Q2024 3Q2024 4Q2024 1Q2025 2Q2025 Sales Volume (bpd) Specialty Products Fuels & Asphalt SPECIALTY PRODUCTS AND SOLUTIONS SEGMENT 6 Q22025 Q22024 Adjusted EBITDA ($MM) $66.8 $72.7 Specialty Products Material Margin ($/bbl) $66.17 $62.44 Fuels & Asphalt Material Margin $7.96 $5.00 (1) ($/bbl) (1) Includes RVO accrual (1) Continued strong commercial execution Third consecutive quarter of specialty sales volume > 20K bpd Resilient specialty margin growth driven by broad specialty product portfolio offsetting softness in paraffinic market Targeted asphalt formulating driving $5mm+ of annual improvement Key operational initiatives remain on track $10mm of YoY fixed cost improvement year to date Successful completion of month-long turnaround -- ~$35 million of turnaround associated working capital unwinding in Q3’25
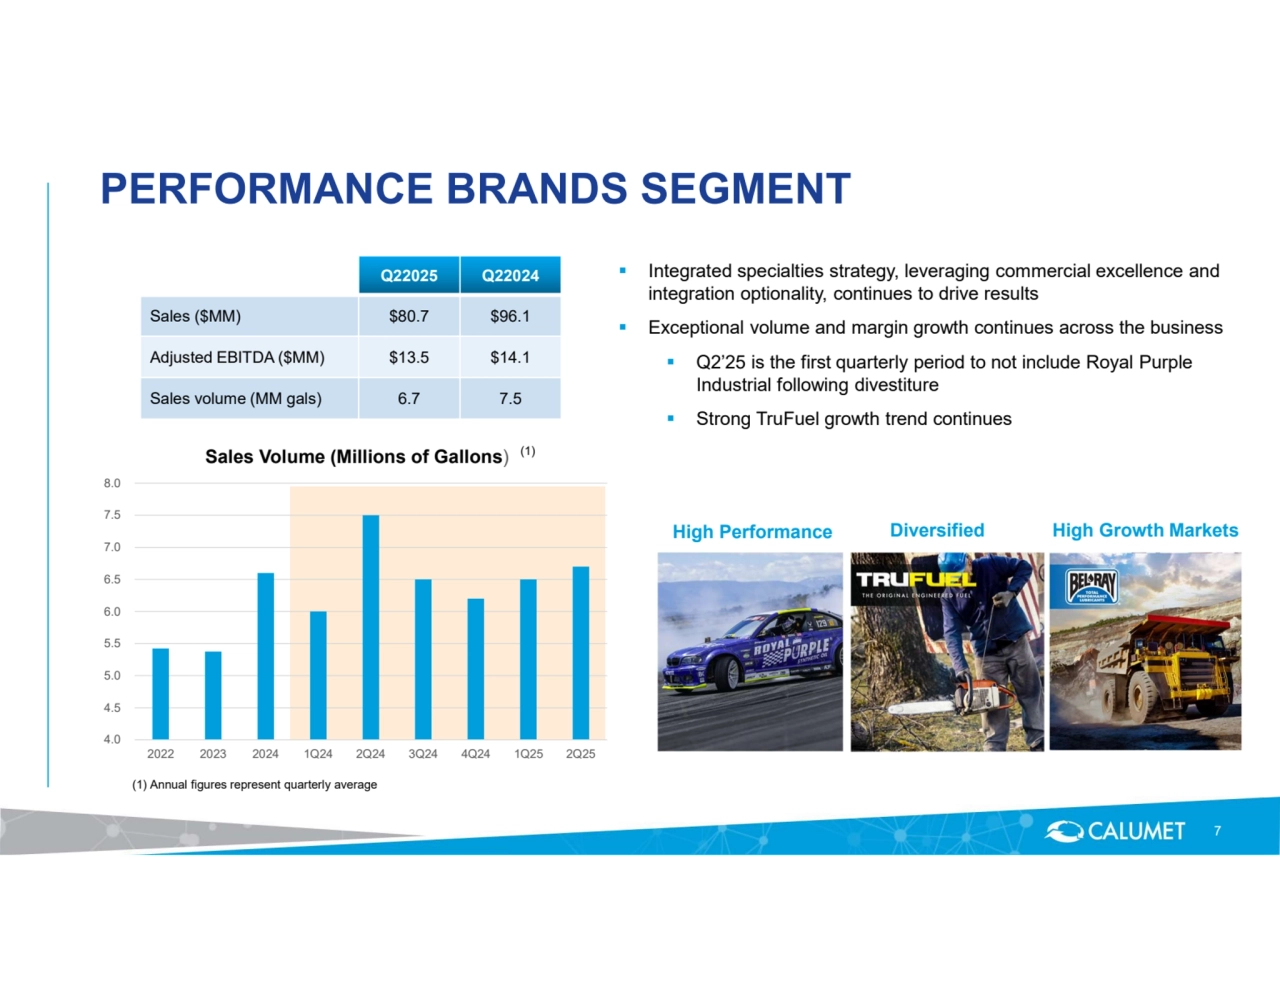
- 7. 4.0 4.5 5.0 5.5 6.0 6.5 7.0 7.5 8.0 2022 2023 2024 1Q24 2Q24 3Q24 4Q24 1Q25 2Q25 Sales Volume (Millions of Gallons) (1) PERFORMANCE BRANDS SEGMENT 7 High Performance Diversified High Growth Markets Q22025 Q22024 Sales ($MM) $80.7 $96.1 Adjusted EBITDA ($MM) $13.5 $14.1 Sales volume (MM gals) 6.7 7.5 Integrated specialties strategy, leveraging commercial excellence and integration optionality, continues to drive results Exceptional volume and margin growth continues across the business Q2’25 is the first quarterly period to not include Royal Purple Industrial following divestiture Strong TruFuel growth trend continues (1) Annual figures represent quarterly average
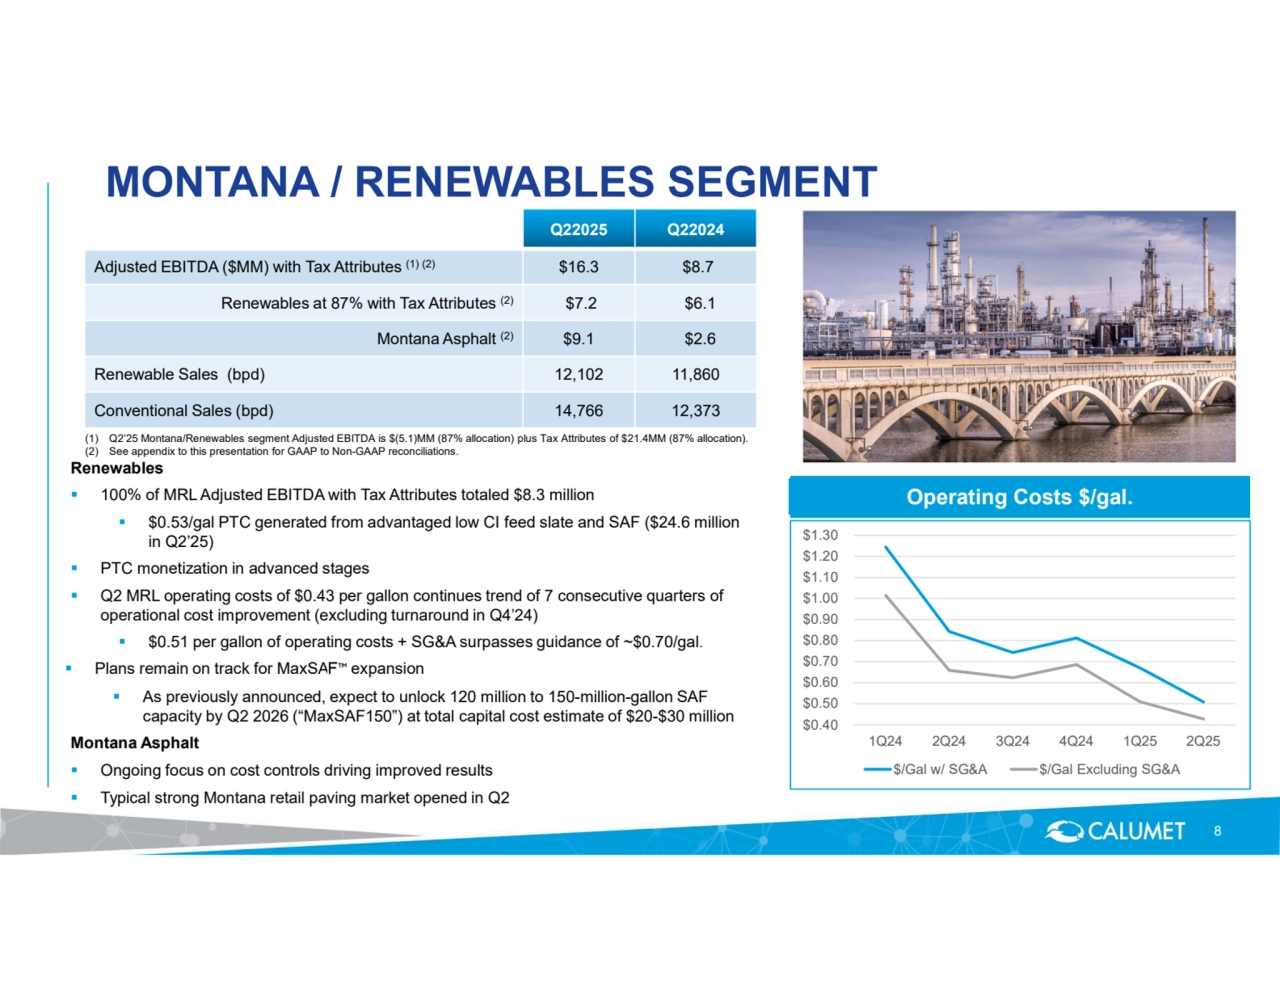
- 8. MONTANA / RENEWABLES SEGMENT Renewables 100% of MRL Adjusted EBITDA with Tax Attributes totaled $8.3 million $0.53/gal PTC generated from advantaged low CI feed slate and SAF ($24.6 million in Q2’25) PTC monetization in advanced stages Q2 MRL operating costs of $0.43 per gallon continues trend of 7 consecutive quarters of operational cost improvement (excluding turnaround in Q4’24) $0.51 per gallon of operating costs + SG&A surpasses guidance of ~$0.70/gal. Plans remain on track for MaxSAF expansion As previously announced, expect to unlock 120 million to 150-million-gallon SAF capacity by Q2 2026 (“MaxSAF150”) at total capital cost estimate of $20-$30 million Montana Asphalt Ongoing focus on cost controls driving improved results Typical strong Montana retail paving market opened in Q2 (1) Q2’25 Montana/Renewables segment Adjusted EBITDA is $(5.1)MM (87% allocation) plus Tax Attributes of $21.4MM (87% allocation). (2) See appendix to this presentation for GAAP to Non-GAAP reconciliations. Q22025 Q22024 Adjusted EBITDA ($MM) with Tax Attributes $16.3 $8.7 (1) (2) Renewables at 87% with Tax Attributes $7.2 $6.1 (2) Montana Asphalt $9.1 $2.6 (2) Renewable Sales (bpd) 12,102 11,860 Conventional Sales (bpd) 14,766 12,373 8 $0.40 $0.50 $0.60 $0.70 $0.80 $0.90 $1.00 $1.10 $1.20 $1.30 1Q24 2Q24 3Q24 4Q24 1Q25 2Q25 $/Gal w/ SG&A $/Gal Excluding SG&A Operating Costs $/gal.
- 9. FOCUSED ON DELEVERAGING AND VALUE CREATION 9 Positioning for Montana Renewables Monetization Executing Across Potential Portfolio Optimization Supporting Balance Sheet Improvements Driving Cashflow from the Business
- 10. Appendix © 2024 Calumet, Inc. All Rights Reserved. Not to be copied, shared, or reproduced in any media without the express written permission of Calumet, Inc.
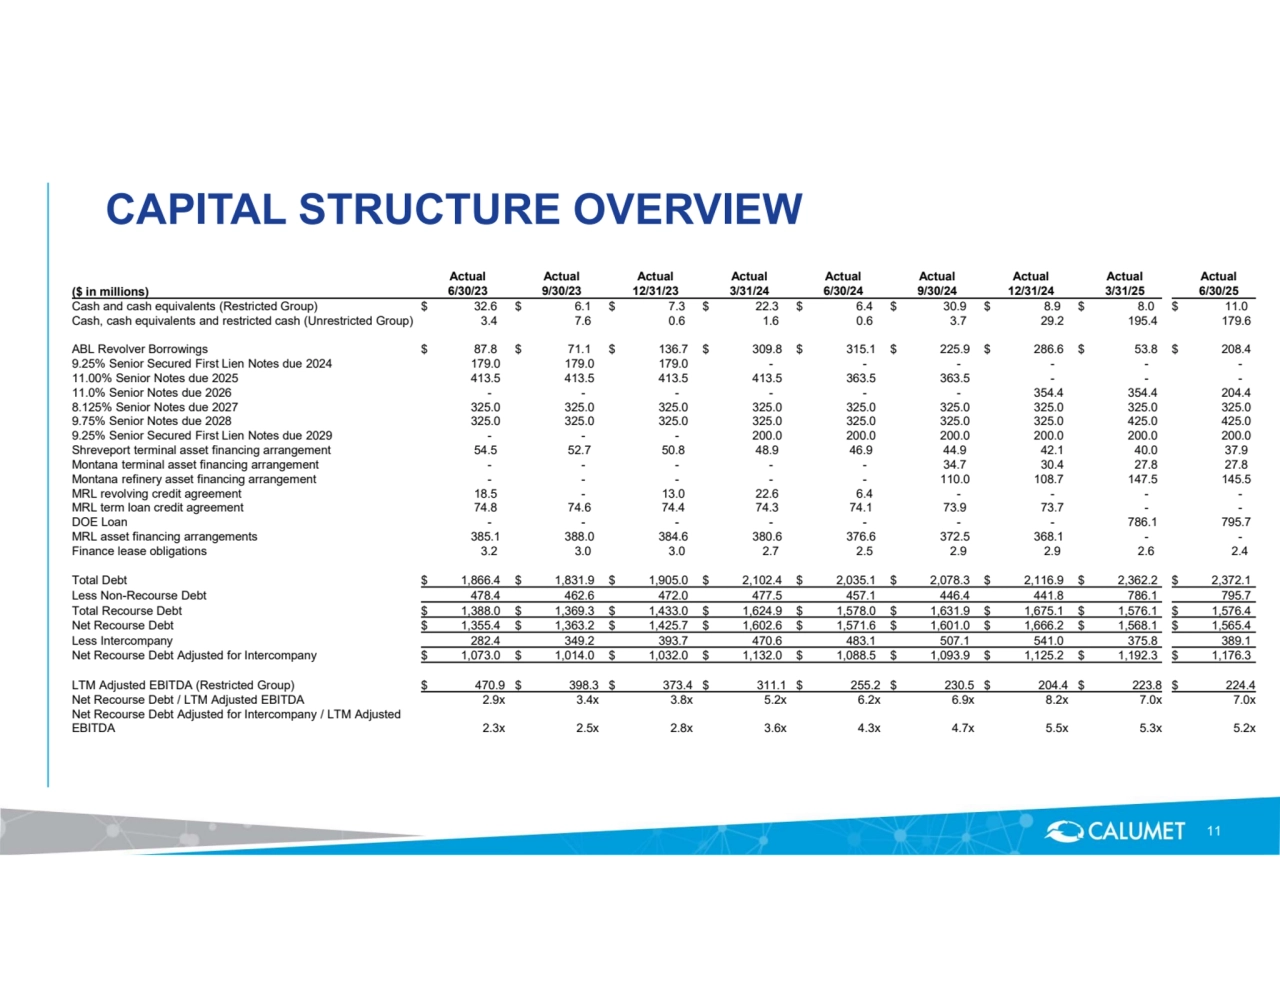
- 11. CAPITAL STRUCTURE OVERVIEW 11 Actual Actual Actual Actual Actual Actual Actual Actual Actual ($ in millions) 6/30/23 9/30/23 12/31/23 3/31/24 6/30/24 9/30/24 12/31/24 3/31/25 6/30/25 Cash and cash equivalents (Restricted Group) $ 32.6 $ 6.1 $ 7.3 $ 22.3 $ 6.4 $ 30.9 $ 8.9 $ 8.0 $ 11.0 Cash, cash equivalents and restricted cash (Unrestricted Group) 3.4 7.6 0.6 1.6 0.6 3.7 29.2 195.4 179.6 ABL Revolver Borrowings $ 87.8 $ 71.1 $ 136.7 $ 309.8 $ 315.1 $ 225.9 $ 286.6 $ 53.8 $ 208.4 9.25% Senior Secured First Lien Notes due 2024 179.0 179.0 179.0 - - - - - - 11.00% Senior Notes due 2025 413.5 413.5 413.5 413.5 363.5 363.5 - - - 11.0% Senior Notes due 2026 - - - - - - 354.4 354.4 204.4 8.125% Senior Notes due 2027 325.0 325.0 325.0 325.0 325.0 325.0 325.0 325.0 325.0 9.75% Senior Notes due 2028 325.0 325.0 325.0 325.0 325.0 325.0 325.0 425.0 425.0 9.25% Senior Secured First Lien Notes due 2029 - - - 200.0 200.0 200.0 200.0 200.0 200.0 Shreveport terminal asset financing arrangement 54.5 52.7 50.8 48.9 46.9 44.9 42.1 40.0 37.9 Montana terminal asset financing arrangement - - - - - 34.7 30.4 27.8 27.8 Montana refinery asset financing arrangement - - - - - 110.0 108.7 147.5 145.5 MRL revolving credit agreement 18.5 - 13.0 22.6 6.4 - - - - MRL term loan credit agreement 74.8 74.6 74.4 74.3 74.1 73.9 73.7 - - DOE Loan - - - - - - - 786.1 795.7 MRL asset financing arrangements 385.1 388.0 384.6 380.6 376.6 372.5 368.1 - - Finance lease obligations 3.2 3.0 3.0 2.7 2.5 2.9 2.9 2.6 2.4 Total Debt $ 1,866.4 $ 1,831.9 $ 1,905.0 $ 2,102.4 $ 2,035.1 $ 2,078.3 $ 2,116.9 $ 2,362.2 $ 2,372.1 Less Non-Recourse Debt 478.4 462.6 472.0 477.5 457.1 446.4 441.8 786.1 795.7 Total Recourse Debt $ 1,388.0 $ 1,369.3 $ 1,433.0 $ 1,624.9 $ 1,578.0 $ 1,631.9 $ 1,675.1 $ 1,576.1 $ 1,576.4 Net Recourse Debt $ 1,355.4 $ 1,363.2 $ 1,425.7 $ 1,602.6 $ 1,571.6 $ 1,601.0 $ 1,666.2 $ 1,568.1 $ 1,565.4 Less Intercompany 282.4 349.2 393.7 470.6 483.1 507.1 541.0 375.8 389.1 Net Recourse Debt Adjusted for Intercompany $ 1,073.0 $ 1,014.0 $ 1,032.0 $ 1,132.0 $ 1,088.5 $ 1,093.9 $ 1,125.2 $ 1,192.3 $ 1,176.3 LTM Adjusted EBITDA (Restricted Group) $ 470.9 $ 398.3 $ 373.4 $ 311.1 $ 255.2 $ 230.5 $ 204.4 $ 223.8 $ 224.4 Net Recourse Debt / LTM Adjusted EBITDA 2.9x 3.4x 3.8x 5.2x 6.2x 6.9x 8.2x 7.0x 7.0x 2.3x 2.5x 2.8x 3.6x 4.3x 4.7x 5.5x 5.3x 5.2x Net Recourse Debt Adjusted for Intercompany / LTM Adjusted EBITDA
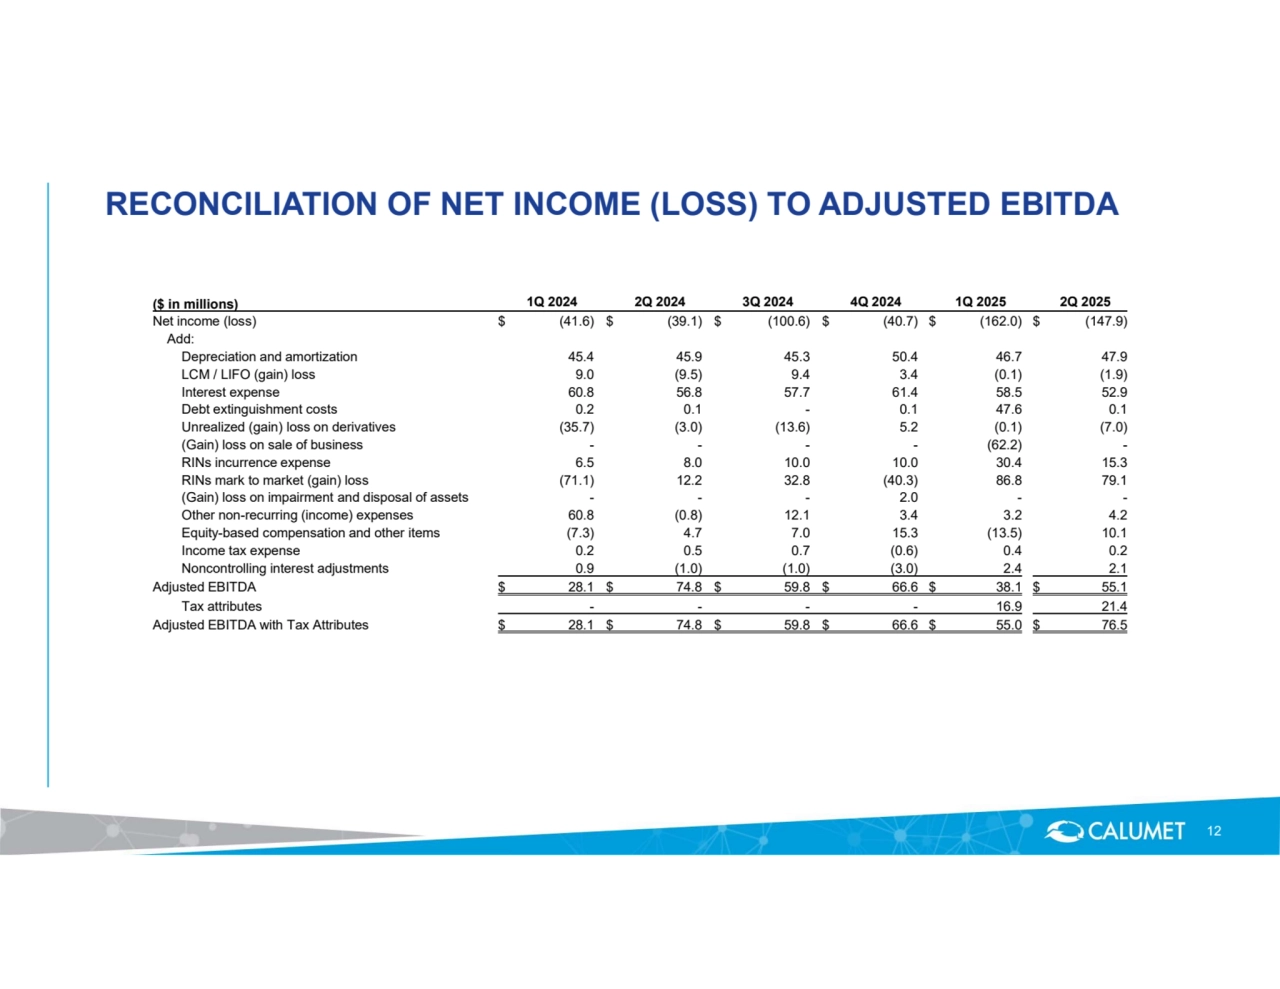
- 12. RECONCILIATION OF NET INCOME (LOSS) TO ADJUSTED EBITDA 12 ($ in millions) 1Q 2024 2Q 2024 3Q 2024 4Q 2024 1Q 2025 2Q 2025 Net income (loss) $ (41.6) $ (39.1) $ (100.6) $ (40.7) $ (162.0) $ (147.9) Add: Depreciation and amortization 45.4 45.9 45.3 50.4 46.7 47.9 LCM / LIFO (gain) loss 9.0 (9.5) 9.4 3.4 (0.1) (1.9) Interest expense 60.8 56.8 57.7 61.4 58.5 52.9 Debt extinguishment costs 0.2 0.1 - 0.1 47.6 0.1 Unrealized (gain) loss on derivatives (35.7) (3.0) (13.6) 5.2 (0.1) (7.0) (Gain) loss on sale of business - - - - (62.2) - RINs incurrence expense 6.5 8.0 10.0 10.0 30.4 15.3 RINs mark to market (gain) loss (71.1) 12.2 32.8 (40.3) 86.8 79.1 (Gain) loss on impairment and disposal of assets - - - 2.0 - - Other non-recurring (income) expenses 60.8 (0.8) 12.1 3.4 3.2 4.2 Equity-based compensation and other items (7.3) 4.7 7.0 15.3 (13.5) 10.1 Income tax expense 0.2 0.5 0.7 (0.6) 0.4 0.2 Noncontrolling interest adjustments 0.9 (1.0) (1.0) (3.0) 2.4 2.1 Adjusted EBITDA $ 28.1 $ 74.8 $ 59.8 $ 66.6 $ 38.1 $ 55.1 Tax attributes - - - - 16.9 21.4 Adjusted EBITDA with Tax Attributes $ 28.1 $ 74.8 $ 59.8 $ 66.6 $ 55.0 $ 76.5
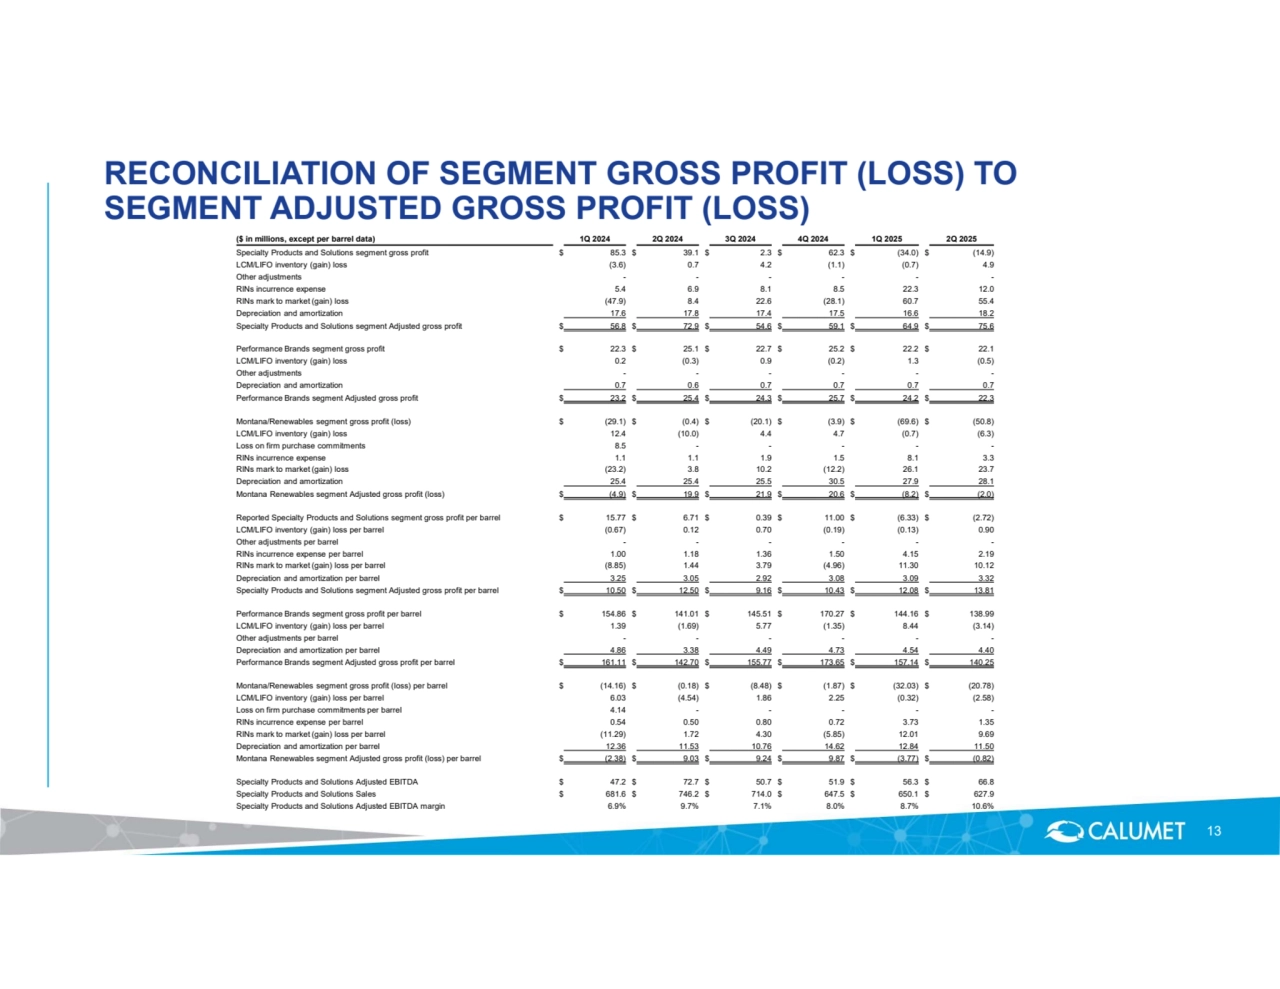
- 13. RECONCILIATION OF SEGMENT GROSS PROFIT (LOSS) TO SEGMENT ADJUSTED GROSS PROFIT (LOSS) 13 ($ in millions, except per barrel data) 1Q 2024 2Q 2024 3Q 2024 4Q 2024 1Q 2025 2Q 2025 Specialty Products and Solutions segment gross profit $ 85.3 $ 39.1 $ 2.3 $ 62.3 $ (34.0) $ (14.9) LCM/LIFO inventory (gain) loss (3.6) 0.7 4.2 (1.1) (0.7) 4.9 Other adjustments - - - - - - RINs incurrence expense 5.4 6.9 8.1 8.5 22.3 12.0 RINs mark to market (gain) loss (47.9) 8.4 22.6 (28.1) 60.7 55.4 Depreciation and amortization 17.6 17.8 17.4 17.5 16.6 18.2 Specialty Products and Solutions segment Adjusted gross profit $ 56.8 $ 72.9 $ 54.6 $ 59.1 $ 64.9 $ 75.6 Performance Brands segment gross profit $ 22.3 $ 25.1 $ 22.7 $ 25.2 $ 22.2 $ 22.1 LCM/LIFO inventory (gain) loss 0.2 (0.3) 0.9 (0.2) 1.3 (0.5) Other adjustments - - - - - - Depreciation and amortization 0.7 0.6 0.7 0.7 0.7 0.7 Performance Brands segment Adjusted gross profit $ 23.2 $ 25.4 $ 24.3 $ 25.7 $ 24.2 $ 22.3 Montana/Renewables segment gross profit (loss) $ (29.1) $ (0.4) $ (20.1) $ (3.9) $ (69.6) $ (50.8) LCM/LIFO inventory (gain) loss 12.4 (10.0) 4.4 4.7 (0.7) (6.3) Loss on firm purchase commitments 8.5 - - - - - RINs incurrence expense 1.1 1.1 1.9 1.5 8.1 3.3 RINs mark to market (gain) loss (23.2) 3.8 10.2 (12.2) 26.1 23.7 Depreciation and amortization 25.4 25.4 25.5 30.5 27.9 28.1 Montana Renewables segment Adjusted gross profit (loss) $ (4.9) $ 19.9 $ 21.9 $ 20.6 $ (8.2) $ (2.0) Reported Specialty Products and Solutions segment gross profit per barrel $ 15.77 $ 6.71 $ 0.39 $ 11.00 $ (6.33) $ (2.72) LCM/LIFO inventory (gain) loss per barrel (0.67) 0.12 0.70 (0.19) (0.13) 0.90 Other adjustments per barrel - - - - - - RINs incurrence expense per barrel 1.00 1.18 1.36 1.50 4.15 2.19 RINs mark to market (gain) loss per barrel (8.85) 1.44 3.79 (4.96) 11.30 10.12 Depreciation and amortization per barrel 3.25 3.05 2.92 3.08 3.09 3.32 Specialty Products and Solutions segment Adjusted gross profit per barrel $ 10.50 $ 12.50 $ 9.16 $ 10.43 $ 12.08 $ 13.81 Performance Brands segment gross profit per barrel $ 154.86 $ 141.01 $ 145.51 $ 170.27 $ 144.16 $ 138.99 LCM/LIFO inventory (gain) loss per barrel 1.39 (1.69) 5.77 (1.35) 8.44 (3.14) Other adjustments per barrel - - - - - - Depreciation and amortization per barrel 4.86 3.38 4.49 4.73 4.54 4.40 Performance Brands segment Adjusted gross profit per barrel $ 161.11 $ 142.70 $ 155.77 $ 173.65 $ 157.14 $ 140.25 Montana/Renewables segment gross profit (loss) per barrel $ (14.16) $ (0.18) $ (8.48) $ (1.87) $ (32.03) $ (20.78) LCM/LIFO inventory (gain) loss per barrel 6.03 (4.54) 1.86 2.25 (0.32) (2.58) Loss on firm purchase commitments per barrel 4.14 - - - - - RINs incurrence expense per barrel 0.54 0.50 0.80 0.72 3.73 1.35 RINs mark to market (gain) loss per barrel (11.29) 1.72 4.30 (5.85) 12.01 9.69 Depreciation and amortization per barrel 12.36 11.53 10.76 14.62 12.84 11.50 Montana Renewables segment Adjusted gross profit (loss) per barrel $ (2.38) $ 9.03 $ 9.24 $ 9.87 $ (3.77) $ (0.82) Specialty Products and Solutions Adjusted EBITDA $ 47.2 $ 72.7 $ 50.7 $ 51.9 $ 56.3 $ 66.8 Specialty Products and Solutions Sales $ 681.6 $ 746.2 $ 714.0 $ 647.5 $ 650.1 $ 627.9 Specialty Products and Solutions Adjusted EBITDA margin 6.9% 9.7% 7.1% 8.0% 8.7% 10.6%
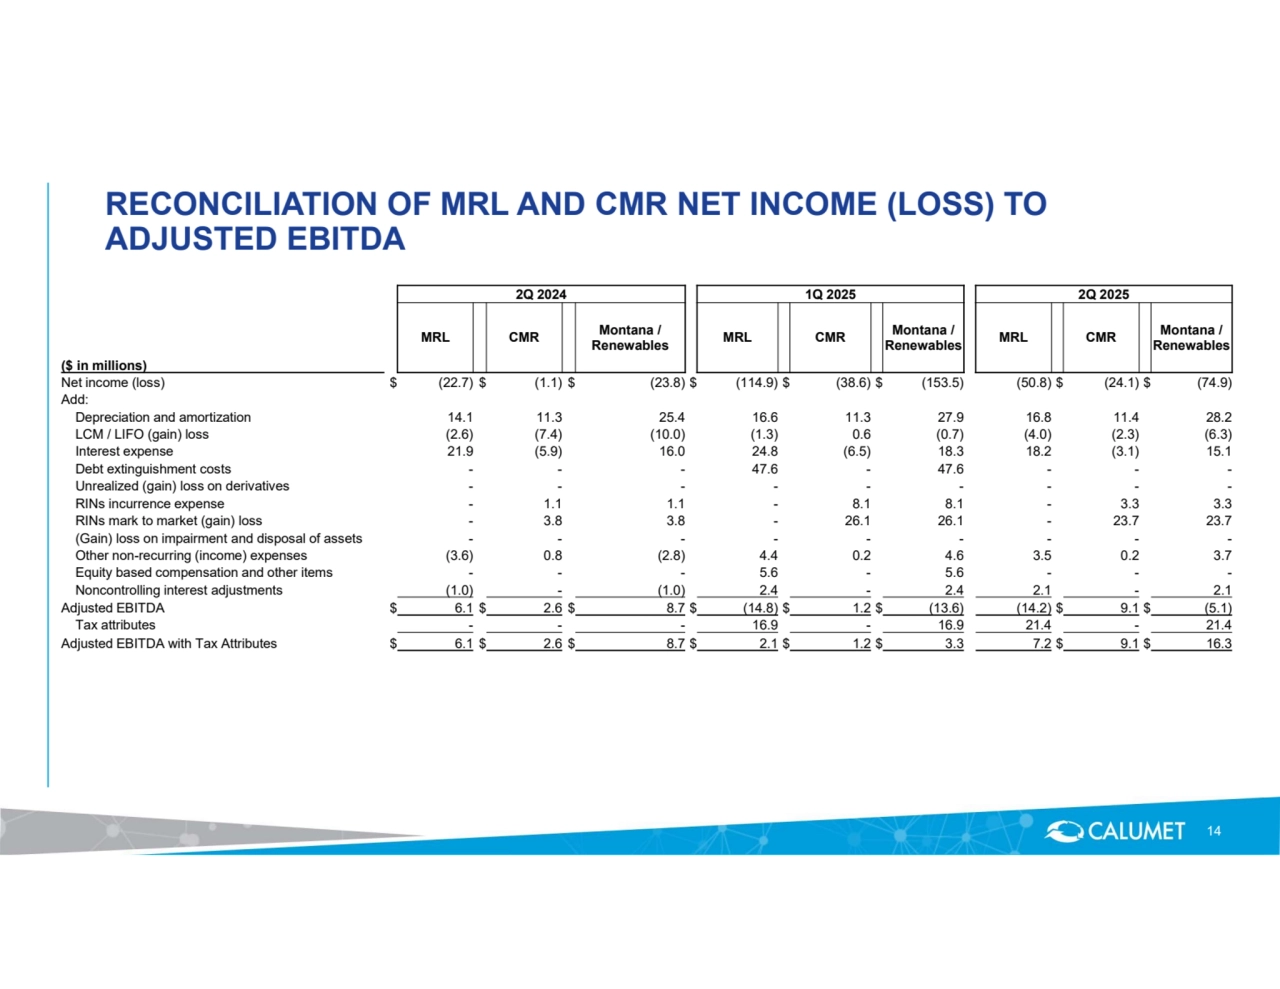
- 14. RECONCILIATION OF MRL AND CMR NET INCOME (LOSS) TO ADJUSTED EBITDA 14 2Q 2024 1Q 2025 2Q 2025 Montana / Renewables MRL CMR Montana / Renewables MRL CMR Montana / Renewables MRL CMR ($ in millions) Net income (loss) $ (22.7) $ (1.1) $ (23.8) $ (114.9) $ (38.6) $ (153.5) (50.8) $ (24.1) $ (74.9) Add: Depreciation and amortization 14.1 11.3 25.4 16.6 11.3 27.9 16.8 11.4 28.2 LCM / LIFO (gain) loss (2.6) (7.4) (10.0) (1.3) 0.6 (0.7) (4.0) (2.3) (6.3) Interest expense 21.9 (5.9) 16.0 24.8 (6.5) 18.3 18.2 (3.1) 15.1 Debt extinguishment costs - - - 47.6 - 47.6 - - - Unrealized (gain) loss on derivatives - - - - - - - - - RINs incurrence expense - 1.1 1.1 - 8.1 8.1 - 3.3 3.3 RINs mark to market (gain) loss - 3.8 3.8 - 26.1 26.1 - 23.7 23.7 (Gain) loss on impairment and disposal of assets - - - - - - - - - Other non-recurring (income) expenses (3.6) 0.8 (2.8) 4.4 0.2 4.6 3.5 0.2 3.7 Equity based compensation and other items - - - 5.6 - 5.6 - - - Noncontrolling interest adjustments (1.0) - (1.0) 2.4 - 2.4 2.1 - 2.1 Adjusted EBITDA $ 6.1 $ 2.6 $ 8.7 $ (14.8) $ 1.2 $ (13.6) (14.2) $ 9.1 $ (5.1) Tax attributes - - - 16.9 - 16.9 21.4 - 21.4 Adjusted EBITDA with Tax Attributes $ 6.1 $ 2.6 $ 8.7 $ 2.1 $ 1.2 $ 3.3 7.2 $ 9.1 $ 16.3