Hyundai Motor Company Q2 2025 Business Results
 AI Summary
Key Insights
- 📈 Financial Overview: Reports a strong Q2 2025 with a 7.3% YoY increase in revenue, reaching 48.287 billion KRW.
- 🚗 Sales Growth: Highlights a steady increase in wholesale sales, achieving 1.07 million units, the highest since 2020.
- 🌍 Regional Performance: Details sales performance across various regions, including the U.S., Europe, and Korea, with specific growth drivers.
- 🌱 Eco-Friendly Vehicles: Notes the increasing sales of eco-friendly vehicles, driven by new models and shifting market demands.
- 🤝 Strategic Outlook: Plans for flexible sales strategies and production optimization to meet increasing demand and uncertainties in EV market.


Hyundai Motor Company Q2 2025 Business Results
- 1. July 24, 2025 Hyundai Motor Company Q2 2025 Business Results
- 2. In the presentation that follows and in related comments by Hyundai Motor’s management, our use of the words “expect,” “anticipate,” “project,” “estimate,” “forecast,” “objective,” “plan,” “goal,” “outlook,” “target,” “pursue” and similar expressions is intended to identify forward looking statements. The financial data discussed herein are presented on a preliminary basis before the audit from our Independent Auditor; final data will be included in HMC’s Independent auditor’s report. While these statements represent our current judgment on what the future may hold, and we believe these judgments are reasonable, actual results may differ materially due to numerous important factors. Such factors include, among others, the following : changes in economic conditions, currency exchange rates or political stability; shortages of fuel, labor strikes or work stoppages; market acceptance of the corporation’s new products; significant changes in the competitive environment; changes in laws, regulations and tax rates; and the ability of the corporation to achieve reductions in cost and employment levels to realize production efficiencies and implement capital expenditures at levels and times planned by management. We do not intend or assume any obligation to update any forward-looking statement, which speaks only as of the date on which it is made. Cautionary Statement with Respect to Forward-Looking Statements
- 3. Table of Contents Q2 Key Messages P. 3 Sales Summary P. 4 ~ 9 Financial Summary P. 10 ~ 13 Appendix P. 16 ~ 19
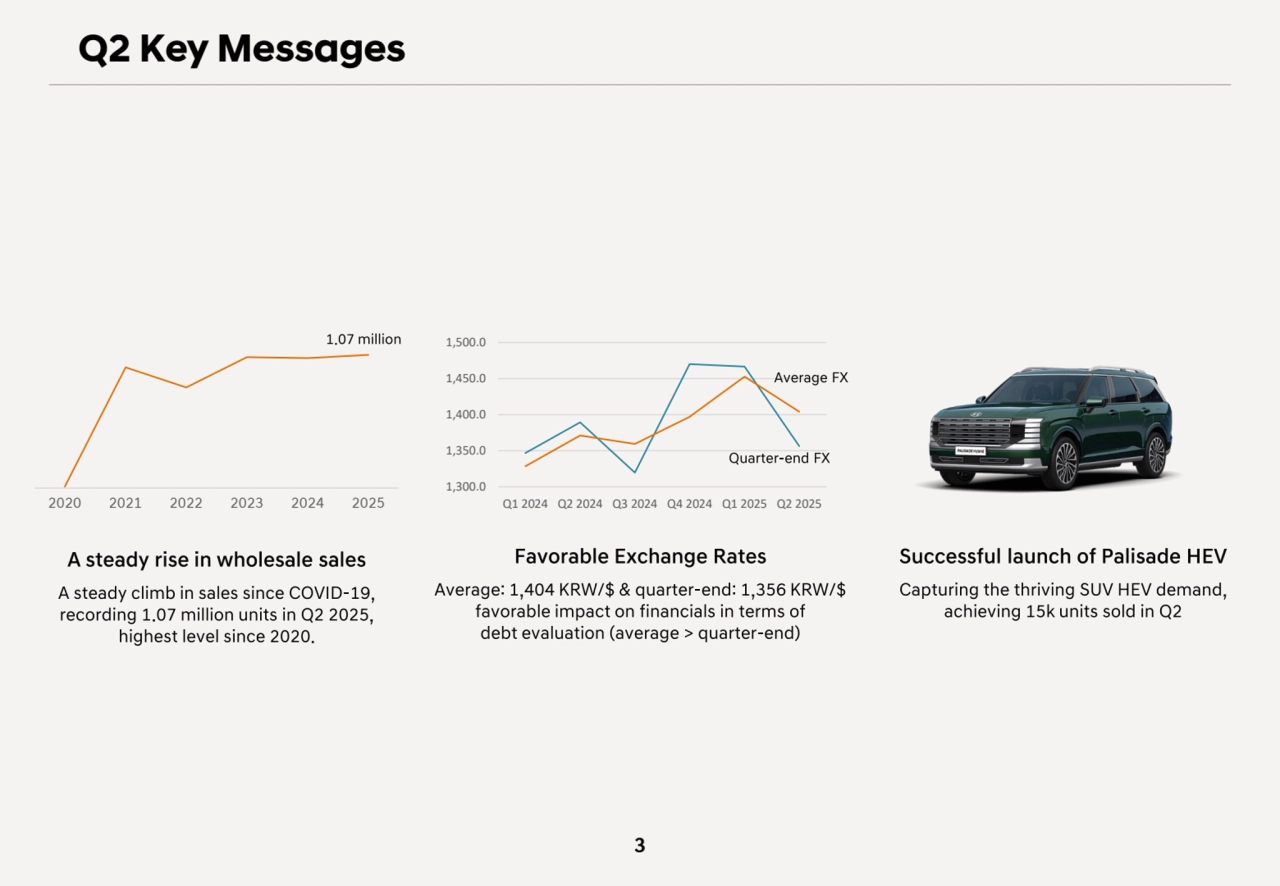
- 4. Q2 Key Messages A steady rise in wholesale sales A steady climb in sales since COVID-19, recording 1.07 million units in Q2 2025, highest level since 2020. Favorable Exchange Rates Average: 1,404 KRW/$ & quarter-end: 1,356 KRW/$ favorable impact on financials in terms of debt evaluation (average > quarter-end) Successful launch of Palisade HEV Capturing the thriving SUV HEV demand, achieving 15k units sold in Q2 1.07 million 1,300.0 1,350.0 1,400.0 1,450.0 1,500.0 Q1 2024 Q2 2024 Q3 2024 Q4 2024 Q1 2025 Q2 2025 Average FX Quarter-end FX 2020 2021 2022 2023 2024 2025 3
- 5. Sales Summary Global Wholesale / Retail Sales P. 5 Market Summary P. 6 ~ 8 Sales Analysis P. 9
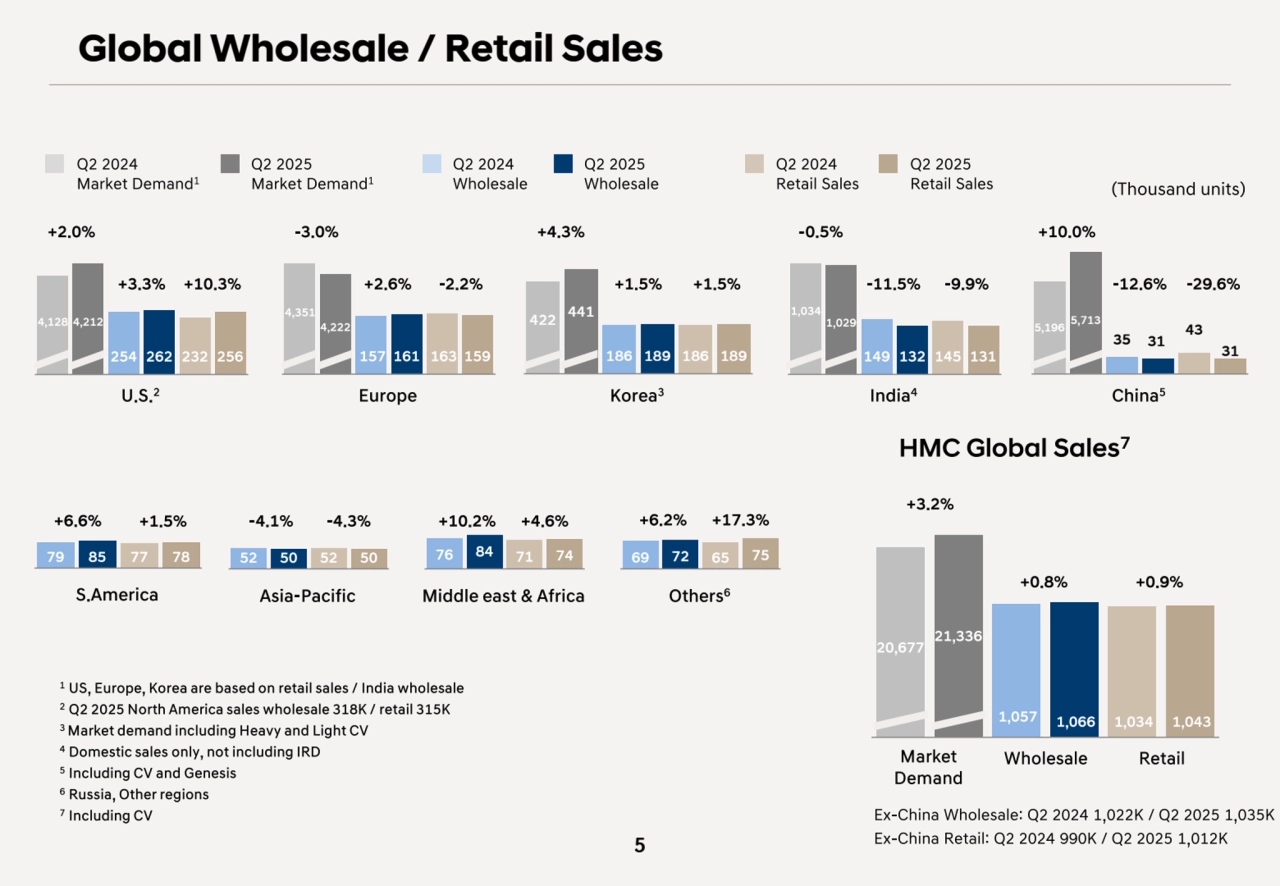
- 6. HMC Global Sales7 Asia-Pacific 52 50 52 50 -4.1% -4.3% 5 S.America 79 85 77 78 +6.6% +1.5% U.S.2 4,128 4,212 254 262 232 256 +3.3% +10.3% +2.0% 4,351 4,222 157 161 163 159 Europe +2.6% -2.2% -3.0% India4 1,034 1,029 149 132 145 131 -11.5% -9.9% -0.5% 5,196 5,713 35 31 43 31 China5 -12.6% -29.6% +10.0% Korea3 422 441 186 189 186 189 +1.5% +1.5% +4.3% 20,677 21,336 1,057 1,066 1,034 1,043 +0.8% +0.9% +3.2% Market Wholesale Retail Demand Middle east & Africa 76 84 71 74 +10.2% +4.6% Others6 69 72 65 75 +6.2% +17.3% Global Wholesale / Retail Sales (Thousand units) Q2 2024 Wholesale Q2 2025 Wholesale Q2 2024 Retail Sales Q2 2025 Retail Sales Q2 2024 Market Demand1 Q2 2025 Market Demand1 1 US, Europe, Korea are based on retail sales / India wholesale 2 Q2 2025 North America sales wholesale 318K / retail 315K 3 Market demand including Heavy and Light CV 4 Domestic sales only, not including IRD 5 Including CV and Genesis 6 Russia, Other regions 7 Including CV Ex-China Wholesale: Q2 2024 1,022K / Q2 2025 1,035K Ex-China Retail: Q2 2024 990K / Q2 2025 1,012K
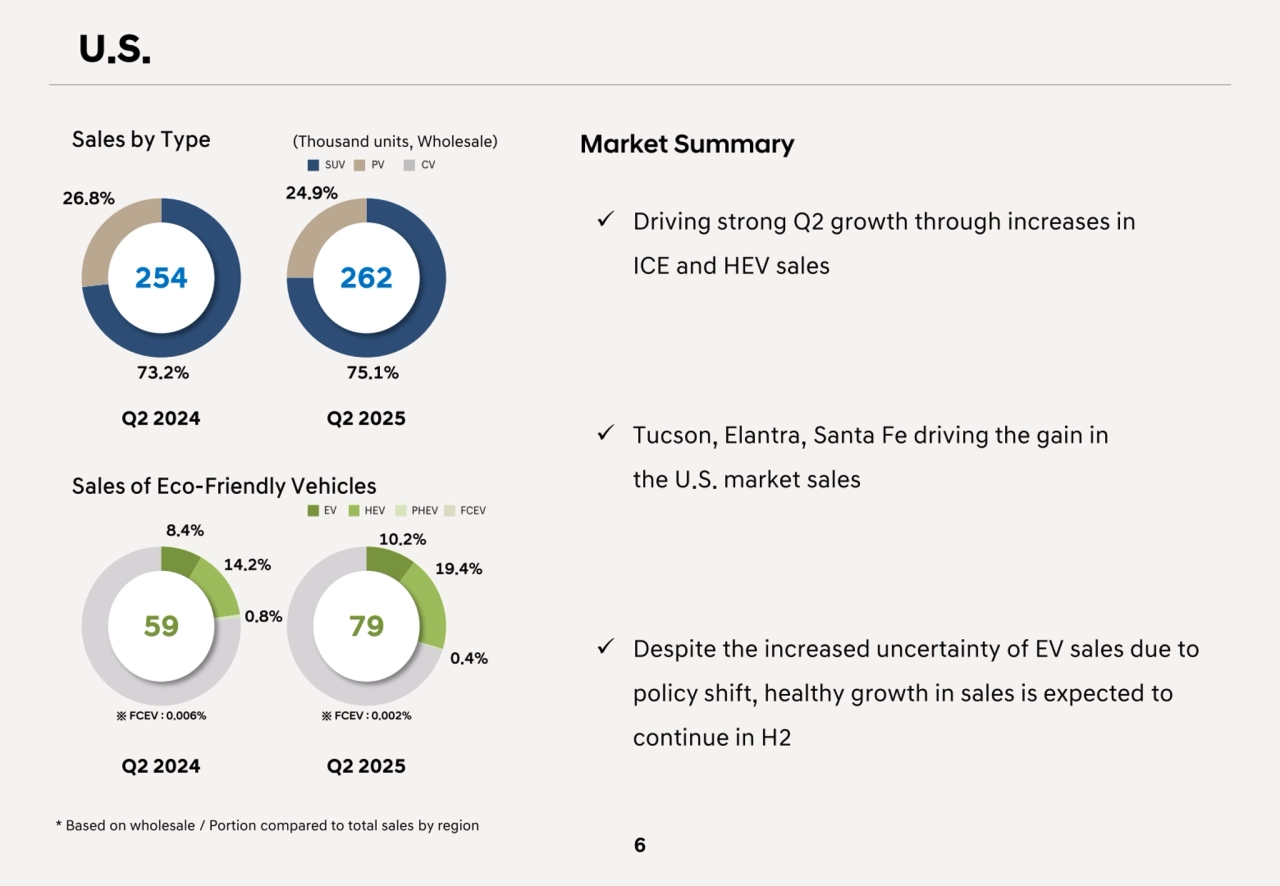
- 7. Sales by Type (Thousand units, Wholesale) Sales of Eco-Friendly Vehicles U.S. 6 * Based on wholesale / Portion compared to total sales by region 254 262 73.2% 75.1% 26.8% 24.9% Q2 2024 Q2 2025 Q2 2024 Q2 2025 59 79 14.2% 8.4% ※ FCEV : 0.006% ※ FCEV : 0.002% 19.4% 10.2% 0.8% 0.4% Market Summary Driving strong Q2 growth through increases in ICE and HEV sales Tucson, Elantra, Santa Fe driving the gain in the U.S. market sales Despite the increased uncertainty of EV sales due to policy shift, healthy growth in sales is expected to continue in H2
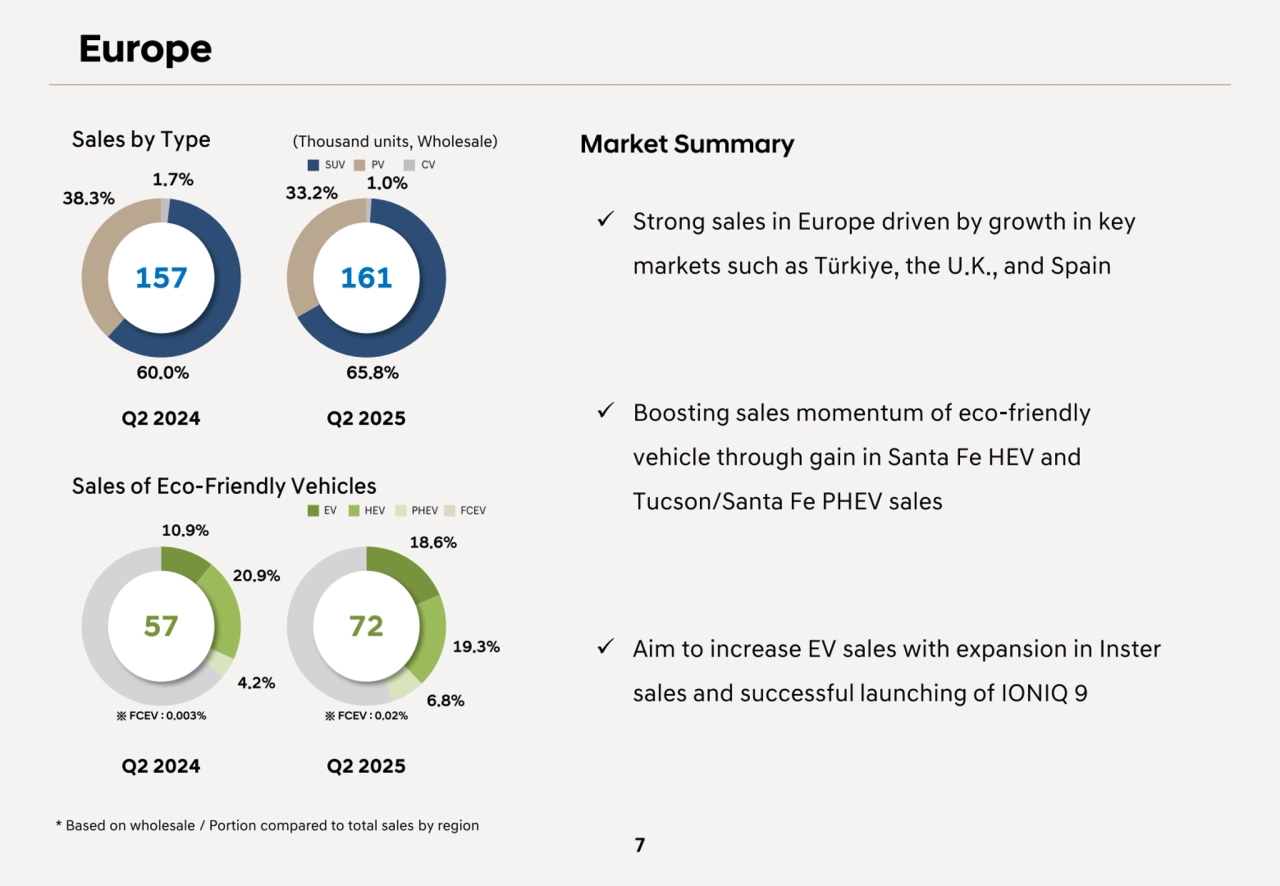
- 8. Sales by Type (Thousand units, Wholesale) Sales of Eco-Friendly Vehicles Europe 7 * Based on wholesale / Portion compared to total sales by region 157 161 60.0% 65.8% 38.3% 33.2% 1.7% Q2 2024 Q2 2025 Q2 2024 Q2 2025 57 72 20.9% 10.9% ※ FCEV : 0.003% ※ FCEV : 0.02% 19.3% 18.6% 4.2% 6.8% 1.0% Market Summary Strong sales in Europe driven by growth in key markets such as Türkiye, the U.K., and Spain Boosting sales momentum of eco-friendly vehicle through gain in Santa Fe HEV and Tucson/Santa Fe PHEV sales Aim to increase EV sales with expansion in Inster sales and successful launching of IONIQ 9
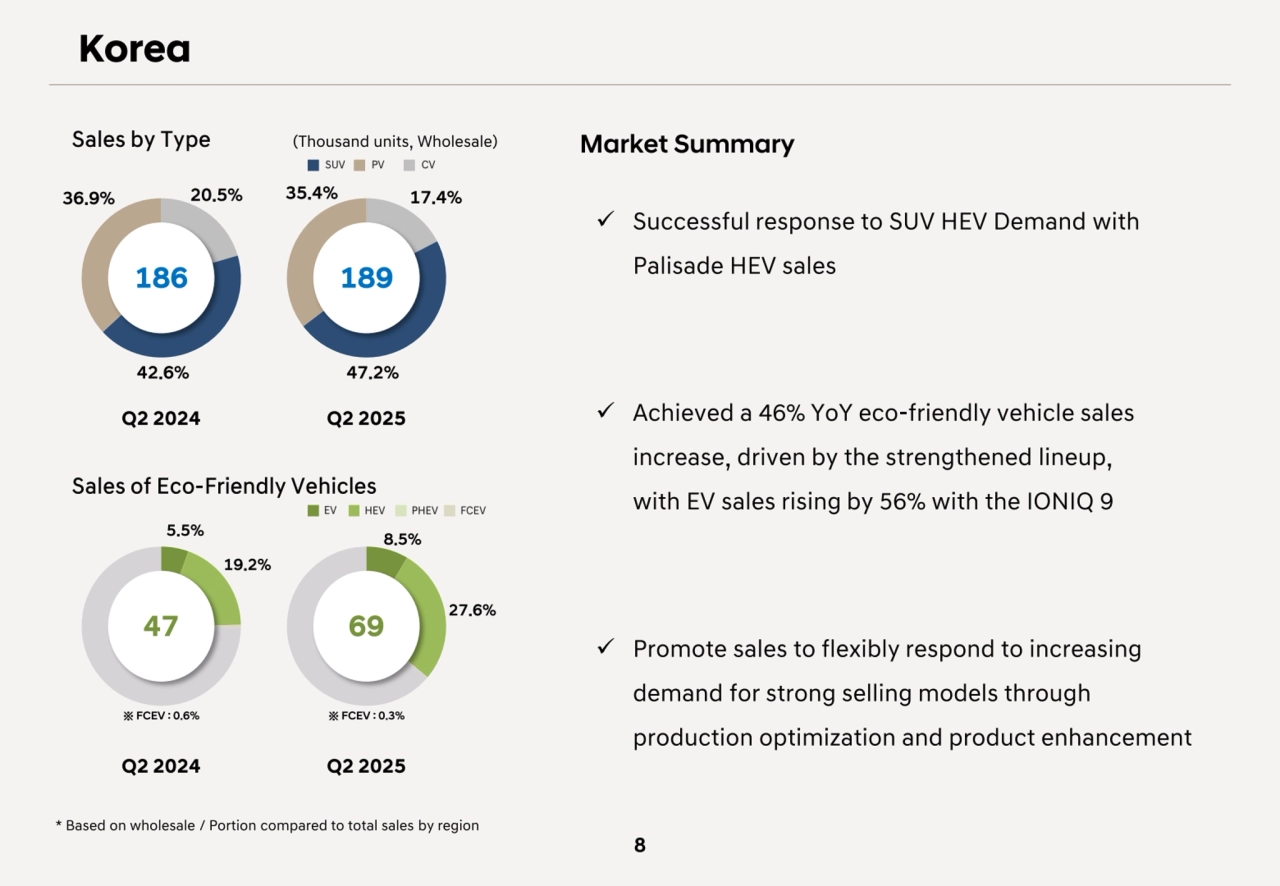
- 9. Sales by Type (Thousand units, Wholesale) Sales of Eco-Friendly Vehicles Korea 8 * Based on wholesale / Portion compared to total sales by region 186 189 42.6% 47.2% 36.9% 20.5% 35.4% Q2 2024 Q2 2025 Q2 2024 Q2 2025 47 69 19.2% 5.5% ※ FCEV : 0.6% ※ FCEV : 0.3% 27.6% 8.5% 17.4% Market Summary Successful response to SUV HEV Demand with Palisade HEV sales Achieved a 46% YoY eco-friendly vehicle sales increase, driven by the strengthened lineup, with EV sales rising by 56% with the IONIQ 9 Promote sales to flexibly respond to increasing demand for strong selling models through production optimization and product enhancement
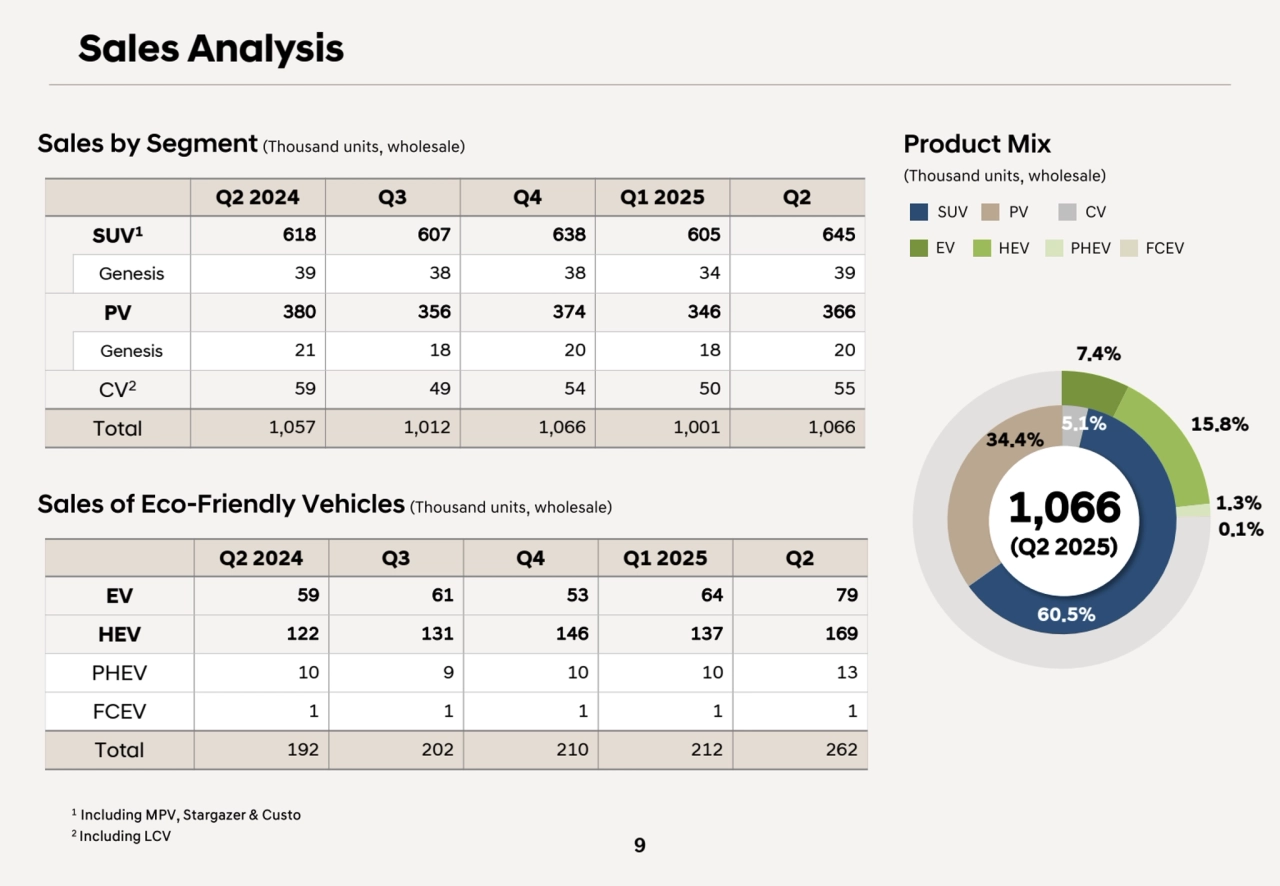
- 10. 9 Q2 2024 Q3 Q4 Q1 2025 Q2 SUV1 618 607 638 605 645 Genesis 39 38 38 34 39 PV 380 356 374 346 366 Genesis 21 18 20 18 20 CV2 59 49 54 50 55 Total 1,057 1,012 1,066 1,001 1,066 Sales by Segment (Thousand units, wholesale) Sales of Eco-Friendly Vehicles (Thousand units, wholesale) (Thousand units, wholesale) 1,066 (Q2 2025) Product Mix EV HEV PHEV FCEV SUV PV CV 1.3% 7.4% 15.8% 0.1% 60.5% 34.4% 5.1% Q2 2024 Q3 Q4 Q1 2025 Q2 EV 59 61 53 64 79 HEV 122 131 146 137 169 PHEV 10 9 10 10 13 FCEV 1 1 1 1 1 Total 192 202 210 212 262 Sales Analysis 1 Including MPV, Stargazer & Custo 2 Including LCV
- 11. Financial Summary Financial Summary P. 11 Revenue & Operating Income Analysis P. 12 Status of Income P. 13
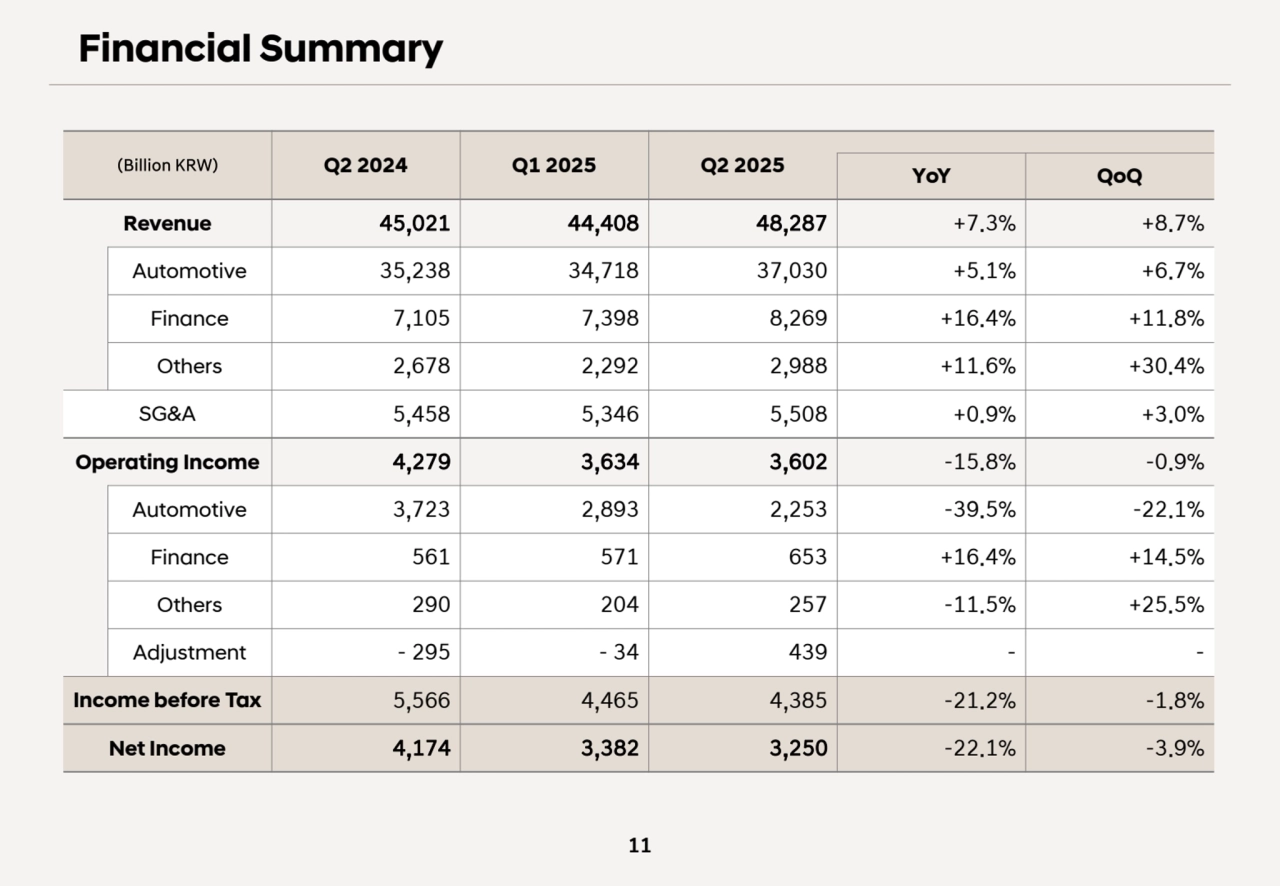
- 12. 11 (Billion KRW) Q2 2024 Q1 2025 Q2 2025 YoY QoQ Revenue 45,021 44,408 48,287 +7.3% +8.7% Automotive 35,238 34,718 37,030 +5.1% +6.7% Finance 7,105 7,398 8,269 +16.4% +11.8% Others 2,678 2,292 2,988 +11.6% +30.4% SG&A 5,458 5,346 5,508 +0.9% +3.0% Operating Income 4,279 3,634 3,602 -15.8% -0.9% Automotive 3,723 2,893 2,253 -39.5% -22.1% Finance 561 571 653 +16.4% +14.5% Others 290 204 257 -11.5% +25.5% Adjustment - 295 - 34 439 - - Income before Tax 5,566 4,465 4,385 -21.2% -1.8% Net Income 4,174 3,382 3,250 -22.1% -3.9% Financial Summary
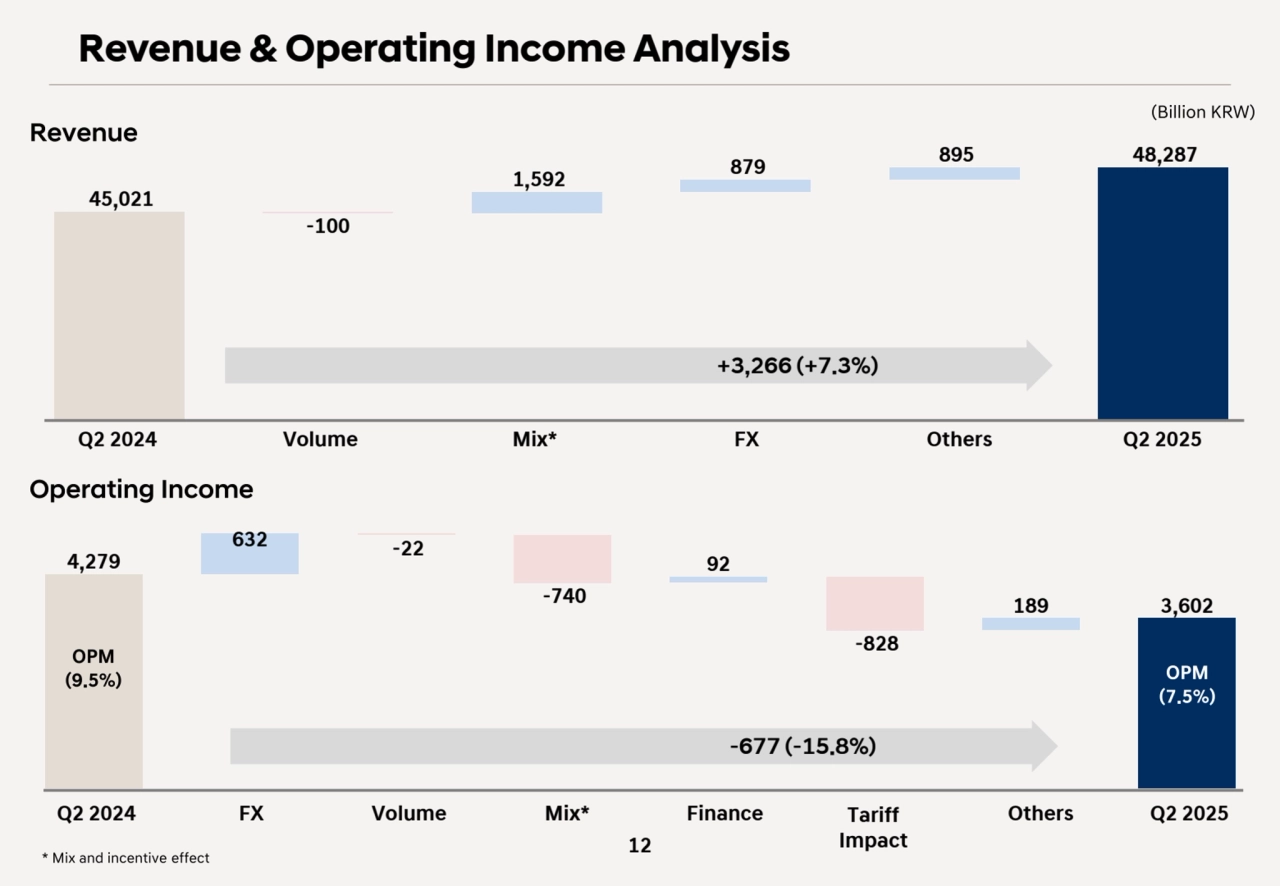
- 13. -22 4,279 632 -740 92 -828 189 3,602 Q2 2024 환율 물량 믹스 금융 관세 기타 Q2 2025 Tariff Impact Revenue Operating Income 12 45,021 -100 1,592 879 895 48,287 Q2 2024 Volume Mix FX Others Q2 2025 +3,266 (+7.3%) Q2 2024 Volume Mix* FX Others Q2 2025 Q2 2024 FX Volume Mix* Finance Others Q2 2025 OPM (9.5%) OPM (7.5%) -677 (-15.8%) * Mix and incentive effect Revenue & Operating Income Analysis (Billion KRW)
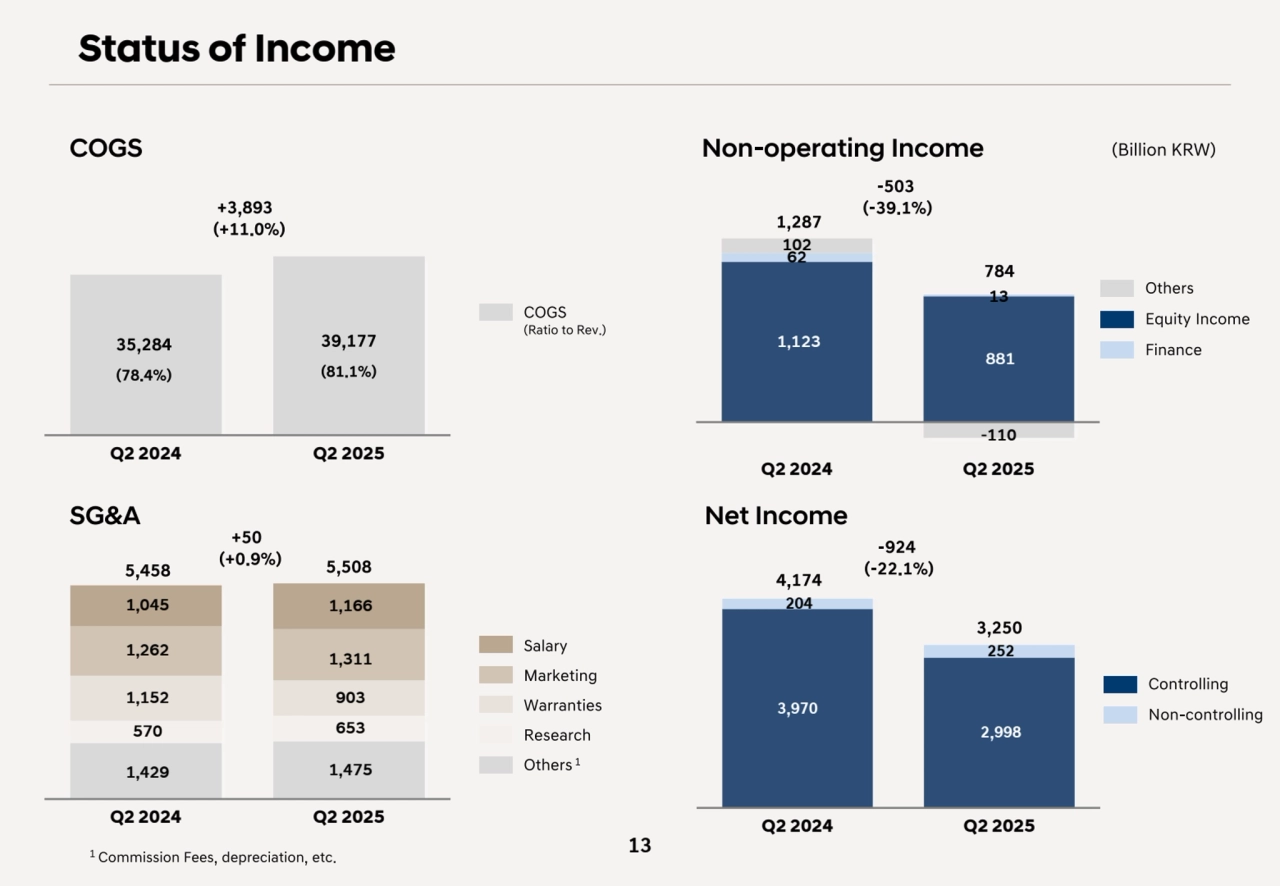
- 14. COGS Salary Marketing Warranties Research Others 1 1 Commission Fees, depreciation, etc. Non-operating Income Net Income Equity Income Finance Others Non-controlling Controlling (Billion KRW) 13 33,317 (80.0%) COGS (Ratio to Rev.) 37,574 (80.5%) SG&A Q2 2024 Q2 2025 1,123 881 62 13 102 -110 Q2 2024 Q2 2025 -503 (-39.1%) 3,970 2,998 204 252 Q2 2024 Q2 2025 -924 (-22.1%) 784 3,250 4,174 35,284 (78.4%) 39,177 (81.1%) 1,429 1,475 570 653 1,152 903 1,262 1,311 1,045 1,166 Q2 2024 Q2 2025 +50 (+0.9%) +3,893 (+11.0%) 1,287 5,458 5,508 Status of Income
- 15. Thank You
- 16. Q&A
- 17. Appendix Statement of Financial Position P. 18 Statement of Cash Flows P. 19 Statement of Income P. 17
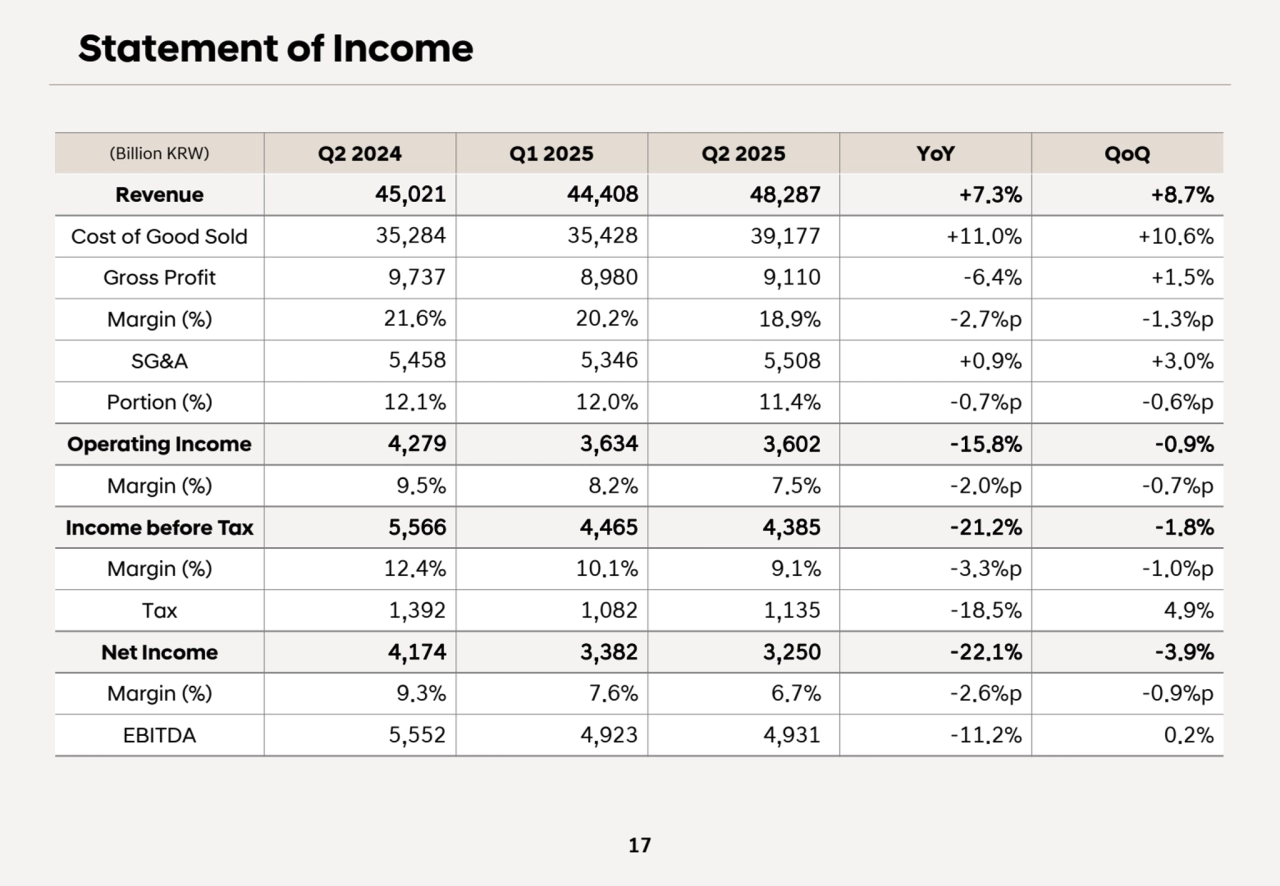
- 18. 17 (Billion KRW) Q2 2024 Q1 2025 Q2 2025 YoY QoQ Revenue 45,021 44,408 48,287 +7.3% +8.7% Cost of Good Sold 35,284 35,428 39,177 +11.0% +10.6% Gross Profit 9,737 8,980 9,110 -6.4% +1.5% Margin (%) 21.6% 20.2% 18.9% -2.7%p -1.3%p SG&A 5,458 5,346 5,508 +0.9% +3.0% Portion (%) 12.1% 12.0% 11.4% -0.7%p -0.6%p Operating Income 4,279 3,634 3,602 -15.8% -0.9% Margin (%) 9.5% 8.2% 7.5% -2.0%p -0.7%p Income before Tax 5,566 4,465 4,385 -21.2% -1.8% Margin (%) 12.4% 10.1% 9.1% -3.3%p -1.0%p Tax 1,392 1,082 1,135 -18.5% 4.9% Net Income 4,174 3,382 3,250 -22.1% -3.9% Margin (%) 9.3% 7.6% 6.7% -2.6%p -0.9%p EBITDA 5,552 4,923 4,931 -11.2% 0.2% Statement of Income
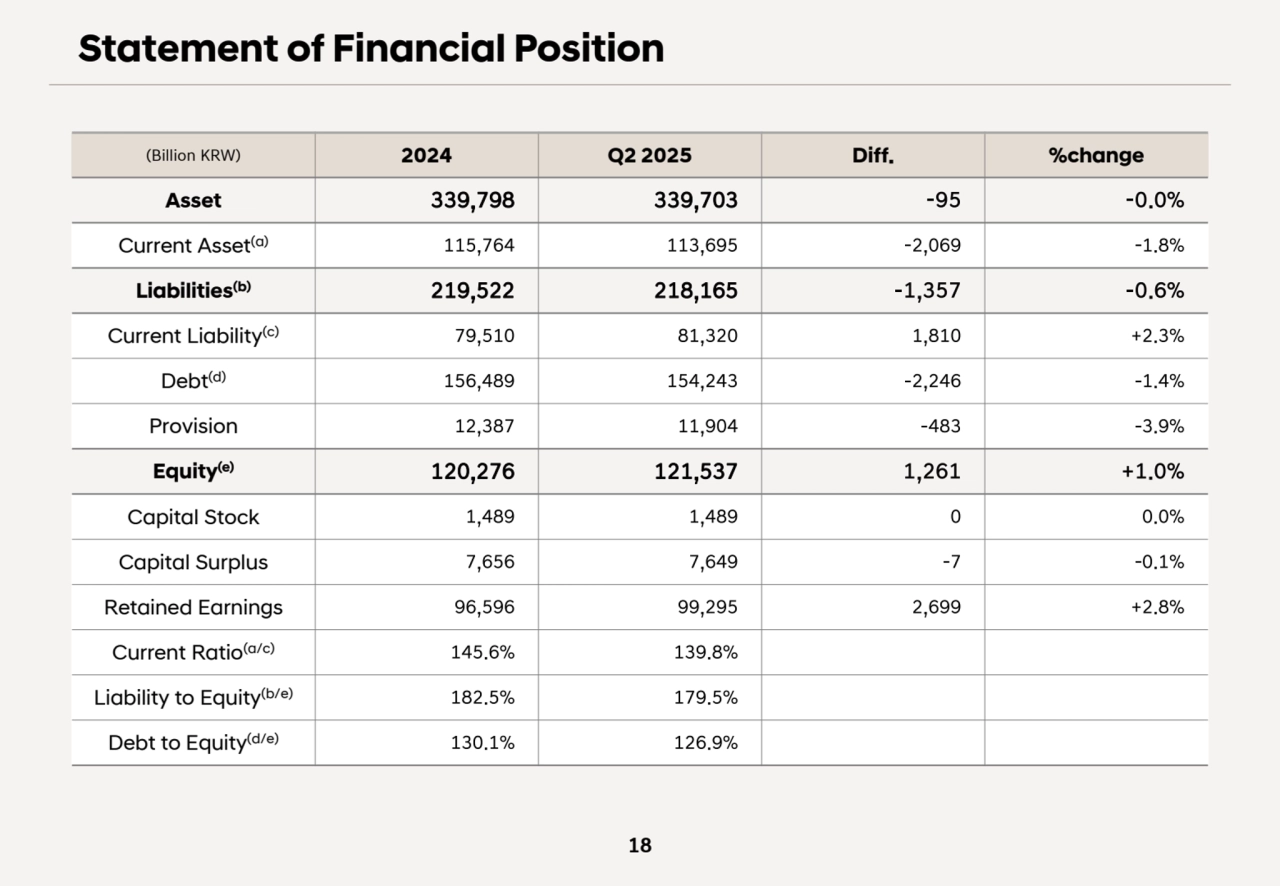
- 19. 18 (Billion KRW) 2024 Q2 2025 Diff. %change Asset 339,798 339,703 -95 -0.0% Current Asset(a) 115,764 113,695 -2,069 -1.8% Liabilities(b) 219,522 218,165 -1,357 -0.6% Current Liability(c) 79,510 81,320 1,810 +2.3% Debt(d) 156,489 154,243 -2,246 -1.4% Provision 12,387 11,904 -483 -3.9% Equity(e) 120,276 121,537 1,261 +1.0% Capital Stock 1,489 1,489 0 0.0% Capital Surplus 7,656 7,649 -7 -0.1% Retained Earnings 96,596 99,295 2,699 +2.8% Current Ratio(a/c) 145.6% 139.8% Liability to Equity(b/e) 182.5% 179.5% Debt to Equity(d/e) 130.1% 126.9% Statement of Financial Position
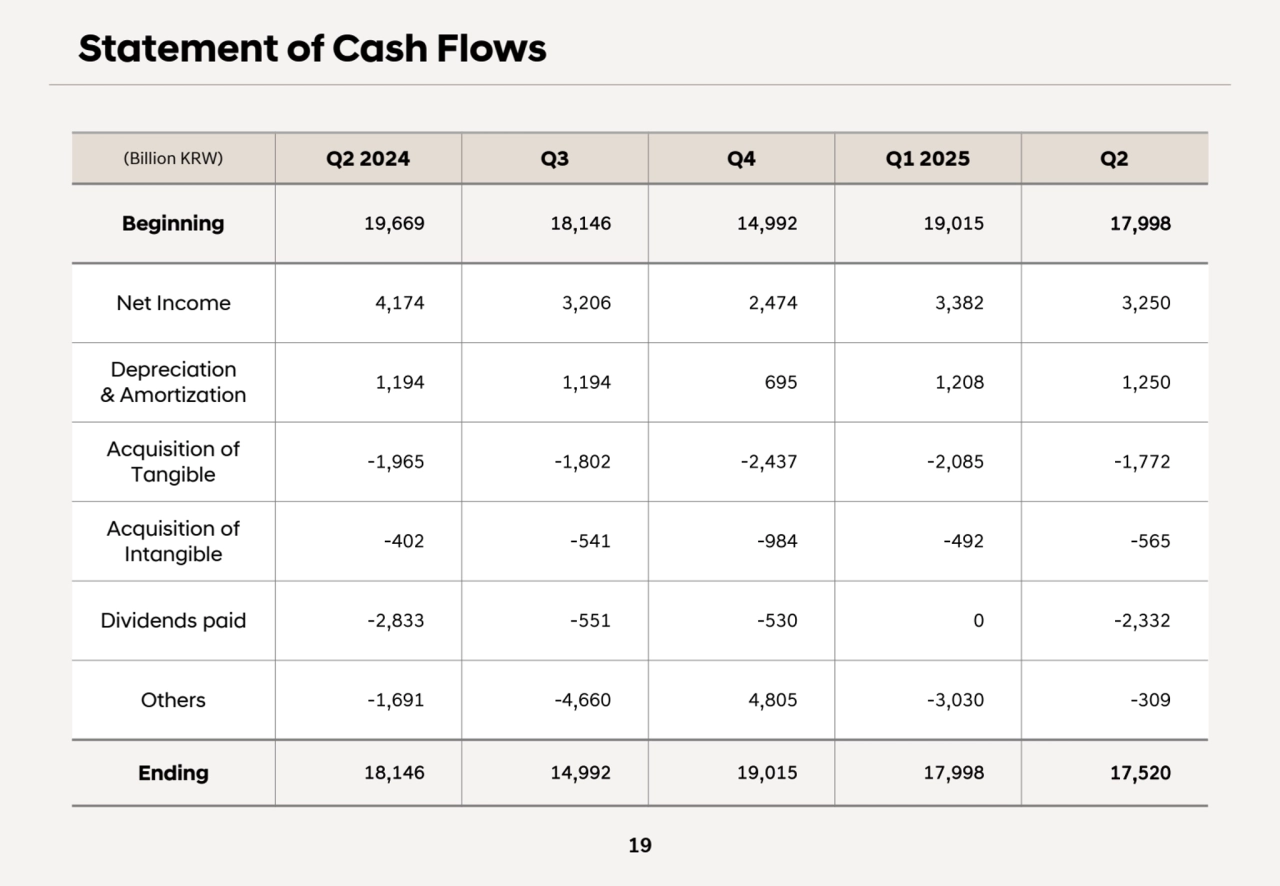
- 20. 19 (Billion KRW) Q2 2024 Q3 Q4 Q1 2025 Q2 Beginning 19,669 18,146 14,992 19,015 17,998 Net Income 4,174 3,206 2,474 3,382 3,250 Depreciation & Amortization 1,194 1,194 695 1,208 1,250 Acquisition of Tangible -1,965 -1,802 -2,437 -2,085 -1,772 Acquisition of Intangible -402 -541 -984 -492 -565 Dividends paid -2,833 -551 -530 0 -2,332 Others -1,691 -4,660 4,805 -3,030 -309 Ending 18,146 14,992 19,015 17,998 17,520 Statement of Cash Flows