Riskified Investor Update: August 2025

    Riskified Investor Update: August 2025

    F2 days ago 2

    AIAI Summary

    toggle
    Bulleted
    toggle
    Text

    Key Insights

    Loading...

    Investor 
Presentation
August 2025
    1/38

    Loading...

    Forward-Looking Statements
This presentation contains forward-looking statements within the meaning of the safe harbor provisions of the U.S. Private Securities Litigation Reform Act of 1995. We intend such forward-looking statements to be 
covered by the safe harbor provisions for forward-looking statements contained in Section 27A of the U.S. Securities Act of 1933, as amended (the “Securities Act”) and Section 21E of the U.S. Securities Exchange Act of 
1934, as amended (the “Exchange Act”). All statements contained in this press release other than statements of historical fact, including, without limitation, statements regarding our revenue and Adjusted EBITDA 
guidance for fiscal year 2025, our anticipated non-GAAP gross profit margin, expectations as to continued margin and Adjusted EBITDA expansion, future growth potential in new verticals, new geographies and from 
new products, anticipated benefits of our share repurchase program and management of our dilution, internal modeling assumptions, expectations as to the macroeconomic environment, expectations as to our new 
merchant pipeline and geographic reach, market share and upsell opportunities, the impact of competition, pricing pressure and churn, the advancement and performance of our AI-powered multi-product platform, the 
benefits of our partnerships and collaborations with third-parties, our forecasted operating expenses, and our business plans and strategy are forward-looking statements, which reflect our current views, as of the date 
hereof, with respect to future events and are not a guarantee of future performance. The words “believe,” “may,” “will,” “estimate,” “potential,” “continue,” “anticipate,” “intend,” “expect,” “could,” “would,” “project,” 
“forecasts,” “aims,” “plan,” “target,” and similar expressions are intended to identify forward-looking statements, though not all forward-looking statements use these words or expressions.
Actual outcomes may differ materially from the information contained in the forward-looking statements as a result of a number of factors, including, without limitation, the following: our ability to manage our growth 
effectively; continued use of credit cards and other payment methods that expose merchants to the risk of payment fraud, an dother changes in laws and regulations, including card scheme rules, related to the use of 
these payment methods, and the emergence of new alternative payment products; our ability to attract new merchants and retain existing merchants and increase sales of our products to existing merchants; our 
history of net losses and ability to achieve profitability; the impact of macroeconomic and geopolitical conditions on us and on the performance of our merchants; the accuracy of our estimates of market opportunity and 
forecasts of market growth; competition; our ability to continue to improve our machine learning models; fluctuations in our CTB Ratio and gross profit margin, including as a result of large-scale merchant fraud events 
or other security incidents; our ability to protect the information of our merchants and consumers; our ability to predict future revenue due to lengthy sales cycles; seasonal fluctuations in revenue; our merchant 
concentration and loss of a significant merchant; the financial condition of our merchants, particularly in challenging macroeconomic environments, and the impact of pricing pressure; our ability to increase the adoption 
of our products, develop and introduce new products and effectively manage the impact of new product introductions on our existing product portfolio; our ability to mitigate the risks involved with selling our products 
to large enterprises; changes to our pricing and pricing structures; our ability to retain the services of our executive officers, and other key personnel, including our co-founders; our ability to attract and retain highly 
qualified personnel, including software engineers and data scientists; our ability to manage periodic realignments of our organization, including expansions or reductions in force; our exposure to existing and potential 
future litigation claims; our exposure to fluctuations in currency exchange rates, including recent declines in the value of the Israeli shekel against the US dollar as a result of the ongoing conflict in Israel; our ability to 
obtain additional capital; our reliance on third-party providers of cloud-based infrastructure; our ability to protect our intellectual property rights; technology and infrastructure interruptions or performance problems; the 
efficiency and accuracy of our machine learning models and access to third-party and merchant data; our ability to comply with evolving data protection, privacy and security laws; the development of regulatory 
frameworks for machine learning technology and artificial intelligence; our use of open-source software; our ability to enhance and maintain our brand; our ability to execute potential acquisitions, strategic investments, 
partnerships, or alliances; potential claims related to the violation of the intellectual property rights of third parties; our failure to comply with anti-corruption, trade compliance, and economic sanctions laws and 
regulations; disruption, instability and volatility in global markets and industries; our ability to enforce non-compete agreements entered into with our employees; our ability to maintain effective systems of disclosure 
controls and financial reporting; our ability to accurately estimate or judgements relating to our critical accounting policies; our business in China; changes in tax laws or regulations; increasing scrutiny of, and 
expectations for, environmental, social and governance initiatives; potential future requirements to collect sales or other taxes; potential future changes in the taxation of international business and corporate tax reform; 
changes in and application of insurance laws or regulations; conditions in Israel that may affect our operations; the impact of the dual class structure of our ordinary shares; risks associated with our share repurchase 
program, including the risk that the program could increase volatility and fail to enhance shareholder value; our status as a foreign private issuer; and other risk factors set forth in the section titled “Risk Factors” in our 
Annual Report on Form 20-F for the fiscal year ended December 31, 2024, as filed with the Securities and Exchange Commission (the “SEC”) on March 6, 2025, and subsequent reports we file or furnish with the SEC, 
and which are accessible on the SEC’s website at www.sec.gov. These statements reflect management’s current expectations, as of the date hereof, regarding future events and operating performance and speak only
as of the date of this presentation. You should not put undue reliance on any forward-looking statements. Although we believe that the expectations reflected in the forward-looking statements are reasonable, we
cannot guarantee that future results, levels of activity, performance and events and circumstances reflected in the forward-looking statements will be achieved or will occur. Except as required by applicable law, we
undertake no obligation to update or revise publicly any forward-looking statements, whether as a result of new information, future events or otherwise.
    2/38

    Loading...

    Key Performance Indicators and Non-GAAP Measures
This presentation contains key performance indicators including GMV, as well as non-GAAP measures, including Adjusted EBITDA and Free Cash Flow.
“Gross Merchandise Volume” or “GMV” is defined as the gross total dollar value of orders reviewed through our ecommerce risk intelligence platform during the period indicated, including the value of orders that we did not approve
“Billings” or “amounts billed” is defined as (1) gross amounts invoiced to our merchants and estimates for cancellations and service level agreements for transactions approved during the period plus (2) changes in estimates for cancellations and
service level agreements for orders approved in prior periods. Billings excludes credits issued for chargebacks.
Adjusted EBITDA, which is a non-GAAP measure of financial performance, is defined as net profit (loss) adjusted for items that we believe do not directly reflect our core operations such as depreciation and amortization (including amortization of
capitalized internal-use software as presented in our statement of cash flows), share-based compensation expense, payroll taxes related to share-based compensation, legal-related and other expenses, restructuring costs, provision for (benefit from)
income taxes, other income (expense) including foreign currency transaction gains and losses and gains and losses on non-designated hedges, and interest income (expense). Management believes that by excluding these items from net profit
(loss), Adjusted EBITDA provides useful and meaningful supplemental information. Adjusted EBITDA is used to evaluate our business, measure our performance, identify trends affecting our business, formulate financial projections, develop annual
budgets, and make strategic decisions. Adjusted EBITDA margin is calculated as Adjusted EBITDA divided by Revenue.
Adjusted EBITDA should not be considered in isolation, as an alternative to, or superior to net profit (loss) or other performance measures derived in accordance with GAAP. This metric is frequently used by analysts, investors and other interested
parties to evaluate companies in our industry. By providing Adjusted EBITDA, together with a reconciliation to the most comparable U.S. GAAP measure, we believe we are enhancing investors’ understanding of our business and our results of
operations, as well as assisting investors in evaluating how well we are executing our strategic initiatives.
Free Cash Flow is defined as net cash provided by (used in) operating activities less cash purchases of property and equipment. Free Cash Flow provides useful information to management and investors about the amount of cash generated by the
business that can be used for strategic opportunities, including investing in our business and strengthening our balance sheet. Free Cash Flow is limited because it does not represent the residual cash flow available for discretionary expenditures.
Free Cash Flow is not necessarily a measure of our ability to fund our cash needs.
Use of non-GAAP measures should not be construed as an inference that our future results will be unaffected by unusual or other items. Non-GAAP measures of financial performance have limitations as analytical tools in that these measures do not
reflect our cash expenditures, or future requirements for capital expenditures, or contractual commitments; these measures do not reflect changes in, or cash requirements for, our working capital needs; these measures do not reflect our tax
expense or the cash requirements to pay our taxes, and assets being depreciated and amortized will often have to be replaced in the future and these measures do not reflect any cash requirements for such replacements. The non-GAAP measures
used herein are not necessarily comparable to similarly titled captions of other companies due to different methods of calculation.
We are not able to provide a reconciliation of forward-looking Adjusted EBITDA, Adjusted EBITDA margin, non-GAAP gross profit, or non-GAAP operating expense for the fiscal year ending December 31, 2025 to net profit (loss), gross profit, and total
operating expenses, respectively, because certain items that are excluded from these non-GAAP metrics but included in the most directly comparable GAAP financial measures, cannot be predicted on a forward-looking basis without unreasonable
effort or are not within our control. For example, we are unable to forecast the magnitude of foreign currency transaction gains or losses which are subject to many economic and other factors beyond our control. For the same reasons, we are
unable to address the probable significance of the unavailable information, which could have a potentially unpredictable and significant impact on our future GAAP financial results.
See Appendix and our Earnings Release issued on May 14, 2025 for reconciliations of these non-GAAP financial measure to the most directly comparable GAAP measures.
    3/38

    Loading...

    Agenda
Company Overview
Financial Overview
Appendix
01
02
03
    4/38

    Loading...

    Company Overview
01
    5/38

    Loading...

    Unleash your 
eCommerce Growth
Leading ecommerce merchants trust Riskified 
to maximize revenue and profit with our AI-powered 
fraud management and risk intelligence platform.
    6/38

    Loading...

    Riskified is a Leader in eCommerce Risk Intelligence
Established more than a 
decade ago as a pioneer in 
AI-powered fraud 
management in ecommerce
2013
IPO in July 2021; 
only publicly held AI 
fraud and risk 
intelligence company
RSKD
Over ⅓ of the team 
devoted to R&D
33%+ 50+
Publicly held 
companies 
among our clients 
$336M
LTM Q2 2025 Revenue
51%
Non-GAAP Gross Profit 
Margin as LTM Q2 
2025
Adjusted EBITDA Margin 
as of LTM Q2 2025 
One of the largest reviewers 
of annual ecommerce volume 
(GMV) globally
~$145B ~5%
Note: Data based on Riskified reported data as of and for the year ended December 31, 2024 or LTM ended June 30, 2025.
    7/38

    Loading...

    1. GMV reviewed by Riskified in the twelve months ended June 30, 2025, 
2. Source: eMarketer (July 2025)
 LTM Q2’2025: 
~$145B1
~$8.3 trillion
 global ecommerce
 GMV in 20292
Attacking a Massive Market 
~$6.5 trillion 
global ecommerce
GMV in 20252
    8/38

    Loading...

    +$525B in annual lost sales 
due to falsely declined orders 1
Friction
& Lost Sales
Fraud &
Chargebacks
Abuse & Policy 
Enforcement
Account
Security
+$52B in fraudulent eCommerce 
orders each year 2
+$100B in abusive refunds 
& returns annually 3
1. eMarketer, Assumes that Riskified’s 8% average increase in merchant approval rates (per 
Riskified internal data) approximates the global false decline rate 
2. Juniper Research 
3. National Retail Federation Consumer Returns in Retail industry
Ecommerce Has Numerous, 
Complicated Pain Points
    9/38

    Loading...

    Riskified Unleashes AI on eCommerce Decisioning 
Legitimate Fraud & Abuse
?
Increased Revenue 
Decreased Costs
Better Customer 
Experiences
Separating Risky & Legitimate 
Identities…
…Driving Superior Business 
Outcomes
    10/38

    Loading...

    Covering the Entire Checkout Journey with AI-Powered Products
Account Creation & Account Log-In 
Order Approval & Fraud Review 
Bank Payment Authorization
Policy Enforcement & Claims Authorization
Chargeback Management
Account Secure
Chargeback Guarantee
 & Adaptive Checkout
Dispute Resolve
Policy Protect
    11/38

    Loading...

    Riskified helps the world’s leading enterprise merchants unleash their ecommerce growth by outsmarting risk
    12/38

    Loading...

    Gift card retailer
Lower chargeback rates
2.60%
1.3%
Competitor A
Competitor B 3.10%
Higher approval rates
 75.94%
Competitor A
Competitor B
71.30%
73.20%
Travel merchant
Lower chargeback rates
 0.44%
 0.35%
Competitor A
Higher approval rates
60.67%
62.13%
Competitor A
Fashion Retailer
Lower chargeback rates
0.89%
0.44%
Competitor A
Competitor B 1.01%
Minimum 95% approval 
rate target across providers
Source: Based on selected pilot studies conducted by three different merchants in 2022 and 2023 between Riskified and its direct competitors.
The studies leveraged data integrations with each merchant to analyze the efficacy of each vendor’s fraud detection capabilities.
Consistently Beating Next Gen Competitors in Head-to-Head Pilots
    13/38

    Loading...

    Automated Platform with Strong Network Effects 
Note: Internal data, based on Riskified calculations and Riskified proprietary engineered features
Riskified 
Flywheel
More 
Merchants
More 
GMV
More 
ROI
More Global 
Consumers
+4 billion
Historical full-lifecycle eCommerce 
transactions 
+950 million
Unique consumers in network 
+185
Countries with unique consumers 
+480
Data attributes of models
    14/38

    Loading...

    The Riskified Platform 
Deep Data 
Capture
Customized,
Autonomously 
Trained Models 
Enterprise 
Scalability 
& Compliance
Robust 
Identity 
Graph
AI-Powered 
Components 
Modular ML 
Infrastructure
    15/38

    Loading...

    Block 
account 
takeovers, 
build trust
Account Secure
Reduce false 
declines & 
convert more
Adaptive 
Checkout
Prevent 
fraud, 
lift revenue
Chargeback 
Guarantee
Stop abuse, 
reward 
loyalty
Policy 
Protect
Fight 
chargebacks, 
recover 
revenue
Dispute Resolve
Products Synergistically Improve Performance & ROI 
Multiple customer touch points all feed back into the Riskified platform
    16/38

    Loading...

    Products
Risk Intelligence
Linking insights
Real-Time Decisions
Decision optimizer
Model assembly
& training
Data purity ops
False decline identification
Ml Feedback
Merchant intel
Fraud ring interception
Anomaly detection
Performance Control
Network Data & Enrichment
Fight chargebacks, 
recover revenue
Risk Management
Block account 
takeovers, build trust
Stop policy abuse, 
reward loyalty
Prevent fraud, 
lift revenue
Order 
management
Payment service 
providers
Customer relationship 
management
Dynamic features
Ecommerce 
platform Issuer network Payment gateways
Chargeback Guarantee Policy Protect Dispute Resolve Account Secure
Real-time training data Managed and self-optimizing
machine learning Exposure modeling Active monitoring & alerting
Enables Rapid Product Development as New Use Cases Arise
Merchant Systems & 
Integrations
Global Merchant 
Network Identity
Graph
Modular ML Infrastructure
    17/38

    Loading...

    Win new 
merchants
Grow with our 
merchants
Land and 
expand
New 
categories
Platform 
Sale
Geographic 
expansion
Multiple Opportunities For Growth
    18/38

    Loading...

    Financial Overview
02
    19/38

    Loading...

    GMV
$36.4B
Revenue
$81.1M
Gross Profit
$39.8M
Adjusted EBITDA1
$2.1M
Q2 2025 Financial Highlights 
1
 Adjusted EBITDA is a non-GAAP metric. A reconciliation of this metric to the most directly comparable GAAP financial measure can be found in the Appendix and/or in our Q2 2025 Earnings Release 
issued on August 18, 2025.
    20/38

    Loading...

    FY2024
GMV
$141.2B
Revenue
$327.5M
Gross Profit:
$170.9M
Adjusted 
EBITDA1
$17.2M
Annual Financial Highlights 
-2% 1% -8% -14% -3% 5% Adjusted
EBITDA Margin1
1
 Adjusted EBITDA and Adjusted EBITDA margin are non-GAAP metrics. A reconciliation of these metrics to the most directly comparable GAAP financial measure can be found in the Appendix and/or in 
our Q4 2024 Earnings Release issued on March 5, 2025.
    21/38

    Loading...

    Strong Buyback Activity
In the second quarter of 2025 we repurchased an 
aggregate of 4.9 million shares for a total price of $23.3 
million including broker and transaction fees. Board of 
Directors authorized up to $75 million dollars of additional 
share repurchases 2. Total outstanding authorization is 
approximately $85 million as of August 15, 2025
Q2 2025 Financial Performance Highlights 
Achieved Record Q2 Revenues
Second quarter revenues of $81M, an increase of 3% 
year-over-year driven by strong new business wins 
and upsell activity. Record 1H revenues of $163M, an 
increase of 5% year-over-year.
Continued Expense Discipline
Our non-GAAP operating expenses as a percentage 
of revenue declined year-over-year from 50% to 47%, 
reflecting ongoing leverage in the business model. 
Seventh Consecutive Quarter of 
Positive Adjusted EBITDA1
We achieved positive Adjusted EBITDA of $2.1M in 
the second quarter, an improvement from the first 
quarter an the seventh consecutive quarter of 
positive Adjusted EBITDA. 
1. A reconciliation of Adjusted EBITDA to its most directly comparable GAAP financial measure, Net Profit (Loss), is provided in the Appendix
2. Approval subject to completion of required Israeli regulatory procedures.
    22/38

    Loading...

    Low Midpoint High
Revenue $336M $341M $346M
Adjusted EBITDA $18M $22M $26M
Annual Non-GAAP 
Weighted Average 
Shares Outstanding
164-166M
2025 Guidance Outlook
Improved Revenue & Maintained Adjusted EBITDA Guidance
    23/38

    Loading...

    Q2 2025 Business Highlights 
Further Vertical and 
Geographic Diversification 
with the Addition of New 
Merchants
We continued to have success landing 
new merchants on the Riskified 
platform, which in turn deepened our 
vertical and geographic reach. Our top 
ten new logos added during the second 
quarter represented wins in four 
verticals and all four geographies. 
Seven of our top ten new Chargeback 
Guarantee logos represented wins 
outside of the United States.
Strengthened Leadership 
Position in Tickets and Live 
Events
In our Ticketing and Live Events 
sub-vertical, we successfully upsold a 
large merchant by taking all of their 
remaining volume from a competitor. 
We believe that our strong performance 
in this category is driving a network 
flywheel effect, which is helping us to 
build a powerful competitive moat and 
deepen our expertise in the space.
Multi-Product Go-Live with 
New Japanese Merchant
Our top new logo won during the 
second quarter was with a key fashion 
retailer headquartered in Japan. We 
landed the account with multiple 
products upon contract signing, and we 
believe that our platform approach can 
unlock even further opportunities for 
growth in this region.
    24/38

    Loading...

    Q2 2025 Business Highlights 
Launched Innovative Agentic 
Ecommerce Solutions
We recently deployed multiple tools 
and solutions designed to advance 
fraud and abuse prevention in the 
evolving world of Agentic ecommerce. 
We believe that our deep ecommerce 
expertise, and unique data network will 
play a valuable role in setting the 
standard for how Agentic ecommerce 
can grow safely and profitably for 
merchants. 
Partnered with HUMAN 
Security to Power a Safe AI 
Shopping Agent Future
This collaboration combines HUMAN’s 
AI agent visibility, governance, and trust 
capabilities with Riskified’s ecommerce 
risk intelligence expertise in fraud 
prevention, chargeback protection, and 
policy abuse prevention. This 
partnership will leverage our 
industry-leading AI platform and 
expansive network insights to help 
secure the next era of digital 
commerce. 
Share Repurchase Program 
Update
We repurchased approximately 4.9 
million ordinary shares for an aggregate 
of approximately $23.3 million, 
including broker and transaction fees, 
during the second quarter. In addition, 
our Board of Directors has authorized 
the repurchase of an additional $75 
million of the Company’s ordinary 
shares, subject to the completion of 
Israeli regulatory procedures. Assuming 
completion of the required Israeli 
regulatory procedures, our total 
aggregate repurchase authorization 
outstanding was approximately $85 
million as of August 15th.
    25/38

    Loading...

    Over time, we have 
continued to diversify 
across industries
1
 and 
geographies
1
, 
with growth across all 
geographies in 2024 
1 Geography of billings determined by location of 
merchant’s headquarters. 2
 General category includes General Retailers & 
Food categories.
Industry and 
Geography 
Billings 
Trends 
APAC
EMEA
Other Americas
United States
Payments, Money Transfer & Crypto
Tickets & Travel
Electronics
Home
General 
2
Fashion & Luxury Goods
    26/38

    Loading...

    Adjusted EBITDA Over Time
$2.1M in Adjusted EBITDA, the seventh consecutive quarter of a positive Adjusted EBITDA
Note: Adjusted EBITDA and Adjusted EBITDA margin are non-GAAP metrics. A reconciliation of these metrics to the most directly comparable GAAP financial measure is provided in the Appendix.
Adj EBITDA 
Margin
IPO
    27/38

    Loading...

    Strong Free Cash Flow Model
● Meaningfully improved 
our Free Cash Flow 
(“FCF”) since IPO
● Expect approximately 
$30M in 2025
● $339M of cash, 
deposits and 
investments as of June 
30, 2025
● Zero Debt 
IPO
Note: Free cash flow is a non-GAAP metric. A reconciliation of Free Cash Flow to its most directly comparable GAAP financial measure, Net Cash Provided by Operating Activities, is provided in the Appendix.
    28/38

    Loading...

    Continuous 
Customer 
Penetration
 Our recent 2022 and 
2023 cohorts 
demonstrated 
exceptional growth, with 
the 2022 cohort tripling 
billings and the 2023 
cohort growing nearly 
sixfold in 2024
Billings Growth by Cohort 1
1 Each “cohort” includes all of the accounts that onboarded to the Riskified platform in a given year. For example, the 2024 cohort includes all the accounts that onboarded
to the Riskified platform during the year ended December 31, 2024.
2
2
    29/38

    Loading...

    CTB Cohorts 
Over Time
While CTB ratios fluctuate 
from period to period as 
a result of various factors, 
including changes in 
industry mix within 
cohorts, over the 
long-term we have been 
able to consistently 
demonstrate 
improvements on a 
cohort basis. 
We believe that this 
highlights the strength 
of our AI and our scalable 
financial model.
2020 
Cohort
1. For the purposes of this analysis, a “cohort” includes only the segments of eCommerce transaction volume submitted to the Riskified platform by new or existing merchants 
in a given year, based on the commercial terms in effect at the time of submission. For example, if a new merchant submitted only certain segments of their total eCommerce 
transaction volume to the Riskified platform in 2023, only those segments are included in the 2023 cohort. If in 2024 the same merchant submitted new segments of their 
eCommerce transaction volume to the Riskified platform, or there was a change to the commercial terms applicable to an existing segment, those additional segments and any 
incremental Billings and Chargebacks resulting from the revised commercial terms are included in the 2024 cohort
CTB Ratio by Cohort 1
2022
Cohort 
2023
Cohort 
2021 
Cohort 
2018
Cohort 2020 
Cohort
2013-2017 
Cohort
2019 
Cohort 
2024 Cohort 
starting point
    30/38

    Loading...

    ● More data:
○ Vertical & geographic penetration 
● More accurate models:
○ More models per merchant
○ Continuous model retraining
● Automated, real time fraud responses 
● Improved representment tactics
How We Drive Accuracy & CTB1 Improvements Over Time
Performance Improvement Levers:
Today
Tomorrow
Merchant B
Merchant A
Merchant C
Chargeback Rate
Approval Rate
90%
100%
1% 0%
Accuracy = Higher Approval Rates, 
Lower fees & Lower COGS
1. CTB = Chargebacks to Billings ratio
    31/38

    Loading...

    Appendix
03
    32/38

    Loading...

    Chargeback Guarantee Revenue Model Flow
Total ecommerce volume submitted to Riskified for review 
Varies by merchant based on a variety of inputs, 
including the industry of the merchant, the risk level of the end 
market, the percentage of GMV we review from the merchant, 
and the guaranteed approval rates we commit to provide
The product of Approval Rate and Risk-Adjusted Fee is our 
“Take Rate”
The amounts we charge our merchants for the GMV we approve
Billings are allocated between Fraud Review (ASC 606) and Indemnification 
Guarantee (ASC 460) and recognized accordingly
Take
Rate
(%)
Riskified’s GMV
Approval Rate (%)
Risk-Adjusted Fee (%)
Billings
Revenue
Transforming GMV into Revenue
    33/38

    Loading...

    $ in thousands Q2'24 Q2'25 H1'24 H1'25
Revenue 78,730 81,060 155,138 163,447
Cost of revenue 37,728 41,310 72,016 83,243
Gross profit 41,002 39,750 83,122 80,204
Operating expenses:
Research and development 17,079 17,167 34,851 35,244
Sales and marketing 22,468 21,452 45,682 44,234
General and administrative 15,650 14,137 32,697 30,790
Total operating expenses 55,197 52,756 113,230 110,268
Operating profit (loss) (14,195) (13,006) (30,108) (30,064)
Interest income (expense), net 5,398 3,569 11,139 7,294
Other income (expense), net 337 (471) 177 373
Profit (loss) before income taxes (8,460) (9,908) (18,792) (22,397)
Provision for income taxes 1,049 1,725 2,347 3,122
Net profit (loss) (9,509) (11,633) (21,139) (25,519)
Q2 & H1 2025 Income Statement
    34/38

    Loading...

    Q2 & H1 2025 Reconciliation of GAAP Net Profit (Loss) to Adjusted EBITDA
$ in thousands Q2'24 Q2'25 H1'24 H1'25
GAAP Net profit (loss) (9,509) (11,633) (21,139) (25,519)
Non GAAP expenses:
Share-based compensation expense 15,035 12,859 30,557 27,175
Payroll taxes related to share-based compensation 150 138 351 399
Depreciation and amortization 1,255 875 2,520 1,831
Interest income, net (5,398) (3,569) (11,139) (7,294)
Other (income) expense, net (337) 471 (177) (373)
Provision for income taxes 1,049 1,725 2,347 3,122
Restructuring costs 94 1,268 1,770 3,876
Legal-related and other expenses 1 0 1 236
Adjusted EBITDA 2,340 2,134 5,091 3,453
Adjusted EBITDA margin 3% 3% 3% 2%
    35/38

    Loading...

    Q2 & H1 2025 Reconciliation of Net Cash Provided by Operating Activities 
to Free Cash Flow
$ in thousands Q2'24 Q2'25 H1'24 H1'25
Net cash provided by (used in) operating activities 4,332 5,592 14,993 9,436
Purchases of property and equipment (224) (252) (402) (460)
Free Cash Flow 4,108 5,340 14,591 8,976
    36/38

    Loading...

    Q2 & H1 2025 Reconciliation of GAAP Gross Profit to Non-GAAP Gross 
Profit
$ in thousands Q2'24 Q2'25 H1'24 H1'25
GAAP Gross Profit 41,002 39,750 83,122 80,204
Non GAAP expenses:
Share-based compensation expense 200 179 411 371
Payroll taxes related to share-based compensation 6 6 11 10
Depreciation and amortization 423 283 850 608
Restructuring costs 17 129 156 263
Adjusted Gross Profit 41,648 40,347 84,550 81,456
Gross profit margin 52% 49% 54% 49%
Non-GAAP gross profit margin 53 % 50 % 54% 50%
    37/38

    Loading...

    Q2 2025 Balance Sheet 
Riskified BS - June 30, 2025 - USD in thousands
CURRENT ASSETS:
Cash and cash equivalents 265,032
Short-term Deposits 5,000
Short-term investments 69,093
Accounts receivables, net 33,365
Prepaid expenses and other current assets 14,624
Total current assets 387,114
LONG-TERM ASSETS:
Property and equipment, net 11,856
Operating lease right-of-use assets 23,285
Deferred contract acquisition costs 15,767
Other assets, noncurrent 7,466
Total assets 445,488
Riskified BS - June 30 2025 - USD in thousands
CURRENT LIABILITIES:
Accounts payable 1,435
Accrued compensation and benefits 21,808
Guarantee obligations 8,478
Provision for chargebacks, net 7,843
Operating lease liabilities, current 5,863
Accrued expenses and other current liabilities 16,562
Total current liabilities 61,989
LONG-TERM LIABILITIES:
Operating lease liabilities, noncurrent 20,691
Other liabilities, noncurrent 24,383
Total liabilities 107,063
SHAREHOLDERS' EQUITY:
Treasury shares (198,174)
Additional paid-in capital 1,007,632
Accumulated other comprehensive profit (loss) 977
Accumulated deficit (472,010)
Total shareholders' equity 338,425
Total liabilities and shareholders' equity 445,488
    38/38

    Riskified Investor Update: August 2025

    • 1. Investor Presentation August 2025
    • 2. Forward-Looking Statements This presentation contains forward-looking statements within the meaning of the safe harbor provisions of the U.S. Private Securities Litigation Reform Act of 1995. We intend such forward-looking statements to be covered by the safe harbor provisions for forward-looking statements contained in Section 27A of the U.S. Securities Act of 1933, as amended (the “Securities Act”) and Section 21E of the U.S. Securities Exchange Act of 1934, as amended (the “Exchange Act”). All statements contained in this press release other than statements of historical fact, including, without limitation, statements regarding our revenue and Adjusted EBITDA guidance for fiscal year 2025, our anticipated non-GAAP gross profit margin, expectations as to continued margin and Adjusted EBITDA expansion, future growth potential in new verticals, new geographies and from new products, anticipated benefits of our share repurchase program and management of our dilution, internal modeling assumptions, expectations as to the macroeconomic environment, expectations as to our new merchant pipeline and geographic reach, market share and upsell opportunities, the impact of competition, pricing pressure and churn, the advancement and performance of our AI-powered multi-product platform, the benefits of our partnerships and collaborations with third-parties, our forecasted operating expenses, and our business plans and strategy are forward-looking statements, which reflect our current views, as of the date hereof, with respect to future events and are not a guarantee of future performance. The words “believe,” “may,” “will,” “estimate,” “potential,” “continue,” “anticipate,” “intend,” “expect,” “could,” “would,” “project,” “forecasts,” “aims,” “plan,” “target,” and similar expressions are intended to identify forward-looking statements, though not all forward-looking statements use these words or expressions. Actual outcomes may differ materially from the information contained in the forward-looking statements as a result of a number of factors, including, without limitation, the following: our ability to manage our growth effectively; continued use of credit cards and other payment methods that expose merchants to the risk of payment fraud, an dother changes in laws and regulations, including card scheme rules, related to the use of these payment methods, and the emergence of new alternative payment products; our ability to attract new merchants and retain existing merchants and increase sales of our products to existing merchants; our history of net losses and ability to achieve profitability; the impact of macroeconomic and geopolitical conditions on us and on the performance of our merchants; the accuracy of our estimates of market opportunity and forecasts of market growth; competition; our ability to continue to improve our machine learning models; fluctuations in our CTB Ratio and gross profit margin, including as a result of large-scale merchant fraud events or other security incidents; our ability to protect the information of our merchants and consumers; our ability to predict future revenue due to lengthy sales cycles; seasonal fluctuations in revenue; our merchant concentration and loss of a significant merchant; the financial condition of our merchants, particularly in challenging macroeconomic environments, and the impact of pricing pressure; our ability to increase the adoption of our products, develop and introduce new products and effectively manage the impact of new product introductions on our existing product portfolio; our ability to mitigate the risks involved with selling our products to large enterprises; changes to our pricing and pricing structures; our ability to retain the services of our executive officers, and other key personnel, including our co-founders; our ability to attract and retain highly qualified personnel, including software engineers and data scientists; our ability to manage periodic realignments of our organization, including expansions or reductions in force; our exposure to existing and potential future litigation claims; our exposure to fluctuations in currency exchange rates, including recent declines in the value of the Israeli shekel against the US dollar as a result of the ongoing conflict in Israel; our ability to obtain additional capital; our reliance on third-party providers of cloud-based infrastructure; our ability to protect our intellectual property rights; technology and infrastructure interruptions or performance problems; the efficiency and accuracy of our machine learning models and access to third-party and merchant data; our ability to comply with evolving data protection, privacy and security laws; the development of regulatory frameworks for machine learning technology and artificial intelligence; our use of open-source software; our ability to enhance and maintain our brand; our ability to execute potential acquisitions, strategic investments, partnerships, or alliances; potential claims related to the violation of the intellectual property rights of third parties; our failure to comply with anti-corruption, trade compliance, and economic sanctions laws and regulations; disruption, instability and volatility in global markets and industries; our ability to enforce non-compete agreements entered into with our employees; our ability to maintain effective systems of disclosure controls and financial reporting; our ability to accurately estimate or judgements relating to our critical accounting policies; our business in China; changes in tax laws or regulations; increasing scrutiny of, and expectations for, environmental, social and governance initiatives; potential future requirements to collect sales or other taxes; potential future changes in the taxation of international business and corporate tax reform; changes in and application of insurance laws or regulations; conditions in Israel that may affect our operations; the impact of the dual class structure of our ordinary shares; risks associated with our share repurchase program, including the risk that the program could increase volatility and fail to enhance shareholder value; our status as a foreign private issuer; and other risk factors set forth in the section titled “Risk Factors” in our Annual Report on Form 20-F for the fiscal year ended December 31, 2024, as filed with the Securities and Exchange Commission (the “SEC”) on March 6, 2025, and subsequent reports we file or furnish with the SEC, and which are accessible on the SEC’s website at www.sec.gov. These statements reflect management’s current expectations, as of the date hereof, regarding future events and operating performance and speak only as of the date of this presentation. You should not put undue reliance on any forward-looking statements. Although we believe that the expectations reflected in the forward-looking statements are reasonable, we cannot guarantee that future results, levels of activity, performance and events and circumstances reflected in the forward-looking statements will be achieved or will occur. Except as required by applicable law, we undertake no obligation to update or revise publicly any forward-looking statements, whether as a result of new information, future events or otherwise.
    • 3. Key Performance Indicators and Non-GAAP Measures This presentation contains key performance indicators including GMV, as well as non-GAAP measures, including Adjusted EBITDA and Free Cash Flow. “Gross Merchandise Volume” or “GMV” is defined as the gross total dollar value of orders reviewed through our ecommerce risk intelligence platform during the period indicated, including the value of orders that we did not approve “Billings” or “amounts billed” is defined as (1) gross amounts invoiced to our merchants and estimates for cancellations and service level agreements for transactions approved during the period plus (2) changes in estimates for cancellations and service level agreements for orders approved in prior periods. Billings excludes credits issued for chargebacks. Adjusted EBITDA, which is a non-GAAP measure of financial performance, is defined as net profit (loss) adjusted for items that we believe do not directly reflect our core operations such as depreciation and amortization (including amortization of capitalized internal-use software as presented in our statement of cash flows), share-based compensation expense, payroll taxes related to share-based compensation, legal-related and other expenses, restructuring costs, provision for (benefit from) income taxes, other income (expense) including foreign currency transaction gains and losses and gains and losses on non-designated hedges, and interest income (expense). Management believes that by excluding these items from net profit (loss), Adjusted EBITDA provides useful and meaningful supplemental information. Adjusted EBITDA is used to evaluate our business, measure our performance, identify trends affecting our business, formulate financial projections, develop annual budgets, and make strategic decisions. Adjusted EBITDA margin is calculated as Adjusted EBITDA divided by Revenue. Adjusted EBITDA should not be considered in isolation, as an alternative to, or superior to net profit (loss) or other performance measures derived in accordance with GAAP. This metric is frequently used by analysts, investors and other interested parties to evaluate companies in our industry. By providing Adjusted EBITDA, together with a reconciliation to the most comparable U.S. GAAP measure, we believe we are enhancing investors’ understanding of our business and our results of operations, as well as assisting investors in evaluating how well we are executing our strategic initiatives. Free Cash Flow is defined as net cash provided by (used in) operating activities less cash purchases of property and equipment. Free Cash Flow provides useful information to management and investors about the amount of cash generated by the business that can be used for strategic opportunities, including investing in our business and strengthening our balance sheet. Free Cash Flow is limited because it does not represent the residual cash flow available for discretionary expenditures. Free Cash Flow is not necessarily a measure of our ability to fund our cash needs. Use of non-GAAP measures should not be construed as an inference that our future results will be unaffected by unusual or other items. Non-GAAP measures of financial performance have limitations as analytical tools in that these measures do not reflect our cash expenditures, or future requirements for capital expenditures, or contractual commitments; these measures do not reflect changes in, or cash requirements for, our working capital needs; these measures do not reflect our tax expense or the cash requirements to pay our taxes, and assets being depreciated and amortized will often have to be replaced in the future and these measures do not reflect any cash requirements for such replacements. The non-GAAP measures used herein are not necessarily comparable to similarly titled captions of other companies due to different methods of calculation. We are not able to provide a reconciliation of forward-looking Adjusted EBITDA, Adjusted EBITDA margin, non-GAAP gross profit, or non-GAAP operating expense for the fiscal year ending December 31, 2025 to net profit (loss), gross profit, and total operating expenses, respectively, because certain items that are excluded from these non-GAAP metrics but included in the most directly comparable GAAP financial measures, cannot be predicted on a forward-looking basis without unreasonable effort or are not within our control. For example, we are unable to forecast the magnitude of foreign currency transaction gains or losses which are subject to many economic and other factors beyond our control. For the same reasons, we are unable to address the probable significance of the unavailable information, which could have a potentially unpredictable and significant impact on our future GAAP financial results. See Appendix and our Earnings Release issued on May 14, 2025 for reconciliations of these non-GAAP financial measure to the most directly comparable GAAP measures.
    • 4. Agenda Company Overview Financial Overview Appendix 01 02 03
    • 5. Company Overview 01
    • 6. Unleash your eCommerce Growth Leading ecommerce merchants trust Riskified to maximize revenue and profit with our AI-powered fraud management and risk intelligence platform.
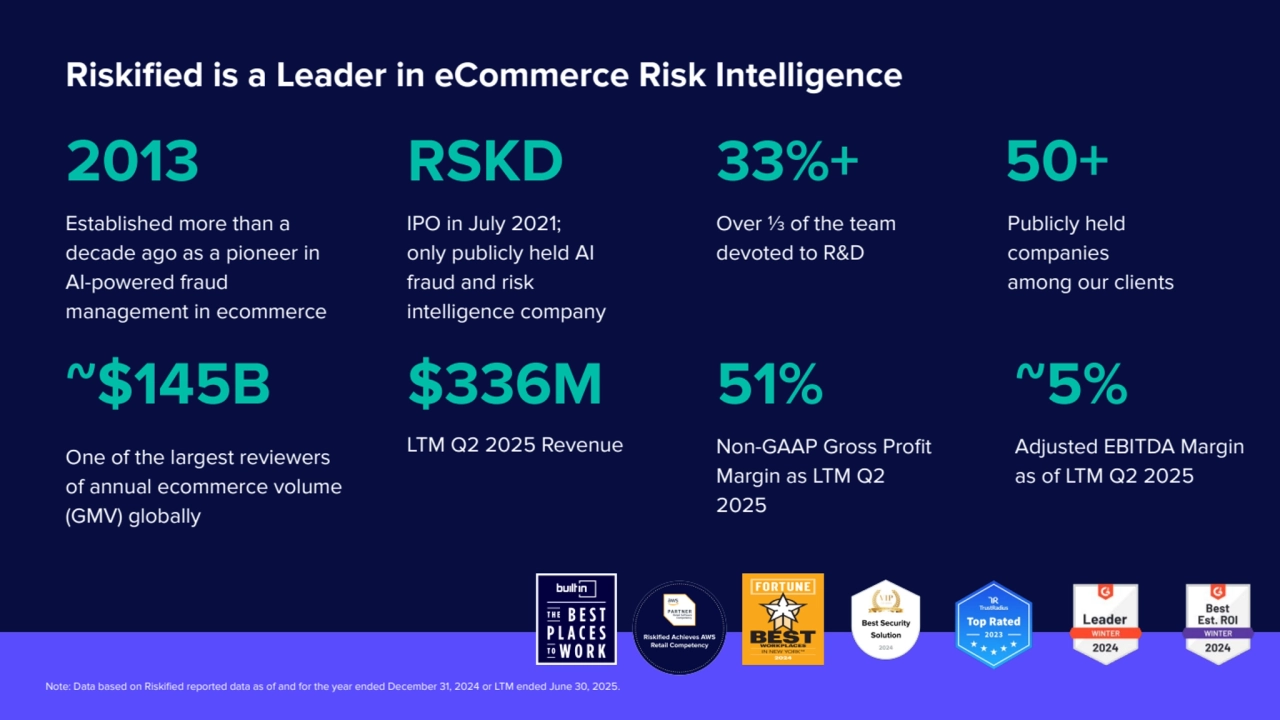
    • 7. Riskified is a Leader in eCommerce Risk Intelligence Established more than a decade ago as a pioneer in AI-powered fraud management in ecommerce 2013 IPO in July 2021; only publicly held AI fraud and risk intelligence company RSKD Over ⅓ of the team devoted to R&D 33%+ 50+ Publicly held companies among our clients $336M LTM Q2 2025 Revenue 51% Non-GAAP Gross Profit Margin as LTM Q2 2025 Adjusted EBITDA Margin as of LTM Q2 2025 One of the largest reviewers of annual ecommerce volume (GMV) globally ~$145B ~5% Note: Data based on Riskified reported data as of and for the year ended December 31, 2024 or LTM ended June 30, 2025.
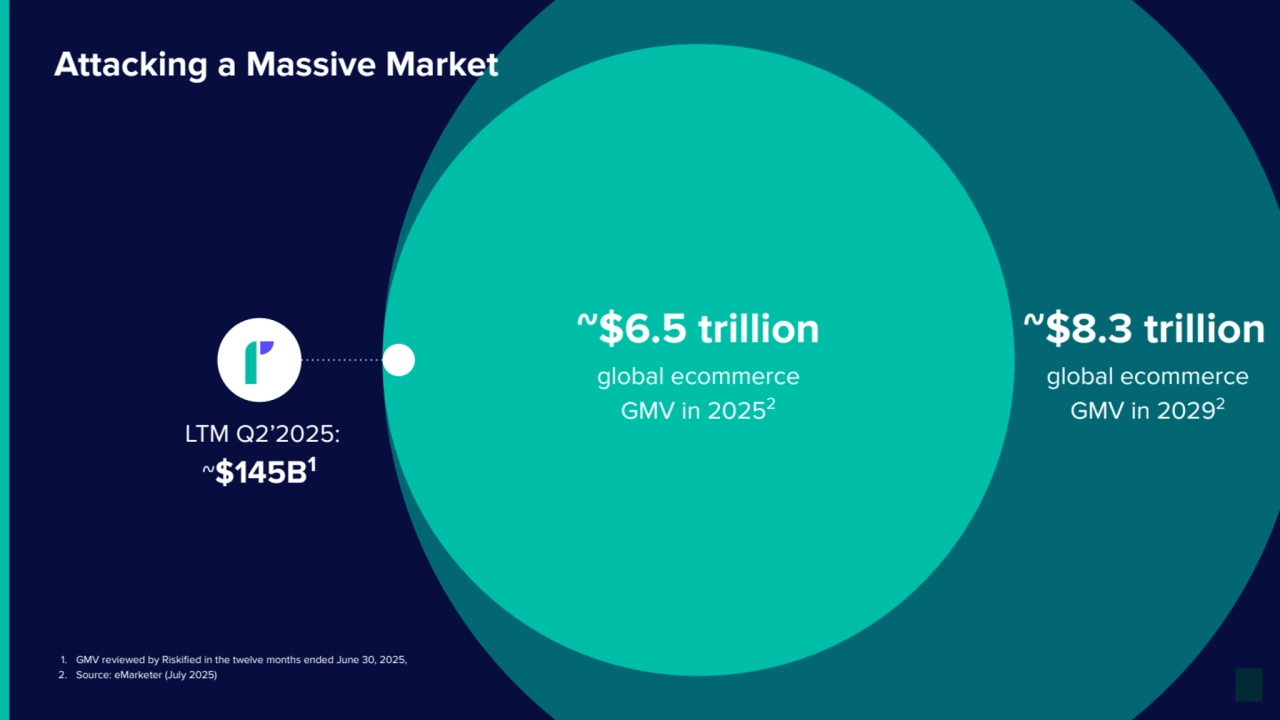
    • 8. 1. GMV reviewed by Riskified in the twelve months ended June 30, 2025, 2. Source: eMarketer (July 2025) LTM Q2’2025: ~$145B1 ~$8.3 trillion global ecommerce GMV in 20292 Attacking a Massive Market ~$6.5 trillion global ecommerce GMV in 20252
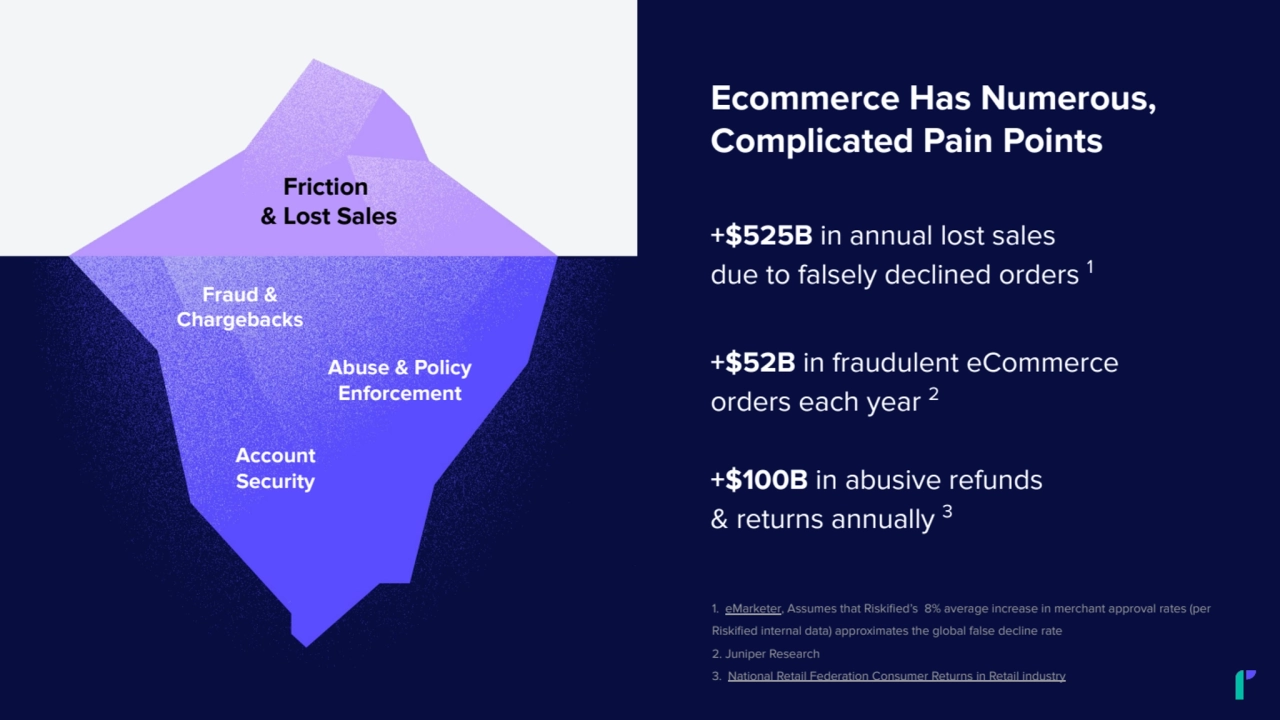
    • 9. +$525B in annual lost sales due to falsely declined orders 1 Friction & Lost Sales Fraud & Chargebacks Abuse & Policy Enforcement Account Security +$52B in fraudulent eCommerce orders each year 2 +$100B in abusive refunds & returns annually 3 1. eMarketer, Assumes that Riskified’s 8% average increase in merchant approval rates (per Riskified internal data) approximates the global false decline rate 2. Juniper Research 3. National Retail Federation Consumer Returns in Retail industry Ecommerce Has Numerous, Complicated Pain Points
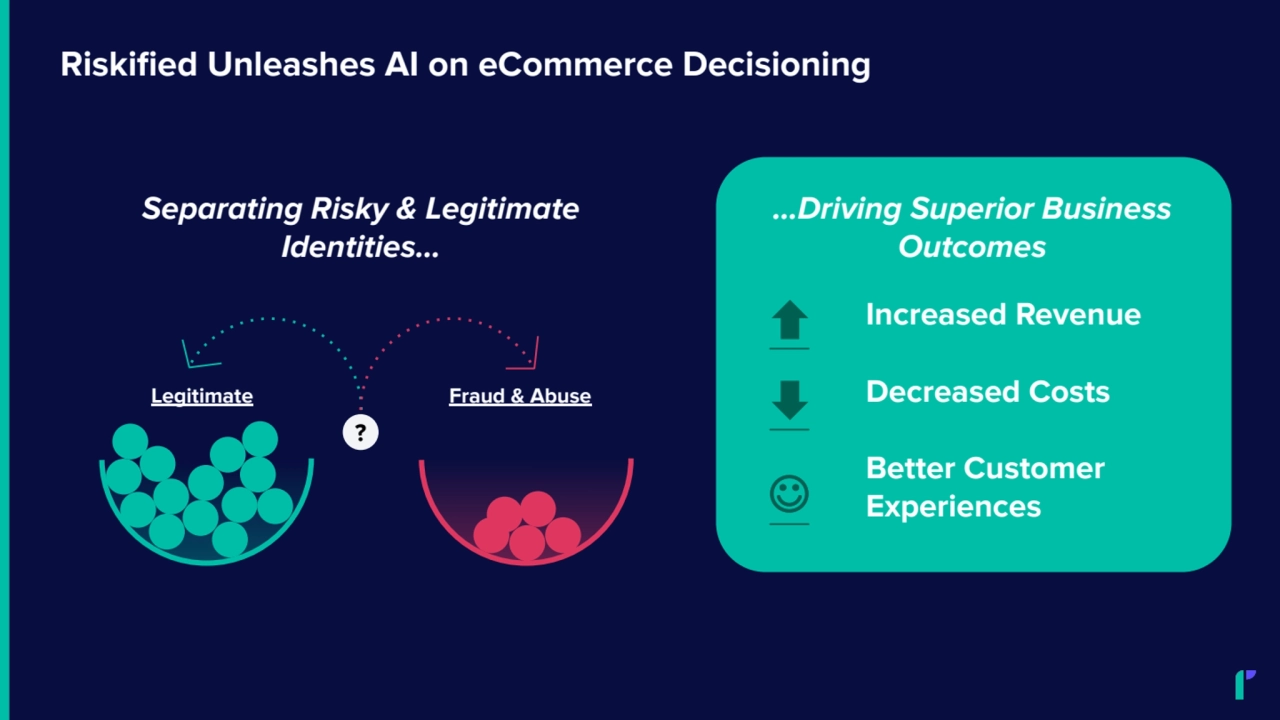
    • 10. Riskified Unleashes AI on eCommerce Decisioning Legitimate Fraud & Abuse ? Increased Revenue Decreased Costs Better Customer Experiences Separating Risky & Legitimate Identities… …Driving Superior Business Outcomes
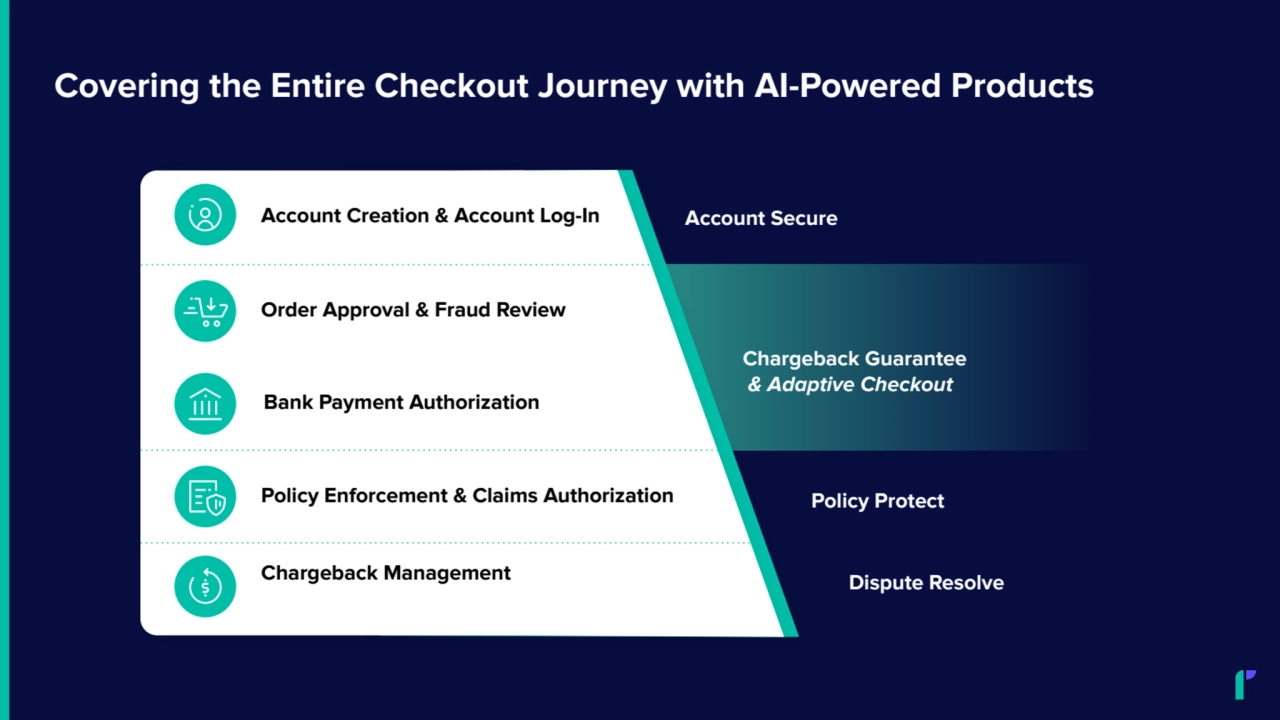
    • 11. Covering the Entire Checkout Journey with AI-Powered Products Account Creation & Account Log-In Order Approval & Fraud Review Bank Payment Authorization Policy Enforcement & Claims Authorization Chargeback Management Account Secure Chargeback Guarantee & Adaptive Checkout Dispute Resolve Policy Protect
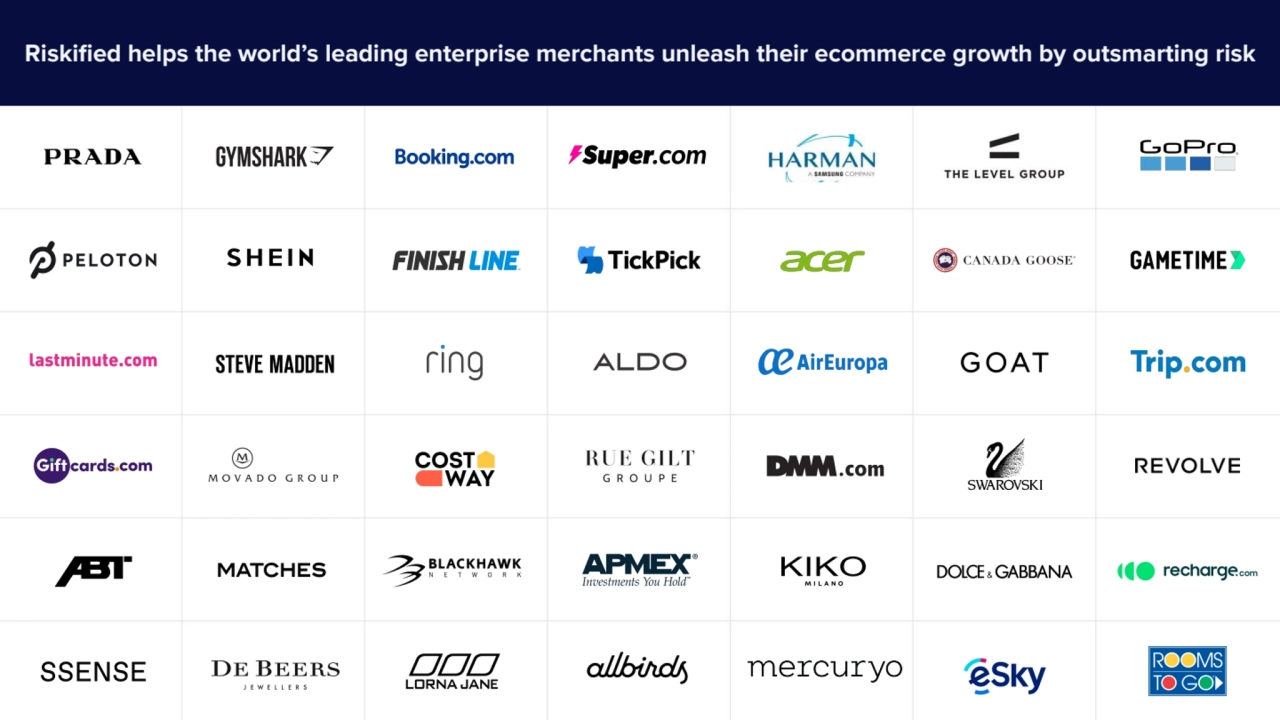
    • 12. Riskified helps the world’s leading enterprise merchants unleash their ecommerce growth by outsmarting risk
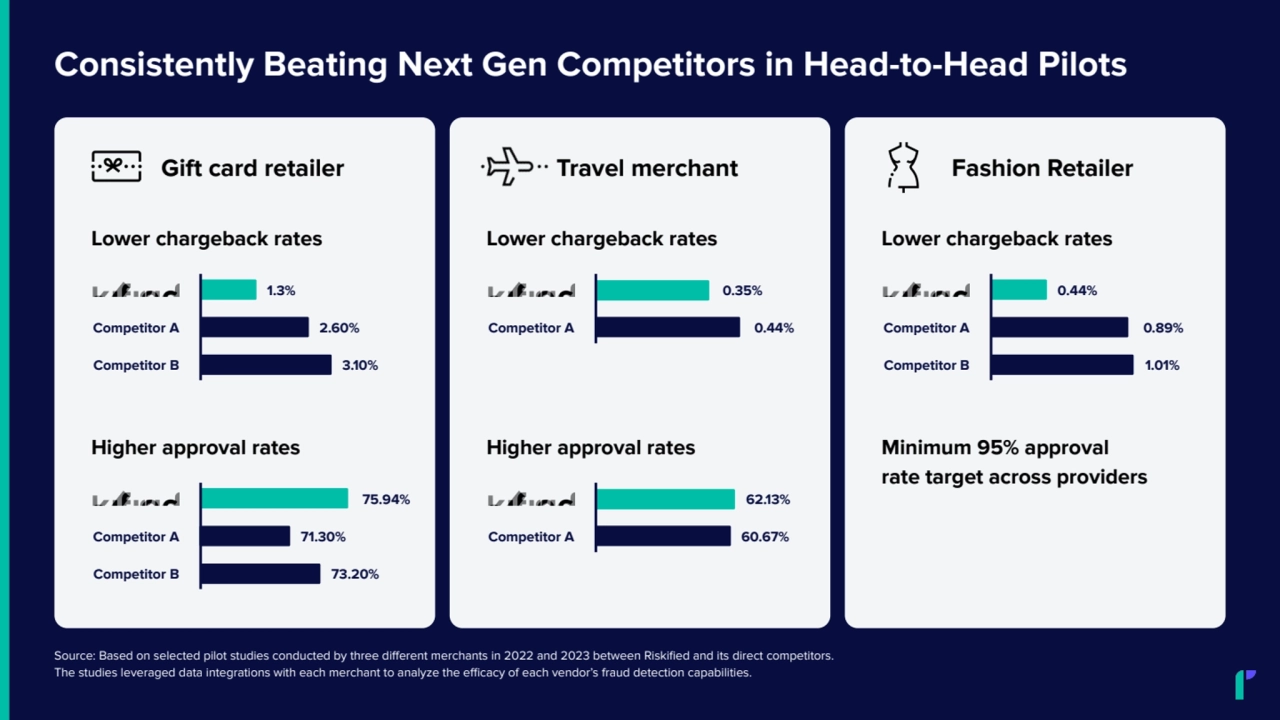
    • 13. Gift card retailer Lower chargeback rates 2.60% 1.3% Competitor A Competitor B 3.10% Higher approval rates 75.94% Competitor A Competitor B 71.30% 73.20% Travel merchant Lower chargeback rates 0.44% 0.35% Competitor A Higher approval rates 60.67% 62.13% Competitor A Fashion Retailer Lower chargeback rates 0.89% 0.44% Competitor A Competitor B 1.01% Minimum 95% approval rate target across providers Source: Based on selected pilot studies conducted by three different merchants in 2022 and 2023 between Riskified and its direct competitors. The studies leveraged data integrations with each merchant to analyze the efficacy of each vendor’s fraud detection capabilities. Consistently Beating Next Gen Competitors in Head-to-Head Pilots
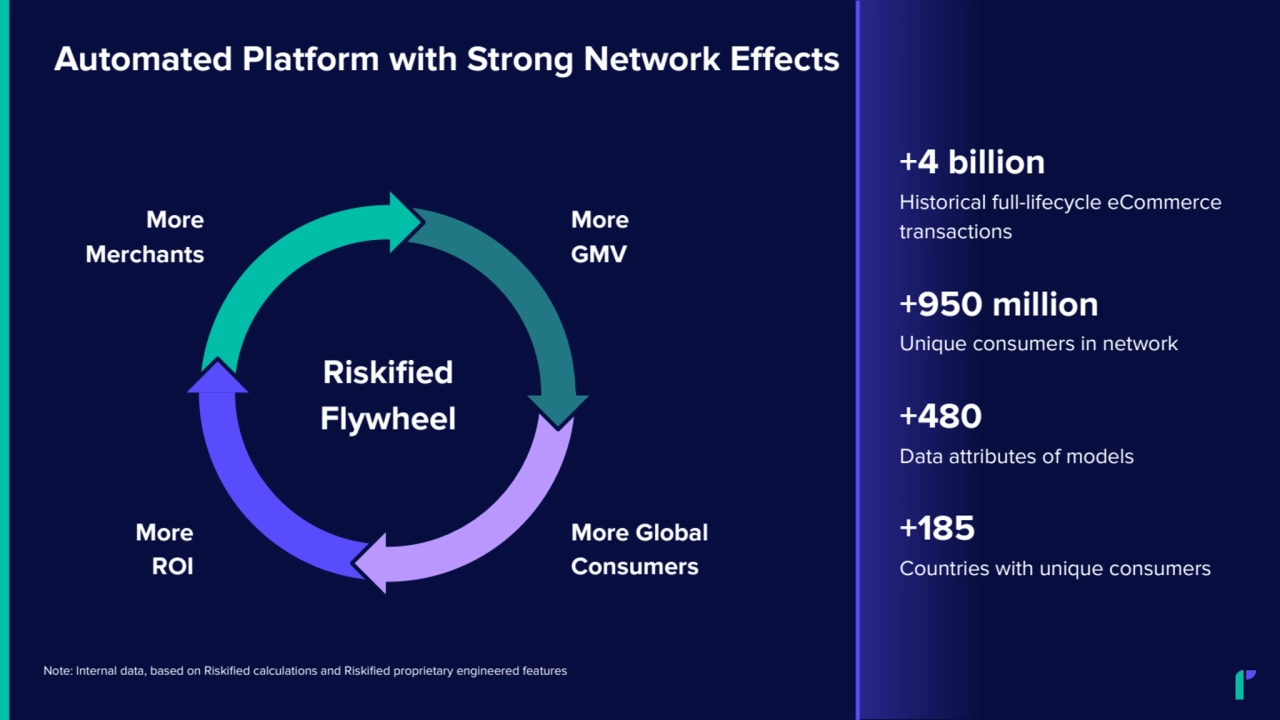
    • 14. Automated Platform with Strong Network Effects Note: Internal data, based on Riskified calculations and Riskified proprietary engineered features Riskified Flywheel More Merchants More GMV More ROI More Global Consumers +4 billion Historical full-lifecycle eCommerce transactions +950 million Unique consumers in network +185 Countries with unique consumers +480 Data attributes of models
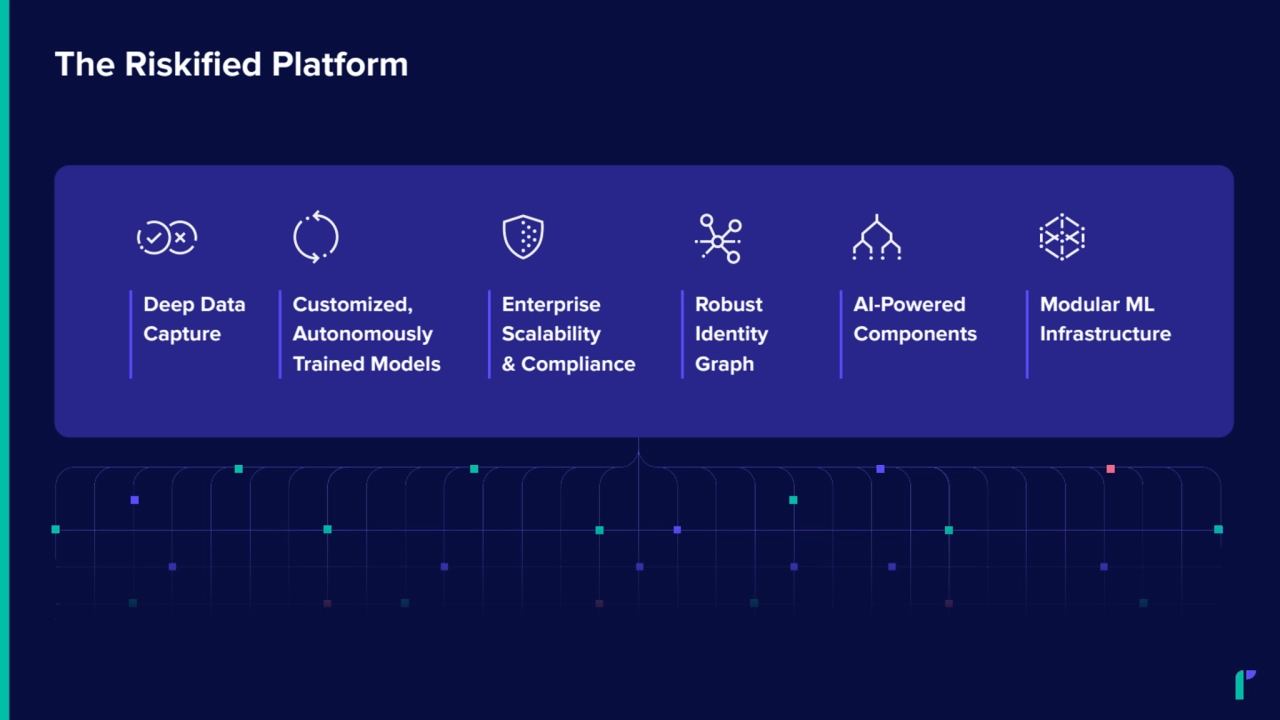
    • 15. The Riskified Platform Deep Data Capture Customized, Autonomously Trained Models Enterprise Scalability & Compliance Robust Identity Graph AI-Powered Components Modular ML Infrastructure
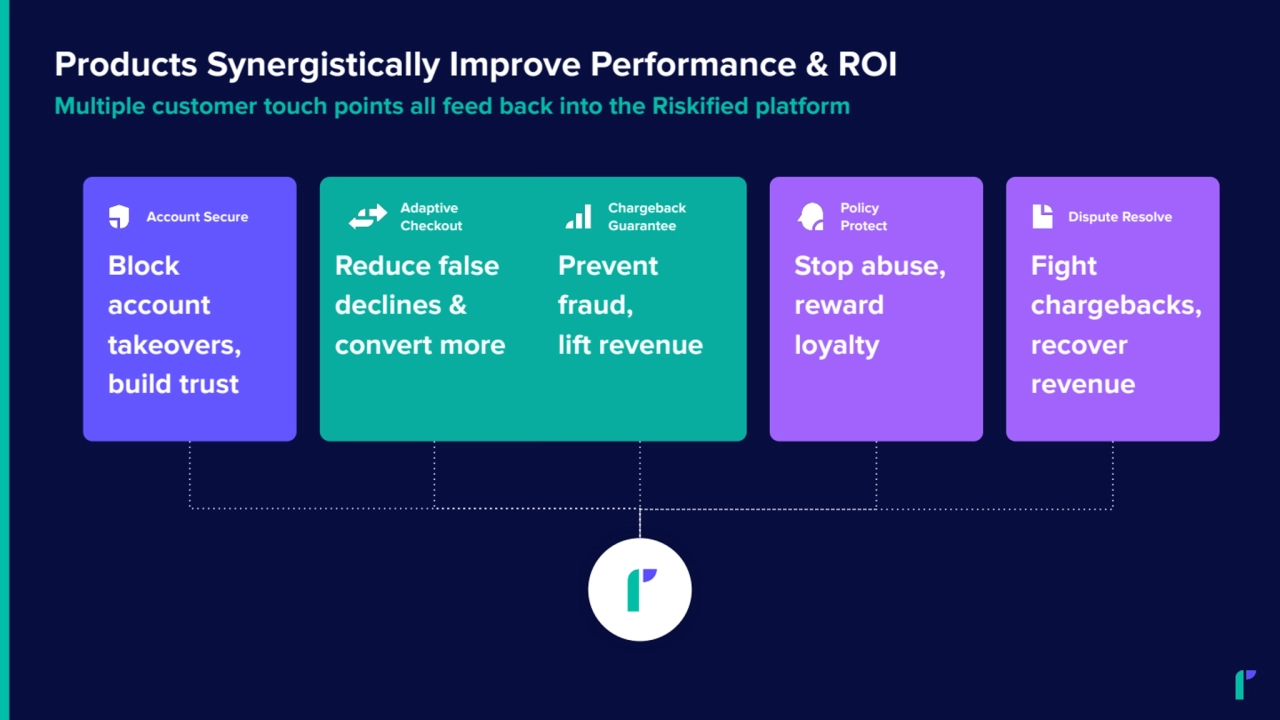
    • 16. Block account takeovers, build trust Account Secure Reduce false declines & convert more Adaptive Checkout Prevent fraud, lift revenue Chargeback Guarantee Stop abuse, reward loyalty Policy Protect Fight chargebacks, recover revenue Dispute Resolve Products Synergistically Improve Performance & ROI Multiple customer touch points all feed back into the Riskified platform
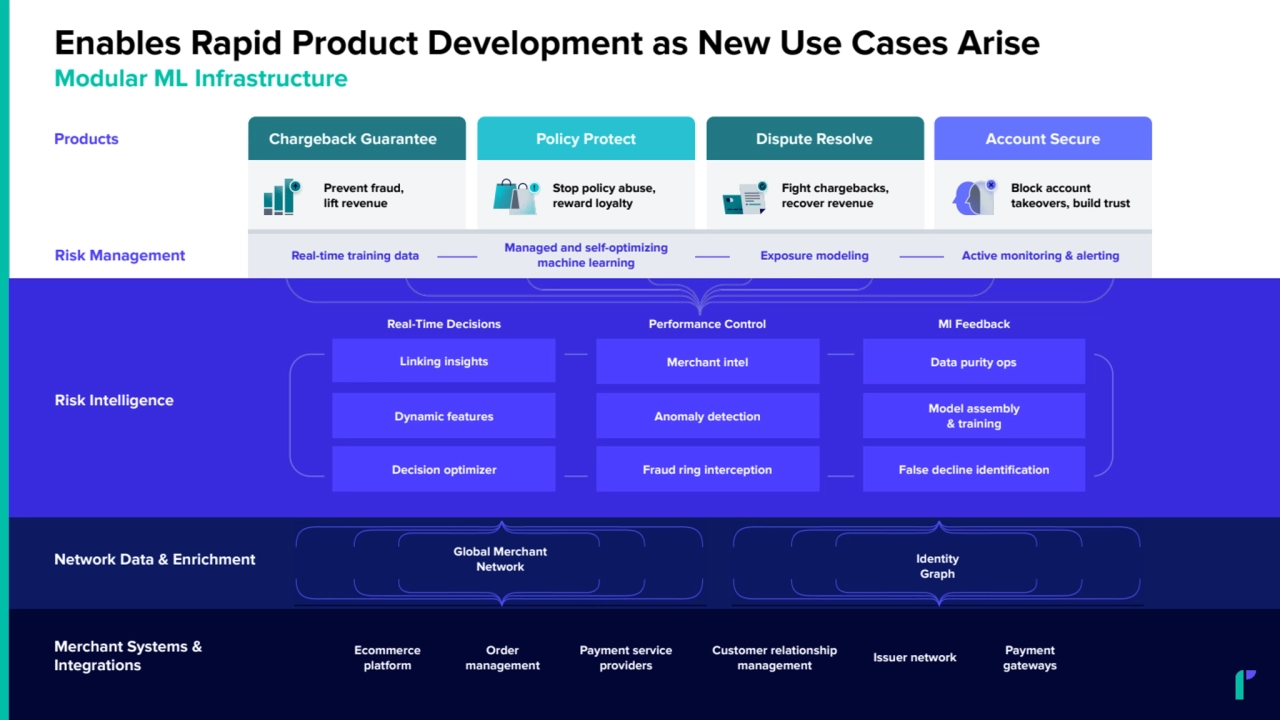
    • 17. Products Risk Intelligence Linking insights Real-Time Decisions Decision optimizer Model assembly & training Data purity ops False decline identification Ml Feedback Merchant intel Fraud ring interception Anomaly detection Performance Control Network Data & Enrichment Fight chargebacks, recover revenue Risk Management Block account takeovers, build trust Stop policy abuse, reward loyalty Prevent fraud, lift revenue Order management Payment service providers Customer relationship management Dynamic features Ecommerce platform Issuer network Payment gateways Chargeback Guarantee Policy Protect Dispute Resolve Account Secure Real-time training data Managed and self-optimizing machine learning Exposure modeling Active monitoring & alerting Enables Rapid Product Development as New Use Cases Arise Merchant Systems & Integrations Global Merchant Network Identity Graph Modular ML Infrastructure
    • 18. Win new merchants Grow with our merchants Land and expand New categories Platform Sale Geographic expansion Multiple Opportunities For Growth
    • 19. Financial Overview 02
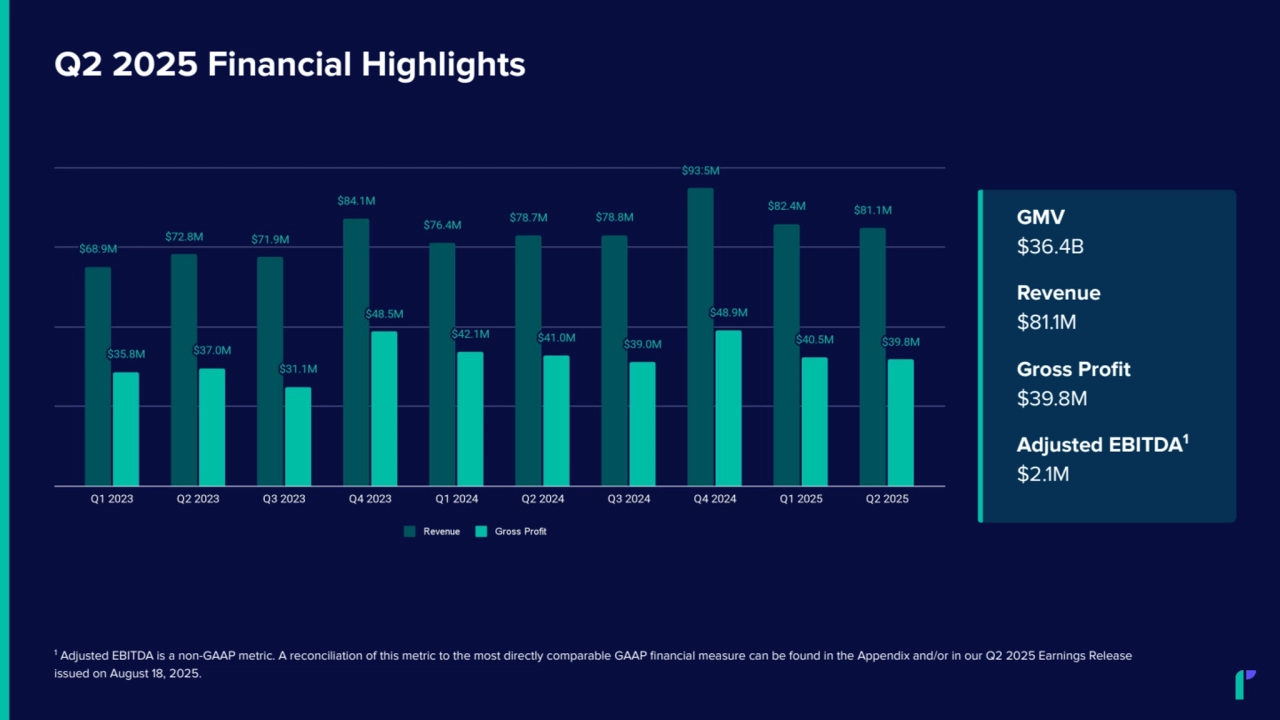
    • 20. GMV $36.4B Revenue $81.1M Gross Profit $39.8M Adjusted EBITDA1 $2.1M Q2 2025 Financial Highlights 1 Adjusted EBITDA is a non-GAAP metric. A reconciliation of this metric to the most directly comparable GAAP financial measure can be found in the Appendix and/or in our Q2 2025 Earnings Release issued on August 18, 2025.
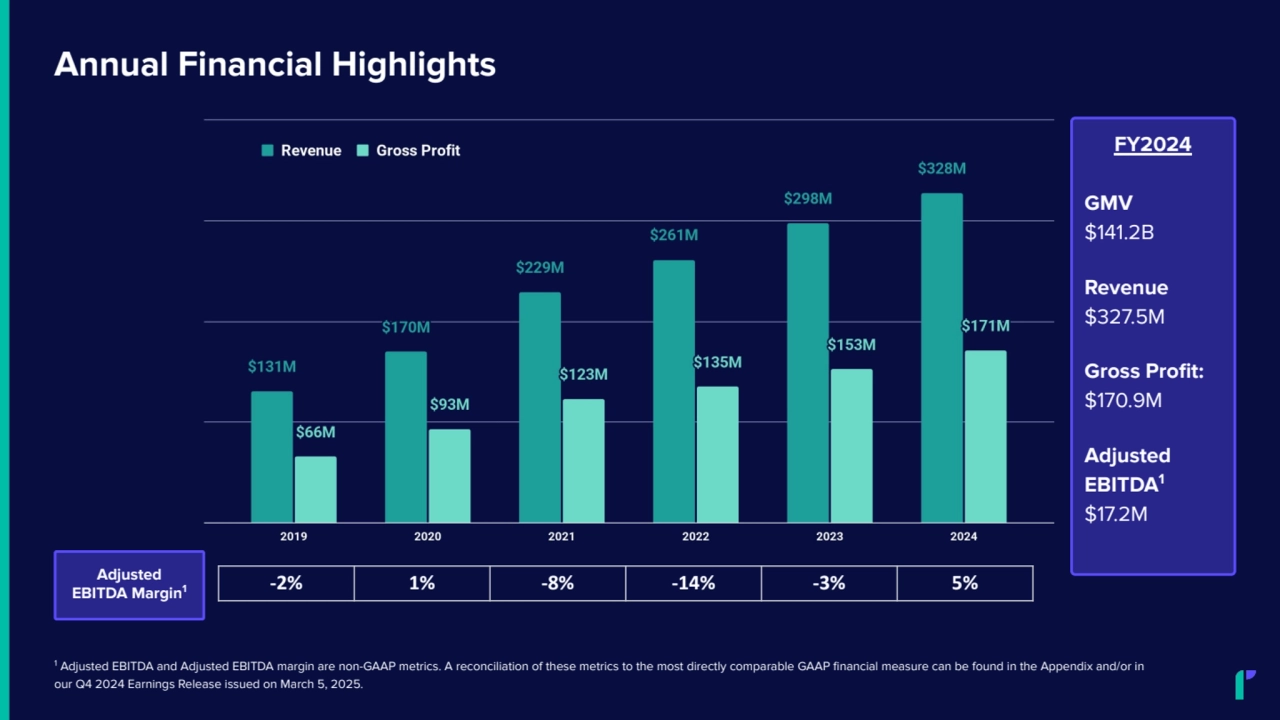
    • 21. FY2024 GMV $141.2B Revenue $327.5M Gross Profit: $170.9M Adjusted EBITDA1 $17.2M Annual Financial Highlights -2% 1% -8% -14% -3% 5% Adjusted EBITDA Margin1 1 Adjusted EBITDA and Adjusted EBITDA margin are non-GAAP metrics. A reconciliation of these metrics to the most directly comparable GAAP financial measure can be found in the Appendix and/or in our Q4 2024 Earnings Release issued on March 5, 2025.
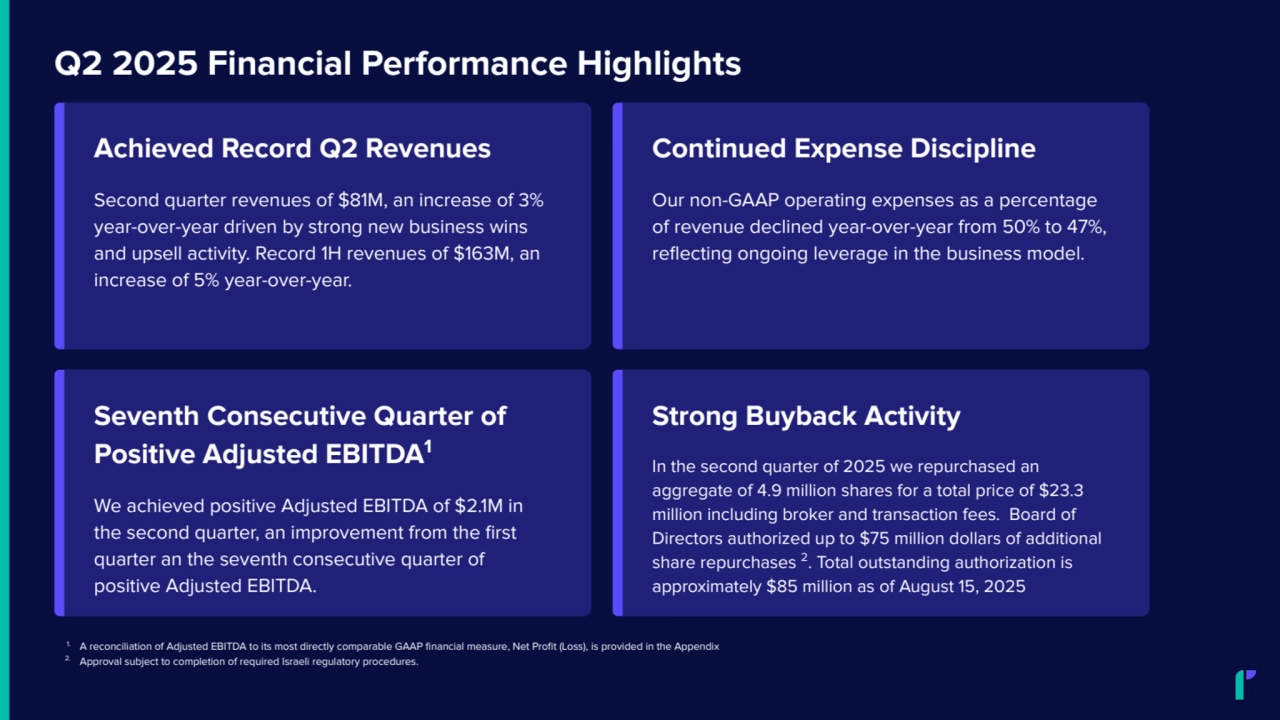
    • 22. Strong Buyback Activity In the second quarter of 2025 we repurchased an aggregate of 4.9 million shares for a total price of $23.3 million including broker and transaction fees. Board of Directors authorized up to $75 million dollars of additional share repurchases 2. Total outstanding authorization is approximately $85 million as of August 15, 2025 Q2 2025 Financial Performance Highlights Achieved Record Q2 Revenues Second quarter revenues of $81M, an increase of 3% year-over-year driven by strong new business wins and upsell activity. Record 1H revenues of $163M, an increase of 5% year-over-year. Continued Expense Discipline Our non-GAAP operating expenses as a percentage of revenue declined year-over-year from 50% to 47%, reflecting ongoing leverage in the business model. Seventh Consecutive Quarter of Positive Adjusted EBITDA1 We achieved positive Adjusted EBITDA of $2.1M in the second quarter, an improvement from the first quarter an the seventh consecutive quarter of positive Adjusted EBITDA. 1. A reconciliation of Adjusted EBITDA to its most directly comparable GAAP financial measure, Net Profit (Loss), is provided in the Appendix 2. Approval subject to completion of required Israeli regulatory procedures.
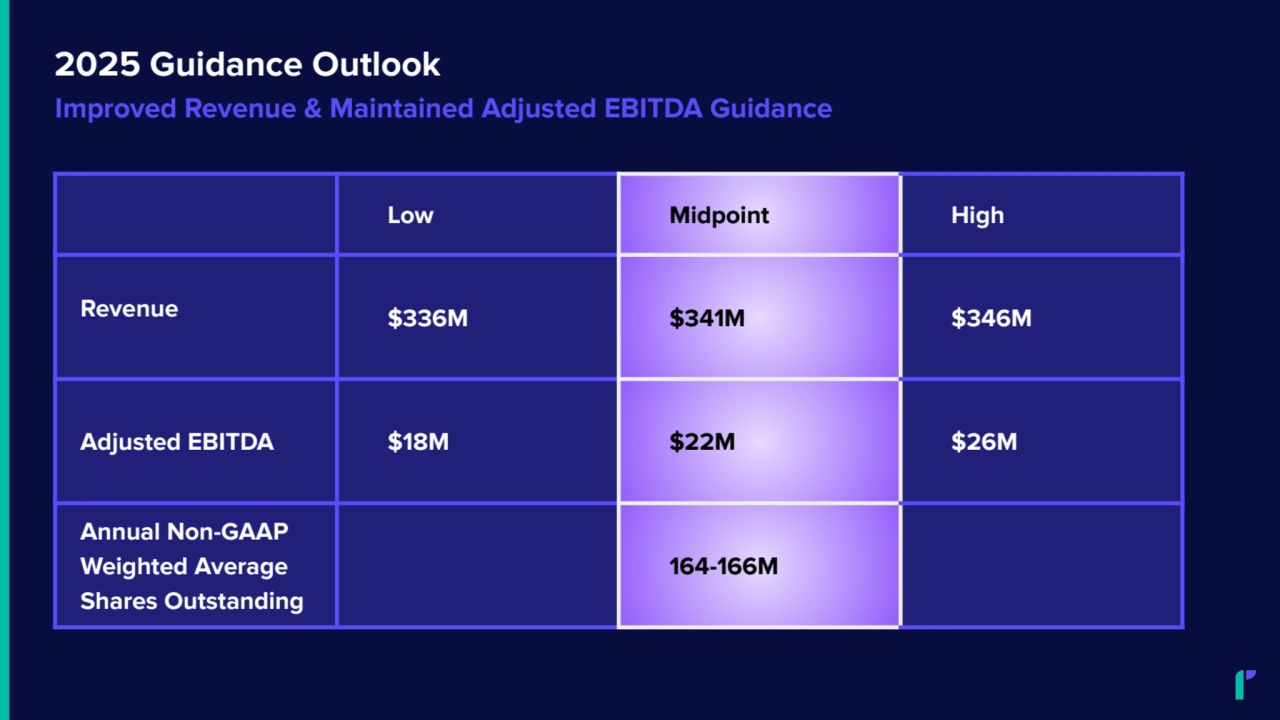
    • 23. Low Midpoint High Revenue $336M $341M $346M Adjusted EBITDA $18M $22M $26M Annual Non-GAAP Weighted Average Shares Outstanding 164-166M 2025 Guidance Outlook Improved Revenue & Maintained Adjusted EBITDA Guidance
    • 24. Q2 2025 Business Highlights Further Vertical and Geographic Diversification with the Addition of New Merchants We continued to have success landing new merchants on the Riskified platform, which in turn deepened our vertical and geographic reach. Our top ten new logos added during the second quarter represented wins in four verticals and all four geographies. Seven of our top ten new Chargeback Guarantee logos represented wins outside of the United States. Strengthened Leadership Position in Tickets and Live Events In our Ticketing and Live Events sub-vertical, we successfully upsold a large merchant by taking all of their remaining volume from a competitor. We believe that our strong performance in this category is driving a network flywheel effect, which is helping us to build a powerful competitive moat and deepen our expertise in the space. Multi-Product Go-Live with New Japanese Merchant Our top new logo won during the second quarter was with a key fashion retailer headquartered in Japan. We landed the account with multiple products upon contract signing, and we believe that our platform approach can unlock even further opportunities for growth in this region.
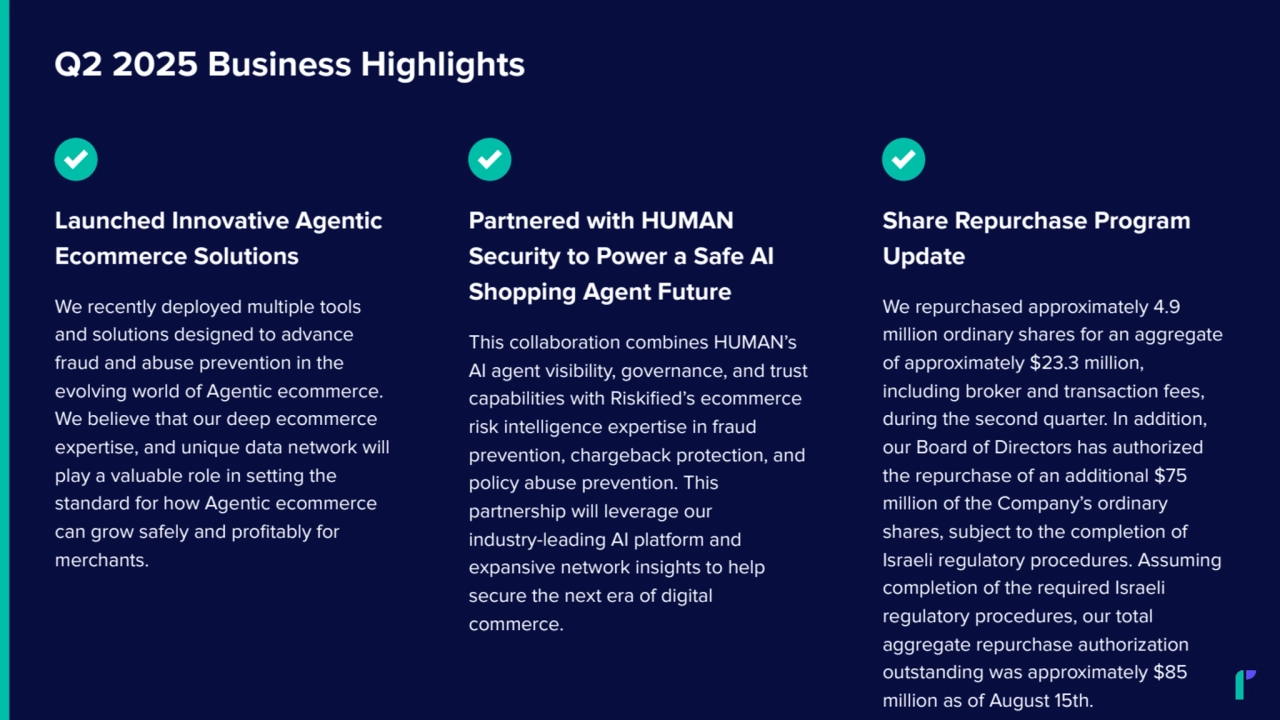
    • 25. Q2 2025 Business Highlights Launched Innovative Agentic Ecommerce Solutions We recently deployed multiple tools and solutions designed to advance fraud and abuse prevention in the evolving world of Agentic ecommerce. We believe that our deep ecommerce expertise, and unique data network will play a valuable role in setting the standard for how Agentic ecommerce can grow safely and profitably for merchants. Partnered with HUMAN Security to Power a Safe AI Shopping Agent Future This collaboration combines HUMAN’s AI agent visibility, governance, and trust capabilities with Riskified’s ecommerce risk intelligence expertise in fraud prevention, chargeback protection, and policy abuse prevention. This partnership will leverage our industry-leading AI platform and expansive network insights to help secure the next era of digital commerce. Share Repurchase Program Update We repurchased approximately 4.9 million ordinary shares for an aggregate of approximately $23.3 million, including broker and transaction fees, during the second quarter. In addition, our Board of Directors has authorized the repurchase of an additional $75 million of the Company’s ordinary shares, subject to the completion of Israeli regulatory procedures. Assuming completion of the required Israeli regulatory procedures, our total aggregate repurchase authorization outstanding was approximately $85 million as of August 15th.
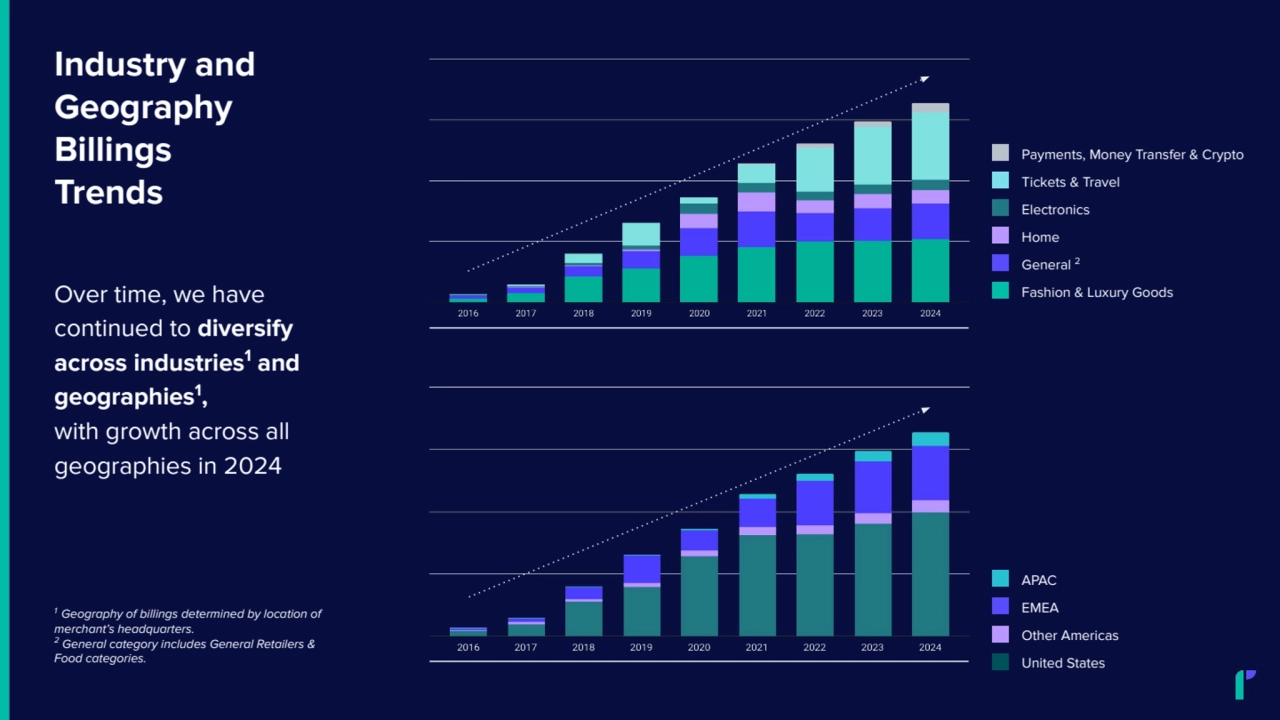
    • 26. Over time, we have continued to diversify across industries 1 and geographies 1 , with growth across all geographies in 2024 1 Geography of billings determined by location of merchant’s headquarters. 2 General category includes General Retailers & Food categories. Industry and Geography Billings Trends APAC EMEA Other Americas United States Payments, Money Transfer & Crypto Tickets & Travel Electronics Home General 2 Fashion & Luxury Goods
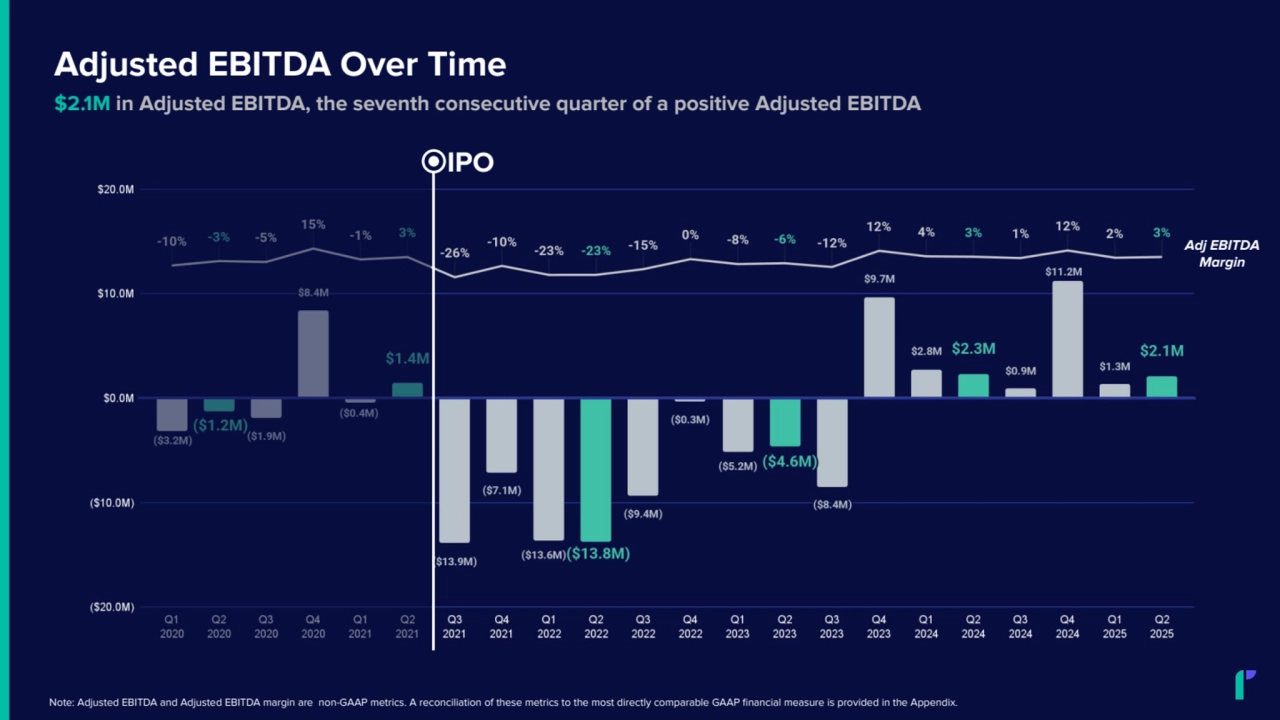
    • 27. Adjusted EBITDA Over Time $2.1M in Adjusted EBITDA, the seventh consecutive quarter of a positive Adjusted EBITDA Note: Adjusted EBITDA and Adjusted EBITDA margin are non-GAAP metrics. A reconciliation of these metrics to the most directly comparable GAAP financial measure is provided in the Appendix. Adj EBITDA Margin IPO
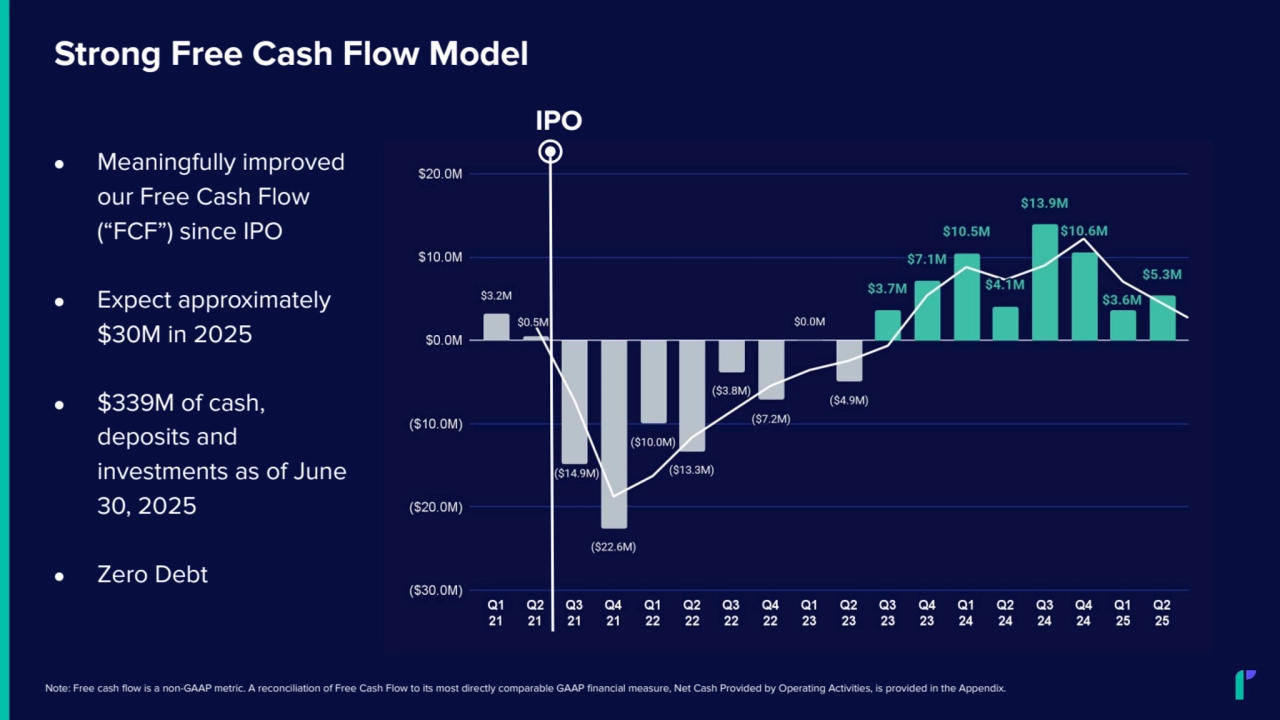
    • 28. Strong Free Cash Flow Model ● Meaningfully improved our Free Cash Flow (“FCF”) since IPO ● Expect approximately $30M in 2025 ● $339M of cash, deposits and investments as of June 30, 2025 ● Zero Debt IPO Note: Free cash flow is a non-GAAP metric. A reconciliation of Free Cash Flow to its most directly comparable GAAP financial measure, Net Cash Provided by Operating Activities, is provided in the Appendix.
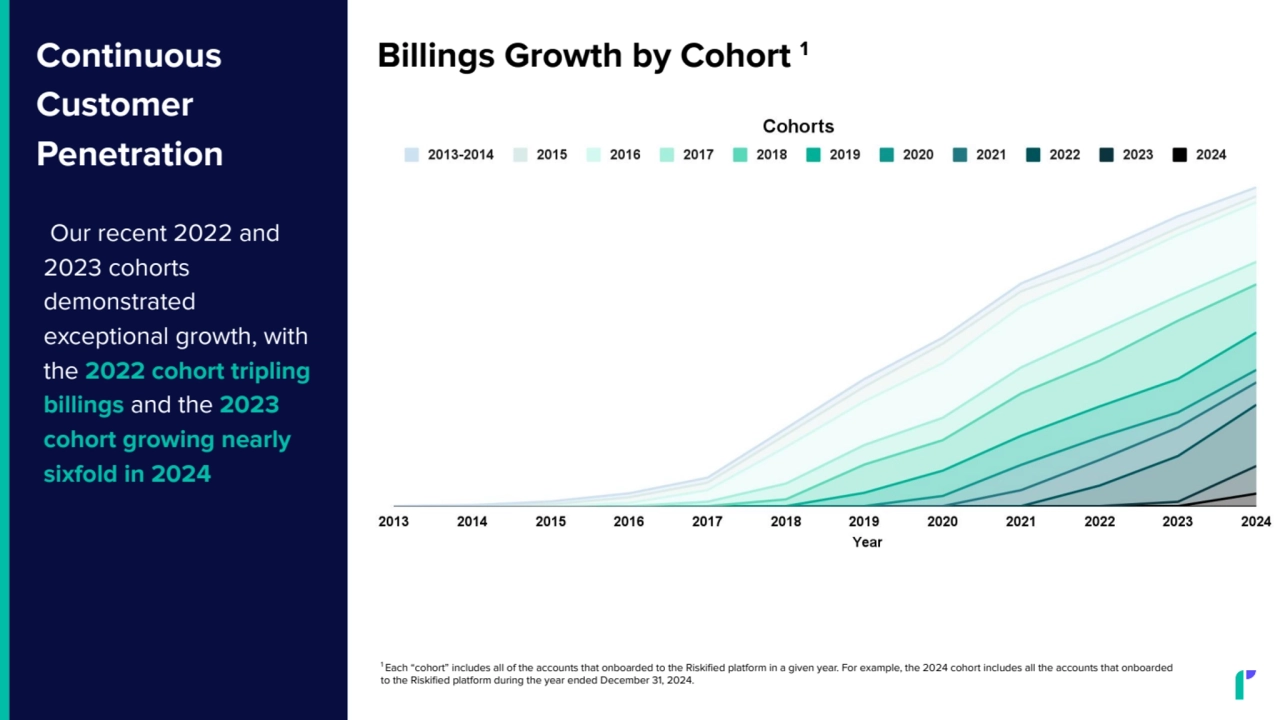
    • 29. Continuous Customer Penetration Our recent 2022 and 2023 cohorts demonstrated exceptional growth, with the 2022 cohort tripling billings and the 2023 cohort growing nearly sixfold in 2024 Billings Growth by Cohort 1 1 Each “cohort” includes all of the accounts that onboarded to the Riskified platform in a given year. For example, the 2024 cohort includes all the accounts that onboarded to the Riskified platform during the year ended December 31, 2024. 2 2
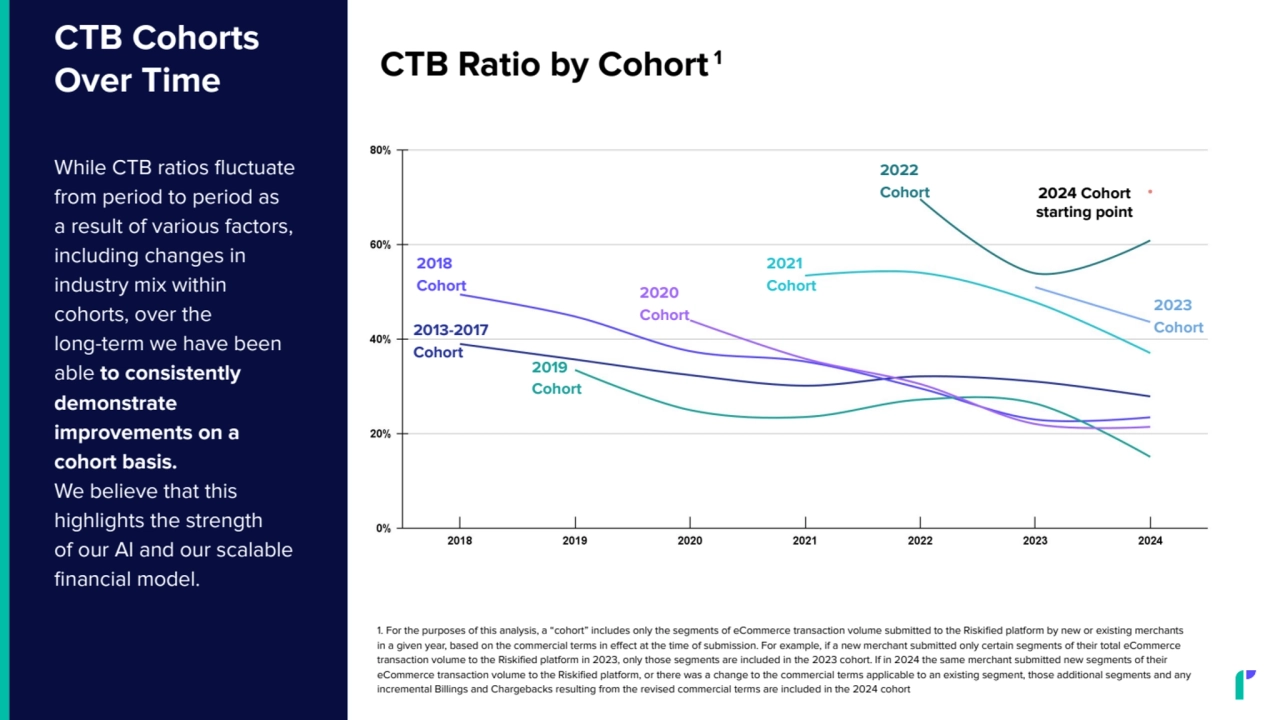
    • 30. CTB Cohorts Over Time While CTB ratios fluctuate from period to period as a result of various factors, including changes in industry mix within cohorts, over the long-term we have been able to consistently demonstrate improvements on a cohort basis. We believe that this highlights the strength of our AI and our scalable financial model. 2020 Cohort 1. For the purposes of this analysis, a “cohort” includes only the segments of eCommerce transaction volume submitted to the Riskified platform by new or existing merchants in a given year, based on the commercial terms in effect at the time of submission. For example, if a new merchant submitted only certain segments of their total eCommerce transaction volume to the Riskified platform in 2023, only those segments are included in the 2023 cohort. If in 2024 the same merchant submitted new segments of their eCommerce transaction volume to the Riskified platform, or there was a change to the commercial terms applicable to an existing segment, those additional segments and any incremental Billings and Chargebacks resulting from the revised commercial terms are included in the 2024 cohort CTB Ratio by Cohort 1 2022 Cohort 2023 Cohort 2021 Cohort 2018 Cohort 2020 Cohort 2013-2017 Cohort 2019 Cohort 2024 Cohort starting point
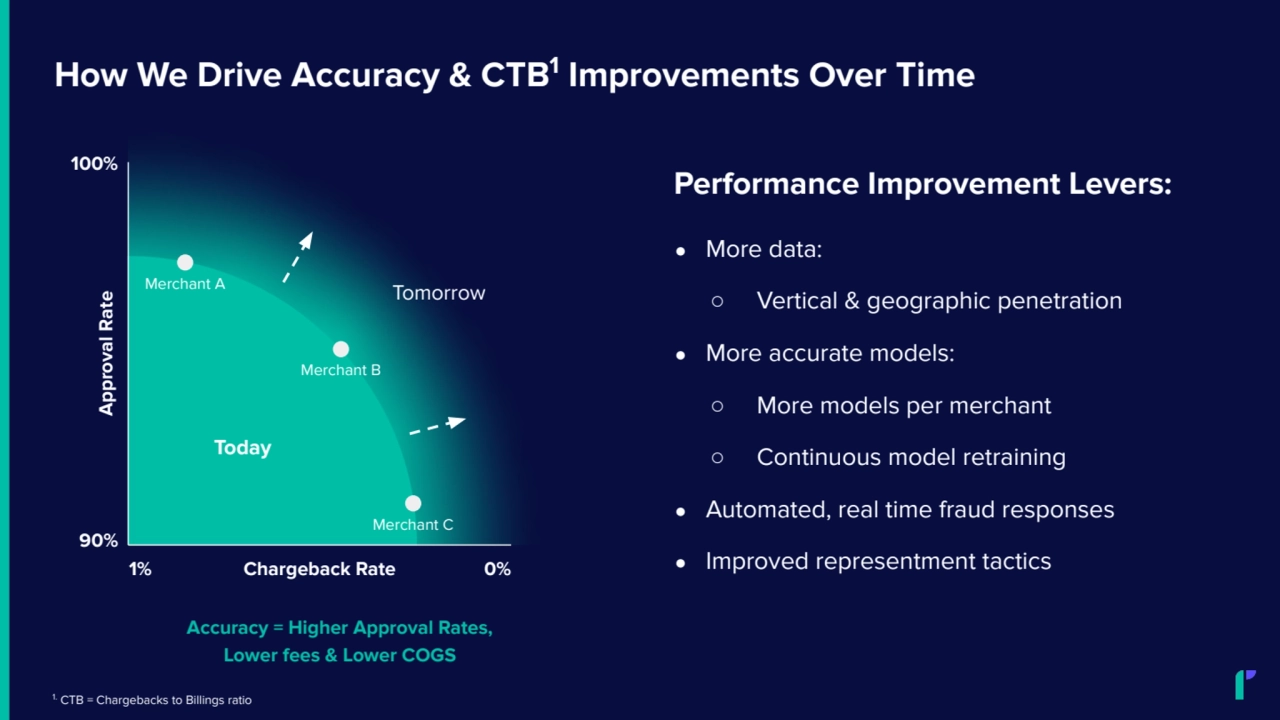
    • 31. ● More data: ○ Vertical & geographic penetration ● More accurate models: ○ More models per merchant ○ Continuous model retraining ● Automated, real time fraud responses ● Improved representment tactics How We Drive Accuracy & CTB1 Improvements Over Time Performance Improvement Levers: Today Tomorrow Merchant B Merchant A Merchant C Chargeback Rate Approval Rate 90% 100% 1% 0% Accuracy = Higher Approval Rates, Lower fees & Lower COGS 1. CTB = Chargebacks to Billings ratio
    • 32. Appendix 03
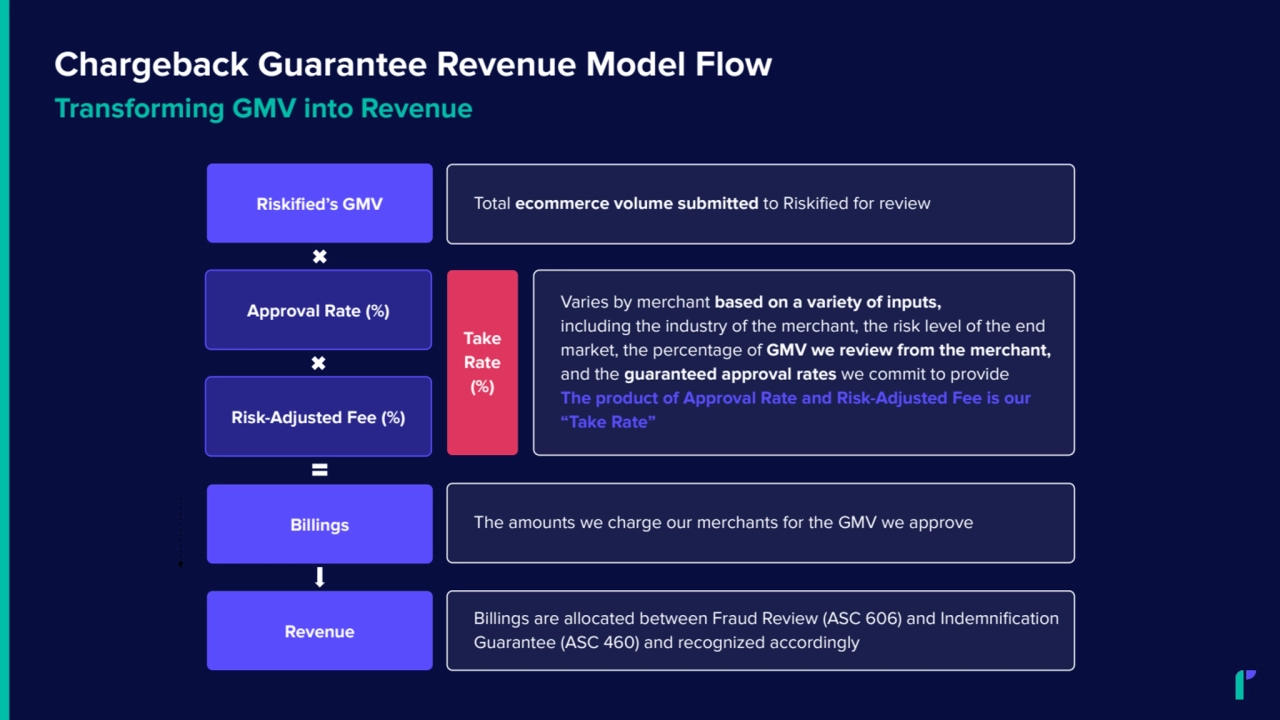
    • 33. Chargeback Guarantee Revenue Model Flow Total ecommerce volume submitted to Riskified for review Varies by merchant based on a variety of inputs, including the industry of the merchant, the risk level of the end market, the percentage of GMV we review from the merchant, and the guaranteed approval rates we commit to provide The product of Approval Rate and Risk-Adjusted Fee is our “Take Rate” The amounts we charge our merchants for the GMV we approve Billings are allocated between Fraud Review (ASC 606) and Indemnification Guarantee (ASC 460) and recognized accordingly Take Rate (%) Riskified’s GMV Approval Rate (%) Risk-Adjusted Fee (%) Billings Revenue Transforming GMV into Revenue
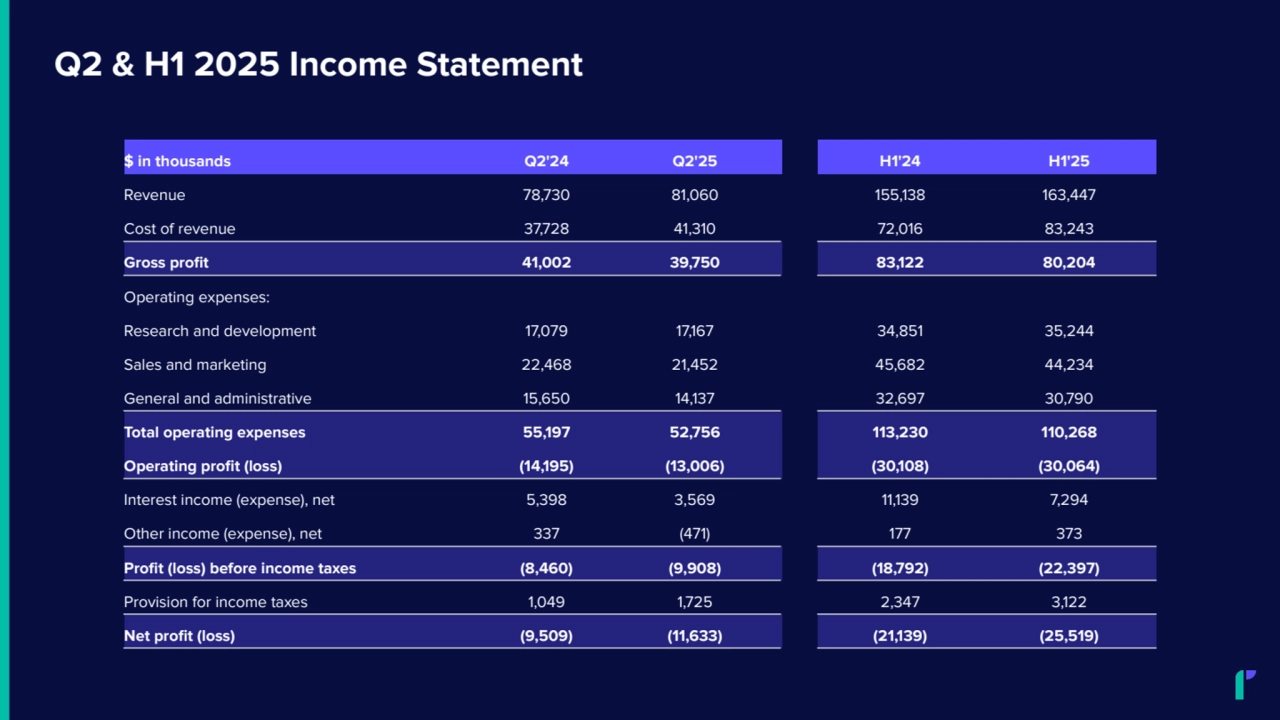
    • 34. $ in thousands Q2'24 Q2'25 H1'24 H1'25 Revenue 78,730 81,060 155,138 163,447 Cost of revenue 37,728 41,310 72,016 83,243 Gross profit 41,002 39,750 83,122 80,204 Operating expenses: Research and development 17,079 17,167 34,851 35,244 Sales and marketing 22,468 21,452 45,682 44,234 General and administrative 15,650 14,137 32,697 30,790 Total operating expenses 55,197 52,756 113,230 110,268 Operating profit (loss) (14,195) (13,006) (30,108) (30,064) Interest income (expense), net 5,398 3,569 11,139 7,294 Other income (expense), net 337 (471) 177 373 Profit (loss) before income taxes (8,460) (9,908) (18,792) (22,397) Provision for income taxes 1,049 1,725 2,347 3,122 Net profit (loss) (9,509) (11,633) (21,139) (25,519) Q2 & H1 2025 Income Statement
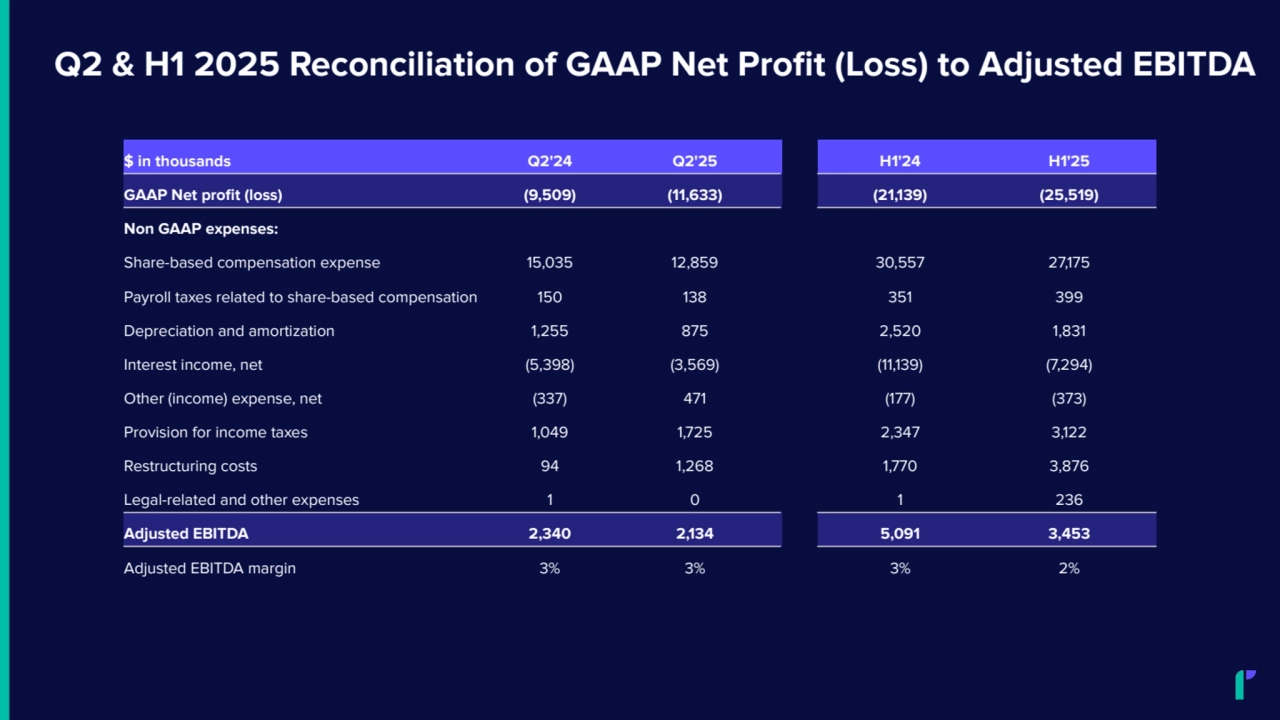
    • 35. Q2 & H1 2025 Reconciliation of GAAP Net Profit (Loss) to Adjusted EBITDA $ in thousands Q2'24 Q2'25 H1'24 H1'25 GAAP Net profit (loss) (9,509) (11,633) (21,139) (25,519) Non GAAP expenses: Share-based compensation expense 15,035 12,859 30,557 27,175 Payroll taxes related to share-based compensation 150 138 351 399 Depreciation and amortization 1,255 875 2,520 1,831 Interest income, net (5,398) (3,569) (11,139) (7,294) Other (income) expense, net (337) 471 (177) (373) Provision for income taxes 1,049 1,725 2,347 3,122 Restructuring costs 94 1,268 1,770 3,876 Legal-related and other expenses 1 0 1 236 Adjusted EBITDA 2,340 2,134 5,091 3,453 Adjusted EBITDA margin 3% 3% 3% 2%
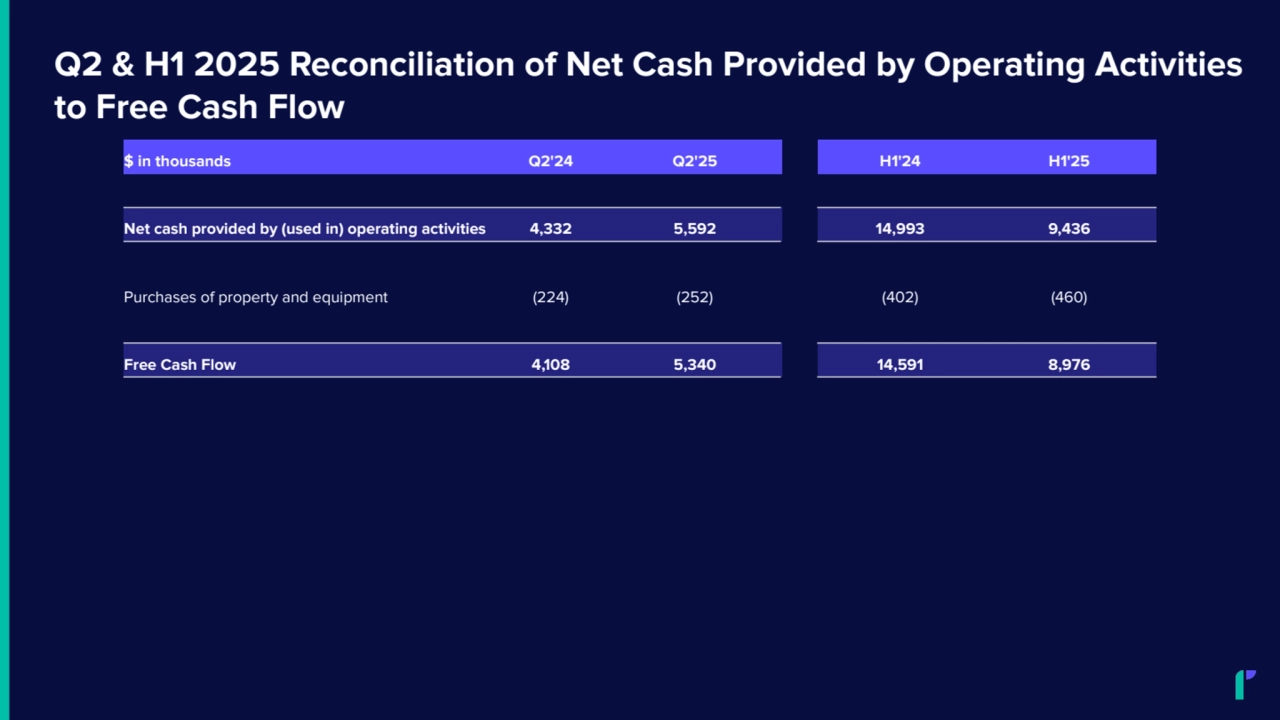
    • 36. Q2 & H1 2025 Reconciliation of Net Cash Provided by Operating Activities to Free Cash Flow $ in thousands Q2'24 Q2'25 H1'24 H1'25 Net cash provided by (used in) operating activities 4,332 5,592 14,993 9,436 Purchases of property and equipment (224) (252) (402) (460) Free Cash Flow 4,108 5,340 14,591 8,976
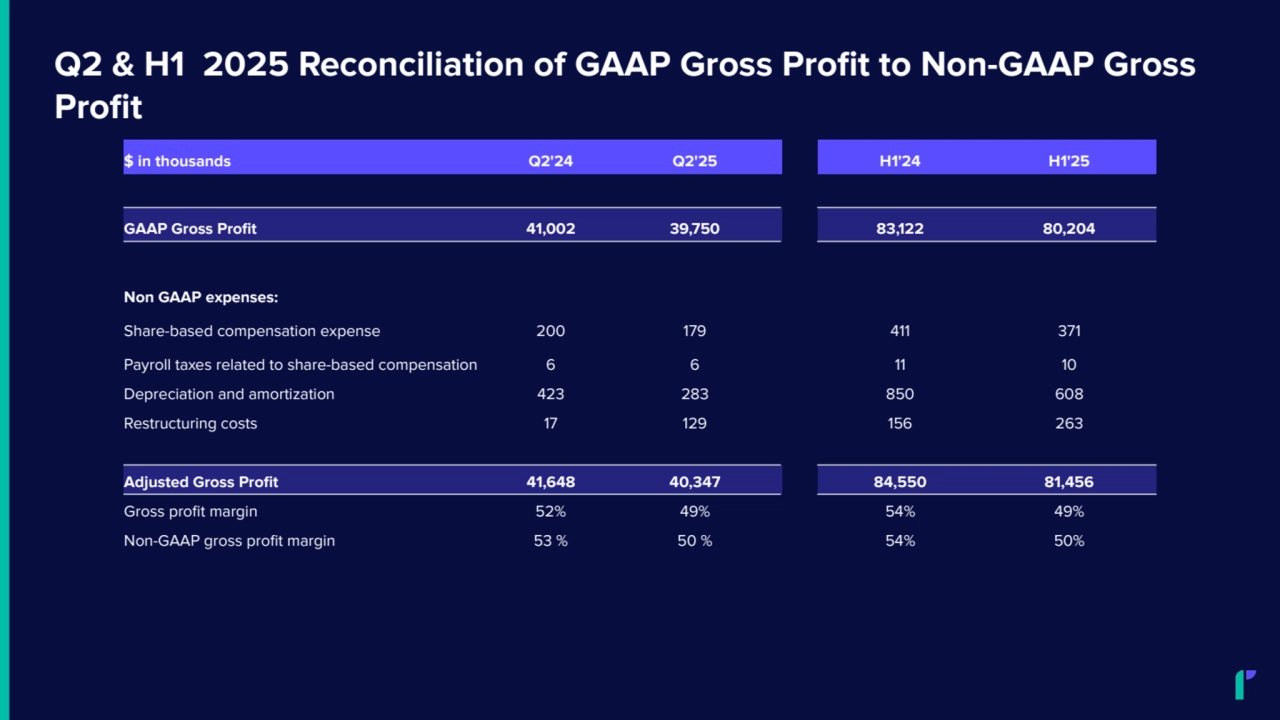
    • 37. Q2 & H1 2025 Reconciliation of GAAP Gross Profit to Non-GAAP Gross Profit $ in thousands Q2'24 Q2'25 H1'24 H1'25 GAAP Gross Profit 41,002 39,750 83,122 80,204 Non GAAP expenses: Share-based compensation expense 200 179 411 371 Payroll taxes related to share-based compensation 6 6 11 10 Depreciation and amortization 423 283 850 608 Restructuring costs 17 129 156 263 Adjusted Gross Profit 41,648 40,347 84,550 81,456 Gross profit margin 52% 49% 54% 49% Non-GAAP gross profit margin 53 % 50 % 54% 50%
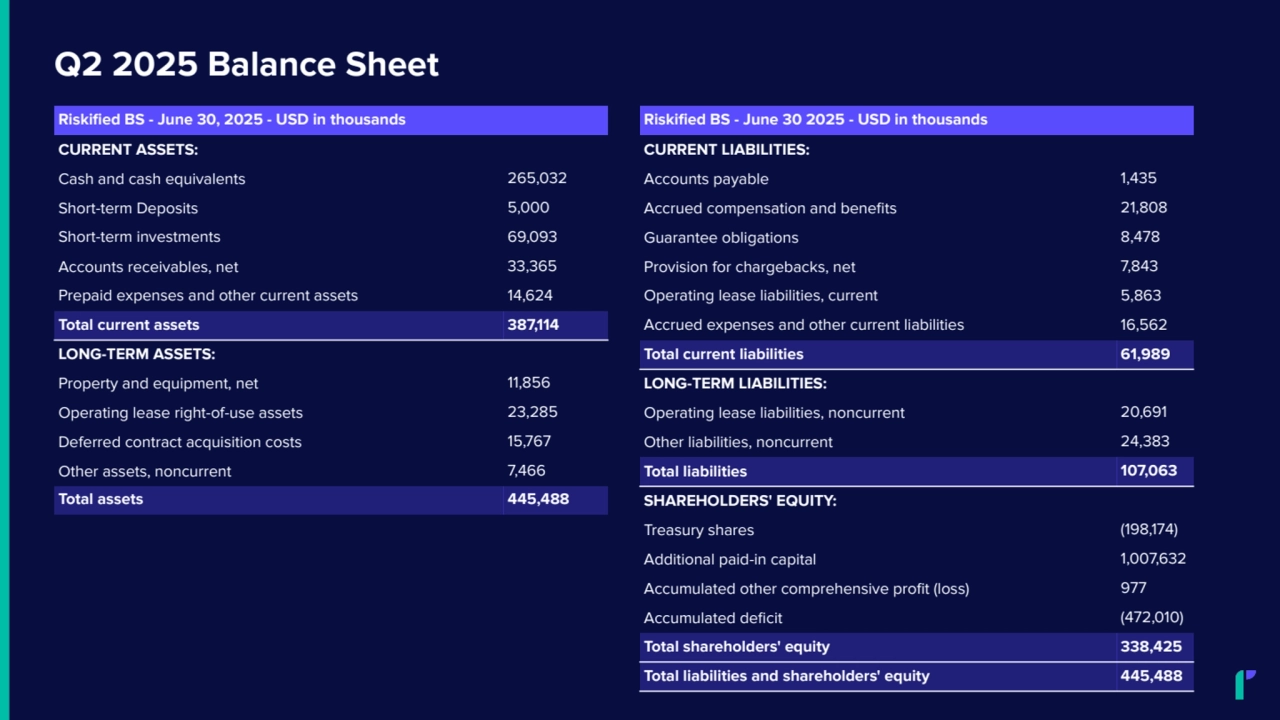
    • 38. Q2 2025 Balance Sheet Riskified BS - June 30, 2025 - USD in thousands CURRENT ASSETS: Cash and cash equivalents 265,032 Short-term Deposits 5,000 Short-term investments 69,093 Accounts receivables, net 33,365 Prepaid expenses and other current assets 14,624 Total current assets 387,114 LONG-TERM ASSETS: Property and equipment, net 11,856 Operating lease right-of-use assets 23,285 Deferred contract acquisition costs 15,767 Other assets, noncurrent 7,466 Total assets 445,488 Riskified BS - June 30 2025 - USD in thousands CURRENT LIABILITIES: Accounts payable 1,435 Accrued compensation and benefits 21,808 Guarantee obligations 8,478 Provision for chargebacks, net 7,843 Operating lease liabilities, current 5,863 Accrued expenses and other current liabilities 16,562 Total current liabilities 61,989 LONG-TERM LIABILITIES: Operating lease liabilities, noncurrent 20,691 Other liabilities, noncurrent 24,383 Total liabilities 107,063 SHAREHOLDERS' EQUITY: Treasury shares (198,174) Additional paid-in capital 1,007,632 Accumulated other comprehensive profit (loss) 977 Accumulated deficit (472,010) Total shareholders' equity 338,425 Total liabilities and shareholders' equity 445,488


    • Previous
    • Next
    • f Fullscreen
    • esc Exit Fullscreen